comprehensive tax reform in california: a contextual … asked them to refrain from considering...
TRANSCRIPT

Comprehensive Tax Reform
in California:
A Contextual Framework
June 2016
California State Controller Betty T. Yee
& the Controller’s Council of
Economic Advisors on Tax Reform

This page intentionally left blank.

A Message from California State Controller Betty T. Yee
T axes touch on almost every issue we face in California, from
funding education to filling potholes. Tax policy deeply affects the
state’s interaction with local governments and shapes important
perceptions about the business climate. In my public service career, I
have grappled with many aspects of tax policy. As chief deputy director
for budget with the California Department of Finance, I was responsible
for developing the state’s budget in a time of volatile revenue cycles. As
a member of the State Board of Equalization, I see how the complexity
of the tax code affects small businesses and other taxpayers. As the
state’s chief fiscal officer, I am responsible for managing cash flow with
continued revenue volatility.
Designed during the Great Depression, California’s tax structure is outdated, unfair, and unreliable.
It reflects economic patterns and demographics of the past. Newer economic sectors escape tax
obligations because the structure was created for an industrial manufacturing base. Upper-income
earners pay a substantially higher rate on personal income—a progressivity that, depending on the
analysis, either helps counter growing income inequality, distributes the tax burden too unevenly, or
produces unpredictability with episodic cuts to vital programs. Further punctuating these flaws,
Moody’s Investor Services in May 2016 ranked California as the state least able to withstand a
recession.
In 2015, I established a Council of Economic Advisors on Tax Reform to map the inadequacies of
the state’s tax system and focus on what it would take to implement truly comprehensive change. I
convened experts with perspectives from academia, research institutes, business, and local
government. I asked them to refrain from considering expenditure proposals (“spending side”
reform) or reaching consensus on specific recommendations. As the work evolved, I realized it
merited a broader audience.
The following framework incorporates the diverse and sometimes conflicting insights of my
Council. Pulling together the puzzling patchwork of tax policy, we show that reform must go
beyond discussion of rates. Whether Council members are concerned about the business climate,
income disparity, or funding for infrastructure, housing, and transportation, most agree tax reform at
its core must facilitate job creation and economic health. Further, the state-local relationship must
be an integral part of comprehensive tax reform.
I am deeply grateful for the care and time that the Council members generously invested in this
complex and occasionally frustrating effort. Many thanks to my staff and staff at the California
State Library, California Board of Equalization, and California Franchise Tax Board for providing
support; and to Deputy Controller John Decker for developing this framework.
i

ii
Our broken tax system is a common conversation topic, yet comprehensive reform has been elusive
and politically unpalatable. Resurgent revenues after the Great Recession have lulled many into
complacency about the need to prepare for future economic downturns. However, look closely and
the signals are there: California’s economic outlook is dimming and operating deficits are at risk of
growing. Even if the state could weather the next downturn with new revenue and budget cuts,
fiscal imbalance will persist until we dig deep into structural changes.
As the state official responsible for paying California’s bills each month, I know we can’t afford not
to consider a better way to plan ahead. I urge leaders in local government, economic development,
the business community, education, and others to join me in pushing for tax reform that facilitates
business development and growth, supports local and regional public services, and expands our
state’s capacity to take on the challenges of growing income disparity, lack of affordable housing,
climate change, and more.
The time for comprehensive tax reform is now. No more kicking the can down the road.

A Message from the Controller’s
Council of Economic Advisors on Tax Reform
T ax policy is one of the most common concerns for California’s policymakers. According to the
California State Library, the Legislature considered 4,600 tax proposals in the past two
decades—an average of about 245 per year. About half would have changed the personal income
tax. Another one-third would have adjusted either the sales tax or the property tax. (See Appendix I
on page 39 for the history of recent tax changes prepared by the State Library.)
Few proposals were intended to achieve comprehensive reform. For the most part, they were
directed at a single tax or group of taxpayers. Sometimes the proposals merely adjusted tax rates.
Major increases, though rare, were often designed to be temporary, while tax cuts were conditioned
on the state’s fiscal health.
It appears that fiscal necessity, rather than overarching policy considerations, prompted most recent
major tax changes. In fact, during the nearly 40 years since California voters approved Proposition
13 to limit property tax rates, policymakers adopted incremental adjustments to each of the major
taxes, but no comprehensive change to the state’s tax structure. To be fair, comprehensive tax
change is difficult. During the same 40-year period, the U.S. Congress focused on systemic reform
just once, when it simplified the tax code, broadened the tax base, and eliminated many tax shelters
in the 1986 Tax Reform Act.
Many believe the current tax system does not serve California as well as it might, and that a review
of the entire structure is long overdue. Post-Proposition 13 revenues from the sales and use tax, the
corporation tax, and the property tax have diminished. This has increased California’s dependence
on the personal income tax. The increasing volatility of the state’s economy (and the stock market)
has translated into greater unpredictability of state tax revenue, presenting challenges for budget
forecasts.
Some call for the quick technical fix of reducing income tax on the wealthy to soften the impact of
market throes on state revenues. Others contend we should take into account economic cycles by
building greater cash reserves when the economy is growing to better weather the inevitable
downturns. Like policymakers and California taxpayers, our Council has a range of sometimes
contradictory opinions about the best course.
We thank State Controller Betty Yee and her staff for convening our Council and compiling
contextual economic and fiscal information. Understanding tax policy changes cannot by itself
address all our concerns about state finances. We must start a broader discussion about the tax
structure as a necessary area of reform for improving fiscal management and encouraging economic
vitality. We hope the following pages provide useful information to explore the implications of
comprehensive change.
iii

iv
Dr. Alan Auerbach
Professor of Economics and Law at UC Berkeley,
and Director of Robert D. Burch Center for Tax Policy and Public Finance
Dr. I. Angelov Farooq
Director of Center for Economic Development and Innovation at UC Riverside,
and Partner at The Omnius Group
David Gamage
Assistant Professor of Law at UC Berkeley
Ruben Gonzalez
Senior Advisor for Strategic Affairs at Los Angeles Area Chamber of Commerce
Tracey Grose
Former Vice President of Bay Area Council Economic Institute
Jennifer Ito
Project Manager at University of Southern California Program
for Environmental and Regional Equity
Larry Kosmont
Founding CEO of Kosmont Companies,
and Advocacy Co-Chair at BizFed
Tracy Hernandez
Founding CEO of BizFed
Kim Rueben
Senior Fellow at Urban-Brookings Tax Policy Center,
and Affiliated Scholar at Public Policy Institute of California
Kim Walesh
Director of Economic Development and Deputy City Manager for City of San Jose

Table of Contents
A Message from California State Controller Betty T. Yee . . . . . . . . . . . . . . . . . . . . . . . . . . . . . .
A Message from the Controller’s Council of Economic Advisors on Tax Reform . . . . . . . . . . . . . . . . .
Chapter 1: Improving Fiscal Management . . . . . . . . . . . . . . . . . . . . . . . . . . . . . . . . . . . . . .
Chapter 2: Here and Now: the Current Tax System . . . . . . . . . . . . . . . . . . . . . . . . . . . . . . . . .
Chapter 3: What If…? The Effects of Two Legislative Proposals as Components of Tax Reform . . . . . . . .
Chapter 4: From Gold to Silicon: California’s Economy and Tax Structure . . . . . . . . . . . . . . . . . . . .
Chapter 5: Other Issues at Stake . . . . . . . . . . . . . . . . . . . . . . . . . . . . . . . . . . . . . . . . . . .
Chapter 6: Time for Change . . . . . . . . . . . . . . . . . . . . . . . . . . . . . . . . . . . . . . . . . . . . . .
Appendix I: A Brief History of Major Tax Changes in California, 1979-2015 . . . . . . . . . . . . . . . . . . .
Appendix II: The State’s Evolving Tax Structure . . . . . . . . . . . . . . . . . . . . . . . . . . . . . . . . . . .
Appendix III: Sales Tax on Services, by Industry, Activity (Employer Paid) . . . . . . . . . . . . . . . . . . . .
Appendix IV: Top 10 Tax Expenditures: Personal Income, Corporation, and Sales and Use . . . . . . . . . .
Endnotes . . . . . . . . . . . . . . . . . . . . . . . . . . . . . . . . . . . . . . . . . . . . . . . . . . . . . . . . .
i
iii
1
5
15
21
31
37
39
55
65
79
83
This page intentionally left blank.
1
Chapter 1
Improving Fiscal Management
I n the 166 years since it began, the California Legislature has
made just two comprehensive changes to the state’s tax
structure: first in 1911, and again in 1935. These structural
overhauls likely were responses both to the state’s maturing
economy and to changing preferences about how wealth should be
taxed.
The tax structure that worked for the state during the Gold Rush
emphasized the value of land and its potential for extractive
wealth. In those years, the state relied on the property tax as its
main revenue source. Later, the system that relied heavily on
taxation of private utilities reflected a sympathy for Progressive-
Era values.
The present system—perhaps unrecognizable to a 49er or
Governor Hiram Johnson—depends on taxing current income,
irrespective of the source of income or a person’s underlying
wealth. (See Appendix II on page 55, which traces the changing
nature of the state’s tax structure and policy considerations that
motivated alterations.)
In the 81 years since the last large-scale tax reform, California’s economy has grown substantially
and changed dramatically. Weighing the cumulative effect, the state should again overhaul its tax
system. An analysis of the tax structure should consider whether it supports sound fiscal
management, and how it could be modified to encourage future economic growth.
Does the Present System Support Sound Fiscal Management?
A primary function of any tax system is to finance the state’s current and ongoing budgets. Does
California’s tax structure generate adequate revenue to finance the state’s budget under a variety of
conditions? For example, revenues are adequate for the 2015-16 budget, but the tax structure must
keep pace with rising state costs, particularly for health care and post-retirement employee benefits.
The tax structure must generate enough revenue to finance both operations and investments. Capital
projects require multi-year commitments that compete with the operating budget. While capital
costs can sometimes be deferred, they cannot be eliminated.
The present system
depends on taxing
current income,
irrespective of the
source of income
or a person’s
underlying wealth.

A related concern is whether the current tax structure generates enough revenue over an entire
business cycle. One might expect the structure to under-perform in the down part of the cycle
and to over-perform relative to expenses in the good times. However, it appears the tax
structure amplifies changes in the economy, resulting in even greater revenue gains and losses
than would be expected from a tax structure that simply tracked economic cycles. In recent
years, even a modest economic downturn (much less a recession or a Great Recession) could
cause a precipitous decline in state revenues and create multiyear operating deficits.1
Further, a review must examine whether the tax structure generates revenue predictable enough
to construct a responsible, balanced budget and to support future spending and investments. If
estimators are unable to precisely predict revenue, then the budget likely will gyrate between
balance and imbalance.
Can the Present System Be Modified to
Encourage Future Economic Growth?
Encouraging economic growth is essential to
sound fiscal management. California’s tax
structure should serve the development of a robust
and diverse private-sector economy including
start-ups, small businesses, and established firms.
Many desire a tax structure that can easily adapt
as the economy changes.
Business interests express concern about the rising cost of regulations, such as labor expenses
and environmental standards. They contend these costs, which have the same impact as taxes
on the ability to sustain and grow a business, must be incorporated into the tax reform
conversation. The effects of taxes and regulatory burdens vary across companies, industries,
and geographic areas. Can mom-and-pop businesses be sustained as globally competitive
industries continue to grow and thrive?
In an effort to build skills and knowledge for quality employment, many families encounter
financial obstacles beyond taxes through steep tuitions and related expenses. How can the state
invest in the productive potential of Californians through education, child care, and job training
to broaden prosperity, translating into steadier revenues?
Local governments, just like the state, need to be able to anticipate revenues. Cities, counties,
and special districts are primarily responsible for providing the services that businesses need.
Should local governments be accorded more flexibility to raise taxes to cope with the state’s
revenue volatility, especially in higher-cost areas and communities that aspire to higher service
levels?
2
California’s tax
structure should serve
the development of a
robust and diverse
private-sector economy.

3
Many businesses are concerned about the high cost of housing. Can taxes and other financial
incentives encourage development of housing? How can the relationship between the state and
local governments be strengthened to encourage job creation and private investment?
On a broader scale, many business interests recognize the state is pushing the “greening” of the
economy and business climate, as evidenced by the enactment of numerous laws that create
infrastructure financing entities, promote the development of sustainable communities, and
accelerate greenhouse gas emissions limits. Are these policies sufficient to significantly
stimulate growth of California’s green economy?
This page intentionally left blank.
4

Chapter 2
Here and Now: the Current Tax System
Overarching Characteristics
T o assess a tax system, most analysts focus on four characteristics.
Volatility. The call for tax reform stems in large part from an understanding that California’s
current tax structure is highly volatile.
In 2010, Professor Alan Auerbach, director of the Robert D. Burch Center for Tax Policy and Public
Finance at the University of California, Berkeley, determined that California’s revenues are more
volatile than those of most other states.2 In part, this is because California relies more heavily on the
personal income tax. Other major taxes—including the sales and use tax and the property tax—tend
to be more stable, so a heavier reliance on income taxes will increase any state’s risk of volatility.
(Auerbach is a member of the Controller’s Council of Economic Advisors.)
Auerbach also concluded that California’s economy has been more volatile than the nation as a
whole in recent decades. As the national economy moved through a business cycle, swings in
year-over-year growth in California were larger. Further, he noted the state’s personal income tax
was pro-cyclical, with tax revenues
changing at rates greater than the
underlying economy.
Predictability. While volatility
describes year-over-year variations in
revenue streams, predictability measures
how accurately fiscal managers can
estimate revenues over an 18-month
period. The governor’s Department of
Finance (DOF) follows how well its
revenue estimates track performance.3
Estimates of some revenue streams, like
the property tax, tend to be very close to
actual receipts. Other revenues,
particularly the personal income tax, are
harder to estimate. Sometimes, revenues
5
Figure 1
Personal Income Tax Much More Volatile Than Economy (Percent Change From Prior Year)
Source: California Legislative Analyst’s Office, December 8, 2014

become less predictable at
certain points in the business
cycle. Sales tax revenues are
more difficult to predict when
the economy either enters into
or recovers from a recession
(Figure 1).
Sufficiency. Sufficiency is a
measure of whether the tax
structure produces enough
revenue to meet cash or
budgetary demands, but does
not gauge whether the budget
is balanced. The California
budget was balanced in
certain years even when
disbursement outflows
exceeded revenue inflows.4
Progressivity. A progressive tax system increases the tax burden as income goes up. Progressivity
is often measured among cohorts of selected income ranges. Public finance experts generally
consider tax progressivity a measure of a “good” tax system because they assume the marginal
return on each new dollar is lower. A regressive system, by contrast, assesses a greater share of
income at the lower end of the income spectrum.
The Institute of Taxation and Economic Policy in 2015 determined that California has one of the
more progressive tax structures in the country. Figure 2 shows the share of personal income
assessed by tax and by income. The personal income tax is steeply progressive, while the property
tax is moderately regressive, and the sales tax even more so.
Personal Income Tax
Figure 3 shows the personal income tax has grown to be the dominant source of state revenue. In the
2016-17 fiscal year, it accounts for 69.5 percent of General Fund revenues. California generally
follows federal rules for the taxation of personal income, but there are exceptions. For example,
California taxes capital gains at the same rate as income while the federal government applies a
reduced tax rate to capital gains. Figure 4 shows estimated 2016 revenues attributable to capital
gains at $12.7 billion.
Taming Volatility by Reducing Taxes on Capital Gains. Fiscal managers have focused on
three possibilities for moderating revenue volatility associated with capital gains. First, capital
6
Figure 2
Measuring Progressivity in California (Share of Income Paid for Selected State and Local Taxes by Income Quintile)
Source: Compilation of data from Institute of Taxation and Economic Policy, 2015

7
gains could be taxed at a lower rate than
other income. This would permanently
reduce state revenues. Second, investors
could be allowed to spread gains over
multiple tax years (so-called “income
averaging”), moderating the peaks and
valleys in state revenues. Third,
investment income could be taxed as it is
earned rather than when investors
recognize returns.
The latter two proposals would have
indeterminate effects on state revenue
totals and would increase complexity for
taxpayers faced with different state and
federal assessment methods. Some tax
experts argue that state treatment of
capital gains has a small effect on investor
behavior because the federal rate is so
much higher.
Addressing Budgetary Effects of Volatility Attributable to Capital Gains. In 2014, California
voters approved Proposition 2, a constitutional requirement known as the Rainy Day Fund Act
that moderates spending swings associated with capital gains revenue. Under the provision,
extraordinary revenue from capital gains is deposited in a separate account. Money from the
fund can be allocated only under certain circumstances and conditions, so it cannot be used to
build an unsustainable spending base.
Although a rainy day fund may better moderate spending after spikes in state revenues, it still
may not reduce pressure on policymakers to use extraordinary revenue gains to expand
Figure 3
Personal Income Tax is the Dominant State Revenue Source All General Fund Revenues
Figure 4
Capital Gains Revenue as a Share of General Fund Tax Revenues (Dollars in billions)
Source: Governor’s Budget Summary 2016-17, Revenue Estimates, p. 149
Annual Values 2007 2008 2009 2010 2011 2012 2013 2014* 2015* 2016*
Capital Gains
Realizations $ 132.0 56.3 28.8 55.3 52.1 99.9 79.9 130.3 134.9 124.8
Tax Revenues From
Capital Gains 10.9 4.6 2.3 4.7 4.2 10.4 7.6 13.1 13.7 12.7
*Estimated
Source: California Legislative Analyst’s Office, December 9, 2014

programs or reduce taxes. However, policymakers may allocate one-time revenue gains to
necessary one-time purposes such as investments or deferred spending.
Sales and Use Tax
State law levies a sales tax on the final transfer of
tangible personal property. For most
Californians, this means retailers incur a liability
each time they make a sale. The law provides for
exceptions, notably for life and safety necessities
such as food bought at grocery stores. The use
tax—a companion to the sales tax—applies to the
same kinds of transactions and ensures certain
sales, like out-of-state transactions for goods
consumed in California, do not escape taxation.
Current law imposes a uniform sales and use tax
rate of 7.5 percent, with 6.5 percent apportioned
to the state. Cities and counties get the remaining
1 percent. Local governments may levy an
additional local tax of up to 2 percent. (Figure 5)
Expanding the Base: Which Service Sectors Are the Largest? The sales and use tax was
originally proposed as a tax on the final transfer of tangible personal property, with an explicit
exclusion of labor. If labor were added to the sales tax base, what would be the potential revenue
gain? State Board of Equalization (BOE) staff reviewed federal data to identify services purchased
by Californians. Figure 6 shows the major economic sectors that provided services in 2011 (the
most recent data available) but were not subject to the sales tax.5 If all these services had been
subject to the sales tax, 70 percent of new revenue would have come from five economic sectors:
Professional, scientific, and technical, including lawyers, architects, accountants, engineers,
graphic artists, computer designers, management consultants, researchers, advertising agents,
translators, and veterinarians.
Health care, including physicians, dentists, audiologists, physical therapists, nurses, and
professionals in family planning, outpatient health, mental health, substance abuse treatment,
emergency care, rehabilitation, and child care.
Finance and insurance, including services provided by banks, credit unions, and brokerage
houses.
8
Figure 5
Statewide Sales and Use Tax Fund Allocations (FY 2014-15)
Source: California Board of Equalization, Publication 41
Rate How Funds Are Used
3.9375% General Fund
0.25% Education Protection Account (Prop. 30)
1.0625% Local Revenue Fund 2011
0.50% Local Revenue Fund
0.50% Local Public Safety Fund
0.25% Fiscal Recovery Fund
0.75% County and incorporated cities general fund
0.25% County transportation funds
7.50% Total

9
Information services, including employees of book publishers, newspapers, other periodicals,
music producers, software companies, telecommunications, data processers, libraries, archives,
and broadcasters.
Rental and leasing firms (not including real estate), including warehousing, transportation (such
as buses, limousines, and taxis), and cargo handling.
BOE staff adjusted the 2011 data to estimate the tax base in future years, specifically accounting for
inflation and population changes. BOE staff estimated the service base to be about $1.5 trillion in
the 2015-16 fiscal year and to grow in each subsequent year.6 Figure 6 displays revenue estimates
for services taxed at a quarter-percent rate. If the Legislature were to impose the full sales tax rate
and allow local governments to piggyback on state administration, the average sales tax rate on
services would be about 8.42 percent of receipts and generate more than $120 billion annually. (See
Appendix III on page 65 for greater detail about the BOE staff estimates.)
Figure 6
Taxing Services: Revenue at the Quarter-Cent Rate and Number of Firms or Individuals (Dollars in millions; totals may not add due to rounding)
Source: Derived from California Board of Equalization analysis using 2012 U.S. Census data, April 2015
Number of Firms or Individuals
Services Provided by Businesses
(a business that has employees) Revenue % of Subtotal 2012 % of Subtotal
Professional, Scientific, Technical $ 681.7 20.6 105,041 24.0
Health Care 614.3 18.5 84,817 19.4
Finance & Insurance 549.6 16.6 14,066 3.2
Information Services 378.3 11.4 7,789 1.8
Transportation & Warehousing 230.6 7.0 16,976 3.9
Administration/Waste Management 224.1 6.8 35,693 8.2
Construction 196.4 5.9 45,712 10.4
Real Estate 159.9 4.8 39,419 9.0
Arts, Entertainment, Recreation 91.0 2.7 20,331 4.6
Accommodations 66.0 2.0 5,454 1.2
Educational Services 18.0 0.5 8,541 2.0
Auto Dealers 14.3 0.4 2,919 0.7
Mining 7.0 0.2 273 0.1
Agriculture & Forestry 3.6 0.1 1,262 0.3
Other 76.9 2.3 49,494 11.3
Subtotal, Services Provided by Business 3,311.7 437,787
All Other, Including Services (providers as individuals
and independent contractors)
329.3 2,503,906
Total $ 3,641.0 2,941,693

Consumer Spending Shifts. California’s sales tax base has been shrinking. Every year,
consumers spend less of their income on taxable products and more on services. According to
the nonpartisan Legislative Analyst’s Office (LAO), the total value of taxable sales has grown
more slowly than the economy. This has necessitated higher sales tax rates to generate
comparable revenue.
Some have expressed support for imposing a tax on digital downloads. Many products that
used to be distributed as tangible goods and subject to the sales tax (video games, movies,
music, software, books) are no longer taxed when they are sold digitally. Consider the shift
from buying compact discs, VHS tapes, and software-in-a-box to subscriptions and
downloads for music, television shows, films, and computer programs.
Prices have increased faster for services than for tangible goods because of global competition
for products. With this structural shift, local governments also have had to cope with
diminished sales tax revenues. If the outmoded sales tax puts the state at financial risk, then it
puts cities, counties, and some special districts at risk.
Alternatives to Expansion. Rather than expand
the existing sales tax base, an entirely new scheme
could be used to tax sales of tangible goods and
services. In 2009, the Commission on the 21st
Century Economy was established by Governor
Arnold Schwarzenegger to evaluate and propose
reforms to California’s tax system. The
Commission recommended, among other things,
that the state adopt a business net receipts tax
(BNRT) to tax profits on sales of goods and labor.
Among its many attributes, a BNRT can be
constructed to:
Require a small tax rate on each transaction,
Provide a deduction for business purchases,
Minimize cascading tax liabilities (tax applied at each stage of production), and
Extend taxation to out-of-state transactions not currently subject to the sales tax.
The proposal drew criticism from a broad spectrum of interests. Some, including the
California Chamber of Commerce, criticized the BNRT as premature and were concerned that
the proposed change was an “unproven experiment.” Others such as labor interests expressed
concerns that taxing labor—unlike the sales tax generally—would encourage employers to
shift employment practices and lay off workers.7 If a BNRT replaced the current sales tax,
10
If the outmoded sales tax
puts the state at financial
risk, then it puts cities,
counties, and some special
districts at risk.

11
state officials would certainly have to establish rules for the transition. Taxpayers and
administrators could face significant compliance challenges during the phase-in.
Policymakers might also consider an alternative consumption tax like the European-style
value-added tax (VAT) levied on goods and services at each level of production. The VAT’s
regressive impact could be offset by a personal income tax on those at higher income levels.
Corporation Tax
A corporation doing business in California is
subject to the corporation tax. Other
corporations receiving income from California
sources also are liable for the tax. Of the three
main state taxes, the corporation tax contributes
the least to the General Fund.
Under California tax law, a corporation is a legal entity that, in general, exists separately from
the people who own, manage, control, and operate it. Such a corporation can enter into
contracts, pay taxes, and be liable for its debts. The corporation issues stock as evidence of
ownership to people or entities contributing money or business assets.
Stockholders or shareholders own the corporation and are entitled to any dividends. If the
corporation liquidates, they are entitled to the corporation’s assets after creditors are paid.
The annual tax for these corporations is the greater of $800 or 8.84 percent of the
corporation’s net income. (Newly incorporated or qualified corporations are exempt from the
annual minimum franchise tax for their first year of business.)
Some Council members are concerned the corporation tax could be used to shelter
shareholder income and reduce the amount of investment income that would otherwise be
subject to taxation through the personal income tax. California’s corporation tax gained wide
attention in 1986, when the state responded to concerns multinational corporations that
sought to repeal mandatory worldwide combined reporting. Worldwide combination is the
method of combining the income of multinational corporations for purposes of determining
the amount of net income subject to California tax. Among the concerns expressed were
unequal profits in all parts of the world; exchange rate fluctuations that result in inconsistent
income apportionment; and excessive record keeping burdens.
The Legislature responded by enacting a new system whereby multinational corporations
could elect one of two methods to determine income subject to tax in California: either
worldwide combination or “water’s edge” combination. The latter method provides that
Of the three main state taxes,
the corporation tax contributes
the least to the General Fund.
affiliated corporations operating a unitary business may elect to combine only the affiliates that are
designated as being within the water’s edge—within the 50 states of the United States and specified
tax havens. Affiliates outside the water’s edge are disregarded, their income having no direct role in
the income computation for California tax purposes. Business interests regard this 1986 change as
recognition of a shifting trade and business environment.
California voters approved more recent changes to the corporation tax that affect multistate and
multinational corporations. Proposition 39 of 2012 eliminated the ability of multistate entities to
choose how taxable income is determined for state taxation purposes. (This change was enacted to
provide a funding source for energy efficiency and alternative energy projects.) Prior to the passage
of Proposition 39, multistate businesses could elect how their taxable income was determined by
using either a three-factor method that included the location of the company’s sales, property, and
employees; or a single-sales-factor method that included only the location of the company’s sales.
Beginning in 2013, multistate entities were no longer able to choose and were required to determine
their California taxable income using the single-sales-factor method.
Property Tax
The state constitution authorizes local governments to levy and collect the tax on property. BOE
assists in tax administration by setting standards for assessment practices, assessing statewide
property, and adjudicating property tax disputes. State law specifies certain assessment practices.
BOE oversees the practices of the state’s 58 county assessors, who are charged with establishing
values for approximately 13 million properties each year. BOE set the values of state-assessed
properties, primarily privately-owned public utilities and railroads, at $99.5 billion for the 2015 roll.
This was a $6.2 billion increase from the year before.
Property tax revenue is generally considered a
discretionary local revenue source. Proposition 98
(approved by voters in 1988) requires that the state
make up for school funding deficiencies with state
revenues. Consequently, the state has a strong fiscal
interest in the performance of the property tax system.
In this analysis, property tax revenues are fungible with
state-levied revenues.
The property tax applies to all real and most personal property irrespective of use, including land
classified as residential, commercial, industrial, agricultural, open space, and timberland. The state
constitution and statute assess value based on the acquisition sale price, with increases for inflation
of up to 2 percent each year. The basic countywide property tax rate is limited to 1 percent, although
local agencies within each county may levy more for bonded indebtedness approved by voters.
12
Property tax revenue
is generally considered
a discretionary local
revenue source.

13
Under Proposition 13 (approved by voters in 1978), similar properties can have substantially
different assessed values based solely on the dates the properties were purchased. Disparities may
be particularly dramatic in places where significant appreciation has occurred. Longtime property
owners tend to have markedly lower tax liabilities than do recent purchasers whose assessed values
approximate market levels. Proposals to treat some property categories differently (a split roll)
could mean differing assessment ratios, tax rates, or exemptions.
Legislative attempts during the 2013-14 regular session to
revise the definition of a change in ownership for legal
entities failed. These bills would have specified that when
90 percent or more of the ownership interests in a legal
entity are sold or cumulatively transferred in one or more
transactions, the transfer would trigger property
reassessment. Under current law, if multiple individuals or
entities acquire another entity in a single transaction, but
none of the purchasers acquire more than 50 percent
interest, no reassessment occurs. Legal entities include
corporations, limited liability companies, partnerships,
joint ventures, and real estate investment trusts.
Other property tax features may merit further scrutiny:
Many properties are exempt from property tax, including most real property owned by schools,
hospitals, religious organizations, charitable organizations, and government entities. Should
these exemptions be re-examined?
The authority to allocate property tax revenue shifted from local governments to the state with
Proposition 13. The allocation is made pursuant to statutory formula whereby a local
government generally receives a share of property tax revenue proportionate to what it got prior
to Proposition 13. Proposition 22 (approved by voters in 2010) limited the Legislature’s
statutory discretion to reallocate local revenues, including property tax proceeds, though the
state is still in the driver’s seat. Some revisions have been made to these shares for both state
and local government fiscal benefit. Should the allocation of property tax revenue continue to
be a state responsibility? Should the allocation shares be re-examined?
Ad valorem (Latin for “according to value”) property tax payments are deductible for income
tax purposes, for principal places of residence and second homes. Should the deduction for
second homes be continued?
Almost all businesses
pay property tax, while
corporation tax revenue
comes primarily from
the biggest corporations.

14
Also, pursuant to Proposition 13:
Any proposed change in state taxes for the purpose of increasing revenues requires a two-thirds
vote in each house of the Legislature. Should this vote threshold be revised?
Cities, counties, and special districts may impose special taxes with proceeds designated for a
specific purpose by a two-thirds vote of the electorate within those jurisdictions. General
purpose taxes require a majority vote. Should these voter approval thresholds be revised?
Interaction between Property Tax Split Roll and Corporation Tax. Individuals and corporations
own commercial/industrial property. If commercial/industrial property were to be taxed annually
at fair market value (split roll), is it appropriate to reduce or eliminate the corporation tax to
minimize the business tax burden? Such a tradeoff might not be equitable because businesses are
affected in different ways by the two taxes. For instance, almost all businesses pay property tax,
while corporation tax revenues come primarily from the biggest corporations. Some businesses
that pay the corporation tax do not have any property in California.

Chapter 3
What If…? The Effects of Two Legislative
Proposals as Components of Tax Reform
F or purposes of applying the basic concepts of volatility, predictability, progressivity, and other
variables, the Council examined two tax reform proposals introduced in California’s 2015-16
legislative session.
Senate Constitutional Amendment 5
State law requires counties to assess real and personal property at the time of acquisition, for
purposes of determining taxable value. This assessment may increase annually at the rate of
inflation, but may not exceed 2 percent per year. Residential and commercial/industrial property are
subject to this assessment method, as is business personal property such as fixtures.
If SCA 5 (as amended July 16, 2015) were approved by voters, the state constitution would be
changed to require county assessors to annually reassess commercial/industrial property at fair
market value, and exempt the first $500,000 of personal property from this assessment. The change
in tax assessments for real property would be phased in over two years starting in 2018-19. The
change in personal property assessments would begin in 2019-20.
Fiscal Effect. SCA 5 would have partially offsetting effects.
1. Reassessing Commercial/Industrial Properties. There are no reliable estimates of the revenue
effect for the first year of the change, but the local revenue increase would probably exceed $1.0
billion. In the following year, revenue gains would likely surpass $5.0 billion and may add up to
more than $10.2 billion, assuming a 1 percent property tax rate. In subsequent years, property
tax revenue would grow commensurately with the rate of appreciation of commercial/industrial
property. Properties subject to rates above the basic 1 percent would produce even more
revenue. This revenue increase would be allocated to cities, counties, special districts, and K-14
school districts.
2. Exempting Personal Property. The personal property exemption would reduce revenue by an
unknown amount, but probably by more than $900 million in 2019-20 and growing in
subsequent years. The actual revenue loss would depend on how much business property was
subject to the exemption and property tax rates greater than the basic 1 percent. The revenue loss
would be shared by local governments. School districts would be held harmless.
15
16
3. Reducing Corporation and Personal Income Tax Payments. Corporations with higher
business costs because of this change could reduce their taxable income, resulting in lower
corporation tax payments beginning in 2018-19. Stockholders or partners with reduced
income likewise could pay less personal income or corporation tax beginning in the 2018-19
fiscal year. The state revenue loss is unknown but would grow over time. FTB would have
to estimate the revenue loss so that a portion of increased property tax revenue can be
transferred to the General Fund to make up the difference.
4. Increasing County Assessor Workload. County assessors would see costs increase by an
unknown amount as a result of having to do annual assessments, probably in excess of $10
million beginning in 2018-19.
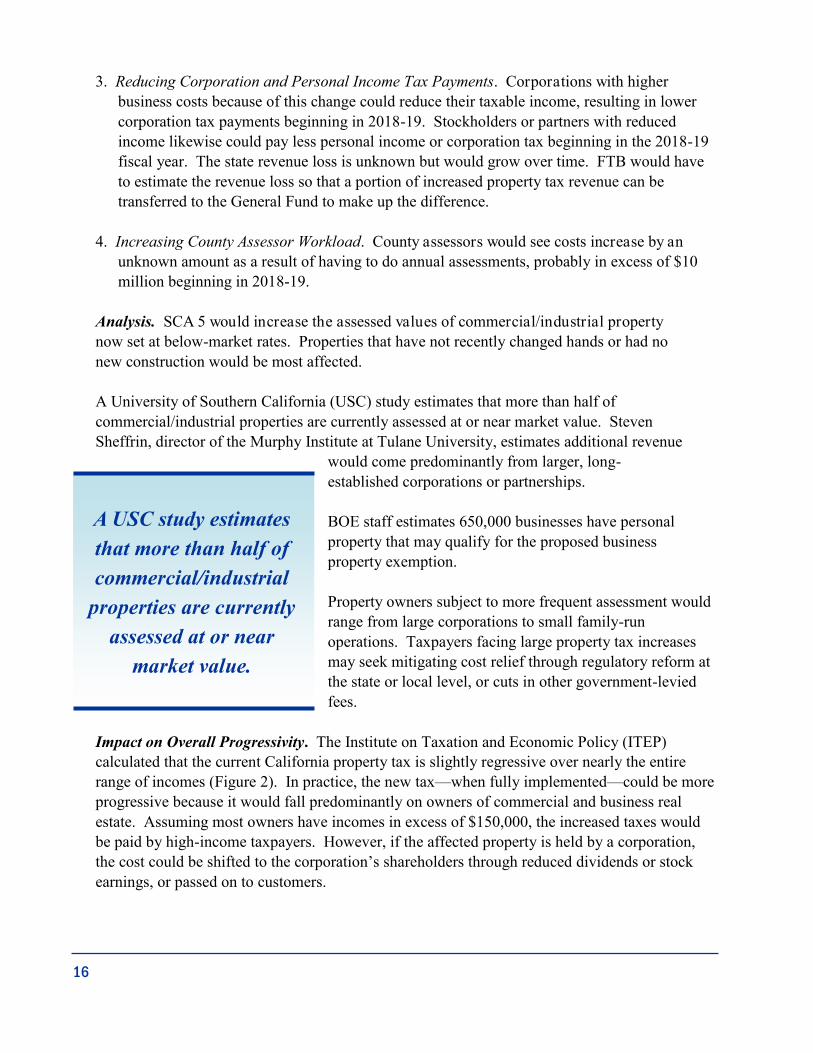
Analysis. SCA 5 would increase the assessed values of commercial/industrial property
now set at below-market rates. Properties that have not recently changed hands or had no
new construction would be most affected.
A University of Southern California (USC) study estimates that more than half of
commercial/industrial properties are currently assessed at or near market value. Steven
Sheffrin, director of the Murphy Institute at Tulane University, estimates additional revenue
would come predominantly from larger, long-
established corporations or partnerships.
BOE staff estimates 650,000 businesses have personal
property that may qualify for the proposed business
property exemption.
Property owners subject to more frequent assessment would
range from large corporations to small family-run
operations. Taxpayers facing large property tax increases
may seek mitigating cost relief through regulatory reform at
the state or local level, or cuts in other government-levied
fees.
Impact on Overall Progressivity. The Institute on Taxation and Economic Policy (ITEP)
calculated that the current California property tax is slightly regressive over nearly the entire
range of incomes (Figure 2). In practice, the new tax—when fully implemented—could be more
progressive because it would fall predominantly on owners of commercial and business real
estate. Assuming most owners have incomes in excess of $150,000, the increased taxes would
be paid by high-income taxpayers. However, if the affected property is held by a corporation,
the cost could be shifted to the corporation’s shareholders through reduced dividends or stock
earnings, or passed on to customers.
A USC study estimates
that more than half of
commercial/industrial
properties are currently
assessed at or near
market value.

17
Impact on Predictability. The property tax—even under the provisions of the proposed
constitutional amendment—has the virtue of assessing a low tax rate on a very wide and stable
tax base. This would mean small estimating errors, especially at the state level. Revenue would
therefore likely be easier to predict than for most other taxes.
Impact on Volatility. For the same reason that the tax
is predictable (stable base and low tax rate), it likely
would exhibit very little volatility. If SCA 5 were to
generate in excess of $10 billion each year, it could
moderate overall volatility.
Impact on Tax Performance. It is unclear whether
revenues generated pursuant to SCA 5 would keep pace
with the economy and population.
Potential Implementation Concerns. Appraisal of commercial/industrial properties is very
complex, so county assessors would need to hire expert staff. Property tax appeals could
increase, thereby driving up assessors’ costs.
A split roll would require clear definitions of property types. For example, would second homes,
owner-occupied bed-and-breakfast houses, and timeshares be treated as residential or
commercial/industrial? Mixed-use properties and parcels of land with both residential and non-
residential elements (live-work spaces and lofts) would require assessors to establish a method to
allocate land values for the different elements.
Senate Bill 8
At the time of the Council’s review, SB 8 was intended to achieve at least three policy goals:
Increase revenues by broadening the sales tax base to include services. The tax rate would
not necessarily be as high as the current state rate, but would be set to generate roughly $10
billion in its first year and increasing amounts thereafter. Local jurisdictions would not be
authorized to impose a sales tax on services, as they now are authorized to do with goods.
Provide tax relief to low-income households to help offset the impact of taxing services.
Phase in additional tax relief for individuals and corporations after the sales tax on services is
fully implemented.
Fiscal Effect. SB 8 was intended to generate a net state revenue increase of $10 billion in the
first year. If the tax on services produced enough revenue, tax relief would be phased in,
The property tax has the
virtue of assessing a low
tax rate on a very wide
and stable tax base.
possibly leading to a brief period of higher
tax burdens.
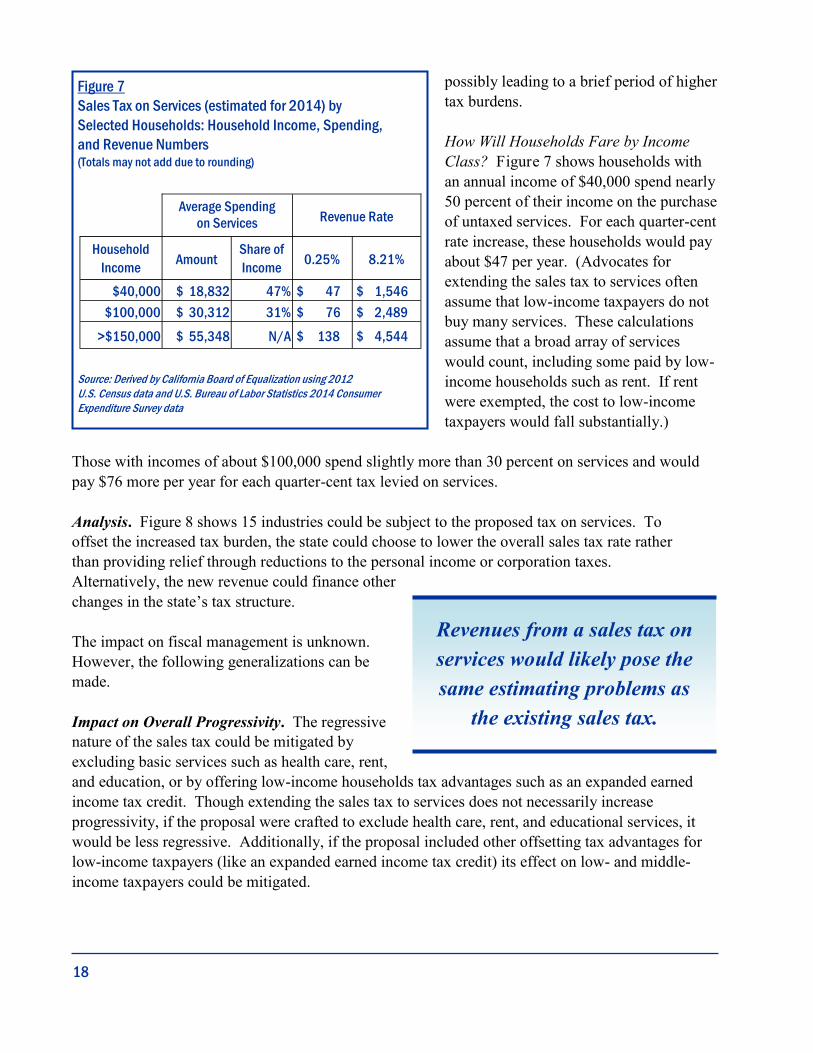
How Will Households Fare by Income
Class? Figure 7 shows households with
an annual income of $40,000 spend nearly
50 percent of their income on the purchase
of untaxed services. For each quarter-cent
rate increase, these households would pay
about $47 per year. (Advocates for
extending the sales tax to services often
assume that low-income taxpayers do not
buy many services. These calculations
assume that a broad array of services
would count, including some paid by low-
income households such as rent. If rent
were exempted, the cost to low-income
taxpayers would fall substantially.)
Those with incomes of about $100,000 spend slightly more than 30 percent on services and would
pay $76 more per year for each quarter-cent tax levied on services.
Analysis. Figure 8 shows 15 industries could be subject to the proposed tax on services. To
offset the increased tax burden, the state could choose to lower the overall sales tax rate rather
than providing relief through reductions to the personal income or corporation taxes.
Alternatively, the new revenue could finance other
changes in the state’s tax structure.
The impact on fiscal management is unknown.
However, the following generalizations can be
made.
Impact on Overall Progressivity. The regressive
nature of the sales tax could be mitigated by
excluding basic services such as health care, rent,
and education, or by offering low-income households tax advantages such as an expanded earned
income tax credit. Though extending the sales tax to services does not necessarily increase
progressivity, if the proposal were crafted to exclude health care, rent, and educational services, it
would be less regressive. Additionally, if the proposal included other offsetting tax advantages for
low-income taxpayers (like an expanded earned income tax credit) its effect on low- and middle-
income taxpayers could be mitigated.
18
Figure 7
Sales Tax on Services (estimated for 2014) by
Selected Households: Household Income, Spending,
and Revenue Numbers (Totals may not add due to rounding)
Source: Derived by California Board of Equalization using 2012
U.S. Census data and U.S. Bureau of Labor Statistics 2014 Consumer
Expenditure Survey data
Average Spending
on Services Revenue Rate
Household
Income Amount
Share of
Income 0.25% 8.21%
$40,000 $ 18,832 47% $ 47 $ 1,546
$100,000 $ 30,312 31% $ 76 $ 2,489
>$150,000 $ 55,348 N/A $ 138 $ 4,544
Revenues from a sales tax on
services would likely pose the
same estimating problems as
the existing sales tax.

19
Impact on Predictability. Some
services would likely provide a stable
tax base. For example, revenues from
commercial waste hauling would
probably rise with inflation, population
growth, and a general growth factor.
Rents, if not exempted, would likely be
stable. However, services such as
haircuts and entertainment might be
more challenging to estimate if they
varied with employment rates or
economic growth. More broadly,
revenues from a sales tax on services
would likely pose the same estimating
problems as the existing sales tax.
Reliability tends to diminish at specific
points in a business cycle.
Impact on Volatility. The impact on
systemic volatility is unknown.
Impact on Tax Performance. It is
unclear whether revenues associated with SB 8 would keep pace with the economy and population.
Potential Implementation Concerns.
If improperly constructed, a service tax could be applied to the same labor at multiple stages of
product development. Certain service providers are prone to this cascading effect—notably
construction, automobile sales, arts, entertainment and recreation, accommodations, some real
estate, education, transportation and warehousing, certain financial services and insurance, and
professional, scientific, and technical services. To prevent cascading, perhaps the law should
avoid taxing business-to-business transactions.
A sales tax that differentiates between goods and services would add complexity to tax
administration, as some businesses would sell items and services subject to different rates. Those
businesses already differentiate among their products. For example, an auto parts store applies the
sales tax to brake pads but not to the service of replacing the old brake pads. Businesses not
currently liable for collecting and remitting sales tax—like accounting firms—would have to start.
Figure 8
Standard Business Classifications Used for Federal Statistics
Source: North American Industry Classification System, 2015
NAICS Service
11 Support activities for agriculture and forestry
21 Support activities for mining
23 Construction
44 Automobile dealers (labor charges for repairing the cars)
48-49 Transportation & warehousing
51 Information
52 Finance & insurance
53 Real estate & leasing
54 Professional, scientific, technical services
56 Administrative, support, waste management, remediation
61 Educational services
62 Health care & social assistance
71 Arts, entertainment, recreation
72 Accommodations
81 Other services except public administration

This page intentionally left blank.
20

21
Chapter 4
From Gold to Silicon: California’s
Economy and Tax Structure
E conomic changes have helped shape California’s tax structure, from the expansion of the
manufacturing base after 1929 to today’s vibrant and diverse economy. As a result,
California’s tax structure and fiscal management look different than those in other states.
A Brief History of Growth in California’s Manufacturing Base
California’s manufacturing sector grew significantly between 1929 and 1997 as the state added
manufacturing firms at an annual rate of 2.1 percent.8 Meanwhile, manufacturing output grew by
5.8 percent each year.9
1929 through 1939. Resource processing, not manufacturing, accounts for half the state’s industrial
output through 1935. This activity—ranging from produce canning to winemaking, from lumber
processing to petroleum refining—generates income for each region of the state.10
1940 through 1946. Manufacturing becomes the
primary driver of the state’s economic growth
during World War II. Manufacturing employment
increases from 271,000 in 1939 to 530,000 in
1947.11 Manufacturing output triples as the state
develops a base for building ships, aircraft, and
electrical components (including radios, radar-
jamming equipment, signal generators, and sonar).
1947 through 1971. The U.S. enjoys sustained
economic growth despite cyclical recessions.
California benefits in the period immediately
following World War II. However, starting in
1958, the state’s manufacturing base (as measured
by output or employment) grows more slowly than
the national average for 14 years. The state’s
manufacturing and service sectors grow more
rapidly than the resource-processing sectors.12
Starting in 1958,
the state’s manufacturing
base grows more slowly
than the national average
for 14 years…
The state’s industrial
sector increasingly includes
“knowledge-based”
companies.

The state’s industrial sector increasingly includes “knowledge-based” companies such as those
involved in aerospace, electronic components, and technology parts.
1972 through 1995. Silicon Valley-based companies, including Hewlett-Packard, Apple, and
Intel, lead the personal computer revolution. California-based software and components
companies benefit from their proximity and association with Silicon Valley manufacturers. For
15 years starting in 1972, the number of California manufacturing firms grows by 42 percent
(compared to the national average growth of about 12 percent).13 California leads the nation in
the manufacture of electrical components, computing equipment, printing equipment, and
scientific instruments. Manufacturing employment grows by 5.8 percent in the state, but falls by
9.5 percent nationally.14 During the 1970s and 1980s, California’s old manufacturing base
begins to experience major decline. Steel, auto, and tire manufacturers nearly disappear by
1990.15 In the 1991-1994 recession, the state’s aerospace sector is hit hard.
Since 1995. From 1995 until 2000, the state’s economy—manufacturing and otherwise—
consistently grows faster than the nation’s as a whole.16 There is a transformation from “old
industries” to “advanced manufacturing.” Although the sector employs fewer people, the jobs
are good, productivity is strong, and manufacturing remains an important part of the innovation
economy ecosystem. The internet/dotcom boom that began in 1995 accelerates and diversifies in
2000 and beyond—growing jobs at both ends of the technical, professional, software/internet,
entrepreneurial sector.
Assessing California’s Economy in Context
California, like other states, forged its own economic path based on its history, culture, and
politics. How does its current economy and tax structure stack up, in terms of industrial sector
diversity, other economic indicators, overall tax load, and fiscal resiliency?
Measuring Diversity. In 2011, the state of Hawaii, using two widely accepted indices of
economic diversity, ranked California at fourth or sixth. These methodologies found other large
states also near the top including Texas, Illinois, Michigan, Massachusetts, and North Carolina.
Some smaller Western states also ranked highly such as Utah, Oregon, and Colorado. In 2014, a
Missouri study ranked California the 20th most diverse economy. The state of Utah, in a 2012
analysis, put California just above the middle (25th among 50 states and the District of Columbia,
the U.S. Virgin Islands, and Puerto Rico).
Figure 9 shows that California’s top five sectors look much like those for the U.S. as a whole.
For example, the sector that includes finance, insurance, real estate, and rental and leasing
accounted for 21 percent of California’s gross domestic product, compared to 20 percent for the
nation. Not surprisingly, the information sector in California accounted for a bigger share of
economic activity than for the U.S., 8 percent compared to 5 percent.
22

23
Some other states also resemble the U.S. as a whole in industrial composition, including Florida,
Illinois, and Colorado. Obvious divergences show in Texas, for instance, where the sector
including finance, insurance, real estate, and rentals and leasing accounts for 6 percentage points
less than for the nation as a whole, while mining is 11 percentage points higher. New York’s
finance sector surpasses the U.S. average by 12 percentage points. Nevada relies more heavily
on the sector of arts, entertainment, recreation, accommodations, and food services. Oregon’s
durable goods manufacturing sector is 17 percentage points higher than the national average, and
Washington’s is 4 percentage points higher.
Other Indicators. In other ways, California’s economy differs from the rest of the U.S. Per
capita personal income in 2014 of $49,985 was 109 percent of the national average and ranked
11th among the states.
For two decades, the state’s unemployment rate has exceeded the nation’s, but this can be
attributed to a faster growing and younger labor force, according to a January 2016 publication
by the Public Policy Institute of California (PPIC).17 At the same time, California workers earn
12 percent more than their counterparts in the rest of the U.S., and output per worker is 13
percent higher. The states that border California (Nevada, Arizona, and Oregon) all rank lower
in wages and productivity, PPIC found.
Employers, too, may be attracted by a more highly skilled workforce and more ready access to
capital. California ranks first in venture capital per capita and first in patents granted per capita.
On the other hand, housing costs are substantially higher than the U.S. average. A 2015 LAO
report showed this gap has been widening over the past four decades, with California home
prices now two-and-a-half times the national average.
Figure 9
Top Five State Industries as a Percent of Total GDP (2014)
Source: GDP for California, U.S. Bureau of Economic Analysis Bearfacts (GDP last published on December 10, 2015.)
Information
Finance, Insurance, Real Estate, and Rental and Leasing
Professional and Business Services
Educational Services, Health Care, and Social Assistance
Government
All Others
38%
12%
8%
7%
21%
13%
42%
5%
20%
12%
13%
California USA
8%

California’s Tax Structure
Figure 10 tracks an index of tax
load, derived by dividing total
revenues by overall personal
income, between 1967 and 2016.
This index can serve as a measure
of “tax affordability.”18
For the last 50 years, the annual
tax load averaged 6.92 percent of
overall personal income. In the 10
years starting in 1967, the annual
tax load steadily increased from
6.30 percent to 7.50 percent,
showing tax costs outpaced
personal income for the decade.
The measure hit its lowest
points—falling below 6.00
percent—in 1970 and 2008. In
these years, taxes took the smallest
share of the economy, making them more “affordable.” The index went above 7.70 percent in 1977,
1999, and 2000, marking these three years as “least affordable.”
The tax load statistics change annually, depending on:
The tax structure, especially legislated adjustments to tax rates or the tax base. For example, the
large increase in sales and income tax rates—adopted as part of Proposition 30—increased tax
collections by more than $6 billion in 2012.
Taxable income. If taxable income rises faster than personal income, the index will rise. For
example, when investors realize stock gains, this typically triggers a taxable event that will
increase tax collections.
Personal income. When personal income increases—through inflation or productivity—without
a commensurate increase in tax revenue, the index will fall. This can happen in periods of high
inflation without commensurate wage increases.
Changes in tax loads are not simply a function of changes in personal income. The tax load measure
also can respond both to changes in the tax system (such as rate or base changes).
24
Figure 10
Ratio of Total State Taxes to Personal Income
California (1967-2016)
Annual Ratio Average for Decade Average for Entire Period
Source: Governor’s Budget Summary 2016-17, Schedule 2, January 2016

25
Vacillating Tax Loads. The load index varies a great deal, even when the tax structure itself has
not changed. Ten-year averages, as displayed in Figure 10, show moderate swings. For the years
1967 through 1986, the average tax load was 6.49 percent. It hovered around 7.10 percent in the
next three decades, before falling to 6.76 starting in 2007.
The tax load measure in Figure 10 is a broad index, not intended to gauge effects on individuals or
classes of taxpayers.
Comparing California to Other States. Figure 11 compares California’s tax structure to other
Western states, from Washington to New Mexico. Figure 12 compares California’s tax structure to
that of other states with large economies in the Northeast, Midwest, and South.
To facilitate cross-state comparisons, the figures include all state and local taxes for 2013 as
reported to the U.S. Census Bureau. Local taxes are included for a complete picture of the tax
burden across states with very different ways of dividing up taxing authority between levels of
government. For example, because its local governments have limited flexibility and authority to
levy most kinds of taxes, California may raise comparatively more of its revenue at the state level
than do most other states.
Figure 11
Comparison of State and Local Tax Collections as Share of Personal Income, Western States (2013)
Source: Derived from Tax Policy Center data, 2016

To account for these differences in fiscal capacity, Figures 11 and 12 show tax collections of both
state and local levies for all states.
Western States—Similar Overall Tax Loads in 2013. Each Western state relies on a different mix
of taxes. Even without a personal income tax, Wyoming generates about as much tax revenue, 11.1
percent of personal income, as does California. It relies more heavily, compared to California, on
the proceeds of its property tax and other taxes—mostly an oil severance tax and a tax on mineral
extraction.
Idaho, Washington, and Colorado report the lowest tax loads, between 9.0 percent and 9.3 percent.
The differences in loads can be explained by a number of factors that may be unique to the state, its
tax structure, and a given tax year. Care should be taken in making generalizations from these
comparative indices. At best, the cross-state index provides a one-year snapshot of a state’s tax load
relative to its neighbors. It is not clear, for example, whether the index would move uniformly for
each state from year to year.
California generates revenue equivalent to 3.6 percent of personal income from the personal income
tax. Though Washington and Wyoming do not levy a personal income tax, all other Western states
do, collecting revenues between 1.4 percent and 2.7 percent of personal income. Only one other
Western state—Oregon—generates more from this source.
26
Figure 12
California Tax Structure Compared to Other States with Large Economies (2013)
Source: Derived from Tax Policy Center data, 2016

California generates revenue equal to about 3.5 percent of personal income from its sales and use
tax. All Western states, including Oregon, reported getting a significant share of revenue from the
sales tax. New Mexico, Arizona, Nevada, and Washington generate more revenue than does
California through this levy.
Three Western states, including Nevada, Washington, and Wyoming, do not levy a corporation tax.
California and the other Western states levy this tax, collecting between 0.2 percent and 0.4 percent
of personal income.
California generates revenue equal to about 2.8 percent of personal income from its property tax.
Four Western states—Oregon, Montana, Colorado, and Wyoming—collected a greater share of
revenues than California through property taxes.
Other Large States. Figure 12 shows that among other large states, New York, New Jersey, and
Illinois all exceed California’s state-local tax load, ranging from 11.6 percent to 15.1 percent of
personal income.
Florida, Georgia, and Texas have the lowest tax loads among the large states, ranging from 8.2
percent to 8.9 percent. Neither Florida nor Texas levy a personal income tax but, compared to
California, the two states collect a greater share of personal income through the sales and property
taxes.
States Evidence Greater Differences in Tax Mix than Tax Load. Most states generate between 8.2
percent and 11.6 percent of personal income from state and local taxes. New York State may be
something of an outlier with its concentration of financial services in New York City, allowing it to
tax 15.1 percent of personal income—well above other states in this analysis.
Most states rely on a mix of sales, property, and personal income taxes. Yet some have chosen not to
levy a personal income tax, relying instead on sales and property taxes (or extraction taxes). The
most significant difference among states appears to be their relative reliance on the sales, property, or
personal income taxes, possibly resulting from constitutional, judicial, or statutory limitations.
Do Tax Loads Affect Overall Economic Growth?
Senate Bill 1837 of 1994 required DOF to conduct a “dynamic” revenue analysis for any proposed
legislation with a revenue impact of 10 million dollars or more. The goal of such a model is to
account for how tax changes affect overall economic output, in contrast to direct economic responses
under a “static” model. Since September 1995, economic modeling techniques, surveys of other
states, literature surveys, and preliminary internal and external dynamic analyses have been
examined. This work resulted in better understanding limitations to a dynamic revenue model,
including the need to incorporate California-specific data. Further development of the model has
halted.19
27

In December 2015, William G. Gale, Aaron Krupkin, and Kim Rueben, reported in the National Tax
Journal that the “effects on state-level growth [of tax changes] have been the subject of continuing
controversy with many conflicting and fragile results in the literature.”20 (Rueben is a member of
the Controller’s Council of Economic Advisors.) In constructing their own model, the authors found
the interaction of tax revenues and personal income growth to be dramatically time-sensitive.
Specifically, they found that states with higher revenues generally had lower personal income
growth for the period from 1977 to 1991; they also found that states with higher revenues had higher
personal income growth from 1992 to 2006. They also found marginal tax rates do not generally
affect personal income tax growth. These findings suggest that policymakers should be more
concerned about overall tax burdens than about the effects of particular taxes, specifically the
marginal rates of the personal income tax.
Moreover, they found that higher property tax
burdens have a positive correlation with
economic growth, suggesting that property
values (and associated tax revenues) appreciate
as the economy expands. The study did not
examine the effects of tax expenditures such as
those identified in Appendix IV on page 79.
(Tax expenditures are credits, deductions,
exclusions, exemptions, or other tax benefits.)
California has one of the most progressive tax structures in the country, putting a higher relative
burden on high-income taxpayers. The alternative is lower revenues or shifting the burden to other
taxpayers.
California’s Fiscal Management: Where We Stand among States
A 2015 simulation by U.S. Government Accountability Office (GAO) highlights that the state and
local government sector could continue to face fiscal imbalance (the gap between revenue and
spending) during the next 50 years if reform are not implemented soon and sustained. The GAO
simulation assumes no tax structure changes and spending remaining constant. While the GAO
recognized that revenues are on the rise after the Great Recession, long-term challenges remain for
states and localities about how they will meet expenditure demands, especially in the area of health
care. The GAO estimates that states and localities without reform would have to cut spending or
increase revenue by five percent and sustain those actions to permanently stave off operating
deficits.21
Research has considered whether indicators can be developed to predict fiscal stress. For example,
the Mercatus Center at George Mason University developed a measure of fiscal stress22 based on:
28
California has one of the most
progressive tax structures in the
country, putting a higher relative
burden on high-income taxpayers.

Cash solvency,
Budget solvency (a measure of whether the state can cover fiscal-year spending with current
revenue),
Long-term solvency (assessing a state’s ability to deal with large long-term obligations),
Service-level solvency (a measure of “fiscal slack” that would allow a state to raise taxes),
Trust fund solvency (taking into account unfunded pension liabilities, other post-employment
benefit obligations, and other debt compared to personal income), and
State debt (taken from comprehensive annual financial reports).
Figure 13 shows that California ranked 44th among the 50 states for 2013-14, according to the
Mercatus Center. The state did poorly in the categories of cash solvency, long-run solvency, and
trust fund solvency. Among other large states that placed better than California, Florida ranked
sixth, performing well in its cash solvency and service-level solvency. Overall, New Jersey and
Illinois fared worse than California.
California has made fiscal changes since 2014 including strengthening its budget reserves. Reform
of the state’s tax structure could further improve fiscal management.
Figure 13
Overall Fiscal Solvency: How Do the 50 States Rank? (Based on FY 2013-14)
Source: Eileen Norcross and Olivia Gonzalez, “Ranking the States by Fiscal Condition, 2016 Edition” (Mercatus Research, Mercatus Center at
George Mason University; Arlington, VA; June 2016)
29

This page intentionally left blank.
30

31
Chapter 5
Other Issues at Stake
A ny change to California’s tax system will necessarily take into account other relevant policy
issues. For example, tax expenditures have been enacted over the years to address specific
policy goals, such as encouraging homeownership with the mortgage interest deduction.
Conversely, one might assert the development of public policy generally has been shaped by the
limitations of our tax system. One such limitation is new taxes that address different policy
outcomes, often resulting in the layering of burdens on the same group of taxpayers (e.g., sales tax
levies for transportation, public safety, and libraries).
Sound fiscal management requires focusing on
oversight of current tax expenditures, examining
the state-local relationship, promoting economic
growth, and minimizing income and wealth
disparities. In addition, regulatory costs are
perceived by many in the business community as
analogous to taxes and merit consideration as
such.
Tax Expenditures
Although the Council refrained from considering
expenditure proposals (spending side reforms),
the members generally discussed tax
expenditures, recognizing that they reflect special
tax provisions that result in foregone revenues.
Federal law defines tax expenditures as revenue
losses attributable to provisions of federal tax law
that allow a special exclusion, exemption, credit,
preferential tax rate, or a deferral of tax liability.23
According to the congressional Joint Committee
on Taxation (JCT), legislative history indicates
that tax expenditures should be thought of as
deviations from the “normal income tax
structure.”
Figure 14
Top Expenditures of Personal Income Tax in CA (Dollars in millions)
Source: California Department of Finance (2014) and California Franchise Tax Board (2012)

Reports on California tax expenditures,
prepared by both DOF and Franchise Tax
Board (FTB), generally have followed the
JCT methodology.
Figures 14 through 16 show the top tax
expenditures for the personal income tax, the
corporation tax, and the sales and use tax.
(See Appendix IV on page 79 for more
extensive lists.)
For most tax expenditures, legislative intent is
not stated but there are often specific policy
goals. For example, most corporate tax
expenditures are meant to support businesses
based on type or location. The legislative
intent for the manufacturing exemption from
the sales tax is to attract and expand
manufacturing businesses. Most tax
expenditures do not include a sunset date.
In August 2015, the California Bureau of
State Audits initiated a review of the top six
corporation tax expenditures. The objective
of the review was to determine their purposes;
whether studies have assessed their
effectiveness and/or benefits to the state
economy; whether some are more effective
than others; and the impact of the state
placing a cap on certain tax expenditures.
The review found that five of the six
corporation tax expenditures required
additional study to determine whether they
were achieving their purposes. The audit
concluded that implementing oversight
methods from other states could improve the
effectiveness of the state’s current and future
tax expenditures. It also recommended that
the state conduct regular, comprehensive
reviews of tax expenditures and their policy
objectives.
32
Figure 15
Top Expenditures of Corporation Tax in California (Dollars in millions)
Figure 16
Top Expenditures of Sales and Use Tax in California (Dollars in millions)
Figures 15 and 16 Source: California Department of Finance (2014) and
California Franchise Tax Board (2012)
33
Many policy goals are embedded in tax expenditures. A broader conversation may focus on the
following questions:
Should a similar review be performed for the personal income tax, and the sales and use tax
expenditures?
Should tax expenditures that conform to federal law remain regardless of their effectiveness?
Should tax expenditures that outlived their original policy goals or usefulness be modified,
suspended, or repealed? Should current and newly enacted tax expenditures be subject to
periodic review or sunset?
Considering how the Legislature has suspended or changed the law for net operating loss
deductions, should these deductions be treated as a tax expenditure?
In general, should the definition of tax expenditures be changed?
Are there more efficient ways to accomplish the same policy goals—through direct spending, for
instance?
The State-Local Relationship
The connection between state and local governments is
vital in the tax structure conversation. It is important to
consider which level of government has the authority to
impose taxes, for what purposes, and whether such
authorities and responsibilities should be shared.
Fiscal control and responsibilities have shifted between
state and local entities since the state’s birth in 1850. In
its earliest days, the state had limited responsibility for
programs and narrow taxing authority. At least through
1900, counties were the most prominent level of
government, with the greatest budgetary responsibility
and revenue streams.
Some have tried to rationalize the state-local fiscal relationship to reflect social and financial needs.
A “separation of sources” policy, in place until 1935, was an attempt to create fiscal independence
for both state and local governments. Voters repudiated this experiment during the Depression in
part because local funding could not fully support K-12 schools, leading the Legislature to levy the
sales tax and the personal income tax.
Economic shifts,
governance and fiscal
changes, and policy
decisions have led to the
concentration of
tax resources at the
state level.

Local Governments at the Heart of Economic Growth. Some argue that while it may be
important to compare California’s tax structure to other states, it is imperative to compare the
state’s tax resources with those of local governments. Economic shifts, governance and
fiscal changes, and policy decisions have led to the concentration of tax resources at the state
level. Of particular note, the state’s repeal of redevelopment laws eliminated what many
consider the most important local financing tool for affordable housing and economic
development.
Today, the state-local relationship is so intertwined that local
governments are key players in growing the economy through
job creation and private investment. They provide the
services and train the workforce that lays the groundwork for
economic vitality. Businesses care about the functions local
governments oversee, including public safety, street
maintenance, housing construction, and quality-of-life
amenities. Therefore, local governments, just like the state,
need predictability and revenue growth aligned with service
demands (population and job growth). In this regard, state
tax volatility creates local volatility. Local governments need flexibility to increase taxes
locally—especially in higher-cost communities that aspire to higher service levels. For
example, some local officials have called for the authority to levy local sales taxes on
services.
Regional Approaches Met with Limitations. Affordable housing production stalled after
the 2011 repeal of redevelopment. Some cities are putting new tools in place, such as impact
fees. However, these tools are just ramping up and will not come close to generating the
level of financial investment that redevelopment did for low- and moderate-income housing.
To what extent should state law facilitate a regional response to addressing housing demand?
California’s tax structure encourages cities to use their land for commercial uses rather than
housing. Except at high densities, even commercial uses do not generate the tax revenue to
pay for services. In light of this, some propose allocating a portion of the sales tax not by
situs (place of sale) but by proxy (where the purchaser resides).
Additionally, state and local governments have long recognized the regional nature of
transportation. However, the shrinking sales tax base and the decline in fuel consumption are
creating pressure for raising the cap on the combined local sales tax, especially in regions
that have collaborated on regional transportation through a series of countywide sales tax
measures.
In recognition of these limitations, some suggest that the state authorize new local and
regional tax levies.
34
Local governments are
key players in growing
the economy through
job creation and
private investment.

Constitutional Provisions to Encourage Local Revenue Sharing. Article 13 of the
California Constitution authorizes cities and counties to share locally generated sales tax
revenue. Under some circumstances, voters must approve these revenue-sharing agreements,
a process that can lead to delays and cumbersome requirements. 24
As an alternative, the state may want to authorize greater flexibility in sharing revenues—
especially discretionary revenues—across local boundaries. Voluntary revenue-sharing
agreements could help overcome limited local revenue capacity. For example, a revenue-
sharing agreement to create a cross-jurisdictional fire department might be more efficient
than a fire-service contract between two cities.
Promoting Economic Growth and Minimizing Economic Disparities
California and the nation are witnessing unprecedented levels of income disparity, stagnating
household income, and record-setting compensation for corporate executives. The pay gap
between CEOs and other employees continues unabated. California is among the top four
states in income disparity as estimated by the Gini coefficient, a common measure of
inequality based on income distribution among the nation’s residents.25 (The other three are
New York, Connecticut, and Louisiana.)
Many assert growing income disparity dampens
economic growth as income is concentrated in fewer
hands and the wealthy spend less in local economies.
In addition, growing economic disparity results in a
rising demand for public services.
A Wealth Tax. Some have suggested a wealth tax
could be phased in with a reduction to the income tax,
offering some smoothing to state tax revenues.
According to Daniel Altman, an economist from New York University, wealth tax brackets
have been suggested of zero percent for up to $500,000 in wealth, 1 percent for wealth
between $500,000 and $1 million, and 2 percent for wealth above $1 million.
Under this model, a family with $500,000 in wealth and $200,000 in annual income would
pay $50,000 in federal income tax per year and no wealth tax. However, a family with $4
million in wealth and $200,000 in annual income would pay a total of $65,000 each year.
Families relying more on wealth would pay more than they do now, while families
depending on earnings would pay less.26
Investing in Californians. The sustainability of any tax structure relies on a well-trained
workforce with high-wage jobs. Investing in the productive potential of individuals is
35
Growing economic
disparity results in a
rising demand for
public services.

essential to cultivating broad-based prosperity. Critical investments include K-14 education, higher
education, child care, and flexible training and retraining opportunities. Offering means-tested
support to help people move up the income ladder is a proven approach to growing economic
prosperity. If employers are better engaged with the education and training community, curricula
will be more relevant and employers will benefit from more successful outcomes.
Regulatory Challenges
… and Opportunities
Business interests that must comply with
regulations, especially those associated with labor,
assert the layering of local mandates on top of state
mandates (and vice versa) results in excessive
costs, unintended consequences, and unfair
compliance burdens. While understanding and even supportive of the objectives of these mandates,
they cite as an example the recently enacted state minimum wage increase to $15 per hour causing
salary compaction with those already earning $15 per hour for performing more complex duties.
Across all industries and business sizes, the reform commonly identified as likely to have the most
positive impact on California’s business climate, housing development, job growth, and economic
prosperity is revising the California Environmental Quality Act of 1970 (CEQA) in a meaningful
way. CEQA was well-intentioned to protect our state’s precious natural resources. Over time, it has
spawned an approval process that is complex, burdensome, and prone to time-consuming and costly
litigation. Speed to market can make or break a business, and projects can be brought to a halt by
competitors or special interests abusing the CEQA process for their own material gain. These costs
and delays translate into revenue losses for any business or organization, including the state.
Reforming CEQA is as important as reforming our tax system. Similarly, it will require diverse
stakeholders to rise above self-interests that impede any meaningful attempts to improve the
situation.
Yet many of these business interests see new economic opportunities as the state colors the business
climate green with its focus on sustainability. They regard the state as already invested in promoting
an economic framework directed at environmental sustainability with a focus on greenhouse gas
reductions by all sectors (e.g., public, private, utility, transportation). Therefore, there is potential to
improve the tax system and induce economic development to achieve a more sustainable economy
by blending green economic incentives and tax policy; and leveraging state laws that can foster
public-public and public-private partnerships to generate investments.
36
Costs and delays translate
into revenue losses for any
business or organization.

37
Chapter 6
Time for Change
G iven the significant demographic and economic shifts in California’s economy,
reform of the state’s tax structure is long overdue. Achieving comprehensive tax
reform is a long-term endeavor that requires public education and broad engagement.
This effort must start now while California continues to experience fiscal stability.
The good news is that everyone has an opinion about taxes.
We invite community organizations, civic groups, universities and colleges, chambers of
commerce, journalists, the philanthropic community, and others to join in facilitating
meaningful future conversations. Some Council members suggest before major tax
reform proposals are considered, a standard procedure should be established using the
criteria discussed in this framework.
Some Guiding Principles
To assess specific tax reform proposals, the members of the Council agreed on the
following guiding principles.
Effects on People
Promote tax fairness and equity
Budgetary and Fiscal Policy
Encourage revenue sustainability
Enhance comprehensive taxation
Promote revenue stability
Encourage systemic flexibility and adaptability
Adjust state-local alignment
Economy
Promote economic vitality
Encourage revenue sustainability
Address infrastructure, housing, and transportation needs

Compliance and Administration
Make it easier for taxpayers to comply
Ease tax administration
Ease regulatory requirements
Balancing Tradeoffs
Comprehensive tax reform has eluded policymakers because of the necessary hard choices such
reform would entail. Among the tradeoffs are:
Local Fiscal Discretion. Will reform address current local dependence on state fiscal policy?
Will local governments be given greater discretion to set their own tax and spending policy? If
local governments are given discretion to raise taxes, should state tax levies be reduced
commensurately?
Changes for the Tax on Capital Gains. If reform reduces income taxes paid by investors, will
other taxpayers be expected to make up for the foregone revenue?
Financing an Increase in Critical Infrastructure like roads. Should users—like drivers—be
expected to pay for the full cost of infrastructure improvements through user fees? Or, should
taxpayers also pay a share through higher sales and personal income taxes?
Improving Government Performance. Will improved service cost more? Can taxes be cut and
service delivery be improved? How will reform ensure improved transparency and
performance? What can be done to improve accountability?
Fostering an Improved Business Climate. Will tax reform include reductions in regulations
and compliance costs? If so, how will the changes affect Californians not directly regulated?
Who Bears What Burden? Should the poorest continue to bear the great burden of the state
not investing adequately in child care and other programs with the potential of lifting families
out of poverty?
At its heart, a tax system is a social compact detailing how to pay for the common good.
Definitions of what constitutes the common good may vary. However, people across the
political spectrum agree that California’s current tax structure does not reflect the times.
Regardless of our differences, we must work together now to fix it.
38

39
Appendix I
A Brief History of Major Tax Changes in California, 1979-2015
Since 1995, the California Legislature has considered more than 4,600 bills concerning taxation. On
average, policymakers review 245 bills per year that propose changing the way Californians are taxed.
The majority of these bills are considered in the Assembly (62 percent).
Over time, the yearly number of tax bills has declined from 368 bills in 1995 to just 85 in 2013. Personal
income tax bills are the most prevalent (2,361; 50 percent), followed by property tax (804; 17 percent)
and sales tax (768; 16 percent).1
In California, state tax collections are the primary source of state revenue. Two particular taxes, sales and
use tax, and personal income tax, historically comprise and account for the majority of all tax revenues
collected.2 The central relationship of these two taxes to the financial health of California means that any
change in them may increase or decrease state revenues, and may affect the quality of life for all
Californians.3
While there have been proposals to reform the state tax system,4 during the period this history attempts to
cover there has not been a successful major reform. According to one scholar, “everyone agrees that tax
reform is needed; it’s just that they differ on how the tax system should be changed.”5
Consequently, despite the “push and pull of the marketplace of ideas”6 about the subject of tax reform,
this 36-year history is left with “only minor tweaks to talk about”7 and offers a summary of those
proposals for change successfully enacted by the Legislature or the voters.
Prepared at the request of State Controller Betty Yee, this document presents a brief history of major tax
changes in California from 1979 to 2015.8
1These numbers are from a preliminary review of CalTax data and are most likely understated due to the incomplete categorization of the dataset. 2Research suggests that states that seek to pursue an ultimately stable course must include in their revenue streams both a retail sales tax and an income
tax. See Herwig Schlunk, “Why Every State Should Have an Income Tax (and Retail Sales Tax, Too),” Mississippi Law Journal 78, No. 3 (Spring
2009) 637-703, included in California Research Bureau’s Annotated Bibliography – Fiscal Policy and Revenue Structure (Oct. 2015). 3John Decker (2009), California in the Balance: Why Budgets Matter. Berkeley: Berkeley Public Policy Press, p. 53. Research into the relationship
between state fiscal policy and economic performance suggests that the effects of such policies on personal income tax will be contemporaneous. See
Victor Canto and Robert I. Webb, “The Effect of State Fiscal Policy on State Relative Economic Performance,” Southern Economic Journal, 54, No. 1
(July 1987) 186- 202, included in California Research Bureau’s Annotated Bibliography – Fiscal Policy and Revenue Structure (Oct. 2015). 4Concerning California’s tax history, there have been two successful tax commissions which charted major reforms (1906, 1929) and two dramatic
changes that took place outside of commissions: the Riley-Stewart initiative (1933) and Proposition 13 (1978). More recently, the California
Commission of the 21st Century (2009) made some key recommendations but was not seriously considered. See Steven M. Sheffrin, “Tax Reform
Commissions in the Sweep of California’s Fiscal History, Hastings Constitutional Law Quarterly, Vol. 37, No. 4, Summer 2010, pp. 661-688. 5Kirk J. Stark, “Houdini Tax Reform: Can California Escape its Fiscal Straitjacket?.” California Policy Options, 2011. p.1. 6John Decker, phone communication. October 2, 2015. 7Darien Shanske, Professor of Law, University of California, Davis, email communication, November 2, 2015. Professor Shanske does, however,
identify three broad points about tax reform throughout the time period that may be relevant for the reader to consider: (1) the integration of the post-
Proposition 13 state public finance system around education; (2) the consistent earmarking of revenue that serves as “piecemeal reform to earmark
more and more of the state budget”; and (3) the continued decline, over time, of the sales tax and the corporate income tax. 8The primary published resource relied upon for the preparation of this brief history is David R. Doerr (2000, 2008), California’s Tax Machine: A
History of Taxing and Spending in the Golden State, Sacramento: California Taxpayers Association. Because understandings of the term “reform” can
be different depending upon one’s perspective, we use the phrase “major tax changes” to factually describe adjustments made to the tax structure over
time that were the result of the budget process, legislation or voter approval.
Prepared by California Research Bureau, November 2015
40
1979
In the year immediately following the adoption of Proposition 13 on June 6, 1978,9 policymakers
reduced taxes, negotiated a repeal of the inventory tax, engaged in regulatory reform and nurtured the
beginning changes to the way the state taxes multinational businesses, eventually to be known more
commonly as unitary reform. Voters also played an active role in fiscal change. Passed in a special
election (74 percent), Proposition 4 (1979) added Article XIIIB to the California Constitution.10 This
measure established and defined annual appropriation limits on state and local governmental entities
based on annual appropriations for the prior fiscal year. Requiring adjustments for changes in cost of
living, population and other specified factors, any revenues the (state and local government) received in
excess of appropriations permitted were to be returned to taxpayers by revision of tax rates or fee
schedules within the two following fiscal years. At the time, experts could not estimate the expected
revenue impact of the measure, but they believed that the financial impact depended on whether state and
local governments would have access to other appropriations that were not subject to the limitations of
the measure.11
1980s Throughout the early 1980s, policymakers maintained a careful balance between revenues and
expenditures due to the expected uncertainties from implementing Proposition 13. Additional legislation
ensured the continued shift of property taxes to aid local governments on a proportional basis, using an
apportionment formula that allocates countywide property taxes to the various county jurisdictions.12
During the 1981 budget year, legislators repealed a major package of tax subsidies, and instead of
shifting property tax revenues back to schools, they initiated an effort to recapture taxes on business
personal property, boats, berths, and possessory interest in space from local government. They increased
the gas tax and passed legislation accelerating revenue collections. The recession that began in 1981
continued into 1982, and as voters passed additional inheritance tax relief (Propositions 5 and 6) and
partial indexing of state personal income tax (Proposition 7), policymakers negotiated accelerated sales
tax collections to increase revenues.
Proposition 5 (1982) amended the tax code to repeal statutes governing gift and inheritance taxes.
Expressly prohibited by this measure, gift and inheritance taxes would only be allowed as a state
“pickup” tax on decedents’ estates at rates set by a schedule of credits for state death taxes in conformity
with the Federal tax code. The Legislature was required to provide for both the collection and
administration of the “pick up” tax. Voters approved the measure (62 percent) in a primary election.13 At
the time, it was estimated that the measure would reduce state inheritance and gift tax revenues by about
$130 million in the current budget year, by $365 million in the subsequent year, and higher amounts in
the years after that. Analysts believed that repealing the gift and inheritance taxes would save the state
9For a review of the historical patterns and potential full effects of Proposition 13, see Fred J. Silva and Elisa Barbour. The State-Local Fiscal
Relationship in California: A Changing Balance of Power (San Francisco, CA: Public Policy Institute of California, 1999), included in California Research Bureau’s Annotated Bibliography – Fiscal Policy and Revenue Structure (Oct. 2015). 10The measure was supported by Paul Gann, the coauthor of Proposition 13, and Carol Hallett, Assembly Minority Leader and Member of the
Assembly, 29th District. It was opposed by the California Tax Reform Association, League of Women Voters of California, and California Labor Federation, AFL-CIO. 11Limitation of Government Appropriations California Proposition 4 (1979). http://repository.uchastings.edu/ca_ballot_props/864. Accessed 10/5/15. 12Terri Sexton, California State University, Sacramento, email communication. October 23, 2015. 13The measure was opposed by the League of Women Voters of California; California State Parent Teachers Association and California Gray Panthers.
Prepared by California Research Bureau, November 2015
41
approximately $6 million annually in administrative costs. However, any resulting reductions in state
revenue from these expected savings would result in corresponding reductions in the amount of fiscal
relief provided by the state to local governments and schools.14
A second initiative aimed at gift and inheritance taxes also passed in 1982. Opposed by the same group
that opposed Proposition 5, Proposition 6 (1982) amended the tax code to allow for the "pickup" tax on
decedents' estates to be measured by the maximum credit against federal estate taxes allowed by federal
law. Further, the combined federal and state estate tax liability could not exceed the federal tax liability
for property located in California if a state tax was not imposed. Supported by members of the Assembly,
Senate, and the Senate Finance Committee, this measure was passed by voters (64 percent). Estimates
prepared by the Legislative Analyst concerning this measure were the same as those for Proposition 5.15
Passed by 64 percent of voters in a primary election, Proposition 7 (1982) made possible the partial
indexing of state personal income tax. Amending the tax code to allow for graduated state personal
income tax brackets, these brackets would then be adjusted annually by applying an “inflation adjustment
factor” determined by the percentage change in the California Consumer Price Index. While at the time
the full percentage change was applied to selected brackets on a temporary basis, in the current year and
going forward percentage changes in excess of three percent would be utilized. The measure was
expected to reduce state personal income tax revenues by about $230 million in the current year, twice
that amount in the next year, and increasing amounts in the future. Under existing law reductions in
revenue would reduce fiscal relief provided to local governments and schools.16
In 1982, the Legislature reduced tax subsidies to local government. To balance the budget and ease the
decline toward a deficit, legislators used one-time revenues, non-resident taxation, and a ridesharing tax
credit. Tax increases, expenditure reductions, and revenue accelerations were measures discussed to
mitigate declining revenues and turn the state around in 1983. The budget compromise bill that year
included a “carry-forward” of a portion of the deficit, short term borrowing, and further reductions in tax
subsidies to local government.
Further efforts in 1984, such as expenditure freezes and reductions, balance transfers from general fund to
special funds, another “carry-forward” of the deficit, authorization of short term borrowing, and even
more reductions in local government subsidies helped bring the budget back into significant balance and
ensure a small surplus. Additionally, a set of supplemental reforms continued this positive trend,
including: expenditure reductions and reversions to the General Fund, an increase in the corporate
estimated payment percentage, accelerations of collection of withholding receipts from employers, and
sales tax prepayments.
14Gift and Inheritance Taxes (Proponent Miller). California Proposition 5 (1982). http://repository.uchastings.edu/ca_ballot_props/899. Accessed
10/5/15. 15Gift and Inheritance Taxes (Proponent Roger). California Proposition 6 (1982). http://repository.uchastings.edu/ca_ballot_props/901. Accessed 10/5/15. 16The voters had a second chance to index personal income taxes to the California Consumer Price Index in 1982. Whereas a similar effort had failed in 1980 (Proposition 9), this revised measure was presented to the electorate for their consideration a couple of years later in 1982. Major support for
Proposition 7 came from Howard Jarvis and the Index the Income Tax Committee, the Lieutenant Governor, and a member of the senate. Major
opposition came from a group named Californians for a Fair Index, a mathematics professor at California State University, and an assemblymember.
Prepared by California Research Bureau, November 2015

42
Legislators undertook renewed efforts toward federal conformity, closing loopholes, and enacted a
trigger mechanism to conditionally increase sales tax.
As school finance started to become a more prominent issue, legislators took the following measures:
Increased the sales tax rate;
Repealed the candy sales tax exemption;
Made additional efforts to close loopholes;
Reduced and repealed numerous personal income tax credits and deductions;
Accelerated remittances for property tax collections;
Continued efforts at unitary tax reform;
Evaluated tax amnesty;
Developed enterprise zones;
Considered a flat tax.
Unlike earlier years, there were no budget deficits in the mid-to late 1980s. During this brief 7-year span
of positive revenues, policymakers focused on unitary tax and property tax assessment reforms.
However, hitting the appropriation limits toward the end of the decade meant tax refunds and school
finance again became the primary focus. A couple of key propositions enacted important tax changes in
1986: Proposition 47 and Proposition 62.
Passed with 82 percent of the vote in a primary election, Proposition 47 (1986) changed the California
Constitution to provide for the allocation of vehicle license fee taxes to counties and cities.17 At the time,
the state was not required by the Constitution to allocate all revenue from vehicle license fee tax to local
governments, only specified portions of the revenues. This measure now required all revenues from
these taxes to be allocated to counties and cities, with limited exceptions.
The measure was expected to have no direct fiscal effect. Rather, it prevented the Legislature from
changing the law to take any portion of vehicle license fees away from counties and cities. However, the
state still could reduce other forms of aid to local government or change the existing formula for dividing
vehicle license fee revenues between counties and cities.18
Proposition 62 (1986) added sections to the government code restricting new or increased taxation and
revenue use by local governments and districts. Proposition 62 garnered 58 percent of the vote in a
general election and required the following process with regard to taxes: approval by two-thirds vote of
legislative body, submission of proposed tax to electorate, and approval by majority of voters concerning
the imposition of special taxes, defined as taxes for special purposes. This measure featured language
governing election conduct. It was believed that the measure could potentially result in the reduction of
tax revenues to local agencies.19
17The measure was supported by the California Taxpayers' Association, Santa Clara County President of the California State Sheriffs’ Association, and
a senator. 18Allocation of Vehicle License Fee Taxes To Counties And Cities. California Proposition 47 (1986). http://repository.uchastings.edu/
ca_ballot_props/952. Accessed 10/5/15. 19The measure was supported by Howard Jarvis and the California Tax Reduction Movement; Deputy Assessor of Los Angeles County, and a senator. It was opposed by the League of Women Voters of California, California Tax Reform Association, and Federated Firefighters of California. Taxation.
Local Governments And Districts. California Proposition 62 (1986). http://repository.uchastings.edu/ca_ballot_props/967. Accessed 10/5/15.
Prepared by California Research Bureau, November 2015

43
Despite a lack of yearly budget deficits, economic volatility,20 that is, the effect of increases and
decreases in revenues, led legislators during this time to establish more rigidity in the budget process to
mitigate the volatility. In 1987, to avoid slipping into deficit spending and balance the budget, the notion
of the supplemental roll21 and the end of omnibus trailer bills returned.
The last two years of the decade found legislators trying their best to reverse an impending economic
decline. Bills introduced to suspend tax indexing, adopt conformity items, defer the carryforward, and
accelerate tax collections were voted down. In their place, a package of targeted tax reductions including
sales tax exemptions for bunker fuel, motion picture production services, childcare facilities and senior
citizens emerged.
In 1988 school funding was in sharp focus. In a general election, Proposition 98 (1988) passed with 51
percent of the vote. An initiative which amended the California Constitution and the education code to
establish a minimum level of state funding for school and community college districts, Proposition 98
included provision for transferring to such districts, within limits, state revenues in excess of State's
appropriations limit and exempting these excess funds from the limit. Excess funds were to be used
solely for instructional improvement and accountability. Schools were required to report student
achievement, drop-out rates, expenditures per student, progress toward reducing class size and teaching
loads, classroom discipline, curriculum, quality of teaching, and other school matters. The measure was
expected to cost of $215 million for the current year, and would have no excess revenues to transfer to
schools and community colleges. Schools would be impacted by the requirement to produce School
Accountability Report Cards.22
Since the mid-1980s, legislators had been seeking property tax reforms. The waning of the decade
witnessed a set of adjustments to these taxes that included changes in:
Purchase price presumption, full cash value and fair market value;
Cable television assessment;
Mining appeals;
The property tax assessment process.
In 1988, voters increased the tobacco tax. Passed in a general election by 58 percent of the vote,
Proposition 99 (1988) amended the California Constitution and the tax code to impose a yearly
additional tax upon cigarette distributors for each cigarette distributed. Other tobacco products were
subject to this additional tax, equivalent to combined rate of tax imposed on cigarettes. Funds raised by
these taxes were earmarked for treatment, research of tobacco-related diseases, school and community
health education programs about tobacco, fire prevention, and environmental conservation and damage
restoration programs. The funds from this tax were not to be subject to appropriations limits. While this
measure would increase revenues by $300 million in the current year and by twice that amount in the
20For a fairly recent evaluation of state revenue variability using a volatility model, see Thomas Garrett, Evaluating State Tax Revenue Variability: A Portfolio Approach (St. Louis, MO: Federal Reserve Bank of St. Louis, February 2006), included in California Research Bureau’s Annotated
Bibliography – Fiscal Policy and Revenue Structure (Oct. 2015) 21“The supplemental roll provides a mechanism for placing property subject to Proposition 13 reappraisals due to change in ownership or completed new construction into immediate effect. Changes in ownership or completed new construction are referred to as ’supplemental events’ and result in
supplemental tax bills that are in addition to the annual property tax bill.” For more information see https://www.boe.ca.gov/proptaxes/faqs/
suppassessment.htm. Accessed 11/13/15. 22Major supporters of Proposition 98 included the California Teachers Association, California State Parent Teachers Association, State Superintendent
of Public Instruction, and Association of California School Administrators. Opposed to the measure were the Governor, California Commission on
Educational Quality, and California Taxpayers’ Association. School Funding California Proposition 98 (1988). http://repository.uchastings.edu/ca_ballot_props/979. Accessed 10/5/15.
Prepared by California Research Bureau, November 2015

44
second year, these revenues would decline gradually in later years. The measure would not to affect sales
and excise tax revenues to local governments.23
As the decade came to a close, the implementation of unitary reform continued. To prevent tax agency
abuses and to ensure better service from the Board of Equalization and Franchise Tax Board, a long
awaited taxpayer bill of rights passed. To avoid difficulties with federal/state tax conformity, the
Governor signed a bill in 1989 to address outstanding issues.
1990s
For 1990, an unexpected decline in revenues required Legislative compromises to raise them.
Implementation of withholding on property sales by non-residents, a cut in the renter’s credit, revision of
policy concerning unclaimed property of Californians who die without legal heirs, and the authorization
of counties to impose various taxes were forwarded as remedies. Emphasis on business climate issues
resulted in a foreign purchases tax and a push toward diverse business regulations.
Voters weighed in on the congested state of California’s transportation system at the ballot box, passing
taxes on truck weight fees and fuel. Proposition 111 (1990) was approved by the Legislature and passed
with 52 percent of the vote in a primary election. This measure enacted a statewide traffic congestion
relief program and updated the spending limit on state and local government to better reflect the needs of
Californians in terms of mass transit, health care, services for the elderly, and programs. It included
provisions to ensure that school appropriations remain constant and that any excess revenues above the
limits are shared between taxpayers and education.24
Further tax increases were necessary in the wake of a subsequent downturn in revenues in 1991.
Policymakers again worked to reform the property tax shift initiated in 1979. The sales tax rate, vehicle
license fees, alcohol and beverage taxes, the alternative minimum tax, and personal income tax rates
were increased. Higher income taxpayers were excluded from the renter’s credit, net operating loss tax
deductions for businesses rose, and small business health insurance tax credits were delayed. Measures to
improve the business climate included an extension of the research and development tax credit.
Conformity with federal tax policy hiked taxes.
In 1992, efforts to reform the property tax allocation formula continued. Policymakers approved
measures to shift property taxes from cities, counties, and special districts to schools. Tax relief for this
year was thinner than in previous years, and it included credits and exemptions for forest fire victims,
child care facilities, and the blind. Legislators agreed to an estimated tax increase paid by multinational
corporations. A roll back of increases on taxes on fuel oil used aboard vessels was achieved.
23Major supporters of Proposition 99 included a retired Surgeon General, the American Cancer Society, The Wilderness Society, Attorney General,
State of California, American Lung Association, and California Association of School Health Educators and Health Teachers. Opposed to the measure were Paul Gann and the People’s Advocate, the Latino Peace Officers Association, a couple of assembly members and the Chair of the Governmental
Organization Committee, as well as the Vice Chairman of the Ways and Means Committee. Cigarette and Tobacco Tax. Benefit Fund. Initiative
Constitutional Amendment and Statute. California Proposition 99 (1988). http://repository.uchastings.edu/ca_ballot_props/980. Accessed 10/5/15. 24Major supporters of this measure were the California Association of Highway Patrolmen, California Chamber of Commerce, Governor, California Taxpayers Association, and American Association of Retired Persons. Opposed to the measure were a Los Angeles County Supervisor, an assemblymember, and an economic consultant. The Traffic Congestion Relief And Spending Limitation Act Of 1990 California Proposition 111 (1990).
Prepared by California Research Bureau, November 2015

45
Once again, the 1993 budget compromise included a shift in property tax from cities and counties to
schools to attain fiscal balance. A bundle of measures contributed to this cause, including an extension of
the sales tax rate increase that had been set to expire, and the repeal of the renter’s tax credit. Additional
changes were: spending reductions, cash deferrals, rollover of the deficit, and the shift of special fund
monies.
There was legislation to improve business climate, such as:
Exempting new manufacturing equipment from sales tax;
Offering income, bank and corporation tax credits for investment in equipment;
Reducing the tax rate for corporations with 100 shareholders or less;
Extending the research and development credit;
Exempting specified gains on sales of small business stock.
Discussion of the nuances of unitary reform returned this year. These discussions were accompanied by
increases in the cigarette tax, abatements to local taxes, and the modification of tax treatment of net
operating losses.
Secure, adequate funding for public safety at the local level was on the minds of voters in 1993. Passed
in a special election with 58 percent of the vote and approved by the Legislature, Proposition 172 (1993)
provided a dedicated revenue source for public safety purposes. Revenue would be distributed to cities
and counties for police, sheriffs, fire, district attorneys and corrections purposes. The measure generated
$714 million in the first year, and $1.5 billion annually, in additional sales tax revenue for counties and
cities.25
Closure of the budget gap in 1994 was handled by rolling over the deficit, but complicated by short term
borrowing and federal/state tax conformity issues. Policymakers passed an adoption credit, considered a
new investment tax credit, and recognized a new form of business (the limited liability company).
Whereas in prior years policymakers had relied on static revenue models, these models were increasingly
incapable of accurately predicting future economic circumstances and dynamic revenue forecasting
methods were adopted in their place.26
Compromises of a different sort took center stage in the mid-1990s. Increased revenues from 1995-1998
shifted the debate from increasing declining revenues to how to spend surplus funds in the budget. Some
legislators thought the extra funds should be returned to tax payers, while others wanted to fulfill unmet
needs in existing programs or create new ones. Despite increased funds overall, a lack of consensus
caused a set of temporary tax brackets to expire. This led to a significant reduction in income tax
revenues.
A key turning point in taxation during this time was the recommendation of a three-year, phased in
reduction of personal income, bank and corporation tax rates. Property taxes witnessed significant
changes concerning possessory interest in property, escape assessments, interest rates on property tax
25Major support for the measure included the Orange County Sheriff-Coroner, a senator, the California State Sheriffs’ Association, Los Angeles Police Department, Los Angeles County Sheriff, California Police Chiefs’ Association, and California Fire Chiefs’ Association. Opposed to the measure were
a couple of assemblymembers and the Center for the California Taxpayer. Local Public Safety Protection and Improvement Act of 1993. California
Proposition 172 (1993). http://repository.uchastings.edu/ca_ballot_props/1087. Accessed 10/5/15. 26A more recent use of a dynamic panel-data model to develop a measure of business cycle related revenue gap is featured in Sunjoo Kwak, “The
Dynamics of State Fiscal Behavior Over the Business Cycle: Are State Fiscal Policies Procyclical?” The American Review of Public Administration
44, No. 5, (September 2014) 550-574, included in California Research Bureau’s Annotated Bibliography – Fiscal Policy and Revenue Structure (Oct. 2015).
Prepared by California Research Bureau, November 2015

46
refunds, and assessment appeals. Confrontations between taxpayers and assessors over assessment
practices led to attempts to reform, improve, and standardize how property is assessed for tax purposes.
Unresolved concerns about property taxes and assessment practices led voters to pass a measure that
limited the authority of local governments to impose taxes and property-related assessments, fees, and
charges. Passed by 57 percent of voters in a general election, Proposition 218 (1996) enacted a
constitutional amendment that requires the approval of a majority to increase general taxes and reiterated
that two-thirds of voters must approve any special taxes. Assessments, fees, and charges must be
submitted to property owners for approval or rejection, after notice and public hearing. Assessments are
limited to the special benefit conferred. Fees and charges are limited to the cost of providing the service
and may not be imposed for general governmental services available to the public. Revenue losses in
excess of $100 million a year were expected as a result of the measure, and long term losses even
greater.27
Cuts to the bank and corporation tax and a set of targeted tax measures were negotiated in the wake of
renewed budget difficulties in 1996. Included in this set of business-related measures were:
Increases in the research and development credit and small business expensing;
Standardization of the rate associated with the exclusion of foreign dividends;
Exemption of aircraft repairs from sales tax;
Reduction of the minimum franchise tax on new small businesses;
Extension of the investment credit for manufacturers.
Individuals saw increases in the amount they could claim for long term medical care expenses and
insurance costs. Federal/state tax conformity addressed moving issues, valuation of assets at recent
market price (“mark-to-market” accounting), and corporate owned life insurance policies. Continued
concern about aggressive enforcement by tax agencies led to legislation that favored business climate
issues for exhibitors who visit California for trade shows. The source tax for non-resident former
California pensioners was terminated this year.
Success with collective compromise in 1997 meant that the budget package passed on time. It featured an
increase in the credit for dependents and an exemption for the alternative minimum tax. The budget
included measures aimed at federal/state tax conformity focused on the research and development tax
credit, capital gains, and corporations with 100 shareholders or less. Policymakers expanded the income
limits deductible in individual retirement accounts and passed a variety of incentives aimed at fostering
economic development. Business climate measures extended the bunker fuel sales tax exemption and
authorized a capital investment incentive for qualified manufacturing facilities.28
27Major supporters of the measure included the Howard Jarvis Taxpayers Association, Consumers First, Paul Gann’s Citizens Committee, California
Taxpayers Association the Council of Sacramento Senior Organizations, and Alliance of California Taxpayers and Involved Voters. Opposed were the League of Women Voters of California, California Police Chiefs’ Association, California Fire Chiefs’ Association, Congress of California Seniors,
California Teachers Association, and California Association of Highway Patrolmen. Voter Approval for Local Government Taxes. Limitations on Fees, Assessments, and Charges. California Proposition 218 (1996). http://repository.uchastings.edu/ca_ballot_props/1138. Accessed 10/5/15. 28For an in-depth perspective on how policymakers may work to reduce revenue variability from business cycle swings, see Russell Sobel and Gary A.
Wagner, “Cyclical Variability in State Government Revenue: Can Tax Reform Reduce It?” State Tax Notes, August 25, 2003, 569, included in California Research Bureau’s Annotated Bibliography – Fiscal Policy and Revenue Structure (Oct. 2015).
Prepared by California Research Bureau, November 2015

47
Tax issues in 1998 focused on the vehicle license fee and a host of other measures. Rising revenues led
policymakers to again negotiate a compromise between spending the increase and distributing the
surplus back to taxpayers. This year, reaching a compromise took longer than the year before. The
budget included a number of tax relief provisions:
Reduction of the minimum tax for small businesses;
Increase in the research and development credit;
Expansion of manufacturers investment credit;
Exemption for property used in production services for film and video;
Increase in deduction for health insurance for the self-employed;
Permanent extension of employer child care credits;
Sales tax exemption for property used in space launches;
Modification of enterprise zones;
Equal tax treatment of perennial plants used in food production.
Important legislation passed to ensure the internet would remain tax free for 10 years, expand a use tax
incentive for farmers to keep their land in agricultural use, and authorize a formula for the assessment of
possessory interests for airlines. Federal/state conformity legislation involved the estate tax interest rate.
Conversely, voters focused on using a tax on tobacco to fund programs on smoking prevention and early
childhood development. Exempt from the Proposition 98 requirement that dedicates portion of general
tax revenues to schools, Proposition 10 (1998) was passed by 50 percent of voters in a general election as
a constitutional amendment. To provide funding for state and county commissions and programs, monies
were raised by an additional $.50 per pack tax on cigarette distributors and an equivalent increase in state
tax on distributed tobacco products. The initiative created a state commission to provide information and
materials and to formulate guidelines, and created county commissions to develop strategic plans with an
emphasis on the new programs. New revenues for early child development from the measure were
expected to amount to $400 million the first year, and $750 million annually to be allocated to the new
state and county commissions for the new program.29
As the decade came to a close,30 the vehicle license fee tax cut was increased, along with the credit for
research and development. Whereas previously small businesses were required to pay a minimum
franchise tax, this tax was completely eliminated. The tax exclusion for capital gains was made
permanent and the deduction for health insurance for the self-employed was increased in conformity
with federal tax policy.
29Major supporters of the measure were the I Am Your Child Campaign, American Cancer Society, California School Boards Association, and a
former Surgeon General of the United States. Opposed to the measure were the Alliance of California Taxpayers & Involved Voters, California
Manufacturers Association, a school board member, a physician, a teacher, and a business owner. State and County Early Childhood Development Programs. Additional Tobacco Surtax. California Proposition 10 (1998). http://repository.uchastings.edu/ca_ballot_props/1162. Accessed 10/5/15. 30For a characterization of state and local finance since Proposition 13, see Michael A. Shires, Patterns in California Government Revenues Since
Proposition 13 (San Francisco, CA: Public Policy Institute of California, 1999), included in California Research Bureau’s Annotated Bibliography – Fiscal Policy and Revenue Structure (Oct. 2015).
Prepared by California Research Bureau, November 2015

48
2000s
Surplus monies in the budget drove the reductions, increases, extensions, and exemptions that continued
into 2000. A prominent feature during these years was the use of trailer bills as a vehicle for making tax
changes. Spending increases and tax reductions continued and the Legislature accelerated phased-in car
tax reductions. Tax trailer bills in 2000 included:
Increase in the research and development credit;
A tax credit for teachers based on years of service;
A tax credit for child care expenses for low and middle income taxpayers;
An increase in the net operating loss that could be carried forward for businesses;
A tax credit for donation of land to public agencies and non-profits;
Property tax relief for low income seniors;
A tax credit for persons needing long term care;
A sales tax exemption in rural areas for purchases of machinery and equipment;
Taxable income exclusion of graduate level school assistance.
Other tax bills featured: the expansion of innocent spouse relief, an increase to the tire tax, and capping
of the tax on boxing and wrestling admissions. Efforts aimed to ensure conformity of state taxes to
federal taxes were not passed. Efforts to tax electricity generators, based on consumer cost of electricity,
failed.
Although the budget was balanced in 2001, anticipated shortfalls caused uncertainty. Despite this
uncertainty, a substantive package of tax reforms passed. These included a restructuring of the sales tax
“trigger” mechanism and sales tax exemptions for:
Liquid petroleum gas purchased through main gas supply pipelines;
Farm and forest machinery and equipment;
Diesel fuel used in farming and food processing;
Thoroughbred horses used for breeding.
The appeals process for property taxes changed, allowing owners more time to appeal. Property tax relief
increased for low income seniors. Other efforts at property tax reform, such as taxes on electricity
generators and efforts to allow trials to start from the beginning of the process (de novo) in property tax
appeals, failed.
2001 is notable as the beginning of the “structural deficit” in California’s budgetary history. This term
relates to the difference between projections of revenues and expenditures in the context of normal and
cost of living increases, as well as automatic spending formulas built into the budget.31 Unsustainable
spending of temporary tax revenues, the “auto-pilot” nature of initiatives, collective bargaining contracts,
cost of living increases, debt service costs, and an added decline in revenues in the early 2000s brought
on by the structural deficit forced legislators to find additional ways to balance the budget.
31See Robert D. Ebel, ed., The Oxford Handbook of State and Local Government Finance, New York: Oxford University Press, 2012, included in California Research Bureau’s Annotated Bibliography – Fiscal Policy and Revenue Structure (Oct. 2015) for a more complete evaluation of the
persistent problems of state and local deficits in governmental fiscal systems.
Prepared by California Research Bureau, November 2015

49
In 2002, a rapidly rising structural deficit caused a general suspension of spending. Tax increases were
proposed for cars and cigarettes. Budget negotiations stalled, and the budget did not pass until August.
The following measures enacted in 2002 reflected this continuing concern about the structural deficit:
The net operating loss “carry forward” deduction was suspended;
Suspension of the teachers tax credit;
Withholding on stock options and benefits increased;
Real estate sales tax withholding expanded to include state residents;
Limited amnesty to delinquent taxpayers;
Bad debt losses at banks were actualized.
Businesses were affected. Workers compensation benefits and unemployment insurance premiums
increased. Deductions for executive salaries and lobbying expenses were denied in conformity with
federal tax law.
In 2002, more funding was needed for California’s transportation system. This resulted in a sales and use
tax measure on vehicle fuel, which provided increased revenues for public transit, streets, roads, and
highways. Approved by the Legislature and passed by 69 percent of voters in a primary election,
Proposition 42 (2002) required that state sales and use taxes revenues on sale of motor vehicle fuel were
to be used for public transportation, city and county street and road repairs and improvements, and state
highway improvements. The measure required a two-thirds vote of the Legislature to suspend or modify
percentage allocations of revenues. The measure was expected to raise $1.4 billion in the first year, with
revenues increasing in the following years.32
An even higher estimated structural deficit in 2003 led to continued concern. Again, the solution focused
on the car tax, which was increased administratively despite legislative opposition. Lack of a trailer bill
meant that tax changes were part of the budget package. Besides the increased car tax, parcel taxes on
real property in rural areas rose, water rights holders now paid an annual tax, and hunters and fisherman
were hit with increases in licensing fees. How best to tax services received stakeholder attention during
2003, but the idea did not catch on.
Further, legislators passed bills to curb the use of tax shelters and underreporting of taxes, increased the
sales tax on television sets and computer monitors, and sought to charge employers new taxes on health
care. They tried to require local governments to fund public pension obligations with property tax
increases, to make changes to how multinational corporations account for former domestic enterprises,
and have owners of non-residential property pay higher taxes.
Reduction of the premium costs for workers compensation insurance followed in 2004 as legislators
sought to make California friendlier for business. In response to the structural deficit situation,
policymakers reduced spending and increased borrowing to keep the state budget in balance. Legislators
managed to again shift property tax monies away from local governments to the schools to meet the
state’s educational needs, suspend tax credits for teachers and natural heritage, and alter taxation of
32Major supporters of Proposition 42 included the California Highway Patrol, California State Automobile Association, California Organization of Police and Sheriffs, California State Office of Emergency Services, a former member of the California State Board of Education, and President
California Taxpayers’ Association. Opposed to the measure were the California Teachers Association, Congress of California Seniors, Health Access
of California, California Tax Reform Association, Latino Issues Forum, and California State Firefighters’ Association. Transportation Congestion Improvement Act. Allocation of Existing Motor Vehicle Fuel Sales and Use Tax Revenues for Transportation Purposes Only. California Proposition 42
(2002). http://repository.uchastings.edu/ca_ballot_props/1200. Accessed 10/5/15.
Prepared by California Research Bureau, November 2015

50
property purchased outside of California to benefit the state. Efforts to increase the property tax rate on
commercial property to benefit schools received attention but did not move forward.
Tax amnesty was in focus in 2004. Passed as part of the trailer bill package, taxpayers could obtain
waivers for late payment penalties if they cleaned up any unreported taxes, if they participated in an
installment repayment plan. Attempts to forestall the expiration of the manufacturers’ investment tax
credit on the cost of new manufacturing equipment were unsuccessful.
Additionally, policymakers sought to increase the size of the General Fund reserve as a buffer against
future economic uncertainty and passed a legislative constitutional amendment that would have increased
size of state “rainy day” fund from 5 percent to 12.5 percent of the General Fund. The proposed measure
called for a portion of the yearly deposits from the increase to be saved in a special fund for potential and
future economic downturns. It allowed for any remaining funds to be available in an emergency for
education, infrastructure, and debt repayment. The measure would provide $16 billion in higher revenues
the first year, and increased revenues thereafter. While the measure was believed to stabilize state
spending, it also meant greater budgetary spending to balance out potential temporary tax relief, debt and
borrowing, as well as infrastructure projects. The measure, Proposition 1A (2004), was rejected by 65
percent of voters.33
In 2005, a reduced structural deficit initially meant significant reductions in proposed spending, but
incoming higher revenues eliminated the need to make cuts. This year, minor changes in taxation took
place in the form of a conformity bill and a bill changing the way commercial aircraft is assessed.
The budget passed on time in 2006 in spite of a continuing structural deficit, the result of unexpected
higher revenues. The earlier suspension of the teacher tax credit continued. Changes were made to the
way property (vehicles, boats, and planes) purchased outside of California is taxed. Bills requiring the
development of property tax assessment valuation tables as well as joint income tax status for registered
domestic partners passed. Initiatives that failed to become laws included: taxing the rich to pay for
universal preschool, taxing cigarettes and oil produced in California to subsidize energy alternatives, a
statewide parcel tax to fund education, and increasing business taxes to fund political campaigns.
Budget negotiations in 2007 were strained and late. The teacher tax credit ended, changes in taxation of
fractionally owned aircraft were negotiated as well as changes in how to tax limited liability companies.
Vehicle registration fees increased. Foster children were included in the parent-child definition when
reassessing property tax and change-of-ownership. Reform legislation passed for the unclaimed property
program. This legislation required the state to notify owners when assets are seized.
33The measure was supported by the California Taxpayers’ Association, California State Sheriffs’ Association, California Secretary of Education,
California Chamber of Commerce, Senior Advocates League, and California Alliance for Jobs. Major opposition to the measure included the Congress of California Seniors, California Faculty Association, Consumer Federation of California, Health Access California, United Nurses Associations of
California/Union of Health Care Professionals, and Older Women’s League of California.
State Budget. Changes California Budget Process. Limits State Spending. Increases “Rainy Day” Budget Stabilization Fund. California Proposition 1a (2009). http://repository.uchastings.edu/ca_ballot_props/1294. Accessed 10/5/15. For a summary of the relationship between state and local fiscal
concerns from Proposition 13 to Proposition 1a, see Elisa Barbour, State-Local Fiscal Conflicts in California: From Proposition 13 to Proposition 1A
(San Francisco, CA: Public Policy Institute of California, December 2007), included in California Research Bureau’s Annotated Bibliography – Fiscal Policy and Revenue Structure (Oct. 2015).
Prepared by California Research Bureau, November 2015
51
Revenues declined in 2008. An inability to effectively estimate the size of the budget’s structural deficit
led to continued turmoil. Tax changes this year included:34
20 percent penalty on corporate taxpayers with unpaid tax liabilities;
Business tax credits reduced to aggregate of 50 percent of tax liability;
Suspension of net operating loss carryforwards for the current and next fiscal year;
Acceleration of the percentage of estimated tax payments;
Elimination of property tax relief for low income seniors and Californians with disabilities.
Significant differences between structural deficit projections caused continued consternation during the
2009 budget process. It led to the passage of legislation that severely cut programs and services.
Homeowners received some assistance by the authorization of a homeowner’s tax credit.
The following temporary two year tax changes were passed:35
Increase in sales tax rate by 1 percent;
Increase in personal income tax rate by .25 percent;
Increase in car tax rate to 1.15 percent;
Reduction of the dependent exemption credit;
A gross premium tax of 2.35 percent enacted on selected managed care health plans.
Businesses were affected by the temporary suspension of the net operating loss for two years, a new
employee hiring credit, and a new film production credit. To provide for proper acknowledgement of the
parent/subsidiary relationships that exist among companies, business tax credits concerning the unitary
nature of companies were changed. The credit could be assigned, for tax purposes, to other members of
the same reporting group.
2010-present
The unrelenting structural deficit from previous years signified the continuance of spending cuts into
2010. Legislators engaged in vigorous efforts to find ways to increase revenues. In turn, taxpayers sought
to limit legislator’s attempts to increase taxes by making sure that tax-like fees received the same level of
scrutiny as taxes. At the voting booth, for example, Proposition 26 (2010) mandated a supermajority to
pass a range of fees, charges, levies, and tax allocations that previously only required a simple majority.
This proposition required certain state and local fees, specifically those that impact society or the
environment as a result of the potential fee payer’s business activities, to be approved by a two-thirds
vote.36 The purported impact of this change was decreased revenues in the range of billions of dollars per
year, along with anticipated repeals of taxes and fees that would cost the General Fund an additional $1
billion per year.
34“A Year Dominated by Tax Talk, but Overt State Tax Increase Proposals Are Rejected, CalTax Year in Review: 2008,” http://www.caltax.org/
Year_in_Review_2008.pdf. Accessed 10/30/15. 35“For Tax and Fiscal Policies, 2009 was a bad year, CalTax Year in Review: 2009,” http://www.caltax.org/Year_in_Review_2009.pdf. Accessed 10/30/15. 36For an in-depth review of the debate concerning taxes vs. fees and how best to navigate the policy issues surrounding Proposition 26, see Joseph
Henchman, How Is the Money Used? Federal and State Cases Distinguishing Taxes and Fees (Washington, D.C.: Tax Foundation, March 2013), Kurtis J. Swope and Eckhard Janeba, “Taxes or Fees? The Political Economy of Providing Excludable Public Goods,” Journal of Public Economic
Theory 7, no. 3 (2005): 405-26., and Understanding Proposition 26: A Sponsor’s Guide to California’s New Tax Structure (Sacramento, CA:
California Taxpayers Association, August 2011), included in California Research Bureau’s Annotated Bibliography – Fiscal Policy and Revenue Structure (Oct. 2015).
Prepared by California Research Bureau, November 2015

52
In 2010, the Legislature passed the following minor set of changes in a set of trailer bills:37
Suspension of the net operating loss carryover and carry back;
Adjustments to the 20 percent penalty on corporate taxpayers with unpaid tax liabilities;
Changes to the way intangible sales are sourced for tax purposes;
Services provided by nursing homes and other similar service providers subject to tax;
Reporting of use tax from personal income tax made permanent;
Increase in liquor license fees;
Homeowners’ tax credit reauthorized.
Further cuts and funding shifts from the state to the counties took place in 2011. As the state sought to
overcome the impacts of the Great Recession, much discussion took place about tax reform options to
promote fiscal recovery.38 Concerning taxes, the Legislature passed a new sales tax for online retailers.39
Additional legislation promoted conformity between the state and federal tax codes.
A central topic of economic policy discussion in 2012 was the issue of raising revenues through tax
increases. Although a number of propositions on the ballot would increase taxes, a key initiative,
Proposition 30, successfully raised much needed revenues. Passed by 55 percent of voters in a general
election, the constitutional amendment imposed the following temporary measures:
Increased taxes on individual earnings over $250,000 for seven years;
Increased sales tax rates by .25 percent for four years;
Allocated temporary revenues to K-12 schools and community colleges;
Barred the use of temporary funds for school administrative costs;
Guaranteed funding for public safety services affected by realignment.
The measure was expected to increases revenues over the future by around $6 billion on an annual basis.
Additional funds would be available from this measure for state budget programs.40
37The measure, which received close to 53 percent of the vote, was supported by the California Taxpayers Association, Howard Jarvis Taxpayers
Association, Wine Institute, and Americans for Tax Reform. Opposed were the California Tax Reform Association, League of Women Voters of
California, American Lung Association, Sierra Club, Peace Officers Research Association of California, California League of Conservation Voters, and California Association of Professional Scientists, as well as numerous other health, environmental, civic, public safety, labor, education, consumer and
government organizations. “Taxpayers Send Message of ‘No New Taxes’ to Capitol as Gimmick-Filled State Budget Unravels, CalTax Year in
Review: 2010,” http://www.caltax.org/Year_in_Review_2010.pdf. Accessed 10/30/15. 38Discussion of the options before California in 2011 concerning tax reform are encapsulated in Joseph Henchman, “Recent State Tax Reforms in the
United States and Opportunities for California at a Time of Fiscal Challenge,” testimony, February 2, 2011, before California Senate Select Committee
on Recovery, Reform and Realignment, included in California Research Bureau’s Annotated Bibliography – Fiscal Policy and Revenue Structure (Oct. 2015). 39For more information on the tax treatment of internet purchases, see Ronald C Fisher, State and Local Public Finance, New York and London: Taylor & Francis Group, 2016, included in California Research Bureau’s Annotated Bibliography – Fiscal Policy and Revenue Structure (Oct. 2015) 40The broad base of supporters of the measure included the Governor, League of Women Voters, California Democratic Party, California Teachers
Association, California State Council of Service Employees, California School Employees Association, American Federation of Teachers, California Federation of Teachers, and a whole host of public safety associations. Major opposition included the Howard Jarvis Taxpayers’ Association, Small
Business Action Committee, California branch of the National Federation of Independent Business, California Republican Party, and Sacramento
Taxpayers Association.Temporary Taxes to Fund Education. Guaranteed Local Public Safety Funding. California Proposition 30 (2012). http://
repository.uchastings.edu/ca_ballot_props/1309. Accessed 10/5/15.
Prepared by California Research Bureau, November 2015

53
In addition to the tax increases associated with Proposition 30, there were a few other tax related
measures in 2012:41
Extension of the sales tax exemption on marine fuel;
Imposition of a local car tax in San Francisco;
A new state tax on fire prevention went into effect;
A tax on lumber and engineered wood products.
Higher than expected revenues in 2013 led to a renewed discussion among lawmakers about how best to
spend these excess funds. Specifically concerning taxes, the following measures were part of an
economic development plan that the Governor proposed and approved after the state budget passed in
June:42
Sales and use tax exemption for manufacturing, and research and development equipment;
Employment tax credit via Franchise Tax Board;
Investment and employment tax credit via the Office of Business and Economic Development.
Legislation did not pass this year to bring federal and state tax structures into conformity. In 2013,
significant debate occurred about the possibility of a split-roll property tax system. But no legislation was
passed to support it or to make changes to Proposition 13.43
Budget negotiations in 2014 went smoother than in previous years. Higher than expected collections of
personal income tax were a welcome surprise. Tax changes in 2014 included:
Exemption of space flight property from local taxes;
Extension of income exclusion for discharged debt on a principal residence;
Increase in the tax credit for “California Competes”;
Expansion/extension of film and television tax credits;
Transparency measure for parcel taxes;
Tax credit for California-based Department of Defense bomber project;
Expansion of the aerospace tax credit;
Conformity to the Federal definition of limited liability companies employees;
Businesses were required to file tax returns electronically.
Unsuccessful proposals for new taxes in 2014 were: carbon tax, oil production tax, and increased
corporation taxes.
41‘Governor’s Tax Initiative Dominated 2012,” CalTax Year in Review,” http://www.caltax.org/resources/2012_year_in_review.html. Accessed
11/2/15. 42“2013 – The Gathering Storm,” CalTax Year in Review, January 3, 2014,” http://caltax.org/resources/2013_year_in_review.html. Accessed 10/30/15. 43“An Anticlimactic Election Year ends with Growing Talk of Future ‘Tax Reforms,’ CalTax Year in Review: 2014,” http://caltax.org/
resources/2014_year_in_review.html. Accessed 10/30/15.
Prepared by California Research Bureau, November 2015
This page intentionally left blank.
54
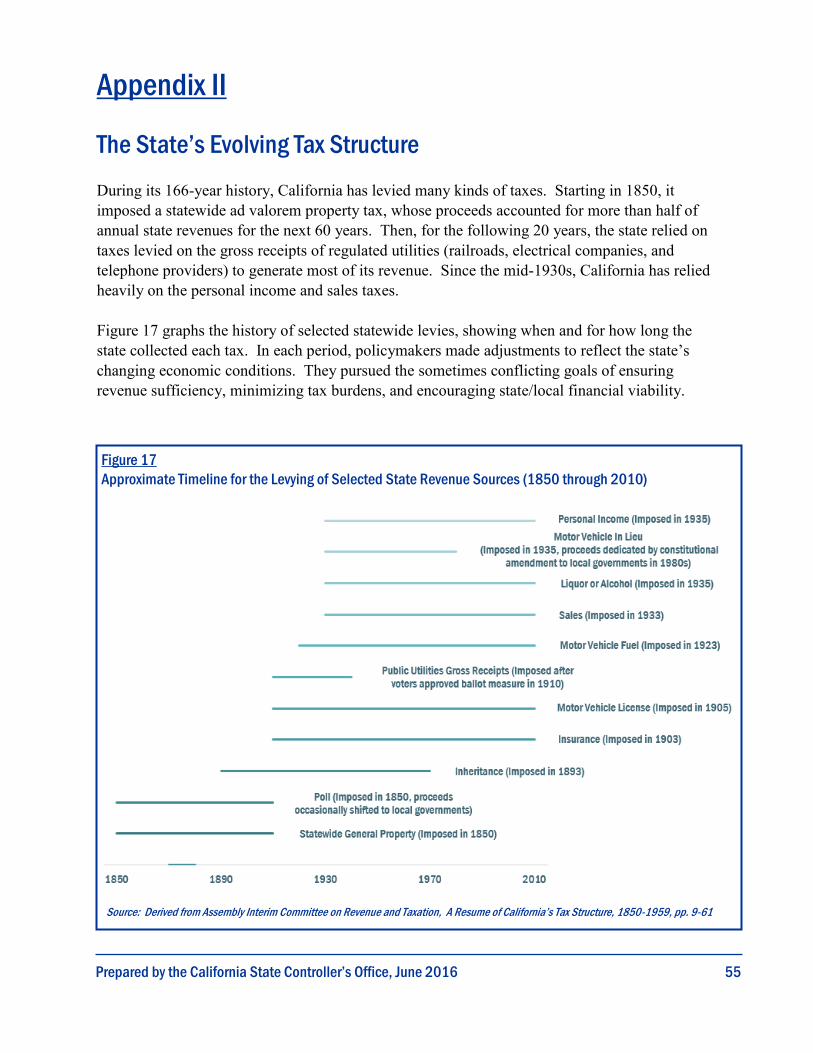
Appendix II
The State’s Evolving Tax Structure
During its 166-year history, California has levied many kinds of taxes. Starting in 1850, it
imposed a statewide ad valorem property tax, whose proceeds accounted for more than half of
annual state revenues for the next 60 years. Then, for the following 20 years, the state relied on
taxes levied on the gross receipts of regulated utilities (railroads, electrical companies, and
telephone providers) to generate most of its revenue. Since the mid-1930s, California has relied
heavily on the personal income and sales taxes.
Figure 17 graphs the history of selected statewide levies, showing when and for how long the
state collected each tax. In each period, policymakers made adjustments to reflect the state’s
changing economic conditions. They pursued the sometimes conflicting goals of ensuring
revenue sufficiency, minimizing tax burdens, and encouraging state/local financial viability.
55
Figure 17
Approximate Timeline for the Levying of Selected State Revenue Sources (1850 through 2010)
Source: Derived from Assembly Interim Committee on Revenue and Taxation, A Resume of California’s Tax Structure, 1850-1959, pp. 9-61
Prepared by the California State Controller’s Office, June 2016

Prior to adopting its structural reforms in 1911 and 1935, the Legislature appointed two tax study
commissions. Strikingly, the commissions focused on four common issues:
Improving Tax Fairness. The 1905 commission advocated a reduction in the state’s reliance
on the property tax because the tax was assessed differentially across counties, thereby
spreading the tax burden unevenly based solely on where taxpayers lived. The commission
argued that reliance on the property tax put a disproportionate tax burden on agricultural
properties.
The 1929 commission argued that the state’s main tax, the gross receipts tax, was unevenly
levied across utilities and imposed a higher tax burden on utilities than similar taxpayers.27 It
advocated establishing a “well-rounded” tax system relying on taxation of persons and
businesses,28 irrespective of the source of the income.
Rationalizing State-Local Finance. The 1905 commission’s most significant contribution to
public finance may have been its advocacy for a separation of sources policy, which held that
local governments be extended exclusive access to a robust tax base (the property tax) and
that local governments be given full responsibility for managing certain programs (including
K-12 education). Consistent with this policy, the state limited its tax levies to a distinct tax
base it did not share with local governments. The commission recommended that the state
rely on a tax on private utilities.
In time, the separation of sources policy lost support as a financing scheme. The 1929
commission criticized the separated tax bases, saying that changes in government programs
blurred the distinction between state and local services. It argued that because certain
services were a shared responsibility, they should be funded jointly by state and local
governments. (For example, some critics specifically argued that the separation of sources
policy did not provide sufficient funding for the schools and the state should help pay.) The
1929 commission recommended the repeal of the separation of sources policy in favor of
state and local governments sharing revenue bases.
Improving Tax Administration. Calling the state property tax a “school for perjury, [which]
puts a penalty on honesty,” the 1905 commission called for the elimination of the statewide
property tax.29 It recommended the state establish a tax on public utilities as a way to
improve the assessment and collection of state taxes. The later commission also advocated
improved standards for assessing property taxes and the centralized administration of the
state inheritance, automobile, and corporation franchise taxes.
56 Prepared by the California State Controller’s Office, June 2016
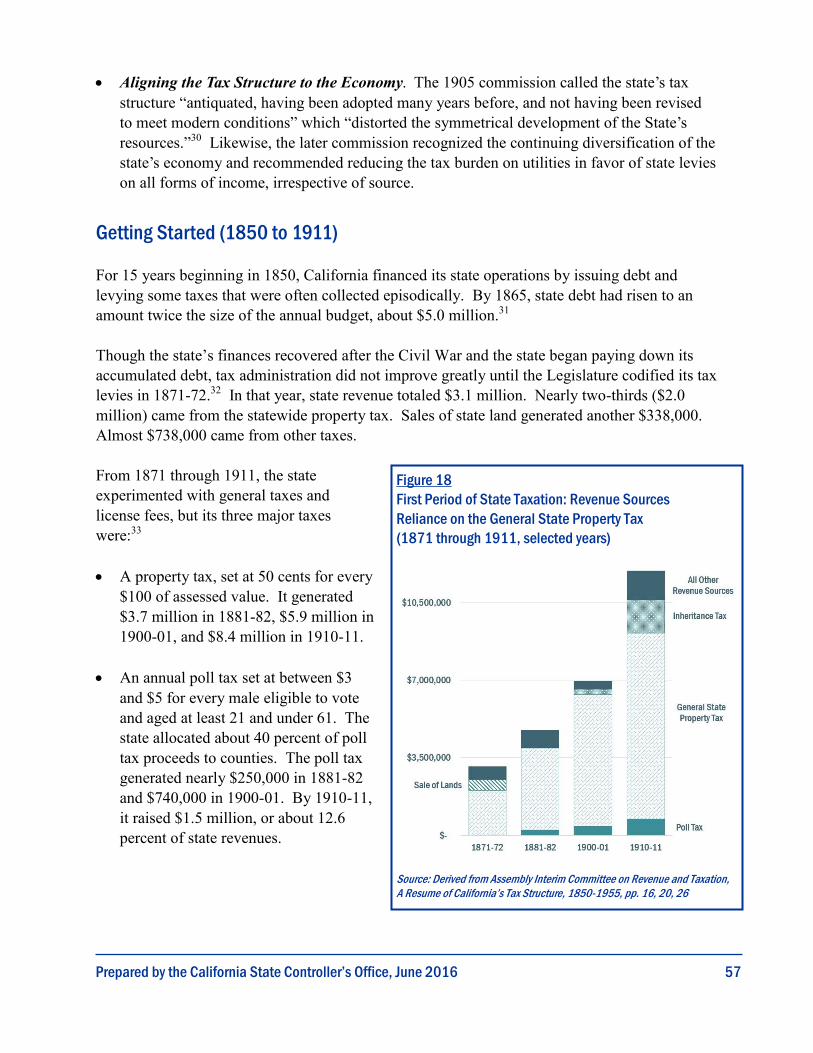
Aligning the Tax Structure to the Economy. The 1905 commission called the state’s tax
structure “antiquated, having been adopted many years before, and not having been revised
to meet modern conditions” which “distorted the symmetrical development of the State’s
resources.”30 Likewise, the later commission recognized the continuing diversification of the
state’s economy and recommended reducing the tax burden on utilities in favor of state levies
on all forms of income, irrespective of source.
Getting Started (1850 to 1911)
For 15 years beginning in 1850, California financed its state operations by issuing debt and
levying some taxes that were often collected episodically. By 1865, state debt had risen to an
amount twice the size of the annual budget, about $5.0 million.31
Though the state’s finances recovered after the Civil War and the state began paying down its
accumulated debt, tax administration did not improve greatly until the Legislature codified its tax
levies in 1871-72.32 In that year, state revenue totaled $3.1 million. Nearly two-thirds ($2.0
million) came from the statewide property tax. Sales of state land generated another $338,000.
Almost $738,000 came from other taxes.
From 1871 through 1911, the state
experimented with general taxes and
license fees, but its three major taxes
were:33
A property tax, set at 50 cents for every
$100 of assessed value. It generated
$3.7 million in 1881-82, $5.9 million in
1900-01, and $8.4 million in 1910-11.
An annual poll tax set at between $3
and $5 for every male eligible to vote
and aged at least 21 and under 61. The
state allocated about 40 percent of poll
tax proceeds to counties. The poll tax
generated nearly $250,000 in 1881-82
and $740,000 in 1900-01. By 1910-11,
it raised $1.5 million, or about 12.6
percent of state revenues.
57
Figure 18
First Period of State Taxation: Revenue Sources
Reliance on the General State Property Tax
(1871 through 1911, selected years)
Source: Derived from Assembly Interim Committee on Revenue and Taxation,
A Resume of California’s Tax Structure, 1850-1955, pp. 16, 20, 26
Prepared by the California State Controller’s Office, June 2016

An inheritance tax that, by 1893, was
imposed at 5 percent on all behests and
property transfers to family members.
Figure 18 shows revenue collections by
major taxes in selected years. Total
collections rose to $4.7 million in 1881-
82, $7.0 million in 1900-01, and $11.3
million by 1910-11. In each of these
years, general property tax revenue
accounted for between 65 percent and 85
percent of annual revenues.34
During this period, the revenue system—
with its early emphasis on debt and
subsequent dependence on property
taxation—was similar to other states’
systems. California’s system was
economically dependent on agriculture
and natural resource extraction.
A Transition (1911 to 1934)
In an attempt to address the growing tension between state and local governments, the state
adopted the separation of sources policy,35 creating distinct revenue and budget responsibilities
between levels of government. Local governments were given almost exclusive responsibility for
assessing and collecting the property tax and retained the proceeds. Local governments were also
charged with funding schools.
From 1911 until 1934, the state itself received very little from the property tax. It continued to levy
an inheritance tax, which by 1934 had grown to $5.8 million.36 The state developed new taxes,
including:
Public Utilities Gross Receipts Tax. This tax on certain utilities relied on only a few
companies. The Southern Pacific Company had 49.2 percent of all taxable value of railroad
and street railway companies, the Pacific Gas and Electric Company had 40.5 percent of all
taxable value of power companies, and Pacific Telephone and Telegraph had 75.7 percent of
all telephonic valuation.37 In 1911-12, the public utilities gross receipts tax generated $6.6
million, which two decades later had grown to $12.9 million.
58
Figure 19
Motor Vehicle Fuel Tax Revenue, State and Local
(1923 through 1934)
Source: Derived from Marvel M. Stockwell, Studies in California State Taxation 1910-1935, Berkeley: University of California Press, 1939, p. 95
Prepared by the California State Controller’s Office, June 2016

Motor Vehicle Fuel Tax. With the advent of cars and trucks, California looked to tax fuel.
The state taxed motor fuel (other than diesel and butane) by the gallon. It started with a tax rate
of two cents per gallon in 1924,38 allocating half the proceeds to the state and half to the
counties. In 1927, the state added another penny-per-gallon charge and dedicated the proceeds
to state road construction. Figure 19 shows how state and local fuel tax revenues rose rapidly,
from $5.9 million in 1923-24 to a high of $38.6 million in 1929-30, falling slightly to $36.6
million by 1933-34.39
In all, state revenue rose fast during this period, from $15.0 million in 1911-12 to $90.9 million in
1932-33. Figure 20 shows that by the end of the period, the Motor Vehicle Fuel Tax and the
Public Utilities Gross Receipts Tax accounted for 39.1 percent and 32.4 percent of all state
revenues, respectively.
These two taxes reflected the changing nature of the California economy. As large utilities—
railroads, power suppliers, and telephone providers—became prominent, the state generated new
and significant revenues from them. With the automobile, too, the state found a new source of
revenue.
Adopting the “Modern” Tax
Structure (1934 to 1955)
The state faced its first modern
budget crisis during the Depression
in 1933 when Governor James
(“Sunny Jim”) Rolph, Jr. estimated
the 1932-33 budget would end with
a $12 million deficit. He proposed
taxes on tobacco, beverages,
cosmetics, jewelry, and billboards.40
When the Legislature rejected his
proposal, the budget seemed headed
to continuing fiscal difficulties as the
public utilities gross receipts tax
could not keep pace with spending
demands. At the same time, local
governments faced significant
revenue shortfalls. School districts
were unable to raise sufficient
revenues for basic education.41
In early 1933, State Controller Ray
59
Figure 20
Transition Period of State Taxation: Revenue Sources for State
Expenditure Purposes (1911 through 1933, selected years)
Source: Derived from Assembly Interim Committee on Revenue and Taxation,
A Resume of California’s Tax Structure, 1850-1959, pp. 27, 41, 48
Prepared by the California State Controller’s Office, June 2016
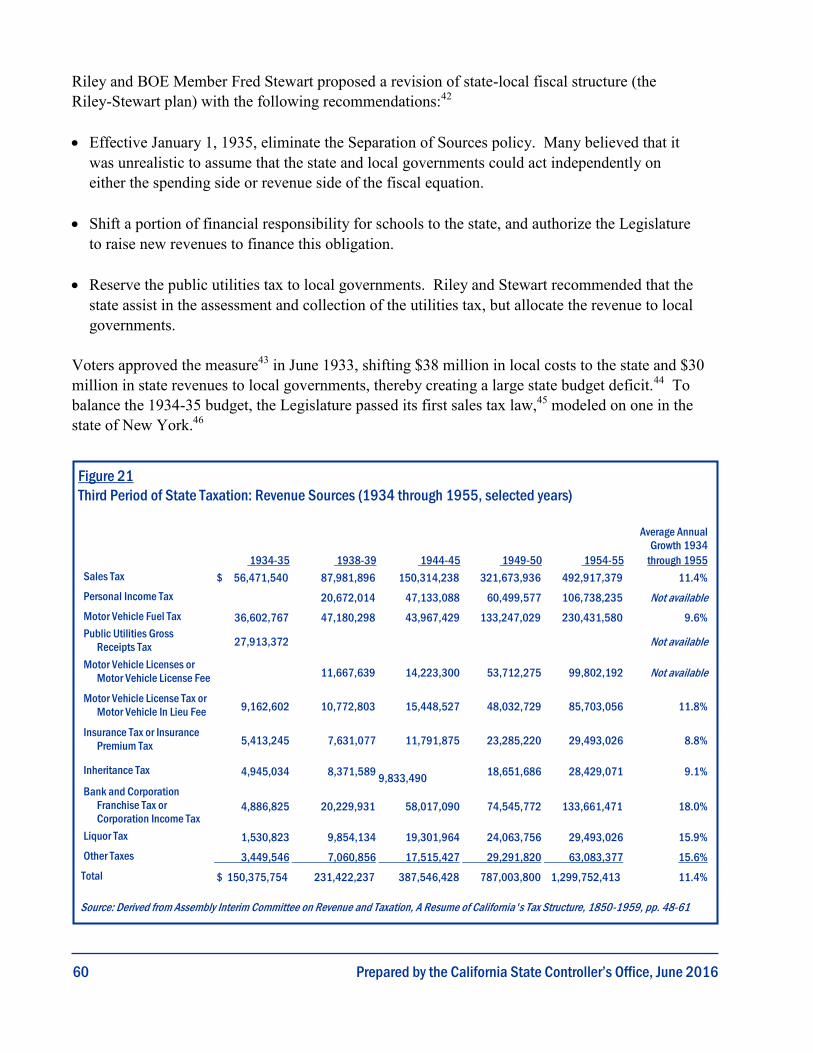
Riley and BOE Member Fred Stewart proposed a revision of state-local fiscal structure (the
Riley-Stewart plan) with the following recommendations:42
Effective January 1, 1935, eliminate the Separation of Sources policy. Many believed that it
was unrealistic to assume that the state and local governments could act independently on
either the spending side or revenue side of the fiscal equation.
Shift a portion of financial responsibility for schools to the state, and authorize the Legislature
to raise new revenues to finance this obligation.
Reserve the public utilities tax to local governments. Riley and Stewart recommended that the
state assist in the assessment and collection of the utilities tax, but allocate the revenue to local
governments.
Voters approved the measure43 in June 1933, shifting $38 million in local costs to the state and $30
million in state revenues to local governments, thereby creating a large state budget deficit.44 To
balance the 1934-35 budget, the Legislature passed its first sales tax law,45 modeled on one in the
state of New York.46
60
Figure 21
Third Period of State Taxation: Revenue Sources (1934 through 1955, selected years)
1934-35 1938-39 1944-45 1949-50 1954-55
Average Annual
Growth 1934
through 1955
Sales Tax $ 56,471,540 87,981,896 150,314,238 321,673,936 492,917,379 11.4%
Personal Income Tax 20,672,014 47,133,088 60,499,577 106,738,235 Not available
Motor Vehicle Fuel Tax 36,602,767 47,180,298 43,967,429 133,247,029 230,431,580 9.6%
Public Utilities Gross
Receipts Tax 27,913,372 Not available
Motor Vehicle Licenses or
Motor Vehicle License Fee 11,667,639 14,223,300 53,712,275 99,802,192 Not available
Motor Vehicle License Tax or
Motor Vehicle In Lieu Fee 9,162,602 10,772,803 15,448,527 48,032,729 85,703,056 11.8%
Insurance Tax or Insurance
Premium Tax 5,413,245 7,631,077 11,791,875 23,285,220 29,493,026 8.8%
Inheritance Tax 4,945,034 8,371,589
9,833,490 18,651,686 28,429,071 9.1%
Bank and Corporation
Franchise Tax or
Corporation Income Tax 4,886,825 20,229,931 58,017,090 74,545,772 133,661,471 18.0%
Liquor Tax 1,530,823 9,854,134 19,301,964 24,063,756 29,493,026 15.9%
Other Taxes 3,449,546 7,060,856 17,515,427 29,291,820 63,083,377 15.6%
Total $ 150,375,754 231,422,237 387,546,428 787,003,800 1,299,752,413 11.4%
Source: Derived from Assembly Interim Committee on Revenue and Taxation, A Resume of California's Tax Structure, 1850-1959, pp. 48-61
Prepared by the California State Controller’s Office, June 2016

61
California also adopted a personal income tax. The federal government had imposed an income
tax for 10 years in the 1860s, temporarily in 1894, and then again after passage of the 16th
Amendment authorizing the current federal income tax. When the Legislature adopted an income
tax law similar to the one in the federal tax code, it piggybacked on federal tax administration and
practice.
Assuming a repeal of Prohibition, the state imposed a liquor tax. The Legislature also increased
two existing taxes: the bank and corporation tax, and the inheritance tax.
In 1934-35, the Legislature phased out its tax on utilities and phased in the sales tax. Throughout
the rest of the decade, as the state experienced higher unemployment, the budget relied primarily
on revenue from the sales tax and the motor vehicle license tax. When California’s employment
and industries boomed during World War II, the state reduced the sales tax rate and still
generated $150.3 million.
Figure 21 shows the tax collection totals for selected years through 1955. Between 1934 and
1955, revenues rose from about $150.4 million to almost $1.3 billion.47
Broadening Tax Collections (1955 to 1977)
By the early 1950s, the Legislature dedicated a portion of fuel taxes to road construction.48 In
1955, it authorized cities and counties to levy up to a 1 percent sales tax rate for local
discretionary purposes.
Beginning in the early 1960s, the state expanded its budget along with the growing California
economy. When the federal government expanded its public assistance programs, it often
required the state and local governments to match the federal spending. These programs—
including food stamps, Aid to Families with Dependent Children (succeeded by Temporary
Assistance for Needy Families), Medicaid, and Medicare—are major items in state and county
budgets. Without the enactment of federal programs, state and local governments would likely
have spent money on similar services without direct federal assistance. Nevertheless, the federal
matching requirements to fund a large expansion of health and human services programs created
revenue pressures for counties and the state.
On March 8, 1967, Governor Ronald Reagan proposed a major tax increase to fund a 40 percent
increase in the budget. When proposing the change he said, “I wish the sum [of the increase] could
be smaller but the responsibilities which we share for sound financial management of the state’s
government demand that we confront and solve the fiscal problem…” He proposed increasing all
the major taxes, going so far as to raise the sales tax rate by one-third.49 The Legislature adopted
Reagan’s tax reform in the 1970-71 session with modifications when it passed Assembly Bills 1000
(Bagley) and 1001 (Bagley).50
Prepared by the California State Controller’s Office, June 2016

Proposition 13 and its Aftermath (1977 to 1990)
In June 1978, California voters overwhelmingly approved Proposition 13, a property tax limitation
initiative. This amendment to the California Constitution was the taxpayers’ collective response to
dramatic increases in property taxes and a state revenue surplus that had grown to nearly $5 billion.
Before 1912, the state derived as much as 70 percent of its revenue from property taxes. Since
1933, the only property tax directly levied, collected, and retained by the state has been the tax on
privately owned railroad cars. In contrast, California counties, cities, schools, and special districts
depend on the property tax. Property tax revenue nonetheless exerts a substantial influence on the
state budget because local property tax revenues allocated to K-14 schools offset mandatory state
expenditures under the terms of Proposition 98.
In the immediate aftermath of Proposition 13, which halved local discretionary revenues, Governor
Jerry Brown and state legislators struggled with ways to backfill local revenue losses with state
revenues. In the end, the Legislature approved statutory changes to increase local discretionary
revenue by allocating funds that would otherwise have been used for state support of schools.
In 1982, voters approved Proposition 5 to eliminate one of the state’s oldest taxes, the inheritance
and gift tax.
In the late 1980s, the state adopted measures to simplify personal income tax filings, consistent
with federal changes in federal tax law. Later, when the state exceeded its constitutional
spending, it returned more than $1 billion to taxpayers.
Coping with Revenue Shocks (1990 to 2000)
In the face of a prolonged and deep recession in 1991, the Legislature and Governor Pete Wilson
agreed to a significant increase in all the state’s major taxes, raising rates on the sales, property,
alcohol, and vehicle license in-lieu taxes (also known as the vehicle license fee, or VLF). They
also closed sales tax loopholes. By 1997, however, the same legislative leaders agreed to repeal
most of these tax increases. They also increased the child deductions in the personal income tax
and exempted middle-class taxpayers from the alternative minimum tax. The 1997 actions were
among the most significant in making the state’s tax system more progressive.
The tax reductions were financed with revenue associated with taxation of investment income,
like capital gains. Between 1996 and 2000, the state experienced an unprecedented revenue
boom associated with taxation of unearned income. This is commonly considered the five-year
period of the dotcom bubble. While the bubble grew, the Legislature sought to reduce the VLF
by as much as two-thirds.
When the bubble burst, so did the state’s ability to finance tax cuts.
62 Prepared by the California State Controller’s Office, June 2016
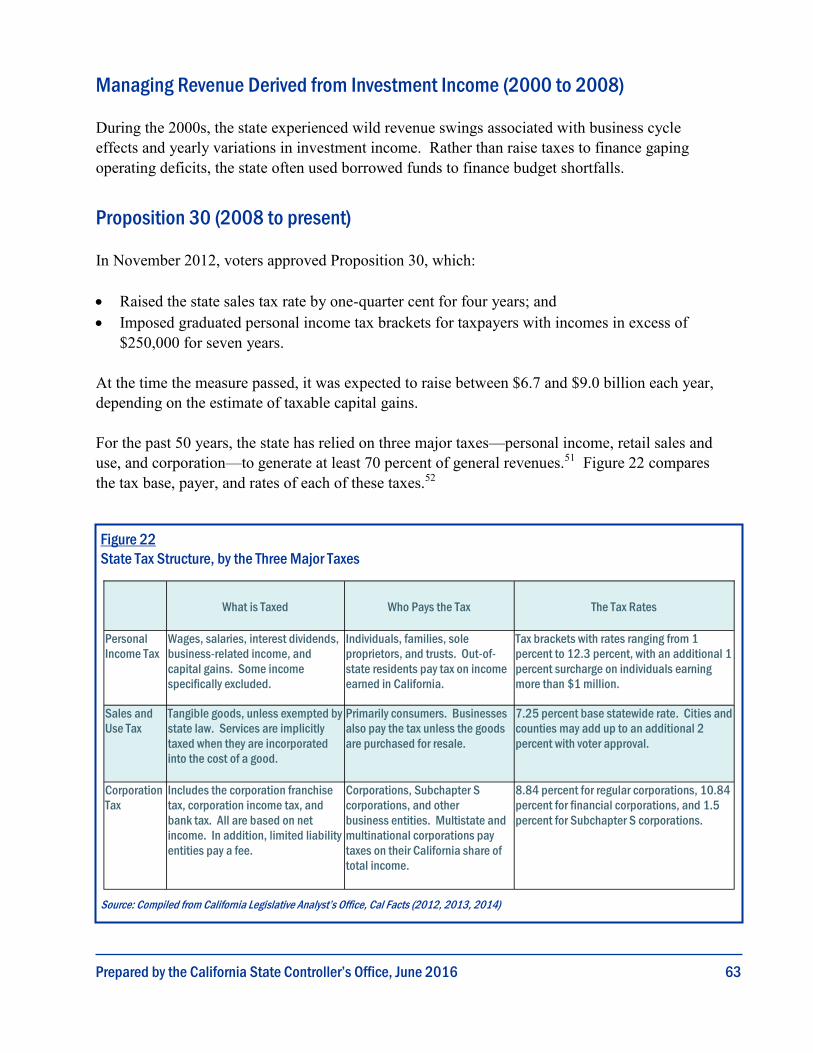
63
Managing Revenue Derived from Investment Income (2000 to 2008)
During the 2000s, the state experienced wild revenue swings associated with business cycle
effects and yearly variations in investment income. Rather than raise taxes to finance gaping
operating deficits, the state often used borrowed funds to finance budget shortfalls.
Proposition 30 (2008 to present)
In November 2012, voters approved Proposition 30, which:
Raised the state sales tax rate by one-quarter cent for four years; and
Imposed graduated personal income tax brackets for taxpayers with incomes in excess of
$250,000 for seven years.
At the time the measure passed, it was expected to raise between $6.7 and $9.0 billion each year,
depending on the estimate of taxable capital gains.
For the past 50 years, the state has relied on three major taxes—personal income, retail sales and
use, and corporation—to generate at least 70 percent of general revenues.51 Figure 22 compares
the tax base, payer, and rates of each of these taxes.52
Figure 22
State Tax Structure, by the Three Major Taxes
Source: Compiled from California Legislative Analyst’s Office, Cal Facts (2012, 2013, 2014)
What is Taxed Who Pays the Tax The Tax Rates
Personal
Income Tax
Wages, salaries, interest dividends,
business-related income, and
capital gains. Some income
specifically excluded.
Individuals, families, sole
proprietors, and trusts. Out-of-
state residents pay tax on income
earned in California.
Tax brackets with rates ranging from 1
percent to 12.3 percent, with an additional 1
percent surcharge on individuals earning
more than $1 million.
Sales and
Use Tax
Tangible goods, unless exempted by
state law. Services are implicitly
taxed when they are incorporated
into the cost of a good.
Primarily consumers. Businesses
also pay the tax unless the goods
are purchased for resale.
7.25 percent base statewide rate. Cities and
counties may add up to an additional 2
percent with voter approval.
Corporation
Tax
Includes the corporation franchise
tax, corporation income tax, and
bank tax. All are based on net
income. In addition, limited liability
entities pay a fee.
Corporations, Subchapter S
corporations, and other
business entities. Multistate and
multinational corporations pay
taxes on their California share of
total income.
8.84 percent for regular corporations, 10.84
percent for financial corporations, and 1.5
percent for Subchapter S corporations.
Prepared by the California State Controller’s Office, June 2016

This page intentionally left blank.
64

65
Appendix III
Sales Tax on Services, by Industry, Activity (Employer Paid)
Revenue (2011) at Rate:
Estimated Number of CA Firms (2012)
0.25% 8.42%
Support activities for agriculture & forestry
Support: crop production $2,819,326 $94,954,904 751
Support activities for animal production 804,272
27,087,881 435
Support activities for forestry 3,975
133,884 76
Subtotal, agriculture & forestry 3,627,573
122,176,669 1,262
Support activities for mining
Drilling oil & gas wells 2,380,000 80,158,400 63
Support for oil & gas operations 4,476,442
150,766,576 201
Support activities: metal mining 104,161
3,508,134 9
Subtotal, mining 6,960,603
234,433,110 273
Construction
Residential remodelers 16,735,365 563,647,103 9,208
Water & sewer line 8,046,398 271,002,679 711
Oil & gas pipeline 5,418,064 182,480,392 120
Power & communications line 10,908,468
367,397,197 335
Land subdivision 1,813,643 61,083,480 635
Highway, street, and bridge construction 15,559,588
524,046,924 670
Other heavy and civil engineering construction 3,968,658
133,664,399 297
Poured concrete foundation and structure contractors 7,211,159
242,871,851 1,400
Structural steel and precast concrete contractors 3,549,063
119,532,443 325
Source: California Board of Equalization, 2016

66
Framing contractors 2,855,898 96,186,640 605
Masonry contractors 2,409,426 81,149,471 1,036
Glass and glazing contractors 1,980,529 66,704,201
540
Roofing contractors 4,873,189 164,128,994 1,767
Siding contractors 416,830 14,038,818 200
Other building contractors 1,659,707 55,898,922 419
Electrical contractors 28,833,354 971,107,376 6,126
HVAC contractors 30,474,624 1,026,385,331 6,944
Other building equipment contractors 4,921,546 165,757,655
487
Drywall and insulation contractors 7,705,671 259,526,985
1,653
Painting and wall covering contractors 4,897,496 164,947,675
3,129
Flooring contractors 2,946,702 99,244,937 1,267
Tile and terrazzo contractors 1,908,006 64,261,640
1,107
Finish carpentry contractors 4,410,381 148,541,643
1,713
Other building finishing contractors 2,210,326 74,443,795
598
Site preparation contractors 12,560,154 423,025,988
1,981
Other specialty contractors 8,085,812 272,330,148 2,440
Subtotal, construction 196,360,056 6,613,406,687 45,712
Automobile dealers
Automobile dealers: labor charges for auto repair services 14,275,000 480,782,000
2,919
Subtotal, automobile dealers 14,275,000 480,782,000 2,919
Transportation & warehousing
Scheduled air transportation 55,419,176 1,866,517,860
58
Nonscheduled air transportation 3,552,305 119,641,623
231
Deep sea, coastal, and great lakes water transportation 13,790,791 464,473,830
61
Inland water transportation 124,305 4,186,597 41
General freight trucking, local 10,967,957 369,400,804
2,962
Source: California Board of Equalization, 2016

67
Used household and office goods moving 3,657,451
123,182,957
940
Specialized freight (except used goods) trucking, local 12,629,175
425,350,611
2,112
Specialized freight (except used goods) trucking, long-distance 7,314,654
246,357,540
418
Urban transit systems 2,088,970 70,356,509 111
Interurban and rural bus transportation 248,301
8,362,770
23
Taxi service 490,698 16,526,719 192
Limousine service 1,522,809 51,288,220 659
School and employee bus transportation 1,911,925
64,393,642
107
Charter bus industry 1,038,638 34,981,337 194
Other transit and ground passenger transportation 2,195,816
73,955,078
478
Pipeline transportation of crude oil 1,351,380
45,514,483
4
Pipeline transportation of natural gas 277,733
9,354,044
4
Pipeline transportation of refined petroleum products 1,119,969
37,720,555
2
All other pipeline transportation 93,069
3,134,557
0
Scenic and sightseeing transportation, land 207,400
6,985,219
77
Scenic and sightseeing transportation, water 695,137
23,412,206
143
Scenic and sightseeing transportation, other 43,220
1,455,646
26
Airport operations 2,885,135 97,171,353 145
Other support activities for air transportation 3,717,164
125,194,080
360
Support activities for rail transportation 1,178,888
39,704,952
29
Port and harbor operations 172,657
5,815,088
50
Marine cargo handling 6,517,088 219,495,516 22
Navigational services to shipping 689,411
23,219,370
30
Other support-water trans 233,354
7,859,370
39
Motor vehicle towing 3,668,504 123,555,211 1,194
Other support activities for road transportation 1,031,947
34,755,986
299
Source: California Board of Equalization, 2016

68
Freight transportation arrangement 25,015,687 842,528,324
2,081
Other support activities for transportation 635,061 21,388,859
160
Couriers and express delivery services 25,468,771 857,788,202
406
Local messengers and local delivery 1,522,287 51,270,630
470
General warehousing and storage 8,520,999 286,987,262
580
Refrigerated warehousing and storage 1,979,543 66,671,022
104
Farm product warehousing and storage 203,834 6,865,128
25
Other warehousing and storage 2,353,537 79,267,126
188
Subtotal, transportation & warehousing 230,638,068 7,767,890,134 16,976
Information
Newspaper publishers 2,185,577 73,610,246 382
Periodical publishers 1,917,716 64,588,665 571
Book publishers 1,449,286 48,811,941 304
Directory and mailing list publishers 716,633 24,136,198
85
Greeting card publishers 3,040 102,390 8
All other publishers 141,172 4,754,665 102
Software publishers 117,519,258 3,958,048,610 1,077
Record production 237,191 7,988,601 89
Integrated record production/distribution 0 -
103
Music publishers 3,149,614 106,079,004 228
Sound recording studios 982,066 33,075,986 424
Other sound recording industries 273,275 9,203,896
90
Radio networks 1,541,648 51,922,699 81
Radio stations 4,653,878 156,742,602 252
Television broadcasting 25,548,779 860,482,865 97
Cable and other subscription programming 20,361,157 685,763,769
90
Wired telecommunications carriers 0 -
316
Wireless telecomm- not satellite 0 -
168
Source: California Board of Equalization, 2016
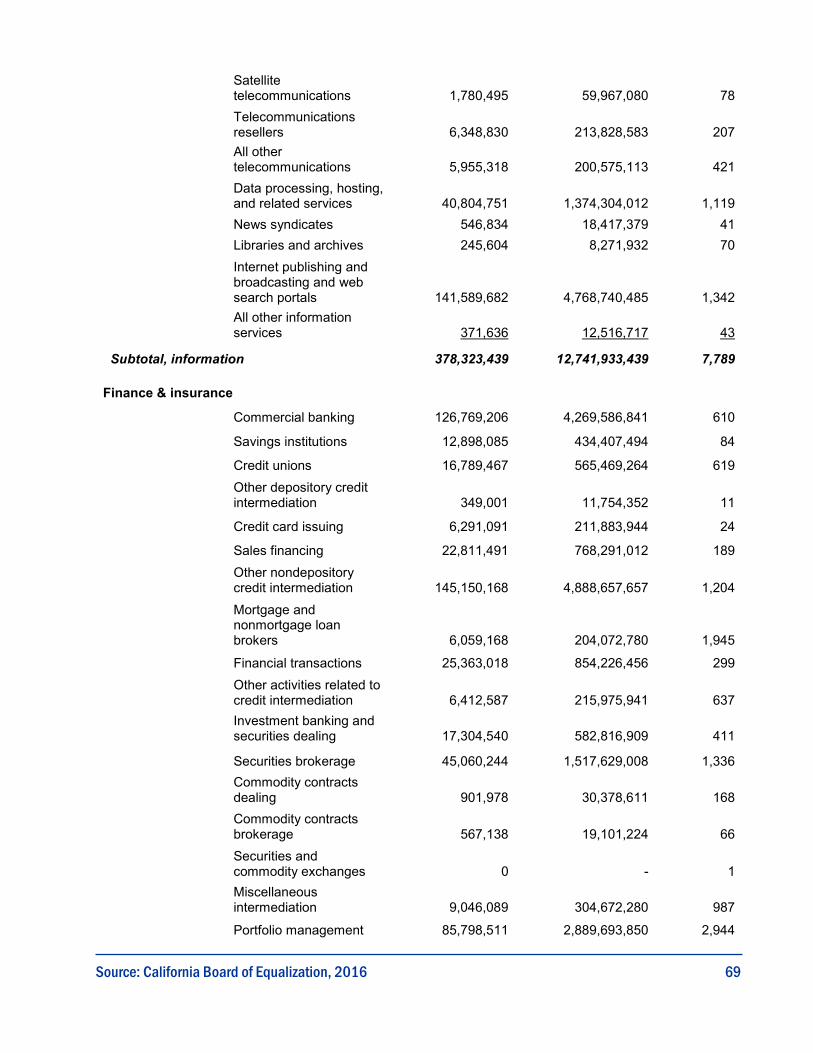
69
Satellite telecommunications 1,780,495
59,967,080
78
Telecommunications resellers 6,348,830
213,828,583
207
All other telecommunications 5,955,318
200,575,113
421
Data processing, hosting, and related services 40,804,751
1,374,304,012
1,119
News syndicates 546,834 18,417,379 41
Libraries and archives 245,604 8,271,932 70
Internet publishing and broadcasting and web search portals 141,589,682
4,768,740,485
1,342
All other information services 371,636
12,516,717
43
Subtotal, information 378,323,439 12,741,933,439 7,789
Finance & insurance
Commercial banking 126,769,206 4,269,586,841 610
Savings institutions 12,898,085 434,407,494 84
Credit unions 16,789,467 565,469,264 619
Other depository credit intermediation 349,001
11,754,352
11
Credit card issuing 6,291,091 211,883,944 24
Sales financing 22,811,491 768,291,012 189
Other nondepository credit intermediation 145,150,168
4,888,657,657
1,204
Mortgage and nonmortgage loan brokers 6,059,168
204,072,780
1,945
Financial transactions 25,363,018 854,226,456 299
Other activities related to credit intermediation 6,412,587
215,975,941
637
Investment banking and securities dealing 17,304,540
582,816,909
411
Securities brokerage 45,060,244 1,517,629,008 1,336
Commodity contracts dealing 901,978
30,378,611
168
Commodity contracts brokerage 567,138
19,101,224
66
Securities and commodity exchanges 0 -
1
Miscellaneous intermediation 9,046,089
304,672,280
987
Portfolio management 85,798,511 2,889,693,850 2,944
Source: California Board of Equalization, 2016

70
Investment advice 12,065,881 406,378,888
2,095
Other financial investment 9,987,298 336,372,187 438
Subtotal, finance & insurance 549,624,961 18,511,368,696 14,066
Real estate & leasing
Lessors of residential buildings and dwellings 37,476,184 1,262,197,869
7,299
Lessors of nonresidential buildings (except mini-warehouses) 44,446,332 1,496,952,452
3,918
Lessors of mini-warehouses and self-storage units 4,509,011 151,863,487
1,458
Lessors of other real estate property 3,985,690 134,238,044
1,321
Offices of real estate agents and brokers 30,134,700 1,014,936,703
10,897
Real estate property managers 21,045,609 708,816,104
7,568
Offices of real estate appraisers 2,057,938 69,311,343
1,060
Other activities related to real estate 5,093,866 171,561,399
2,680
Passenger car rental and leasing 565,994 19,062,685
469
Truck, utility trailer, and RV (recreational vehicle) rental and leasing 637,366 21,466,503
163
Consumer electronics and appliances rental 91,866 3,094,063
23
Formal wear and costume rental 12,670 426,734
65
Video tape and disc rental 151,726 5,110,116 186
Other consumer goods rental 567,089 19,099,568
691
General rental centers 100,400 3,381,475 221
Construction, transportation, mining, and forestry machinery and equipment rental and leasing 84,014 2,829,586
338
Office machinery and equipment rental and leasing 9,413 317,017
73
Other commercial and industrial machinery and equipment rental and leasing 893,114 30,080,064
687
Lessors of nonfinancial intangible assets (except copyrighted works) 8,073,929 271,929,934
301
Subtotal, real estate & leasing 159,936,910 5,386,675,145 39,419
Source: California Board of Equalization, 2016

71
Professional, scientific & technical services
Offices of lawyers 103,326,286 3,480,029,298 20,764
Other legal services 4,163,712 140,233,811 908
Accounting, tax preparation, bookkeeping, and payroll services 79,300,464
2,670,839,611
14,411
Architectural services 12,970,730 436,854,179 2,873
Landscape architectural services 2,183,327
73,534,449
786
Engineering services 93,311,820 3,142,742,102 6,557
Drafting services 292,666 9,856,997 249
Building inspection services 986,054
33,210,314
735
Geophysical surveying and mapping services 222,298
7,486,996
55
Surveying and mapping (except geophysical) services 1,226,227
41,299,319
473
Testing laboratories 6,163,071 207,572,240 694
Interior design services 3,816,070 128,525,237 1,552
Industrial design services 1,286,920
43,343,475
293
Graphic design services 4,001,333 134,764,879 2,333
Other specialized design services 1,275,892
42,972,043
455
Computer systems design and related services 135,294,768
4,556,727,778
16,223
Management consulting services 54,594,631
1,838,747,186
14,927
Environmental consulting services 5,592,360
188,350,686
1,262
Other scientific and technical consulting services 12,875,439
433,644,783
5,211
Research and development in the physical, engineering, and life sciences 89,017,788
2,998,119,084
2,511
Research and development in the social sciences and humanities 1,956,297
65,888,075
246
Advertising agencies 17,059,208 574,554,141 1,674
Public relations agencies 4,336,666 146,058,895 1,213
Source: California Board of Equalization, 2016

72
Media buying agencies 4,793,626 161,449,320
170
Media representatives 1,688,493 56,868,443 191
Outdoor advertising 2,588,631 87,185,083 248
Direct mail advertising 4,500,908 151,590,581 344
Advertising material distribution services 1,881,023 63,352,861
121
Other services related to advertising 4,816,019 162,203,526
793
Marketing research 7,037,294 237,016,049 864
Photographic services 2,243,314 75,554,825 1,259
Translation & interpretation 3,075,995 103,599,516
410
Veterinary services 8,928,646 300,716,785 2,723
All Other 4,907,274 165,277,004 1,514
Subtotal, professional, scientific & tech 681,715,249 22,960,169,570 105,041
Administrative & support, waste management & remediation services
Office administrative services 20,083,793 676,422,145
4,192
Facilities support services 5,159,793 173,781,824 148
Employment placement agencies and executive search services 6,723,883 226,460,394
1,507
Temporary help services 42,976,482 1,447,447,912 1,450
Professional employer organizations 23,437,102 789,361,601
326
Document preparation services 969,168 32,641,583
565
Telephone call centers 4,225,065 142,300,177 402
Business service centers 1,735,797 58,461,641 1,209
Collection agencies 2,663,740 89,714,749 413
Credit bureaus 3,113,160 104,851,227 63
Other business support services 2,754,389 92,767,814
799
Travel agencies 4,000,595 134,740,033 1,466
Tour operators 2,356,728 79,374,585 380
Other travel arrangement and reservation services 4,396,332 148,068,476
341
Investigation, guard, and armored car services 14,213,276 478,703,129
1,764
Source: California Board of Equalization, 2016

73
Security systems services 6,978,329
235,030,113
1,053
Exterminating and pest control services 5,019,012
169,040,333
1,339
Janitorial services 12,119,284 408,177,483 4,791
Landscaping services 19,654,363 661,958,949 7,582
Carpet and upholstery cleaning services 1,122,422
37,803,189
773
Other services to buildings and dwellings 2,382,897
80,255,956
1,446
Packaging and labeling services 265,297
8,935,191
218
Convention and trade show organizers 5,139,067
173,083,776
684
All other support services 4,531,280 152,613,505 1,226
Waste collection 17,528,832 590,371,054 694
Waste treatment and disposal 3,437,365
115,770,461
141
Remediation services 4,329,314 145,811,285 313
Materials recovery facilities 1,845,301 62,149,750 138
All other 961,152 32,371,584 268
Subtotal, admin, waste management 224,123,216 7,548,469,922 35,693
Educational services
Business & secretarial schools 61,535
2,072,496
30
Computer training 511,799 17,237,392 193
Professional and manage-ment development training 2,492,314
83,941,134
741
Technical and trade schools 4,933,707 166,167,263 903
Fine arts schools 1,415,936 47,688,716 1,392
Sports and recreation instruction 2,043,570
68,827,428
1,712
Language schools 1,087,790 36,636,781 296
All other schools and instruction 2,856,099
96,193,416
2,335
Educational support services 2,582,089
86,964,746
941
Subtotal, educational 17,984,839 605,729,371 8,541
Health care
Offices of physicians 155,716,534
5,244,532,853
27,202
Offices of dentists 43,502,557 1,465,166,124 20,138
Source: California Board of Equalization, 2016

74
Offices of chiropractors 3,364,617 113,320,284 4,103
Offices of optometrists 2,955,146 99,529,331 2,457
Offices of mental health practitioners (except physicians) 2,966,222
99,902,346
2,361
Offices of physical, occupational and speech therapists, and audiologists 7,112,785
239,558,604
2,120
Offices of all other health practitioners 3,009,756
101,368,586
2,539
Family planning centers 930,657
31,344,545
160
Outpatient mental health and substance abuse centers 3,086,954
103,968,623
457
Other outpatient care centers 28,618,107
963,857,828
1,308
Medical and diagnostic laboratories 15,227,407
512,859,052
1,021
Home health care services 13,864,293
466,949,378
2,109
Ambulance services 5,570,407 187,611,322 237
All other ambulatory health care services 5,581,108
187,971,714
310
General medical and surgical hospitals 230,429,203
7,760,855,567
236
Psychiatric and substance abuse hospitals 3,253,824
109,588,790
27
Specialty (except psychiatric and substance abuse) hospitals 4,963,233
167,161,702
19
Nursing care facilities (skilled nursing facilities) 24,804,173
835,404,561
843
Residential intellectual and developmental disability facilities 2,828,076
95,249,605
471
Residential mental health and substance abuse facilities 2,819,108
94,947,569
467
Continuing care retirement communities and assisted living facilities for the elderly 14,303,111
481,728,768
2,413
Other residential care facilities 2,099,694
70,717,690
504
Child and youth services 2,752,124
92,691,525
934
Source: California Board of Equalization, 2016

75
Services for the elderly and persons with disabilities 15,546,723 523,613,645
2,330
Other individual and family services 4,138,655 139,389,893
2,229
Community food services 1,445,809 48,694,849 277
Community housing services 1,437,112 48,401,926
710
Emergency and other relief services 143,731 4,840,873
50
Vocational rehabilitation services 2,535,524 85,396,441
480
Child day care services 9,302,218 313,298,715 6,305
Subtotal, health care 614,308,869 20,689,922,708 84,817
Arts, entertainment & recreation
Theater companies and dinner theaters 1,975,980 66,550,999
386
Dance companies 131,166 4,417,680 71
Musical groups and artists 2,811,424 94,688,763 866
Other performing arts companies 184,629 6,218,295
55
Spectator sports 9,512,939 320,395,794 542
Promoters of performing arts, sports, and similar events with facilities 2,753,358 92,733,108
279
Promoters of performing arts, sports, and similar events without facilities 2,613,984 88,038,979
531
Agents and managers for artists, athletes, entertainers, and other public figures 6,948,181 234,014,751
1,218
Independent artists, writers, and performers 23,252,672 783,150,003
10,045
Museums 875,131 29,474,419 440
Historical sites 50,971 1,716,708 40
Zoos and botanical gardens 762,257 25,672,827
53
Nature parks and other similar institutions 75,117 2,529,947
64
Amusement and theme parks 6,452,118 217,307,325
40
Amusement arcades 462,997 15,593,736 207
Casinos (except casino hotels) 11,219,802 377,882,922
68
Source: California Board of Equalization, 2016

76
Golf courses and country clubs 4,636,742 156,165,470
648
Skiing facilities 493,063 16,606,378 28
Marinas 581,561 19,586,963 243
Fitness and recreational sports centers 9,299,241 313,198,431
2,819
Bowling centers 541,898 18,251,118 176
All other amusement and recreation industries 1,939,172 65,311,327
1,401
Subtotal, arts, entertainment, recreation 91,024,361 3,065,700,471 20,331
Accommodation
Hotels (except casino hotels) and motels 53,515,737 1,802,410,020
4,242
Casino hotels 9,743,140 328,148,955 12
Other traveler accommodation 683,863 23,032,517
423
RV (recreational vehicle) parks and recreational camps 1,557,662 52,462,052
545
Rooming and boarding houses 398,201 13,411,411
231
Subtotal, accommodation 65,898,603 2,219,464,954 5,454
Other, except public administration
Automotive mechanical and electrical repair and maintenance 7,406,319 249,444,808
9,883
Automotive body, paint, interior, and glass repair 6,308,900 212,483,762
4,197
Other automotive repair and maintenance 2,750,605 92,640,378
2,814
Electronic and precision equipment repair and maintenance 11,276,408 379,789,423
1,298
Commercial and industrial machinery and equipment (except auto-motive and electronic) repair and maintenance 7,915,405 266,590,838
1,630
Home and garden equip-ment and appliance repair and maintenance 803,586 27,064,789
499
Reupholstery and furniture repair 413,757 13,935,346
434
Footwear and leather goods repair 89,032 2,998,605
110
Other personal and household goods repair and maintenance 926,722 31,211,985
802
Source: California Board of Equalization, 2016

77
Hair, nail, and skin care services 5,917,596 199,304,626
8,693
Other personal care services 2,783,677 93,754,247
2,003
Funeral homes and funeral services 1,386,224 46,688,030
583
Cemeteries and crematories 1,200,941 40,447,683
147
Coin-operated laundries and drycleaners 1,561,225 52,582,070
1,034
Drycleaning and laundry services (except coin-operated) 2,953,384 99,469,976
2,470
Linen and uniform supply 578,518 19,484,499 125
Pet care (except veterinary) services 1,326,594 44,679,678
1,365
Photofinishing 1,310,244 44,129,011 144
Parking lots and garages 3,578,917 120,537,919 583
All other personal services 3,422,686 115,276,060 1,287
Grantmaking and giving services 650,064 21,894,160
1,983
Social advocacy organizations 682,918 23,000,691
1,641
Civic and social organizations 1,380,591 46,498,296
2,047
Business associations 3,678,162 123,880,496 1,386
Professional organizations 2,374,945 79,988,164 615
Other 4,252,548 143,225,827 1,723
Subtotal, other 76,929,969 2,591,001,366 49,494
Total, Employer Services $3,311,731,717 $111,539,124,242 437,787
Source: California Board of Equalization, 2016

This page intentionally left blank.
78

79
Appendix IV
Top 10 Tax Expenditures: Personal Income, Corporation, and Sales and Use
Sources: California Department of Finance, 2014, and California Franchise Tax Board, 2012
Personal Income Tax Description
Revenue Loss ($ in millions)
Federal
Conformity
Exclusion of
employer contribution
health plans
Employer contributions for health
and accident benefits are excluded
from the employee’s income. $6,000 Yes
Home mortgage
interest deduction
A deduction for interest paid for
acquiring, constructing, or
refinancing a principal residence
and one other residence. $5,000 Yes
Exclusion of
employer pension
contributions
Employer contributions to qualified
retirement plans are generally
excluded from employees’ income. $4,400 Yes
Basis step-up on
inherited property
The basis of property acquired by
bequest, devise, or inheritance is
the fair market value at the date of
death. Therefore, appreciation that
occurred prior to death is not taxed. $4,100 Yes
Exclusion of capital gains
on sale of
principal residence
An individual may exclude up to
$250,000 of gain realized on the
sale of a principal residence. For
joint returns, the exclusion is
$500,000. $2,600 Yes
Exclusion of social
security benefits
Social security benefits are not
subject to California tax. $3,200 No
Charitable
contribution deduction
A deduction is allowed for cash or
certain noncash contributions to
qualifying nonprofits or
governmental entities. $2,200 Yes
Real estate, personal
property and other tax
deduction
Individuals may deduct certain
taxes as an itemized deduction. $2,100 Yes
Dependent exemption in
excess of personal
exemption credit
A nonrefundable personal
exemption credit is allowed for all
taxpayers and their dependents.
The exemption credit for
dependents is over three times
greater than the exemption allowed
for the taxpayer or spouse. $1,400 No
Employee business and
miscellaneous expenses
deduction
Certain unreimbursed employee
expenses may be deducted as a
miscellaneous itemized deduction. $1,400 Yes

80
Corporation Tax Description
Revenue Loss ($ in millions)
Federal
Conformity
Research and
development credit
Businesses are allowed a credit for
increased research expenditures. $1,800 No
Sales factor
apportionment
Corporations with income derived
from sources both within and
outside of California must
apportion income to California
using a single-sales factor method. $974 No
Water’s edge election
Unitary multinational corporations
are allowed the option of
computing their income attributable
to California based on a water’s
edge (domestic) combined report,
as opposed to a worldwide report. $850 No
Enterprise zones and
similar areas (repealed
1/1/2014)
Several tax incentives are available
for certain types of expenditures or
income earned in economically
depressed areas. $500 No
Like-kind exchanges
No gain or loss is recognized when
business or investment property is
exchanged solely for like-kind
property. $450 Yes
Subchapter S
corporations
Corporations that meet specified
criteria are allowed to elect
Subchapter S corporation status.
An S corporation pays a reduced
tax rate. $140
Yes, but there
is no entity-
level tax at the
federal level.
Tax-exempt status for
qualifying
corporations
Qualifying nonprofit and charitable
organizations are exempt from
corporation tax. $170 Yes
Accelerated
depreciation of R&E
costs
Research and experimental
expenditures. $180 Yes
Charitable
contributions
deductions
A deduction is allowed for cash or
certain noncash contributions to
qualifying nonprofits or
governmental entities. $110 Yes
Film credit
A nonrefundable credit to qualified
taxpayers who produce a motion
picture in California or relocate a
television series or independent
film to California. $108 No
Sources: California Department of Finance, 2014, and California Franchise Tax Board, 2012

Sales & Use Tax Description
Revenue
Loss* ($ in millions)
Federal
Conformity
Food products
Sales of food for human
consumption are exempt. The
exemption does not apply to hot
prepared food or food sold and
consumed at the seller’s facility. $10,140 N/A
Gas, electricity, water,
and steam
Gas, electricity, and water delivered
through mains, lines, or pipes are
exempt. $6,278 N/A
Prescription medicine
Medicine items that are prescribed
for an individual and furnished by a
registered pharmacist are exempt. $4,028 N/A
Animal life, feed, seeds,
plants, fertilizer, drugs,
medicines
Sales of animals, generally used for
human foods, as well as the feed and
drugs used for those animals are
exempt. Seeds and plants normally
used for human foods and fertilizer
for those plants are exempt. $2,034
N/A
Candy, confectionery,
snack foods, and bottled
water
Candy, confectionery, snack foods,
and bottled water are exempt. $1,503 N/A
Manufactures exemption
Manufacturers and certain research
and development businesses may
qualify for a partial exemption. $525 N/A
Custom computer
programs
Transfers of custom computer
programs are exempt. $479 N/A
Fuel sold to common
carriers
Sales of fuel and petroleum products
to air common carriers for
international flights are exempt. $358 N/A
Exemption for farm
equipment
Sales of farm equipment, machinery,
and their parts are partially exempt. $180 N/A
Water to common
carriers
Sales of fuel and petroleum products
are exempt when sold to water
common carriers for immediate
shipment outside of California. $81 N/A
*State and
local revenue
loss
81 Sources: California Department of Finance, 2014, and California Franchise Tax Board, 2012

This page intentionally left blank.
82

83
Endnotes
Chapter 1 1California Legislative Analyst’s Office. “Fiscal Outlook 2015-16.” Sacramento, CA: LAO. November 2014.
Chapter 2 2Alan J. Auerbach. “California’s Future Tax System.” University of California, Berkeley, CA. August 5, 2010.
3California Department of Finance. “Revenue Budget Summary.” Sacramento, CA: DOF. January 2016.
4John P. Decker. “State Tax Notes.” Sacramento, CA: April 22, 2015.
5Appendix III.
6California Board of Equalization. “Estimate of Potential Revenue to be Derived from Taxation of Currently Non-
Taxable Services.” Sacramento, CA: BOE. April 2015.
7George Skelton. “California tax reform plan much too bold for Capitol.” Los Angeles Times. October 1, 2009.
Chapter 4 8Paul W. Rhodes. “The Evolution of California Manufacturing.” San Francisco, CA: Public Policy Institute of
California. 2001: pp. 12-14.
9Ibid.
10Ibid.
11Ibid.
12Ibid.
13Ibid.
14Ibid.
15Ibid.
16California Department of Finance. “Brief History of the California Economy.” Sacramento, CA: DOF.
17Public Policy Institute of California. “California’s economy is growing, but disparities exist,” San Francisco, CA:
PPIC, 2016.
18California Department of Finance. Derived from “Governor’s Budget Summary 2016-17, Schedule 2.” Sacramento,
CA: DOF. January 2016.
19P. Berck, E. Golan, and B. Smith with J. Barnhart and A. Dabalen. “Dynamic Revenue Analysis for California.”
Summer 1996.
20William G. Gale, Aaron Krupkin, and Kim Rueben. “The Relationship between Taxes and Growth at the State Level:
New Evidence.” National Tax Journal. December 2015: p. 938.
21“State and Local Governments’ Fiscal Outlook: April 2012 Update.” United States General Accountability Office.
22Eileen Norcross and Olivia Gonzalez. “Ranking the States by Fiscal Condition, 2016 Edition.” Arlington, VA:
Mercatus Center, George Mason University. June 2016.
Chapter 5 23Congressional Budget and Impoundment Control Act of 1974 (the Budget Act).
24Section 29, Article XIII of the California Constitution. Proposition 11 (1998) authorized municipalities to enter into
sales tax revenue sharing agreements by a vote of the relevant governing bodies. The measure was placed on the ballot
by the Legislature through ACA 10. Prior to approval of Proposition 11, voters within the sharing jurisdictions had to
approve the sharing.

25Thomas D. Frohlich. “States with the Widest Gap Between Rich and Poor.” 24/7 Wall St. October 5, 2015.
26Daniel Alton. “To Reduce Inequality, Tax Wealth, Not Income.” New Y ork Times. November 18, 2012.
Appendix II 27California Tax Commission. “Final Report.” Sacramento, CA: California Legislature. 1929: p. XXII.
28Assembly Interim Committee on Revenue and Taxation. “A Resume of California’s Tax Structure, 1850-1955.”
Sacramento, CA: California Legislature. March 15, 1956: pp. 40-41.
29Commission on Revenue and Taxation of the State of California. “Report.” Sacramento, CA: California Legislature.
1906: p. 10.
30Assembly Interim Committee on Revenue and Taxation, op. cit., p. 21.
31Ibid, pp.11, 12.
32William C. Fankhauser. “A Financial History of California.” Berkeley, CA: University of California Press. 1913: pp.
257-58.
33Assembly Interim Committee on Revenue and Taxation, op. cit., pp. 16, 20, 26.
34Commission on Revenue and Taxation of the State of California, op. cit.
35Assembly Interim Committee on Revenue and Taxation, op. cit., pp. 27, 48.
36State Tax Commission, “Report.” (Sacramento: State of California). 1927.
37Assembly Interim Committee on Revenue and Taxation, op. cit., p. 34.
38Marvel M. Stockwell. “Studies in California State Taxation, 1910-1935.” Berkeley, CA: University of California
Press. 1939: p. 97.
39Assembly Interim Committee on Taxation and Revenue, op. cit., p 44.
40Joint Committee on Taxation, “Report.” (Sacramento: California Legislature). 1931
41James E. Hartley, Steven M. Sheffrin, and J. David Vasche. “Reform During Crisis: The Transformation of
California’s Tax System during the Great Depression.” California Constitutional Revision Commission’s Constitution
History Revision Perspective. 1996: p. 59.
42Senate Constitutional Amendment 30 (1933). Sections 14 and 16 of Article XIII of the California Constitution.
43Assembly Interim Committee on Revenue and Taxation, op. cit., p. 45.
44Chapter 1020, Statutes of 1933.
45Assembly Interim Committee on Revenue and Taxation, op. cit., pp. 45-61.
46Ibid.
47Ibid.
48Ibid.
49Governor Ronald Reagan. “Tax Message.” Sacramento, CA: Governor’s Office. March 8, 1967.
50William T. Bagley. “Letter to the Editor.” New Y ork Times. June 5, 2015.
51Kellie Jean Hogue and Christopher Berger. Memo to John Decker RE: Request for Information, Tax Change.
Sacramento, CA: California Research Bureau. November 16, 2015. p. 2.
52Mac Taylor. “Cal Facts.” Sacramento, CA: Legislative Analyst’s Office. 2012, 2013, 2014.
84


BETTY T. YEE California State Controller
P.O. Box 942850
Sacramento, CA 94250
www.sco.ca.gov