comprehensive risk analysis for structure type …
TRANSCRIPT
Report No. CDOT-2010-2 Final Report COMPREHENSIVE RISK ANALYSIS FOR STRUCTURE TYPE SELECTION Ross B. Corotis, Bill Beams, and David E. Hattan
April 2010 COLORADO DEPARTMENT OF TRANSPORTATION DTD APPLIED RESEARCH AND INNOVATION BRANCH
The contents of this report reflect the views of the
author(s), who is(are) responsible for the facts and
accuracy of the data presented herein. The contents
do not necessarily reflect the official views of the
Colorado Department of Transportation or the
Federal Highway Administration. This report does
not constitute a standard, specification, or regulation.
Technical Report Documentation Page 1. Report No. CDOT-2010-2
2. Government Accession No.
3. Recipient's Catalog No.
4. Title and Subtitle Comprehensive Risk Analysis for Structure Type Selection
5. Report Date April 2010
6. Performing Organization Code
7. Author(s) Ross B. Corotis, Bill Beams, and David E. Hattan
8. Performing Organization Report No. CDOT-2010-2
9. Performing Organization Name and Address University of Colorado at Boulder Department of Civil, Environmental and Architectural Engineering 428 UCB Boulder, CO 80309-0428
10. Work Unit No. (TRAIS) 11. Contract or Grant No. 86.00
12. Sponsoring Agency Name and Address Colorado Department of Transportation - Research 4201 E. Arkansas Ave. Denver, CO 80222
13. Type of Report and Period Covered Final. June 1, 2007 – January 31, 2010
14. Sponsoring Agency Code
15. Supplementary Notes Prepared in cooperation with the US Department of Transportation, Federal Highway Administration
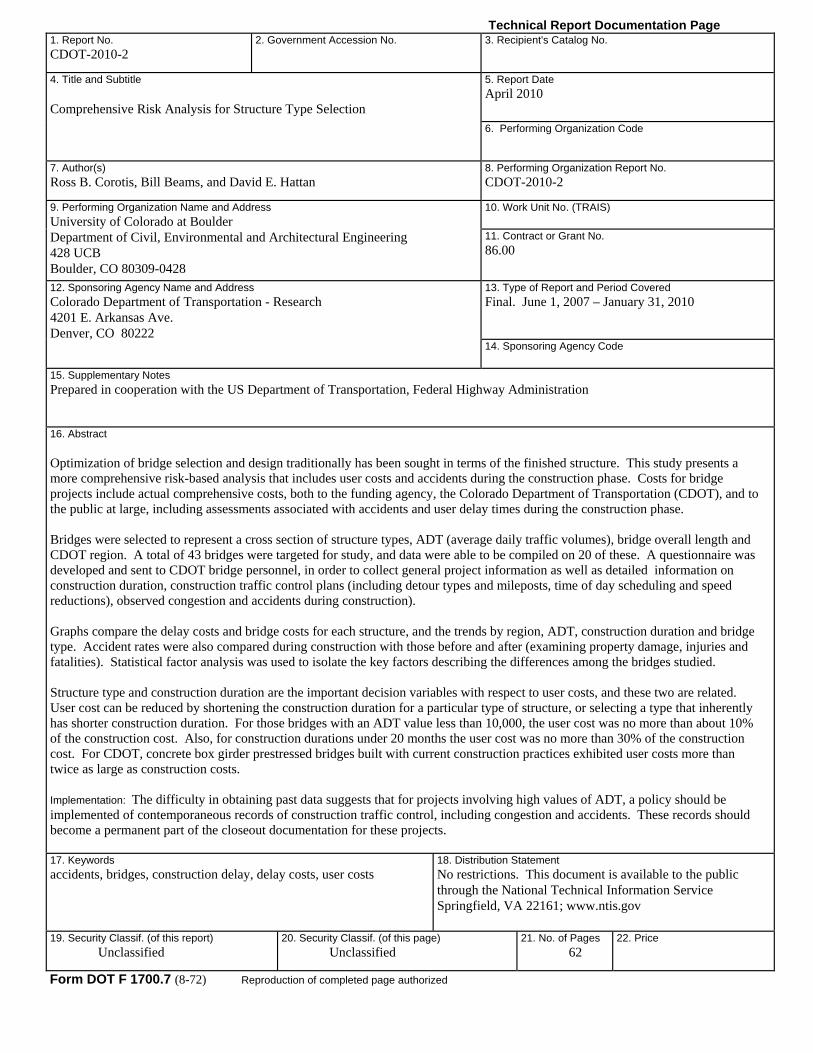
16. Abstract Optimization of bridge selection and design traditionally has been sought in terms of the finished structure. This study presents a more comprehensive risk-based analysis that includes user costs and accidents during the construction phase. Costs for bridge projects include actual comprehensive costs, both to the funding agency, the Colorado Department of Transportation (CDOT), and to the public at large, including assessments associated with accidents and user delay times during the construction phase. Bridges were selected to represent a cross section of structure types, ADT (average daily traffic volumes), bridge overall length and CDOT region. A total of 43 bridges were targeted for study, and data were able to be compiled on 20 of these. A questionnaire was developed and sent to CDOT bridge personnel, in order to collect general project information as well as detailed information on construction duration, construction traffic control plans (including detour types and mileposts, time of day scheduling and speed reductions), observed congestion and accidents during construction). Graphs compare the delay costs and bridge costs for each structure, and the trends by region, ADT, construction duration and bridge type. Accident rates were also compared during construction with those before and after (examining property damage, injuries and fatalities). Statistical factor analysis was used to isolate the key factors describing the differences among the bridges studied. Structure type and construction duration are the important decision variables with respect to user costs, and these two are related. User cost can be reduced by shortening the construction duration for a particular type of structure, or selecting a type that inherently has shorter construction duration. For those bridges with an ADT value less than 10,000, the user cost was no more than about 10% of the construction cost. Also, for construction durations under 20 months the user cost was no more than 30% of the construction cost. For CDOT, concrete box girder prestressed bridges built with current construction practices exhibited user costs more than twice as large as construction costs. Implementation: The difficulty in obtaining past data suggests that for projects involving high values of ADT, a policy should be implemented of contemporaneous records of construction traffic control, including congestion and accidents. These records should become a permanent part of the closeout documentation for these projects. 17. Keywords accidents, bridges, construction delay, delay costs, user costs
18. Distribution Statement No restrictions. This document is available to the public through the National Technical Information Service Springfield, VA 22161; www.ntis.gov
19. Security Classif. (of this report) Unclassified
20. Security Classif. (of this page) Unclassified
21. No. of Pages 62
22. Price
Form DOT F 1700.7 (8-72) Reproduction of completed page authorized

COMPREHENSIVE RISK ANALYSIS FOR
STRUCTURE TYPE SELECTION
Report No. CDOT-2010-2
Professor Ross B. Corotis, PE, SE, NAE Denver Business Challenge Professor of Engineering
Department of Civil, Environmental & Architectural Engineering University of Colorado
Boulder, CO 80309-0428
Bill Beams, P.E., Senior Bridge Engineer Dave Hattan, P.E., PTOE, Senior Transportation Engineer
Felsburg Holt & Ullevig 6300 S. Syracuse Way, Suite 600
Centennial, CO 80111
Sponsored by the Colorado Department of Transportation
In Cooperation with the U.S. Department of Transportation Federal Highway Administration
April 2010
Colorado Department of Transportation DTD Applied Research and Innovation Branch
4201 E. Arkansas Ave. Denver, CO 80222
(303) 757-9506

ACKNOWLEDGMENTS
The authors would like to Kathryn Lynch and Ryan Anderson, graduate students in the Department of Civil, Environmental and Architectural Engineering at the University of Colorado for their valuable assistance in collecting and analyzing data. The authors would also like to acknowledge the study panel members from CDOT who contributed to the availability and collection of data. They are:
Bryan Allery, CDOT HQ Safety and Traffic Branch Aziz Khan, CDOT DTD-Research Branch Jake Kononov, CDOT DTD-Research Branch Scott McDaniel, CDOT Region 1 Richard Osmun, CDOT Region 4
The authors would also like to acknowledge the continuing valuable assistance of Rich Sarchet, the study manager on this project. Without his untiring support and coordination of data the completion of this project would not have been possible.

EXECUTIVE SUMMARY
Optimization of bridge selection and design traditionally has been sought in terms of the finished structure. This study presents a more comprehensive risk-based analysis that includes user costs and accidents during the construction phase. Costs for bridge projects include actual comprehensive costs, both to the funding agency, the Colorado Department of Transportation (CDOT), and to the public at large, including assessments associated with accidents and user delay times during the construction phase. This approach can lead to a total cost optimization for more effective and efficient bridge project designs for the citizens of the State of Colorado. Bridges were selected to represent a cross section of the following attributes:
• Bridge Type (Categories of Structure Type) • Bridge Overall Length • Average Daily Traffic (ADT) • CDOT Region • Type of feature underneath the bride crossing
From a total of 163 bridges constructed during the period 2000-2007, the above criteria were used to select a total of 43 candidate bridges targeted for study. Data were able to be compiled on 20 of these. A questionnaire was developed and sent to CDOT bridge personnel, in order to collect general project information as well as detailed information on construction duration, construction traffic control plans (including detour types and mileposts, time of day scheduling and speed reductions), observed congestion and accidents during construction). User costs were computed with a well-established delay cost formula, and actual accident data were obtained. Graphs compare the delay costs and bridge costs for each structure, and the trends by region, ADT, construction duration and bridge type. Accident rates were also compared during construction with those before and after (examining property damage, injuries and fatalities). All accident data were normalized to an equivalent one-year period. Statistical factor analysis was used to isolate the key factors describing the differences among the bridges studied. Delay costs were seen to exceed the actual bridge construction cost in about half of the bridges studies, particularly in the CDOT Regions with higher ADT (Regions 1, 2 and 6). Accident rates were essentially unchanged during construction for property damage only accidents and fatality accidents, but there was an almost 20% increase in the number of injury accidents. Structure type and construction duration are the important decision variables with respect to user costs, and these two are related. User cost can be reduced by shortening the construction duration for a particular type of structure, or selecting a type that inherently has shorter construction duration. For those bridges with an ADT value less than 10,000, the user cost was no more than about 10% of the construction cost. Also, for construction durations under 20 months the user cost was no more than 30% of the construction cost.

For CDOT, concrete box girder prestressed bridges built with current construction practices exhibited user costs more than twice as large as construction costs. In summary, delay costs become significant as a ratio to bridge costs when,
• ADT exceeds 10,000 • Construction duration exceeds 20 months • Concrete box girder prestressed bridges are built with current construction
practices For implementation, the difficulty in obtaining past data suggests that for projects involving high values of ADT, a policy should be implemented of contemporaneous records of construction traffic control, including congestion and accidents. These records should become a permanent part of the closeout documentation for these projects.
Additional quantitative studies are warranted to confirm the user cost calculations over a wider data base. An automated system of data collection as recommended above will make this possible.
TABLE OF CONTENTS 1.0 INTRODUCTION………………………………………………………………....…1
1.1 Background for the Study ………………………………..…..…….…….…..1 1.2 Objective of the Study………………………………………………….….....1 1.3 Expected Benefits of the Study……………….…………….………….….....1
2.0 BRIDGE SELECTION PROCESS…………..……………………………..……......3 3.0 ANALYSIS………………………………………………………………………......5
3.1 Study Bridges………....………………………………………...……............5 3.2 Cost Analysis…………………………………………………………...........5 3.3 Factor Analysis………………………………………………………............6
4.0 CONCLUSIONS…………………………………………………………….…..….13 5.0 RECOMMENDATIONS………………………………………………….….….....16 6.0 REFERENCES…………………………………………………………….….….....17 APPENDIX A……………………………………………………….………………...A-1 APPENDIX B …………………………………………………………………..….….B-1 APPENDIX C ……………………………………………………………………...….C-1 APPENDIX D……………………………………………………………………........D-1
LIST OF TABLES Table 1. Structure Types for the Analyzed Bridges……………………………………..5 Table A1. Characteristics of Bridges Considered…………………………………….A-2 Table A2. Explanation of Terms in Table A1…………………………………….... A-12 Table A3. Bridge Characteristics and Percentage Representations……………….....A-13 Table A4. Distribution of Candidate Bridges by CDOT Region…………………....A-14 Table A5. Candidate and Selected Bridges……………………………………….…A-20 Table B1. Summary Information for Analyzed Bridges………………………….…..B-1 Table B2. Bridge Costs and Accident Data………………………………………..….B-2 Table B3. Traffic Control Summary for Analyzed Bridges……………………….….B-3
LIST OF FIGURES Figure 1. Distribution of study bridges……………………………………………….…6 Figure 2. Distribution of bridge construction and user delay cost in millions…………..8 Figure 3. Percentage difference distributions…………………………………………..12 Figure 4. Total variance explained by principal components analysis…………………13 Figure 5. Rotated factor plot ……………………………………………………….…14 Figure C1. Map of study bridge sites…………………………………………….……C-1 Figure C2. Map of bridge types………………………………………………….……C-2 Figure C3. Map of bridge ADT……………………………………………………….C-3 Figure C4. Map of bridge delay cost (millions $)…………………………………….C-4 Figure C5. Map of bridge delay cost/bridge cost……………………………………..C-5
1
1.0 INTRODUCTION 1.1 Background for the Study CDOT Staff Bridge currently has procedures and directives for the evaluation and selection of structure type alternatives during preliminary design phase. Chapter 19, Section 19.1.3 of the Bridge Design Manual outlines the preliminary design process for major structures, and includes an outline of the data to be collected, and the factors to be considered. Typically this includes hard data such as roadway alignment, construction phasing, utilities, right-of-way restrictions, hydraulics, geology, safety, constructability, durability, environmental constraints and aesthetic considerations. Preliminary construction cost estimates for each structure layout and type being considered are prepared in accordance with the CDOT Staff Bridge Memorandum dated April 10, 2000, “Preparation of Preliminary Estimates for All Major Structures.” This work currently culminates in a Structure Selection Report which documents the structure evaluation process and provides recommendation to the Department regarding the preferred structure layout and type to be used for the particular project and location.
Historically, little soft data (such as traffic operations, user cost for detours and delays, and safety during construction) are typically included in this evaluation and selection process, and if included, no model or consistent procedure is available to evaluate these issues.
Recent investigations through NCHRP, TRB, etc. have begun to quantify direct and indirect construction costs related to accident risk (both rate and severity) during construction, user delay time to the traveling public during construction (both on the route under construction and on detour routes), and safety of workers during various construction operations. The goal of this project is to consider a comprehensive approach for total cost optimization, utilizing a risk-based decision model. Tradeoffs among structural design optimization, direct construction costs, and indirect construction cost to various stakeholders could then be included and quantified by CDOT as desired. 1.2 Objective of the Study Optimization of bridge selection and design is generally sought in terms of the finished structure. The objective of this study was to present a more comprehensive risk-based analysis that includes user costs and accidents during the construction phase. The availability in a timely manner of the data from CDOT, both in quantity and quality, affected the extent to which this project was able to enumerate the results. 1.3 Expected Benefits of the Study Costs for bridge projects will be able to include the actual comprehensive costs, both to CDOT and to the public at large, including probabilistically-based risk assessments

2
associated with accidents and user delay times during the construction phase. Consideration of these costs can lead to more effective and efficient bridge project designs for the citizens of the State of Colorado. Appropriate consideration of the CDOT construction costs and the societal impact costs will allow tradeoffs to be considered. Increased awareness and appreciation of the mission of CDOT can be expected from the residents of the state.

3
2.0 BRIDGE SELECTION PROCESS The goal of the project was to select about 40 bridges for detailed study. It was felt that this number would be large enough to be representative if the bridges were selected carefully, yet still be a manageable number. A master list of major structures constructed during the time period of 2000-2007 was obtained from CDOT, and included 329 structures. Appendix A (Table A1 – Characteristics of Bridges Considered) contains a summary version of the key properties for this study of those 329 structures. The columns are self explanatory, except for Str Type (Structure Type), Serv on (Service on Bridge) and Bridge Type, which are explained in Table A2. The list was narrowed to major structures built in the years 2000-2003 to account for the availability of accident data during the time of construction and two years on either side of the time of construction, in order to compare safety information with normal operating conditions. This resulted in consideration of 217 major structures of potential interest for this study. Some of these major structures were not bridge structures, so restriction to actual bridges reduced the number to 163 bridges. A number of key components for the study were identified and taken into consideration to ensure that the selection of case studies would be representative of practices within the state of Colorado. These components were:
• Bridge Type (Categories of Structure Type) • Bridge Overall Length • Average Daily Traffic (ADT) • CDOT Region • Type of feature underneath the bridge crossing
The feature under the bridge was important in determining whether there was interruption to normal traffic flow underneath the bridge, in addition to that affected on the bridge road itself. Table A3 in Appendix A (Bridge Characteristics and Percentage Representations) summarizes the distribution of bridges by their characteristics. The subcategories of these key components were computed as percentages of the total number of bridges built during the time period of 2000-2003 in an attempt to assure a representative sample to analyze. The bridges were considered by Region location (see Map of CDOT Engineering Regions in Appendix A) to assure that each of the six regions within the state of Colorado, as designated by CDOT, was reasonably represented. Table A4 (Distribution of Candidate Bridges by CDOT Region) in Appendix A contains a listing of all 163 candidate bridges by CDOT region.

4
Using these 163 bridges, a representative distribution was sought for all the characteristics. This resulted in a list of 84 prospective bridges. Examination of all 84 prospective bridges indicated that there was some overlap of characteristics. For example, in one case two bridges were identical in characteristics except that one had a road underneath and the other a river; since the prospective list was overrepresented in bridges with a road underneath, just the one with the river was selected. This resulted in 66 candidate bridges, which are described in Table A5, Candidate and Selected Bridges. Several of the 66 candidate bridges represented multiple bridges on the same project. Since this duplication would add little information to the manner in which the construction process and traffic disruption was handled, it was decided to limit the number of bridges from the same project file. In this manner, 43 of the 66 candidate bridges were targeted for selection (also shown in Table A5). For a few of these bridges, the key contact individual no longer worked for CDOT and was not readily reachable. This lack of availability was crucial because engineer logs were needed to understand types and dates of the phases of traffic interruption and of accidents during construction. Finally, therefore, based on available contact information, the list of selected bridges was reduced to 37 candidate bridges for which CDOT contacts were available for obtaining data for analysis in the study. A questionnaire was developed in order to determine general project information and then detailed information on construction duration, construction traffic control plans (including detour types and mileposts, time of day scheduling and speed reductions), observed congestion and accidents during construction. All of this information (except general project) was requested for each different phase of the project. This approach was necessary since the needed “soft” data have not been collected into a single record at CDOT. A sample completed questionnaire is included as Appendix D. These questionnaires were sent to the designated CDOT personnel, and follow-up visits offered for assistance in completion.

5
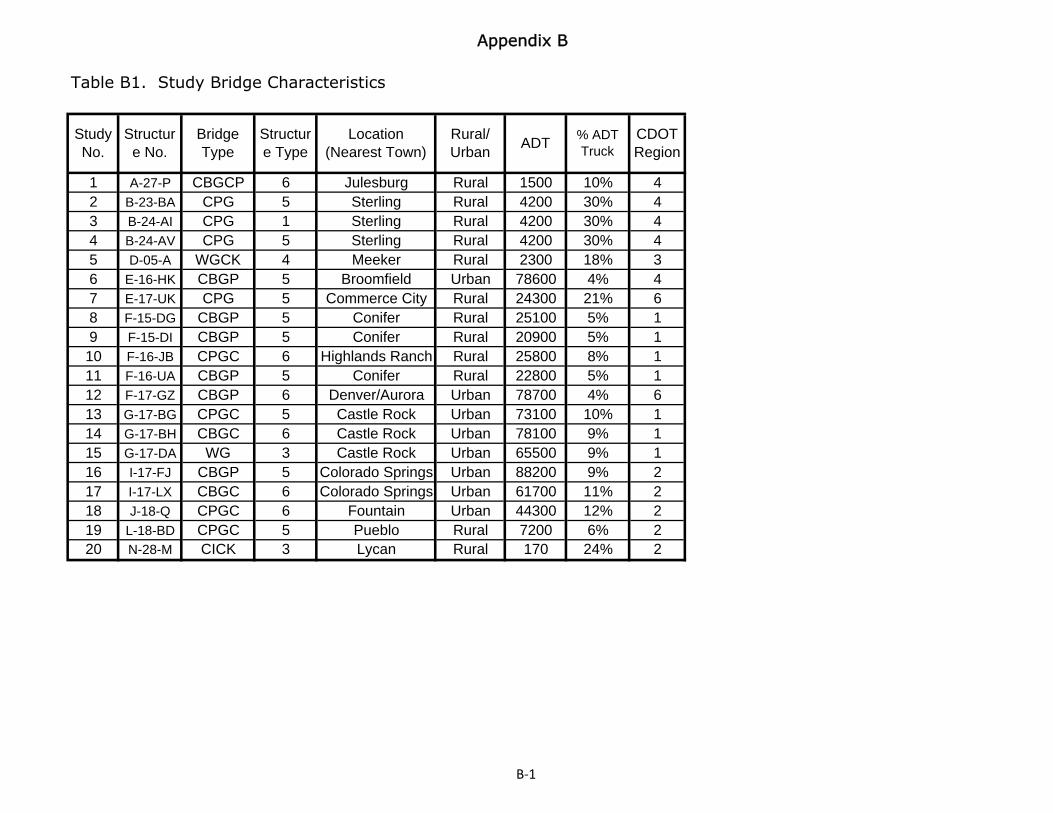
3.0 ANALYSIS 3.1 Study Bridges Of the 37 bridges chosen for consideration, 20 were analyzed. This discrepancy is due to difficulties in obtaining the necessary information for the candidate bridges. Table B1 (Summary Information for Analyzed Bridges) and B3 (Traffic Control Summary for Analyzed Bridges) in Appendix B summarize the characteristics and construction practices for all 20 bridges. For convenience, the Structure Types for the analyzed bridges are reproduced and annotated in Table 1 below.
Table 1. Structure Types for the Analyzed Bridges Bridge Type
Description
CBG Concrete Box Girder CBGC Concrete Box Girder Continuous CBGCP Concrete Box Girder Continuous Prestressed CBGP Concrete Box Girder Prestressed CICK Concrete on Rolled I-Beam – cont & composite CPGC Concrete Prestressed Girder – cont & precast WG Welded Girder WGCK Welded Girder – cont and composite
Figure 1 below displays the distribution of the 20 bridges within the categories of bridge type, CDOT Region, bridge length and average daily traffic volume (ADT). These classifications were utilized to select the original candidate bridges, and it is clear that the 20 assessed bridges still represent a reasonable cross section of types.

6
(a) Bridge Type (b) CDOT Regions
(b) Roadway ADT (d) Bridge Length
Figure 1. Distribution of study bridges by (a) bridge type, (b) CDOT region, (c) ADT and (d) length The majority of the bridges examined in this study are short-span variations of prestressed concrete girder bridges: CPG, CPGC, CBGP (Figure 1a and 1d). The main CDOT regions represented are Regions 1, 2, 4 and 6, which encompass all of Eastern Colorado (East of the Continental Divide). Maps C1, C2 and C3 in Appendix C display the locations of the bridges, the bridge type and ADT, respectively. While an attempt was made to have a distribution of average daily traffic volumes (ADT’s) across the regions, the limited amount of data restricted this somewhat. For the seven bridges in Region 1, four had ADT’s on the order of 20,000 and three were around 70,000. For Region 2, the five bridges consisted of two with ADT values below 10,000 and one each around 40,000, 60,000 and 90,000. There was only one bridge in Region 3, and in Region 4, four bridges had ADT values around 4,000 and one bridge was around 80,000. No bridges were studied in Region 5, and two bridges in Region 6 (ADT values around 24,000 and 79,000). 3.2 Cost Analysis A goal of this study is to determine if and how bridge type effects user cost in terms of delay time and safety (quantified in terms of injuries and fatalities) during construction. Delay cost is a function of ADT, delay time (t), the duration of the project in days (d), the distribution of freight and cars (Vf and Vv), and the cost per hour of delay for both freight and passenger cars (Cf and Cv, modified to 2010 dollars). The full calculation for delay cost is shown in Equation 1 below (Perrin and Jhaveri 2004).
7
⎟⎟⎠
⎞⎜⎜⎝
⎛∗+∗∗∗∗= ffovv VCFVCdtADTC * Equation (1)
In which:
• ADT = average daily traffic volume • t = delay time • d = duration of the project in days • Vf = the fraction of vehicles that are freight (trucks) • Vv = the fraction of vehicles that are cars • Cf = cost per hour of delay for freight (trucks) • Cv = cost per hour of delay for cars • Fo = vehicle occupancy factor for cars
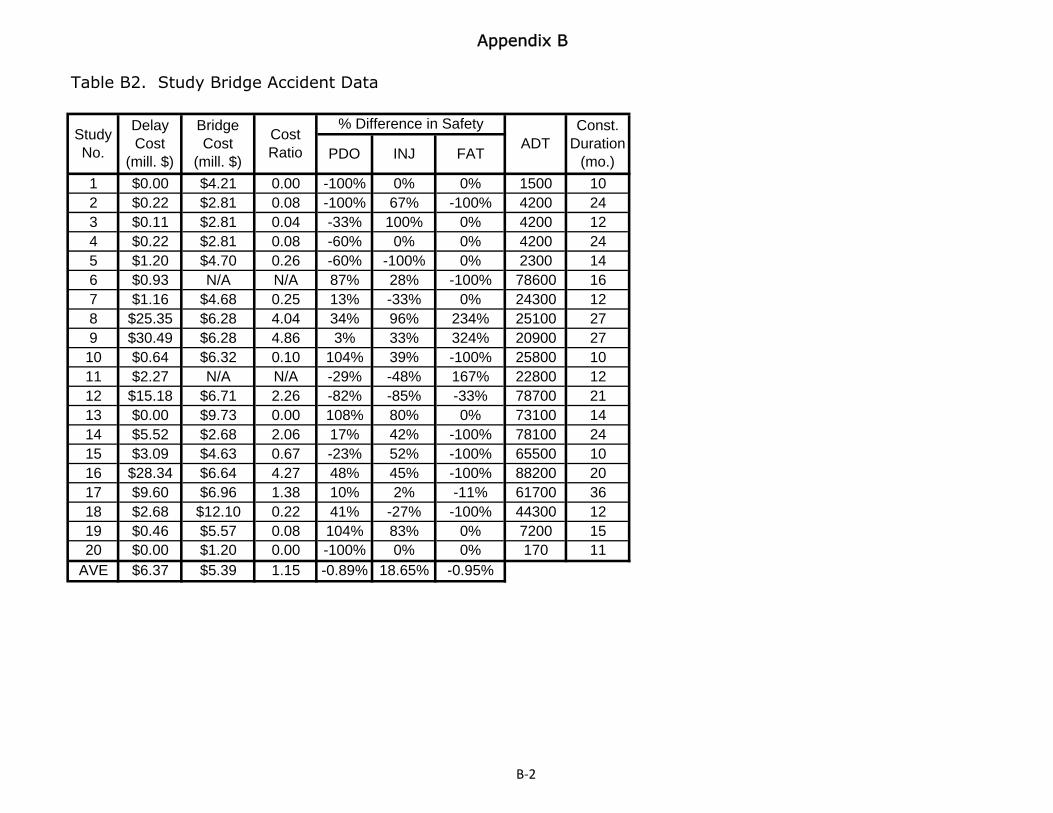
The cost per hour (modified to 2010 dollars) of delay for freight and vehicles used in analysis are $59.56 and $20.47, respectively (Perrin and Jhaveri 2004). In order to best determine the amount of delay time due to the construction of the study bridges, the length of road affected by each construction was divided by both the original speed limit and the reduced speed limit to obtain the amount of time needed to travel the bridge before and during construction. The difference between these two driving times provides the delay time due to construction. The duration of the construction was determined from the bridge surveys. The values of ADT and percentage of ADT corresponding to freight travel were provided by CDOT. Lastly Fo, the vehicle occupancy factor, i.e., the average number of occupants in a passenger car, was set to 1.2 (Perrin and Jhaveri 2004). The results of these calculations are listed in Table B2 (Bridge Costs and Accident Data) of Appendix B. User delay cost values, when compared to the corresponding bridge construction costs, provide a valuable tool for future bridge construction decision-making. Bridge construction costs, provided by CDOT, are listed in Appendix Table B2 and are shown graphically below alongside delay cost in Figure 2.

8
(a)
(b)
$0
$5
$10
$15
$20
$25
$30
$35
A‐27‐P
B‐23
‐BA
B‐24
‐AI
B‐24
‐AV
D‐05‐A
E‐16
‐HK
E‐17
‐UK
F‐15
‐DG
F‐15
‐DI
F‐16
‐JB
F‐16
‐UA
F‐17
‐GZ
G‐17‐BG
G‐17‐BH
G‐17‐DA
I‐17‐FJ
I‐17‐LX
J‐18
‐QL‐18
‐BD
N‐28‐M
Cost (M
illions)
Structure Number
Delay Cost
Bridge Cost
$0.00
$2.00
$4.00
$6.00
$8.00
$10.00
$12.00
Region 1 Region 2 Region 3 Region 4 Region 6
Average
Cost (Millions)
Region
Delay Cost
Bridge Cost

9
(c)
(d)
$0.00
$5.00
$10.00
$15.00
$20.00
$25.00
$30.00
0‐20 20‐40 40‐60 60‐80 80‐100
Average
Cost (Millions)
ADT (Thousands)
Delay Cost
Bridge Cost
$0.00
$5.00
$10.00
$15.00
$20.00
$25.00
$30.00
9‐15 15‐21 21‐27 27‐33 33‐39
Average
Cost (Millions)
Construction Duration (months)
Delay Cost
Bridge Cost

10
(e)
(f) Figure 2. Distribution of bridge construction and user delay cost in millions of dollars by (a) each bridge, (b) CDOT Region, (c) ADT, (d) construction duration, (e) bridge type, and (f) average construction duration in months by bridge type.
$0.00
$4.00
$8.00
$12.00
$16.00
$20.00
CBGC CBGCP CBGP CICK CPG CPGC WG WGCK
Average
Cost (Millions)
Bridge Type
User Cost
Bridge Cost
0.0
5.0
10.0
15.0
20.0
25.0
30.0
35.0
CBGC CBGCP CBGP CICK CPG CPGC WG WGCK
Average
Con
struction Duration (m
onths)
2 bridges 1 bridge 6 bridges 1 bridge 4 bridges 4 bridges 1 bridge 1 bridge
Bridge Type

11
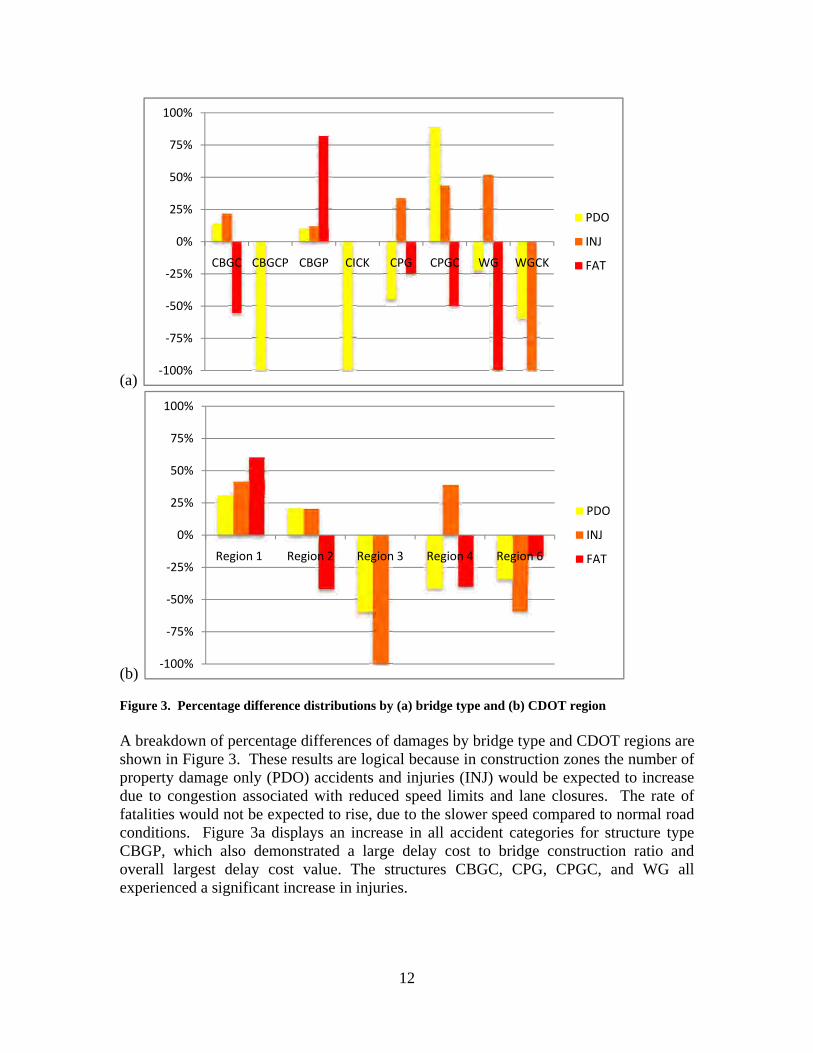
It is evident from Figure 2 that user delay cost accounts for a significant amount of cost, typically on the same order as the total bridge construction cost. The exception is for those regions in which bridges that were analyzed had low ADT’s or construction duration (see Figures 2c and d). For instance, the bridge in Region 3 had an ADT of 2300, and four of the five bridges analyzed in Region 4 had an ADT of 4200 or less (see Table B1 for more details). The structure types with the greatest delay cost, as compared to construction cost, are CBGP and CBGC, with delay to bridge cost ratios of 2.64 and 1.57, respectively (Figure 2e). The structure CBGP also had the largest overall user delay cost of 17 million dollars. Since delay cost is calculated based on construction duration and speed limit reduction, a combination of these factors are likely responsible for the large user cost values. Figure 2f displays construction durations (obtained from the questionnaires as the time between “Date construction began” until “Date of substantial completion”) for each of the study structure types. Additionally, from Figure 2b, it is evident that Regions 1, 2, and 6 have large user delay costs. This is significant, since these regions represent many of the larger population centers in Colorado, including Denver, Colorado Springs, and surrounding suburbs. Figures C4 and C5 in Appendix C map both user delay cost and the ratio of delay cost to bridge cost for each bridge. In addition to the user cost attributed to an increase in travel time during bridge construction, the cost of injuries and fatalities must also be taken into account. While studies quantify a human life in terms of monetary values, here the change in property damage only (PDO), injuries (INJ) and fatalities (FAT) quantities during construction dates are contrasted to those from the comparison dates, comprised of two years before and after construction. The data are actual accident data supplied by CDOT. The percentage difference of accident data as defined in terms of the comparison dates is listed in Table B2 in Appendix B, with distributions shown below in Figure 3. These comparisons were made by noting the actual number of each type of accident during construction, and then normalizing that to an equivalent one-year period. Then the comparison four years (two years before construction and two years after construction) were also normalized to an annual figure. On average, property damage decreased slightly by 0.9%, while injuries increased 18.7% and fatalities decreased by 1% (Appendix B).
12
(a)
(b) Figure 3. Percentage difference distributions by (a) bridge type and (b) CDOT region A breakdown of percentage differences of damages by bridge type and CDOT regions are shown in Figure 3. These results are logical because in construction zones the number of property damage only (PDO) accidents and injuries (INJ) would be expected to increase due to congestion associated with reduced speed limits and lane closures. The rate of fatalities would not be expected to rise, due to the slower speed compared to normal road conditions. Figure 3a displays an increase in all accident categories for structure type CBGP, which also demonstrated a large delay cost to bridge construction ratio and overall largest delay cost value. The structures CBGC, CPG, CPGC, and WG all experienced a significant increase in injuries.
‐100%
‐75%
‐50%
‐25%
0%
25%
50%
75%
100%
CBGC CBGCP CBGP CICK CPG CPGC WG WGCK
PDO
INJ
FAT
‐100%
‐75%
‐50%
‐25%
0%
25%
50%
75%
100%
Region 1 Region 2 Region 3 Region 4 Region 6
PDO
INJ
FAT

13
3.3 Factor Analysis Factor analysis is a statistical technique used to isolate a reduced number of factors, which can account for the variability of a larger number of variables (Kline 1994). In this study, the statistical software SPSS was used to perform principal components analysis, a popular form of factor analysis in which the total variance is analyzed and the resultant orthogonal factor axes are rotated (varimax rotation) in order to make the factors more understandable in relation to the original variables. The goal is to unearth an underlying set of factors that explains most of the variation in a set of data. If this can be done, the original variables can be replaced by a smaller and more meaningful set of basic factors. Since these factors are a statistical artifact, their interpretation must come by looking at the correlation (so-called factor loadings) of the original variables on each of the factors. If successful, the result identifies a nearly unique set of variables for each factor. Since the aim of this study is to determine how structure type affects user cost, four variables were used for factor analysis. These variables were structure type, construction duration, ADT, and delay cost. The Kaiser-Meyer-Olkin (KMO) measure of sampling adequacy was used to assess the quality of data input into factor analysis. Ideally, the KMO sampling value is equal to one; for this analysis the value is 0.58. Typically values greater than 0.5 are preferable as indicators of adequate sampling. The KMO value of 0.58 is within this tolerance, and is likely to improve with the addition of more sampling points (bridges). With the number of bridges available at this time, the number of variables was limited to four in order to obtain a satisfactory KMO measure. Figure 4 outlines the extraction of two factors from the four original input variables. With four factors, i.e., the four original variables, 100% of the original variance is accounted. The two extracted factors still encompass a significant amount of variance, 72%. These results indicate that most of the variability in the data can be explained by just two factors.
Figure 4. Total variance explained by principal components (principal factors) analysis

14
In order to determine the underlying significance of these two extracted factors, a graph of the rotated factor scores is shown in Figure 5. These scores indicate the loading of each variable on each factor. From the graph, it is clear that delay cost and construction duration both have very high loadings on factor 1, and very low on factor 2. Similarly, structure type and ADT have high loadings on factor 2, and low on factor 1. Therefore, the two important factors can be fairly uniquely related to the original four variables, and results can be implied from two meaningful factors. One factor is related to the duration of construction and resultant delay cost. Since the latter is dependent on the former, one is led to the conclusion that construction duration is a key variable. The other factor is highly dependent on structure type and ADT. The conclusion is that certain structure types and levels of ADT are leading to projects that need special consideration.
Figure 5. Rotated factor plot The implication of this analysis is that two factors explain three-quarters of the variability among the data. The first factor is only slightly more dominant than the second, and it is heavily related to construction duration and delay cost. Thus project duration should be strongly considered in bridge construction planning. As anticipated, project duration is a major determinant of delay cost, influenced of course by structure type. Figure 2f on page 10 displays the distribution of average project duration in months by structure type. Structure type CBGC required the greatest amount of time for project completion (Fig. 2f). The second factor is almost as important as the first, and it is heavily influenced by structure type, and somewhat by ADT. However, structure type can ultimately affect the duration of a project, and therefore bridge selection should be carefully considered. Additionally, ADT has a direct influence on delay cost, since the number of vehicles on the road directly influence the delay cost of a bridge project.
15
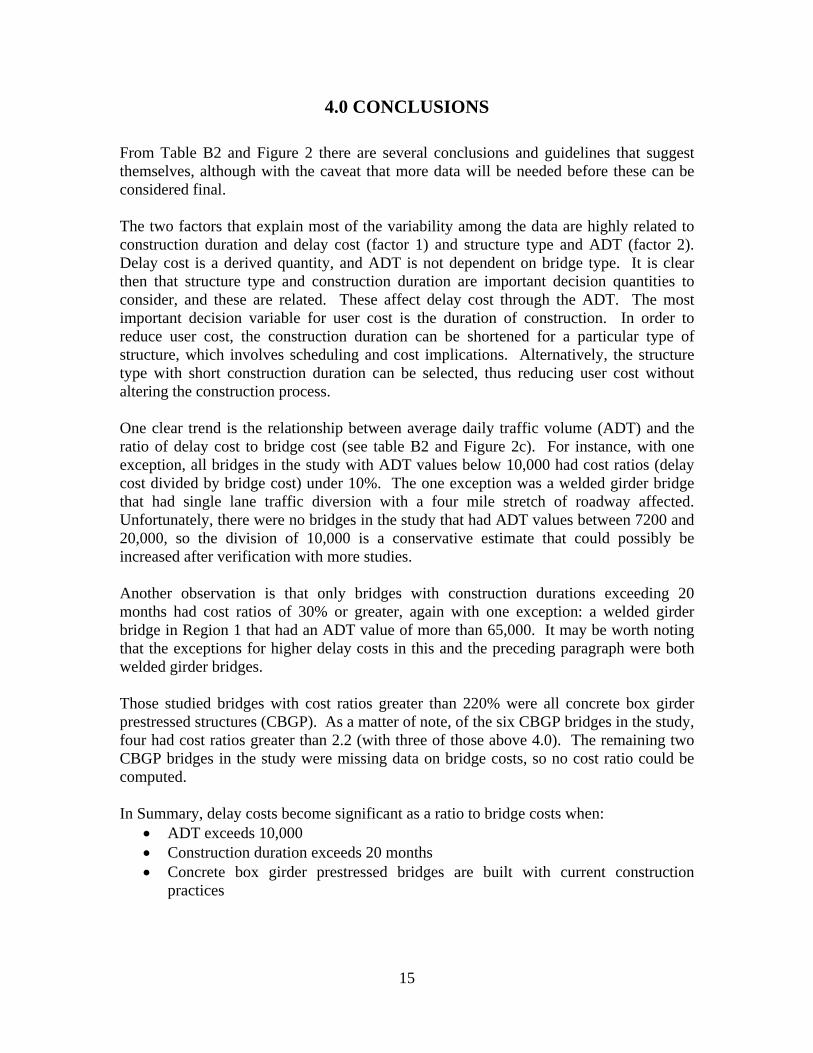
4.0 CONCLUSIONS From Table B2 and Figure 2 there are several conclusions and guidelines that suggest themselves, although with the caveat that more data will be needed before these can be considered final. The two factors that explain most of the variability among the data are highly related to construction duration and delay cost (factor 1) and structure type and ADT (factor 2). Delay cost is a derived quantity, and ADT is not dependent on bridge type. It is clear then that structure type and construction duration are important decision quantities to consider, and these are related. These affect delay cost through the ADT. The most important decision variable for user cost is the duration of construction. In order to reduce user cost, the construction duration can be shortened for a particular type of structure, which involves scheduling and cost implications. Alternatively, the structure type with short construction duration can be selected, thus reducing user cost without altering the construction process. One clear trend is the relationship between average daily traffic volume (ADT) and the ratio of delay cost to bridge cost (see table B2 and Figure 2c). For instance, with one exception, all bridges in the study with ADT values below 10,000 had cost ratios (delay cost divided by bridge cost) under 10%. The one exception was a welded girder bridge that had single lane traffic diversion with a four mile stretch of roadway affected. Unfortunately, there were no bridges in the study that had ADT values between 7200 and 20,000, so the division of 10,000 is a conservative estimate that could possibly be increased after verification with more studies. Another observation is that only bridges with construction durations exceeding 20 months had cost ratios of 30% or greater, again with one exception: a welded girder bridge in Region 1 that had an ADT value of more than 65,000. It may be worth noting that the exceptions for higher delay costs in this and the preceding paragraph were both welded girder bridges. Those studied bridges with cost ratios greater than 220% were all concrete box girder prestressed structures (CBGP). As a matter of note, of the six CBGP bridges in the study, four had cost ratios greater than 2.2 (with three of those above 4.0). The remaining two CBGP bridges in the study were missing data on bridge costs, so no cost ratio could be computed. In Summary, delay costs become significant as a ratio to bridge costs when:
• ADT exceeds 10,000 • Construction duration exceeds 20 months • Concrete box girder prestressed bridges are built with current construction
practices

16
5.0 RECOMMENDATIONS The limited number of bridges available for study indicated a significant delay cost to bridge cost ratio for longer construction durations, associated with certain structural materials. Nevertheless, more quantitative studies should be performed if an automated procedure is desired to identify candidate bridges for user cost studies before final material for bridge construction is selected. The number of bridges studied prevented the inclusion of a larger number of variables in the factor analysis. For projects involving high values of ADT, CDOT should adopt a policy of contemporaneous records of construction traffic control, including congestion and accidents. From the questionnaire that was developed, the key information should be distilled to allow determination of key aspects related to user costs. These records should become a permanent part of the closeout documentation for these projects. Such data will be essential for CDOT to move in the direction of evaluating the effect of construction operations on the public. By requiring such a Project Closeout Form on projects with high values of ADT, CDOT personnel on those projects will understand the importance of such data to the public.

17
6.0 REFERENCES Colorado Department of Transportation, 2005. Field Log of Structures. Prepared by Staff
Bridge Branch. Colorado Department of Transportation. Structure Inspection and Inventory Report. Kline, P., 1994. An Easy Guide to Factor Analysis. London: Routledge. Kottegoda, T., and Rosso, R., 1997. Statistics, Probability, and Reliability for Civil and
Environmental Engineers. New York: McGraw-Hill.
Norusis, M. J., 2006. SPSS 15.0 Guide to Data Analysis. Upper Saddle River, N.J.: Prentice Hall.
Perrin, J., and Jhaveri, C., 2004. The Economic Cost of Culvert Failures. Prepared for
the Transportation Research Board.
Persaud, B. N., et al, 2001. Statistical Methods in Highway Safety Analysis. Washington, D.C.: National Academy Press.
U.S. Department of Transportation, Federal Highway Administration, 1995. Recording
and Coding Guide for the Structure Inventory and Appraisal of the Nation’s Bridges. Report No. FHWA-PD-96-001.

WELD
MESA
MOFFAT
BACA
YUMA
PARK
LAS ANIMAS
ROUTT
GUNNISON
LINCOLN
GARFIELD
LARIMER
PUEBLO
BENTSAGUACHE
KIOWA
LOGAN
RIO BLANCO GRAND
EAGLE
ELPASO
ELBERT
MONTROSE
WASHINGTON
LA PLATA
OTERO
KIT CARSON
DELTA
JACKSON
ADAMS
CHEYENNE
PROWERS
MONTEZUMA
FREMONT
PITKIN
MORGAN
HUERFANO
CONEJOS COSTILLA
HINSDALE
ARCHULETA
DOLORES
CHAFFEE
SAN MIGUEL
MINERAL
CUSTER
DOUGLAS
CROWLEY
SUMMIT
PHILLIPS
BOULDER
OURAY
ALAMOSA
LAKE
TELLER
ARAPAHOE
RIO GRANDE
JEFFE
RSON
SEDGWICK
SANJUAN
CLEARCREEK
GILPINBROOMFIELD
DENVER
3
25
4
16
CDOT Engineering Regions
¹
Data Source: CDOT 2008 Published: June 2008
Appendix A
A-1

Table A1 - Characteristics of Bridges Considered
Structure Year Str ADT Truck Serv Lanes Length Maxspan Detour Re- Feature Intersected BridgeNumber Built Type % On On (ft) (ft) (mile) gion TypeA-27-P 2000 6 1500 10 1 2 264.0 104.0 4 4 UP RR CBGCPA-28-Z 2001 1 670 21 1 2 32.0 16.4 4 4 SAND CREEK CBC
B-16-P MINOR 2000 1 42300 3 1 7 12.0 12.0 1 4 PEDESTRIAN UNDERPASS CBCB-17-DD 2005 5 3100 16 1 2 87.0 42.3 1 4 SPRING CREEK CPGB-23-AW 2005 5 3000 6 1 4 216.9 107.0 1 4 PAWNEE CREEK CBGPB-23-BA 2003 5 4200 30 1 2 113.0 110.0 1 4 SH 63 ML CPGB-23-BB 2003 5 4200 30 1 2 114.0 110.0 1 4 SH 63 ML CPGB-24-AD 2003 5 4200 30 1 2 88.0 85.3 1 4 COUNTY ROAD 14 CPGB-24-AI 2002 1 4200 30 1 2 88.0 86.0 1 4 COUNTY ROAD 14 CPGB-24-AU 2003 5 4200 30 1 2 88.0 85.3 1 4 FARM ROAD CPGB-24-AV 2003 5 4200 30 1 2 88.0 86.0 1 4 FARM ROAD CPGB-24-AW 2003 5 4200 30 1 2 88.0 86.0 1 4 FARM ROAD CPGB-24-AX 2003 5 4200 25 1 2 88.0 85.3 0 4 FARM ROAD CPGB-24-AY 2003 5 4200 30 1 2 88.0 86.0 1 4 FARM ROAD CPGB-24-AZ 2003 5 4200 30 1 2 88.0 85.3 1 4 FARM ROAD CPGB-27-J 2004 6 1500 23 1 2 169.1 83.0 4 4 N.FK.FRENCHMAN CREEK CPGCB-28-C 2005 1 2200 15 1 2 24.6 11.5 2 4 DRAW CBC
C-09-AC 2001 1 3900 3 1 2 22.0 10.6 1 3 MCKINNIS CREEK CBCC-10-D 2000 1 2200 12 1 2 22.1 22.1 99 3 DIAMOND CREEK CBCC-11-J 2005 1 750 15 1 2 58.0 0.0 99 3 GRIZZLY CREEK CBC
C-14-A MINOR 2000 1 16600 2 1 5 16.2 16.2 12 4 PEDESTRIAN UNDERPASS PCBC
Selected bridges are highlighted in blue.
C-14-C MINOR 2002 1 6700 3 1 2 12.0 12.0 3 4 Ped. Underpass CBCC-15-F 2003 1 5100 3 1 2 33.0 15.0 24 4 DICKSON GULCH CBCC-15-O 2002 6 5100 3 1 2 136.0 62.3 3 4 Big Thompson River CBGPC-15-U 2003 1 5100 3 5 2 129.0 124.6 3 4 BIG THOMPSON RIVER CSGPC-15-Y 2003 6 5100 3 5 2 145.0 68.7 24 4 N FK BIG THOMPSON RIVER CBGC
C-16-B MINOR 2002 1 17100 6 1 4 16.0 16.0 1 4 PEDESTRIAN UNDERPASS CBCC-16-BC 2005 6 15800 3 1 4 164.0 81.0 3 4 DRY CREEK CPGCC-16-BH 2003 1 19200 4 5 4 45.0 39.4 1 4 GREELEY-LOVELAND CANAL CSC-16-BI 2002 1 11200 5 5 2 45.0 42.0 1 4 GREELEY-LOVELAND CANAL CSC-16-BX 2004 5 11300 3 5 4 196.0 97.0 3 4 US 287 ML CPGC-16-CF 2005 6 11200 3 1 5 204.9 93.0 3 4 BURLINGTON RR CPGCC-16-CK 2005 6 11200 3 1 4 120.0 117.0 2 4 FIRST STREET CPGC-16-DA 2005 5 8800 5 1 2 149.0 72.0 3 4 BIG THOMPSON RIVER CBGPC-16-DD 2005 5 8600 6 1 2 218.9 72.5 6 4 BIG THOMPSON RIVER CBGP
Selected bridges are highlighted in blue.
Appendix A
A-2
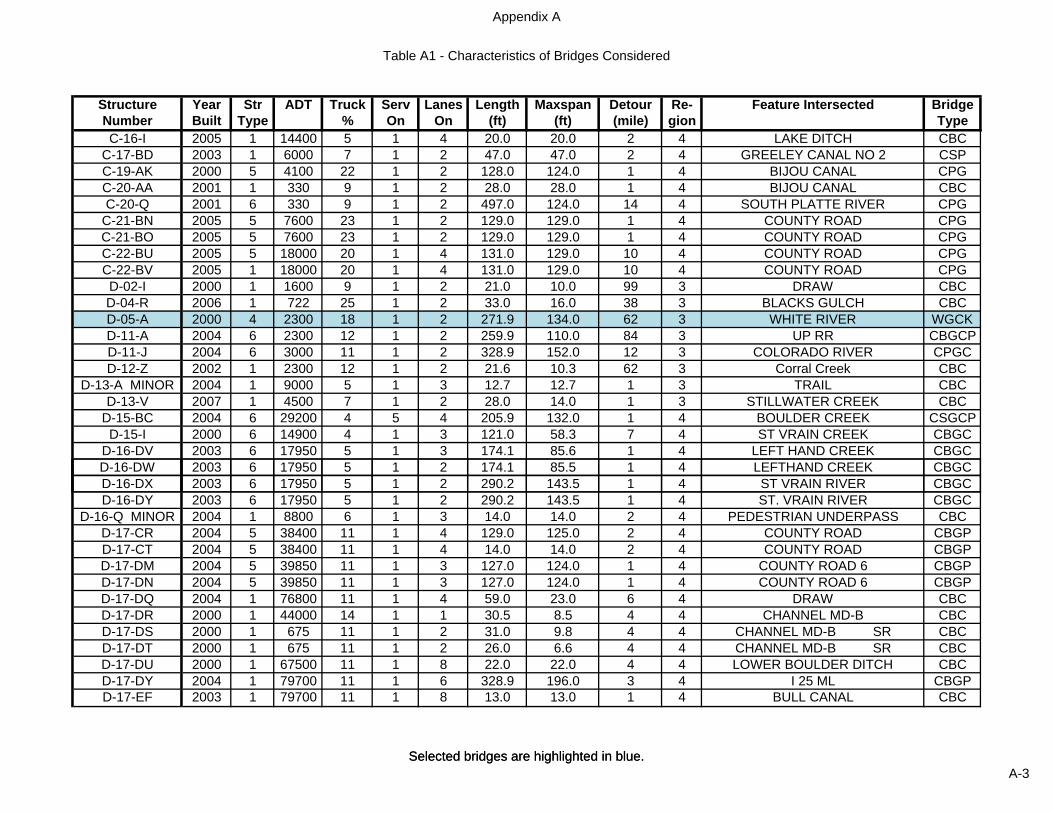
Table A1 - Characteristics of Bridges Considered
Structure Year Str ADT Truck Serv Lanes Length Maxspan Detour Re- Feature Intersected BridgeNumber Built Type % On On (ft) (ft) (mile) gion TypeC-16-I 2005 1 14400 5 1 4 20.0 20.0 2 4 LAKE DITCH CBC
C-17-BD 2003 1 6000 7 1 2 47.0 47.0 2 4 GREELEY CANAL NO 2 CSPC-19-AK 2000 5 4100 22 1 2 128.0 124.0 1 4 BIJOU CANAL CPGC-20-AA 2001 1 330 9 1 2 28.0 28.0 1 4 BIJOU CANAL CBCC-20-Q 2001 6 330 9 1 2 497.0 124.0 14 4 SOUTH PLATTE RIVER CPG
C-21-BN 2005 5 7600 23 1 2 129.0 129.0 1 4 COUNTY ROAD CPGC-21-BO 2005 5 7600 23 1 2 129.0 129.0 1 4 COUNTY ROAD CPGC-22-BU 2005 5 18000 20 1 4 131.0 129.0 10 4 COUNTY ROAD CPGC-22-BV 2005 1 18000 20 1 4 131.0 129.0 10 4 COUNTY ROAD CPGD-02-I 2000 1 1600 9 1 2 21.0 10.0 99 3 DRAW CBCD-04-R 2006 1 722 25 1 2 33.0 16.0 38 3 BLACKS GULCH CBCD-05-A 2000 4 2300 18 1 2 271.9 134.0 62 3 WHITE RIVER WGCKD-11-A 2004 6 2300 12 1 2 259.9 110.0 84 3 UP RR CBGCPD-11-J 2004 6 3000 11 1 2 328.9 152.0 12 3 COLORADO RIVER CPGCD-12-Z 2002 1 2300 12 1 2 21.6 10.3 62 3 Corral Creek CBC
D-13-A MINOR 2004 1 9000 5 1 3 12.7 12.7 1 3 TRAIL CBCD-13-V 2007 1 4500 7 1 2 28.0 14.0 1 3 STILLWATER CREEK CBC
D-15-BC 2004 6 29200 4 5 4 205.9 132.0 1 4 BOULDER CREEK CSGCPD-15-I 2000 6 14900 4 1 3 121.0 58.3 7 4 ST VRAIN CREEK CBGC
D-16-DV 2003 6 17950 5 1 3 174.1 85.6 1 4 LEFT HAND CREEK CBGCD-16-DW 2003 6 17950 5 1 2 174.1 85.5 1 4 LEFTHAND CREEK CBGC
Selected bridges are highlighted in blue.
D-16-DX 2003 6 17950 5 1 2 290.2 143.5 1 4 ST VRAIN RIVER CBGCD-16-DY 2003 6 17950 5 1 2 290.2 143.5 1 4 ST. VRAIN RIVER CBGC
D-16-Q MINOR 2004 1 8800 6 1 3 14.0 14.0 2 4 PEDESTRIAN UNDERPASS CBCD-17-CR 2004 5 38400 11 1 4 129.0 125.0 2 4 COUNTY ROAD CBGPD-17-CT 2004 5 38400 11 1 4 14.0 14.0 2 4 COUNTY ROAD CBGPD-17-DM 2004 5 39850 11 1 3 127.0 124.0 1 4 COUNTY ROAD 6 CBGPD-17-DN 2004 5 39850 11 1 3 127.0 124.0 1 4 COUNTY ROAD 6 CBGPD-17-DQ 2004 1 76800 11 1 4 59.0 23.0 6 4 DRAW CBCD-17-DR 2000 1 44000 14 1 1 30.5 8.5 4 4 CHANNEL MD-B CBCD-17-DS 2000 1 675 11 1 2 31.0 9.8 4 4 CHANNEL MD-B SR CBCD-17-DT 2000 1 675 11 1 2 26.0 6.6 4 4 CHANNEL MD-B SR CBCD-17-DU 2000 1 67500 11 1 8 22.0 22.0 4 4 LOWER BOULDER DITCH CBCD-17-DY 2004 1 79700 11 1 6 328.9 196.0 3 4 I 25 ML CBGPD-17-EF 2003 1 79700 11 1 8 13.0 13.0 1 4 BULL CANAL CBC
Selected bridges are highlighted in blue.
Appendix A
A-3

Table A1 - Characteristics of Bridges Considered
Structure Year Str ADT Truck Serv Lanes Length Maxspan Detour Re- Feature Intersected BridgeNumber Built Type % On On (ft) (ft) (mile) gion TypeD-17-EG 2004 1 76800 11 1 6 509.9 10.0 1 4 DRAW CBCD-18-BR 2000 6 4700 18 6 3 183.0 88.6 7 4 I 76 ML CPGCD-18-BS 2000 6 8250 19 1 3 230.8 75.4 1 4 BOX ELDER CRK FRM ACC. R CPGCD-18-BT 2000 6 8250 19 1 3 231.0 75.4 1 4 BOX ELDER CRK FRM. ACCES CPGCD-18-BU 2000 6 8250 19 6 2 159.0 72.2 0 4 COUNTY ROAD 49 CPGCD-18-BV 2000 6 8250 19 6 2 160.0 72.2 0 4 COUNTY ROAD 49 CPGCD-18-BW 2000 6 165 19 1 2 230.0 75.4 6 4 BOX ELDER CREEK SR CPGCD-20-K 2005 5 4100 22 1 2 344.9 85.0 5 4 KIOWA CREEK CPGD-23-C 2000 1 2200 23 1 2 44.0 13.7 27 4 CAMP CREEK CBCE-12-I 2002 5 3400 11 1 2 134.7 131.7 61 1 BLUE RIVER CPGE-13-Y 2004 1 16400 6 1 2 23.0 23.0 1 3 PEDESTRIAN UNDERPASS CBC
E-14-AC 2005 3 550 7 1 3 24.0 24.0 4 1 GAME CROSSING SACE-14-BH 2000 5 71 7 1 2 79.6 76.0 4 1 W FORK CLEAR CREEK SR CBGPE-16-HK 2001 5 78600 4 1 4 56.7 53.0 2 4 RAMP B & BIKEPATH CBGPE-16-KY 2001 5 86200 3 5 4 313.8 161.0 0 6 US 36 ML CPGC
E-16-L MINOR 2000 1 79700 4 1 8 16.0 16.0 2 4 RTD PED. UNDERPASS CBCE-16-NK 2000 1 13800 6 1 6 20.7 20.7 10 6 CROKE CANAL CBCE-16-PX 2002 6 44500 2 6 6 344.3 170.6 1 6 US 36 ML CPGCE-16-RB 2001 5 1E+05 4 6 7 198.4 97.9 1 6 PECOS STREET CBGCE-16-WC 2001 1 39000 5 5 6 22.0 22.0 3 6 LITTLE DRY CREEK TRAIL CBCE-16-WD 2003 6 44100 5 6 8 246.4 121.0 10 6 US 287 ML CPGC
Selected bridges are highlighted in blue.
E-16-WE 2003 1 44100 5 6 8 246.9 121.0 10 6 WBND US 287 ML CPGCE-16-WG 2006 3 75900 3 3 6 233.9 233.9 1 4 U 36 ML SAE-16-WW 2006 5 82900 3 1 6 60.1 57.0 1 6 Promenade Dr. CPGE-17-ABI 2005 6 32400 5 6 4 200.9 102.0 3 6 I-270 CPGCE-17-ABJ 2003 4 83100 15 1 10 805.4 220.8 1 6 NWP SDGCE-17-ABU 2006 5 83100 15 5 6 267.9 134.0 1 6 I25 ML CPGC
E-17-AC MINOR 2003 1 26400 26 1 4 13.9 13.9 4 6 FARM UNDERPASS CBCE-17-QB 2003 5 41600 17 1 3 149.0 146.0 1 6 RAMP TO I76 WB R CBGPE-17-QC 2003 5 41600 17 1 3 146.0 146.0 1 6 RAMP TO WB I76 R CBGPE-17-QD 2003 5 41600 17 1 3 159.0 156.0 1 6 RAMP TO I76 WBND CBGPE-17-QF 2000 6 41600 17 1 1 247.9 108.0 1 6 OVER YORK STREET CPGCE-17-QG 2003 6 41600 17 1 1 160.0 85.0 1 6 YORK ST. R CPGCE-17-QH 2003 1 72800 15 1 5 172.0 170.0 1 6 WASHINGTON STREET CBGPE-17-QP 2003 6 28600 15 1 2 829.0 160.7 2 6 I76 RAMP,SH224,CLEAR CRK CPGC
Selected bridges are highlighted in blue.
Appendix A
A-4

Table A1 - Characteristics of Bridges Considered
Structure Year Str ADT Truck Serv Lanes Length Maxspan Detour Re- Feature Intersected BridgeNumber Built Type % On On (ft) (ft) (mile) gion TypeE-17-QS 2003 4 72800 15 6 3 331.9 180.0 1 6 SH 270 ML WGCKE-17-QT 2003 4 20800 17 6 4 331.9 180.0 1 6 I 270 ML WGCKE-17-UG 2002 6 27000 21 5 4 990.0 145.0 1 6 I76 ML CPGCE-17-UK 2003 5 24300 21 1 6 84.0 82.0 5 6 SECOND CREEK CPGE-17-UM 2002 6 12750 21 1 2 220.9 72.0 1 6 THIRD CREEK CPGCE-17-UP 2001 6 77100 10 6 4 630.0 170.6 1 6 WASHINGTON ST/S PLATTE R CPGCE-17-UQ 2001 6 4900 10 1 1 301.0 148.0 1 6 SOUTH PLATTE RIVER R CPGCE-17-UR 2003 6 69800 10 1 5 1875.0 188.3 5 6 BNSF RR/CITY STREETS CPGCE-17-UU 2003 6 69800 10 6 5 1874.8 188.0 5 6 RR & CITY STREETS CPGCE-17-UW 2003 6 77100 10 1 6 629.8 170.5 1 6 WASH.ST./S.PLATTE RIVER CPGCE-17-UX 2003 6 4600 10 6 2 299.9 149.0 1 6 Platte R. CPGCE-17-UY 2003 5 1E+05 10 1 3 138.0 136.0 5 6 SH 265 Brighton Blvd. CSGPE-17-UZ 2002 6 12000 10 1 2 202.4 100.0 2 6 BIG DRY CREEK CBGCE-17-WB 2003 4 7200 21 1 1 519.9 140.0 0 6 CAMERON DR,BNSF,3RD CRK WGCKE-17-WO 2003 5 25500 21 1 1 211.9 104.0 0 6 RELOCATED 3RD CREEK R CPGCE-17-WZ 2000 6 66900 12 6 6 236.0 114.8 0 6 US 6 ML CBGPE-17-XX 2002 5 42500 5 1 6 159.5 157.0 1 6 SMITH RD,UP RR CPGE-17-YY 2002 6 25500 21 1 7 677.8 133.0 1 6 I76, BNSFRR CPGCE-17-YZ 2002 6 2700 0 1 1 218.9 71.0 1 6 RELOCATED THIRD CREEK CPGCE-17-ZA 2002 6 37800 9 1 4 778.8 130.0 1 6 US85, UPRR, FULTON DITCH CPGCE-17-ZB 2002 6 37800 9 6 4 230.9 114.0 1 6 US 85 CPGC
Selected bridges are highlighted in blue.
E-17-ZD 2003 4 83100 15 8 8 1261.7 170.0 1 6 I25, E470 ML, RAMPS WGCKE-17-ZE 2003 4 83100 15 7 6 802.8 227.9 1 6 I25, NWP WGCKE-17-ZK 2002 6 41550 15 1 3 252.6 124.0 1 6 NWP/E470 CICKPE-17-ZL 2004 6 83100 17 5 6 272.4 130.3 2 6 I-25 CPGCE-17-ZM 2003 4 83100 15 1 4 1359.3 171.2 0 6 NWP SDGCE-17-ZN 2003 6 83800 15 1 8 326.5 161.0 1 6 I-25 CBGCPE-17-ZO 2002 6 37800 9 1 4 781.8 130.0 1 6 US85, UPRR, FULTON DITCH CPGCE-17-ZP 2003 6 41550 15 1 3 252.6 124.0 1 6 NWP/E470 CSGPE-17-ZW 2006 6 57600 3 6 10 274.7 135.0 2 6 I 25 ML CBGCPE-17-ZY 2002 6 25500 21 1 7 677.8 133.0 1 6 I76, BNSFRR CPGCE-17-ZZ 2005 6 25800 11 5 2 1046.7 218.9 9 6 US 6 ML CBGCPE-19-Z 2000 6 2700 4 1 2 525.4 105.0 1 1 KIOWA CREEK CPGC
F-10-AC 2001 5 2800 15 1 2 156.4 153.6 1 3 EAGLE RIVER CPGF-10-AH 2005 5 2200 16 1 2 126.1 123.0 65 3 EAGLE RIVER CBGP
Selected bridges are highlighted in blue.
Appendix A
A-5

Table A1 - Characteristics of Bridges Considered
Structure Year Str ADT Truck Serv Lanes Length Maxspan Detour Re- Feature Intersected BridgeNumber Built Type % On On (ft) (ft) (mile) gion TypeF-10-D 2003 6 17650 9 1 2 167.0 82.0 1 3 City Streeet CPGCF-10-W 2003 6 17650 9 1 2 167.0 82.0 1 3 CITY STREET CPGCF-15-AD 2000 3 430 5 1 2 174.0 170.5 1 1 SODA CREEK WGKF-15-DG 2002 5 25100 5 1 6 74.5 72.0 23 1 CONIFER ROAD CBGPF-15-DH 2003 6 20900 5 5 2 198.1 96.3 1 1 US 285 ML CPGCF-15-DI 2003 5 20900 5 1 6 61.0 59.0 0 1 PLEASANT PARK RD. CBGPF-15-DJ 2002 5 23400 5 1 6 54.4 52.2 23 1 KENNEDY GULCH RD CBGPF-16-GD 2000 3 49200 9 3 6 206.0 203.4 4 6 US 85 ML (SANTA FE DR) STTF-16-JB 2003 6 25800 8 1 2 214.9 105.0 3 1 SH 85 ML CPGCF-16-JK 2002 5 2E+05 6 6 10 1636.6 152.0 1 6 BRDWY,BNSF,UPRR,RTD,LR CBGPF-16-KN 2003 6 34800 5 5 4 214.9 110.0 0 6 US 285 ML CPGCF-16-KO 2004 5 21600 11 1 2 112.6 110.0 4 6 DAD CLARK GULCH CPGF-16-NC 2001 6 27300 5 3 5 259.9 128.9 0 6 PEDESTRIAN OVERPASS CBGF-16-NF 2004 5 89200 7 1 1 135.0 135.0 1 6 I70 WBND RAMP CBGPF-16-QJ 2003 6 40000 6 1 1 325.9 131.6 2 6 WALNUT CONNECTOR R CBGPF-16-SF 2003 1 30300 4 5 1 100.0 10.0 2 6 DRAINAGE PCBCF-16-SP 2004 4 17970 6 2 12 732.3 170.0 1 6 BROADWAY/KENTUCKY AVE. WGCKF-16-TW 2002 5 38400 4 2 6 177.0 49.2 3 6 BNSF RR, UP RR CBGF-16-UA 2002 5 22800 5 1 6 50.0 48.0 1 1 NORTH ACCESS ROAD CBGPF-16-WJ 2007 1 17400 2 1 2 12.0 6.0 1 6 STORM DRAINAGE CBCF-17-AX 2000 4 11500 7 6 2 426.9 154.0 2 6 I 225 RAMP R WGCK
Selected bridges are highlighted in blue.
F-17-DZ 2000 4 11830 7 6 2 465.9 175.0 2 6 I 225 RAMP SBND R WGCKF-17-FJ 2005 6 21200 4 1 2 476.1 165.0 1 6 NB I-25 Offramp to I-225 CPGCF-17-FW 2004 5 2E+05 4 1 8 61.0 58.5 1 6 I225 RAMP CPGF-17-GX 2002 4 71600 4 7 10 335.5 164.0 1 6 SH 83 CBGPF-17-GZ 2002 6 78700 4 6 8 335.6 164.0 1 6 SH 83 ML CBGPF-17-HV 2005 6 56750 7 1 2 205.6 104.0 1 6 ILIFF AVE CBGCPF-17-HZ 2005 6 56250 6 1 3 205.5 105.0 1 6 ILIFF AVE. CBGCPF-17-IL 2003 5 1E+05 5 1 2 78.6 75.2 1 6 PEDESTRIAN UNDERPASS CBGPF-17-IW 2004 5 59150 7 1 3 86.6 83.6 1 6 2ND AVE CBGPF-17-IX 2004 5 59150 7 1 2 86.8 83.8 1 6 2ND AVE. CBGCPF-17-KB 2002 5 62850 5 1 2 91.4 78.7 1 6 PEDESTRIAN UNDERPASS CBGPF-17-KI 2003 6 1500 4 1 1 215.3 77.0 1 6 RTD UNDERPASS R CBGPF-17-KJ 2002 4 38000 6 1 1 665.5 170.5 1 6 SH 83 ML R SBGCF-17-KK 2002 6 7160 4 7 2 1342.7 253.9 1 6 OVER I225, SH83, RAMP CBGCP
Selected bridges are highlighted in blue.
Appendix A
A-6
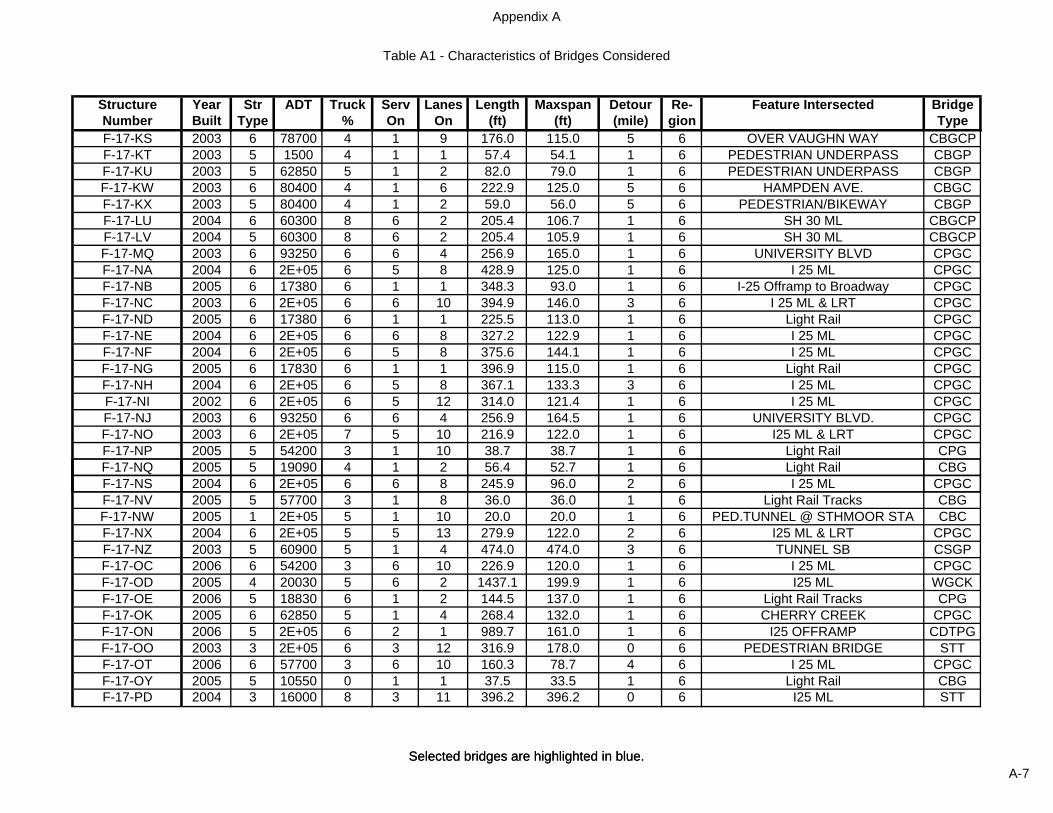
Table A1 - Characteristics of Bridges Considered
Structure Year Str ADT Truck Serv Lanes Length Maxspan Detour Re- Feature Intersected BridgeNumber Built Type % On On (ft) (ft) (mile) gion TypeF-17-KS 2003 6 78700 4 1 9 176.0 115.0 5 6 OVER VAUGHN WAY CBGCPF-17-KT 2003 5 1500 4 1 1 57.4 54.1 1 6 PEDESTRIAN UNDERPASS CBGPF-17-KU 2003 5 62850 5 1 2 82.0 79.0 1 6 PEDESTRIAN UNDERPASS CBGPF-17-KW 2003 6 80400 4 1 6 222.9 125.0 5 6 HAMPDEN AVE. CBGCF-17-KX 2003 5 80400 4 1 2 59.0 56.0 5 6 PEDESTRIAN/BIKEWAY CBGPF-17-LU 2004 6 60300 8 6 2 205.4 106.7 1 6 SH 30 ML CBGCPF-17-LV 2004 5 60300 8 6 2 205.4 105.9 1 6 SH 30 ML CBGCPF-17-MQ 2003 6 93250 6 6 4 256.9 165.0 1 6 UNIVERSITY BLVD CPGCF-17-NA 2004 6 2E+05 6 5 8 428.9 125.0 1 6 I 25 ML CPGCF-17-NB 2005 6 17380 6 1 1 348.3 93.0 1 6 I-25 Offramp to Broadway CPGCF-17-NC 2003 6 2E+05 6 6 10 394.9 146.0 3 6 I 25 ML & LRT CPGCF-17-ND 2005 6 17380 6 1 1 225.5 113.0 1 6 Light Rail CPGCF-17-NE 2004 6 2E+05 6 6 8 327.2 122.9 1 6 I 25 ML CPGCF-17-NF 2004 6 2E+05 6 5 8 375.6 144.1 1 6 I 25 ML CPGCF-17-NG 2005 6 17830 6 1 1 396.9 115.0 1 6 Light Rail CPGCF-17-NH 2004 6 2E+05 6 5 8 367.1 133.3 3 6 I 25 ML CPGCF-17-NI 2002 6 2E+05 6 5 12 314.0 121.4 1 6 I 25 ML CPGCF-17-NJ 2003 6 93250 6 6 4 256.9 164.5 1 6 UNIVERSITY BLVD. CPGCF-17-NO 2003 6 2E+05 7 5 10 216.9 122.0 1 6 I25 ML & LRT CPGCF-17-NP 2005 5 54200 3 1 10 38.7 38.7 1 6 Light Rail CPGF-17-NQ 2005 5 19090 4 1 2 56.4 52.7 1 6 Light Rail CBG
Selected bridges are highlighted in blue.
F-17-NS 2004 6 2E+05 6 6 8 245.9 96.0 2 6 I 25 ML CPGCF-17-NV 2005 5 57700 3 1 8 36.0 36.0 1 6 Light Rail Tracks CBGF-17-NW 2005 1 2E+05 5 1 10 20.0 20.0 1 6 PED.TUNNEL @ STHMOOR STA CBCF-17-NX 2004 6 2E+05 5 5 13 279.9 122.0 2 6 I25 ML & LRT CPGCF-17-NZ 2003 5 60900 5 1 4 474.0 474.0 3 6 TUNNEL SB CSGPF-17-OC 2006 6 54200 3 6 10 226.9 120.0 1 6 I 25 ML CPGCF-17-OD 2005 4 20030 5 6 2 1437.1 199.9 1 6 I25 ML WGCKF-17-OE 2006 5 18830 6 1 2 144.5 137.0 1 6 Light Rail Tracks CPGF-17-OK 2005 6 62850 5 1 4 268.4 132.0 1 6 CHERRY CREEK CPGCF-17-ON 2006 5 2E+05 6 2 1 989.7 161.0 1 6 I25 OFFRAMP CDTPGF-17-OO 2003 3 2E+05 6 3 12 316.9 178.0 0 6 PEDESTRIAN BRIDGE STTF-17-OT 2006 6 57700 3 6 10 160.3 78.7 4 6 I 25 ML CPGCF-17-OY 2005 5 10550 0 1 1 37.5 33.5 1 6 Light Rail CBGF-17-PD 2004 3 16000 8 3 11 396.2 396.2 0 6 I25 ML STT
Selected bridges are highlighted in blue.
Appendix A
A-7

Table A1 - Characteristics of Bridges Considered
Structure Year Str ADT Truck Serv Lanes Length Maxspan Detour Re- Feature Intersected BridgeNumber Built Type % On On (ft) (ft) (mile) gion TypeF-17-PR 2004 5 2E+05 4 1 9 56.8 53.8 1 6 I 25 ML CPGF-17-PS 2004 5 2E+05 5 2 9 53.5 50.5 1 6 I25 ML CPGF-17-QA 2005 6 2E+05 4 1 2 305.8 153.7 1 6 Light Rail Tracks CPGCF-17-QB 2005 5 2E+05 4 1 2 74.7 70.7 1 6 Light Rail Tracks CPGF-17-QE 2005 3 1E+05 8 2 2 249.9 241.4 1 6 S I225 TO S I25 WGKF-17-QF 2005 4 60900 5 2 -1 555.1 229.6 1 6 SB LRT OVER SB I225 WGCKF-17-QH 2005 5 1E+05 8 2 6 118.3 112.0 1 6 SB 225 TO SB 25 CPGF-18-BK 2005 4 1300 8 1 2 469.9 77.8 2 1 BOX ELDER CREEK CICKF-19-M 2002 6 1800 3 1 2 210.4 104.0 6 1 Wolf Creek CBGCF-22-U 2005 1 650 37 1 2 40.8 20.0 8 4 DRAW CBC
G-08-F MINOR 2000 1 17000 4 1 5 10.0 10.0 1 3 PEDESTRIAN UNDERPASS CBCG-08-H 2003 3 17000 4 3 4 329.9 329.9 99 3 SH 82 ML STT
G-09-C MINOR 2000 1 18600 4 1 2 10.0 10.0 62 3 PEDESTRIAN UNDERPASS CBCG-09-I 2000 5 17000 4 1 6 113.0 110.0 62 3 SNOWMASS CREEK CPGG-09-J 2003 6 18600 4 1 2 409.9 160.0 99 3 DRAW CPGCG-09-K 2005 6 18600 4 1 2 409.9 160.0 99 3 DRAW CPGCG-09-L 2003 6 18600 4 1 2 202.9 98.5 99 3 DRAW CPGCG-09-M 2004 5 18600 4 1 2 482.9 120.0 0 3 DRAW CPGCG-09-N 2003 5 18600 4 1 2 949.8 170.0 1 3 DRAW CBGCPG-09-O 2003 6 18600 4 1 2 949.8 170.0 30 3 DRAW CBGCPG-15-A 2002 3 3700 11 3 3 212.9 129.5 1 1 US 285 ML STT
Selected bridges are highlighted in blue.
G-17-BG 2002 5 73100 10 5 8 258.9 130.0 1 1 I25 ML CPGCG-17-BH 2002 6 78100 9 5 6 201.9 103.0 1 1 I 25 ML CBGCG-17-BI 2003 6 3275 9 1 2 195.0 96.3 1 1 PLUM CREEK CPGCG-17-CE 2002 5 11200 7 1 2 40.0 36.1 9 1 Mitchell Gulch CSPG-17-CS 2005 3 78100 9 2 4 174.0 68.9 1 1 UP RR RGG-17-CT 2005 5 90600 8 6 4 247.9 125.0 0 1 I 25 ML CSGPG-17-DA 2001 3 65500 9 5 4 563.0 219.8 1 1 I25 ML & PLUM CREEK WGG-22-BY 2000 6 3000 16 1 2 495.0 121.4 4 1 BIG SANDY CREEK CPGCG-22-BZ 2000 6 4600 14 1 2 238.0 83.4 7 1 UP RR CPGCH-02-AX 2001 1 11900 6 1 2 23.0 23.0 2 3 HUNTER WASH CBCH-02-EG 2005 5 15300 19 6 4 177.0 86.0 0 3 I 70 ML CPG
H-09-B MINOR 2000 1 15400 12 1 8 14.0 14.0 1 3 PEDESTRIAN UNDERPASS CBCH-09-E MINOR 2003 1 23200 3 1 5 17.7 17.7 1 3 PEDESTRIAN UNDERPASS CBCH-09-Q MINOR 2001 1 23200 3 1 5 16.0 16.0 62 3 PEDESTRIAN UNDERPASS CBC
Selected bridges are highlighted in blue.
Appendix A
A-8
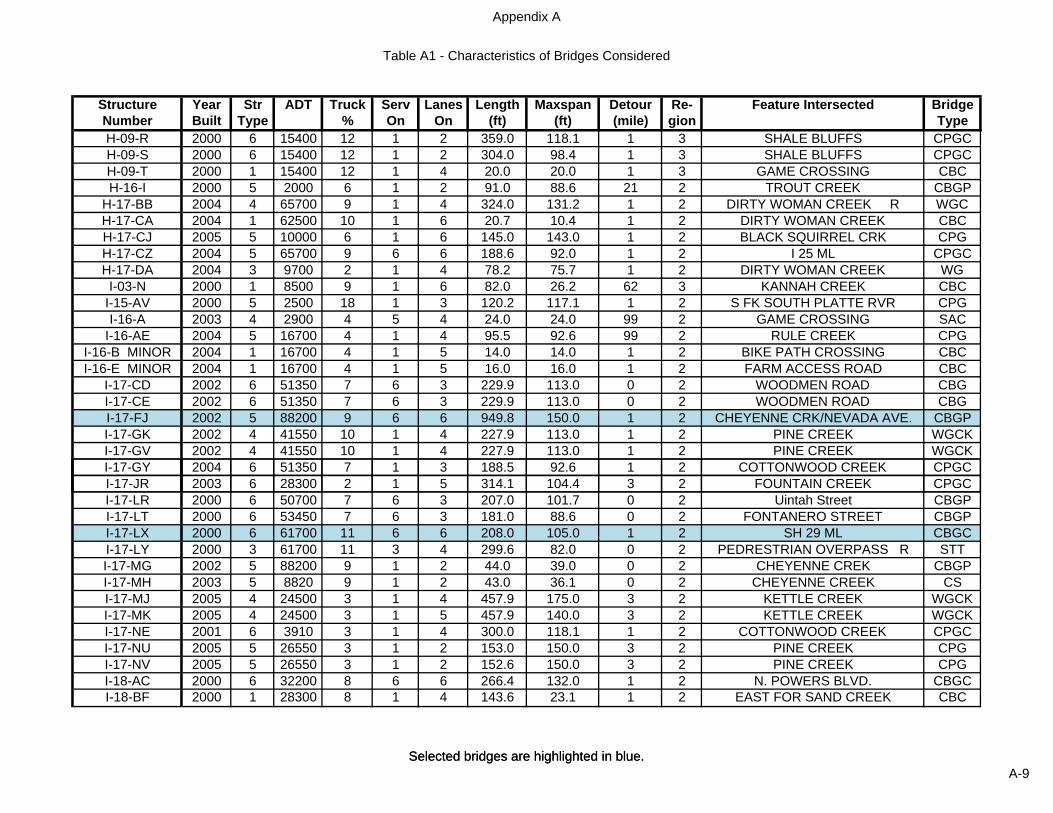
Table A1 - Characteristics of Bridges Considered
Structure Year Str ADT Truck Serv Lanes Length Maxspan Detour Re- Feature Intersected BridgeNumber Built Type % On On (ft) (ft) (mile) gion TypeH-09-R 2000 6 15400 12 1 2 359.0 118.1 1 3 SHALE BLUFFS CPGCH-09-S 2000 6 15400 12 1 2 304.0 98.4 1 3 SHALE BLUFFS CPGCH-09-T 2000 1 15400 12 1 4 20.0 20.0 1 3 GAME CROSSING CBCH-16-I 2000 5 2000 6 1 2 91.0 88.6 21 2 TROUT CREEK CBGP
H-17-BB 2004 4 65700 9 1 4 324.0 131.2 1 2 DIRTY WOMAN CREEK R WGCH-17-CA 2004 1 62500 10 1 6 20.7 10.4 1 2 DIRTY WOMAN CREEK CBCH-17-CJ 2005 5 10000 6 1 6 145.0 143.0 1 2 BLACK SQUIRREL CRK CPGH-17-CZ 2004 5 65700 9 6 6 188.6 92.0 1 2 I 25 ML CPGCH-17-DA 2004 3 9700 2 1 4 78.2 75.7 1 2 DIRTY WOMAN CREEK WGI-03-N 2000 1 8500 9 1 6 82.0 26.2 62 3 KANNAH CREEK CBC
I-15-AV 2000 5 2500 18 1 3 120.2 117.1 1 2 S FK SOUTH PLATTE RVR CPGI-16-A 2003 4 2900 4 5 4 24.0 24.0 99 2 GAME CROSSING SAC
I-16-AE 2004 5 16700 4 1 4 95.5 92.6 99 2 RULE CREEK CPGI-16-B MINOR 2004 1 16700 4 1 5 14.0 14.0 1 2 BIKE PATH CROSSING CBCI-16-E MINOR 2004 1 16700 4 1 5 16.0 16.0 1 2 FARM ACCESS ROAD CBC
I-17-CD 2002 6 51350 7 6 3 229.9 113.0 0 2 WOODMEN ROAD CBGI-17-CE 2002 6 51350 7 6 3 229.9 113.0 0 2 WOODMEN ROAD CBGI-17-FJ 2002 5 88200 9 6 6 949.8 150.0 1 2 CHEYENNE CRK/NEVADA AVE. CBGPI-17-GK 2002 4 41550 10 1 4 227.9 113.0 1 2 PINE CREEK WGCKI-17-GV 2002 4 41550 10 1 4 227.9 113.0 1 2 PINE CREEK WGCKI-17-GY 2004 6 51350 7 1 3 188.5 92.6 1 2 COTTONWOOD CREEK CPGC
Selected bridges are highlighted in blue.
I-17-JR 2003 6 28300 2 1 5 314.1 104.4 3 2 FOUNTAIN CREEK CPGCI-17-LR 2000 6 50700 7 6 3 207.0 101.7 0 2 Uintah Street CBGPI-17-LT 2000 6 53450 7 6 3 181.0 88.6 0 2 FONTANERO STREET CBGPI-17-LX 2000 6 61700 11 6 6 208.0 105.0 1 2 SH 29 ML CBGCI-17-LY 2000 3 61700 11 3 4 299.6 82.0 0 2 PEDRESTRIAN OVERPASS R STTI-17-MG 2002 5 88200 9 1 2 44.0 39.0 0 2 CHEYENNE CREK CBGPI-17-MH 2003 5 8820 9 1 2 43.0 36.1 0 2 CHEYENNE CREEK CSI-17-MJ 2005 4 24500 3 1 4 457.9 175.0 3 2 KETTLE CREEK WGCKI-17-MK 2005 4 24500 3 1 5 457.9 140.0 3 2 KETTLE CREEK WGCKI-17-NE 2001 6 3910 3 1 4 300.0 118.1 1 2 COTTONWOOD CREEK CPGCI-17-NU 2005 5 26550 3 1 2 153.0 150.0 3 2 PINE CREEK CPGI-17-NV 2005 5 26550 3 1 2 152.6 150.0 3 2 PINE CREEK CPGI-18-AC 2000 6 32200 8 6 6 266.4 132.0 1 2 N. POWERS BLVD. CBGCI-18-BF 2000 1 28300 8 1 4 143.6 23.1 1 2 EAST FOR SAND CREEK CBC
Selected bridges are highlighted in blue.
Appendix A
A-9

Table A1 - Characteristics of Bridges Considered
Structure Year Str ADT Truck Serv Lanes Length Maxspan Detour Re- Feature Intersected BridgeNumber Built Type % On On (ft) (ft) (mile) gion TypeI-18-R 2000 1 12600 12 1 3 28.7 13.9 1 2 DRAW PCBCJ-04-D 2001 1 350 14 1 2 26.0 12.0 2 3 Ironstone Canal CBC
J-12-AM 2003 1 3000 26 1 2 30.2 14.4 99 5 N.FK.SOUTH ARKANSAS RVR CBCJ-12-F 2003 1 3000 26 1 2 20.4 20.4 99 5 WELDON CREEK CBCJ-16-C 2001 4 1200 8 1 2 1224.2 265.9 99 2 AREQUA GULCH WGCK
J-17-AA 2002 6 7900 9 1 4 150.0 72.1 0 2 BIG TURKEY CREEK CPGCJ-17-AC 2004 5 9500 8 1 4 136.0 133.0 80 2 LITTLE FOUNTAIN CREEK CPGJ-17-AD 2002 1 7900 9 1 4 96.0 49.0 62 2 DRAW CBCJ-17-AE 2002 1 7900 9 1 4 37.0 18.0 62 2 DRAW CBCJ-17-I 2002 1 7900 9 1 4 77.0 16.4 62 2 RED CREEK CBC
J-18-AI 2001 5 14700 2 1 4 131.0 124.6 2 2 CREWS GULCH CPGJ-18-Q 2002 6 44300 12 6 4 195.0 95.0 0 2 I25 ML CPGCJ-27-Q 2004 0 760 36 1 2 40.0 4.0 12 1 DRAW CMP
K-05-BQ 2002 6 6850 5 1 3 151.0 72.2 1 3 UNCOMPAGRE RIVER CPGCK-13-F 2000 1 3000 8 1 2 49.8 24.4 62 5 DRAW CBC
K-16-AP 2000 6 1400 8 1 2 98.0 95.0 4 2 ADOBE CREEK CBGPK-16-BW 2000 1 1400 8 1 2 41.0 20.0 4 2 NEWLIN CREEK CBCK-16-BZ 2000 1 1100 7 1 2 39.0 19.7 4 2 DRAW CBCK-16-CH 2002 6 7900 9 1 4 160.0 78.7 0 2 BEAVER CREEK CPGCK-16-P 2006 1 5073 12 1 2 53.0 10.0 4 2 BRUSH HOLLOW CREEK CBC
K-18-BV 2003 4 57900 5 5 6 1195.7 79.0 7 2 I25 ML,RR,FOUNTAIN CREEK WGCK
Selected bridges are highlighted in blue.
K-18-GG 2002 6 43800 8 6 4 364.0 196.8 0 2 US 50 ML & SH 47 ML CBGCK-18-GQ 2006 5 14350 12 1 2 152.5 150.0 1 2 PORTER DRAW CPGK-26-J 2003 5 2400 58 1 2 138.5 136.0 12 2 NE GRANDE RES OUTLET CPGL-11-G 2003 5 440 18 1 2 72.5 70.0 30 5 SAGUACHE CREEK CBGPL-15-E 2006 1 790 6 1 2 61.7 20.0 4 2 WILMER GULCH CBC
L-18-BD 2003 5 7200 6 5 2 309.9 121.0 1 2 SH 227 ML, SALT CREEK CPGCL-18-BE 2003 5 24600 5 1 4 115.5 113.0 3 2 CF&I RR, CF RR CBGPL-20-A 2002 5 1000 9 1 2 411.0 134.5 3 2 KRAMER CREEK CPGC
L-21-AB 2001 1 6000 13 1 4 25.0 13.1 2 2 Patterson Hollow CBCL-25-D 2004 5 2600 19 1 2 101.0 98.5 2 2 LUBERS DRAINAGE DITCH CPGL-25-F 2004 5 2600 19 1 2 70.0 67.5 2 2 DRAW CPG
L-26-BH 2004 1 2900 17 1 4 36.8 17.6 2 2 RIVERVIEW CANAL CBCL-27-I 2003 5 1300 13 1 2 265.9 88.5 3 2 WOLF CREEK CBGP
M-17-BE 2003 6 8600 11 1 2 129.0 125.0 1 2 SCROGGS ARROYO CPGC
Selected bridges are highlighted in blue.
Appendix A
A-10

Table A1 - Characteristics of Bridges Considered
Structure Year Str ADT Truck Serv Lanes Length Maxspan Detour Re- Feature Intersected BridgeNumber Built Type % On On (ft) (ft) (mile) gion TypeM-17-BF 2004 5 7600 19 1 2 108.0 106.0 1 2 GREASEWOOD ARROYO CBGPM-22-BD 2002 5 240 21 1 2 163.0 65.0 9 2 DRAW CBGCPM-22-BE 2002 1 240 21 1 2 41.0 20.0 2 2 Draw CBCM-23-K 2002 5 1750 12 1 2 70.4 67.5 1 2 OTERO CANAL CPGN-03-J 2000 6 1600 10 1 2 79.0 75.4 99 5 STONER CREEK CPGN-09-F 2002 1 2500 12 0 2 1025.7 48.0 99 5 WOLF CREEK PASS TUNC
N-18-AA 2001 6 5200 21 1 2 209.0 101.7 1 2 WALSEN ARROYO CPGCN-28-L 2002 1 170 24 1 2 82.5 20.0 14 2 DRAW CBCN-28-M 2002 3 170 24 1 2 170.0 64.0 14 2 LITTLE BEAR CREEK CICKN-28-N 2002 1 170 24 1 2 82.5 20.0 14 2 NORTH BEAR CREEK CBCO-26-Q 2000 1 3100 55 1 2 44.0 13.1 2 2 DRAW CBCP-06-AB 2005 5 3200 8 5 2 249.9 124.0 3 5 LOS PINOS RIVER CBGCPP-17-AF 2000 1 680 7 1 2 27.0 26.2 99 2 DRAW CBCP-18-AX 2005 6 8600 5 1 2 299.7 99.6 4 2 PURGATOIRE RIVER CBGCP
Total Structures 329
Selected bridges are highlighted in blue.Selected bridges are highlighted in blue.
Appendix A
A-11

CBCCBGCBGCCBGCPCBGPCDTPGCICKCICKPCMPCPGCPGCCSCSGCPCSGPCSPPCBCRGSASACSBGCSDGCSTTTUNCWGWGCWGCKWGK
1 Concrete2 Concrete Continuous3 Steel4 Steel Continuous5 Prestressed Concrete6 Prestressed Concrete Continuous0 Other
Characteristics represented by study bridges are highlighted in green.
0
Concrete on Rolled I-Beam - Continuous Composite PrestressedCorrugated Metal PipeConcrete Prestressed Girder (Precast)Concrete Prestressed Girder Continuous (Precast)Concrete Slab
56789
(Str Type)1234
Building or PlazaOther
Concrete Slab & Girder Continuous Prestressed (Poured in Place)
Concrete Box CulvertConcrete Box GirderConcrete Box Girder ContinuousConcrete Box Girder Continuous PrestressedConcrete Box Girder PrestressedConcrete Double-Tee Prestressed GirderConcrete on Rolled I-Beam - Continuous & Composite
Concrete Slab & Girder Prestressed (Poured in Place)Concrete Slab PrestressedConcrete Box Culvert PrecastRiveted Plate GirderSteel ArchSteel Arch Culvert
Highway-RailroadHighway-PedestrianOverpass Structure or Interchange LeveInterchange Level 3Interchange Level 4
Table A2 - Explanation of Terms in Table A1
Bridge Type
HighwayRailroadPedestrian-Bicycle
Steel Box Girder ContinuousSteel Deck Girder with Floor Beam SystemSteel Thru TrussTunnel-Concrete Lined
(Serv On)Service on Bridge
Welded GirderWelded Girder ContinuousWelded Girder Continuous & CompositeWelded Girder Composite
Structure Type - Main Span
Appendix A
A-12

Total Bridges 163 Under # Bridges % BuiltRoad 97 59.51%Other 66 40.49%Total 163 100.00%
Regions # Bridges % Built1 18 11.04% Type # Bridges % Built2 33 20.25% CBG 56 34.36%3 13 7.98% CPG 79 48.47%4 28 17.18% CSG 4 2.45%5 2 1.23% CI 2 1.23%6 69 42.33% S/W 22 13.50%
Total 163 100.00% Total 163 100.00%
ADT # Bridges % Built Code Length # Bridges % Built Code0-20000 79 48.47% 1 0-250 98 60.12% 1
20000-40000 23 14.11% 2 250-500 40 24.54% 240000-60000 22 13.50% 3 500-750 8 4.91% 360000-80000 19 11.66% 4 750-1000 9 5.52% 480000-100000 12 7.36% 5 1000-1250 2 1.23% 5
100000-125000 1 0.61% 6 1250-1500 3 1.84% 6125000-150000 2 1.23% 7 1500-1750 1 0.61% 7150000-200000 5 3.07% 8 1750-2000 2 1.23% 8
Total 163 100.00% Total 163 100.00%
Table A3 - Bridge Characteristics and Percentage Representations
Appendix A
A-13

Table A4 ‐ Distribution of Candidate Bridges by CDOT Region
Type Length (ft) 0-20 20-40 40-60 60-80 80-100 100-125 125-150 150-2000-250 CBGP, CBGC 4 CBGP CBGC
250-500500-750
CBG* 750-10001000-12501250-15001500-17501750-2000
0-250 CPG, 2 CPGC 2 CPGC
250-500 CPGC CPGC
500-750 CPGC
CP* 750-10001000-12501250-15001500-17501750-2000
0-250250-500500-750
CSG* 750-10001000-12501250-15001500-17501750-2000
0-250250-500500-750
CI* 750-10001000-12501250-15001500-17501750-2000
0-250 WGK, STT
250-500W* 500-750 WG
or 750-1000S* 1000-1250
1250-15001500-17501750-2000
ADT Range (in thousands)REGION 1
Appendix A
A-14

Table A4 ‐ Distribution of Candidate Bridges by CDOT Region
Type Length (ft) 0-20 20-40 40-60 60-80 80-100 100-125 125-150 150-2000-250 2 CBGP, CBGCP CBGP 2 CBG, 2 CBGP CBGC CBGP
250-500 CBGP CBGC CBGC
500-750CBG* 750-1000 CBGP
1000-12501250-15001500-17501750-2000
0-250 4 CPG, 4 CPGC CPGC
250-500 3 CPGC CPGC
500-750CP* 750-1000
1000-12501250-15001500-17501750-2000
0-250250-500500-750
CSG* 750-10001000-12501250-15001500-17501750-2000
0-250 CICK
250-500500-750
CI* 750-10001000-12501250-15001500-17501750-2000
0-250 2 WGCK
250-500 STT
W* 500-750or 750-1000S* 1000-1250 WGCK WGCK
1250-15001500-17501750-2000
REGION 2ADT Range (in thousands)
Appendix A
A-15
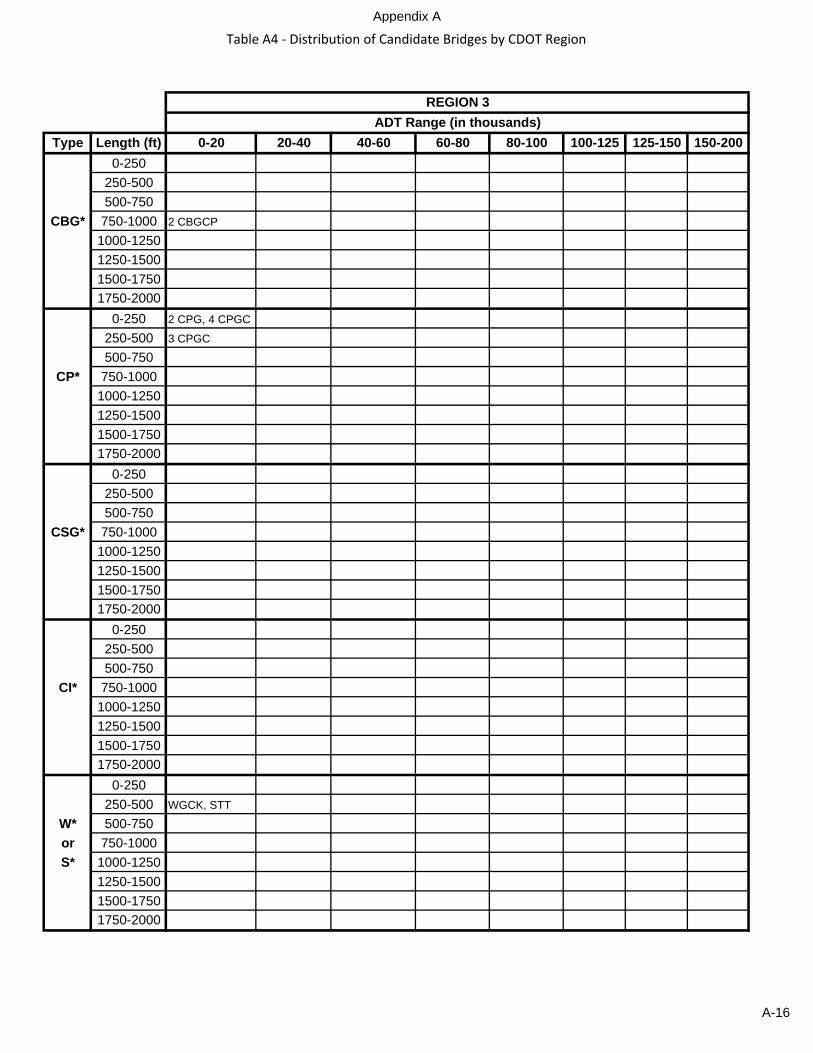
Table A4 ‐ Distribution of Candidate Bridges by CDOT Region
Type Length (ft) 0-20 20-40 40-60 60-80 80-100 100-125 125-150 150-2000-250
250-500500-750
CBG* 750-1000 2 CBGCP
1000-12501250-15001500-17501750-2000
0-250 2 CPG, 4 CPGC
250-500 3 CPGC
500-750CP* 750-1000
1000-12501250-15001500-17501750-2000
0-250250-500500-750
CSG* 750-10001000-12501250-15001500-17501750-2000
0-250250-500500-750
CI* 750-10001000-12501250-15001500-17501750-2000
0-250250-500 WGCK, STT
W* 500-750or 750-1000S* 1000-1250
1250-15001500-17501750-2000
ADT Range (in thousands)REGION 3
Appendix A
A-16
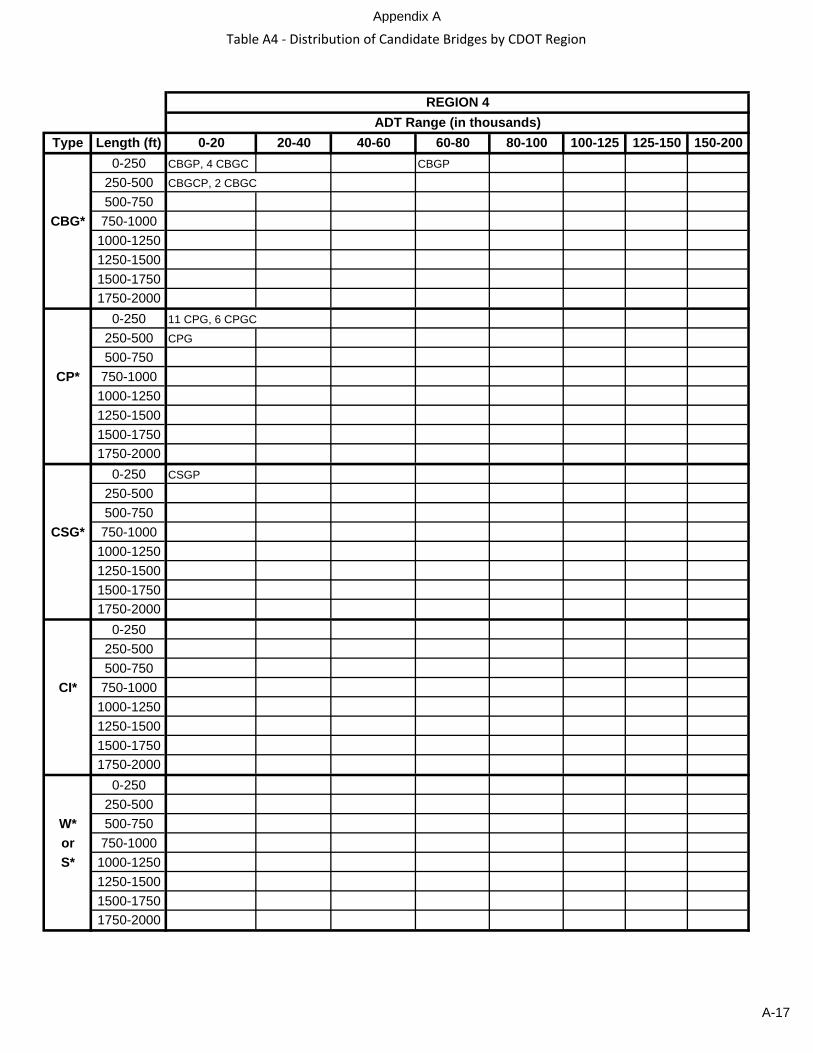
Table A4 ‐ Distribution of Candidate Bridges by CDOT Region
Type Length (ft) 0-20 20-40 40-60 60-80 80-100 100-125 125-150 150-2000-250 CBGP, 4 CBGC CBGP
250-500 CBGCP, 2 CBGC
500-750CBG* 750-1000
1000-12501250-15001500-17501750-2000
0-250 11 CPG, 6 CPGC
250-500 CPG
500-750CP* 750-1000
1000-12501250-15001500-17501750-2000
0-250 CSGP
250-500500-750
CSG* 750-10001000-12501250-15001500-17501750-2000
0-250250-500500-750
CI* 750-10001000-12501250-15001500-17501750-2000
0-250250-500
W* 500-750or 750-1000S* 1000-1250
1250-15001500-17501750-2000
REGION 4ADT Range (in thousands)
Appendix A
A-17

Table A4 ‐ Distribution of Candidate Bridges by CDOT Region
Type Length (ft) 0-20 20-40 40-60 60-80 80-100 100-125 125-150 150-2000-250 CBGP
250-500500-750
CBG* 750-10001000-12501250-15001500-17501750-2000
0-250 CPG
250-500500-750
CP* 750-10001000-12501250-15001500-17501750-2000
0-250250-500500-750
CSG* 750-10001000-12501250-15001500-17501750-2000
0-250250-500500-750
CI* 750-10001000-12501250-15001500-17501750-2000
0-250250-500
W* 500-750or 750-1000S* 1000-1250
1250-15001500-17501750-2000
REGION 5ADT Range (in thousands)
Appendix A
A-18

Table A4 ‐ Distribution of Candidate Bridges by CDOT Region
Type Length (ft) 0-20 20-40 40-60 60-80 80-100 100-125 125-150 150-2000-250 CBGC, 2 CBGP CBG 3 CBGP 4 CBGP, CBGCBGC, CBGP CBGC CBGP
250-500 CBG CBGP 2 CBGP CBGCP
500-750CBG* 750-1000
1000-12501250-1500 CBGCP
1500-1750 CBGP
1750-20000-250 2 CPGC CPG, 3 CPGC 4 CPGC, CPG CPGC
250-500 2 CPGC CPGC 3 CPGC 2 CPGC
500-750 2 CPGC 2 CPGC
CP* 750-1000 4 CPGC
1000-12501250-15001500-17501750-2000 2 CPGC
0-250 CSGP
250-500 CSGP CSGP
500-750CSG* 750-1000
1000-12501250-15001500-17501750-2000
0-250250-500 CICKP
500-750CI* 750-1000
1000-12501250-15001500-17501750-2000
0-250 STT
250-500 2 WGCK WGCK WGCK STT
W* 500-750 WGCK SBGC
or 750-1000 SDGC, WGCK
S* 1000-12501250-1500 SDGC, WGCK
1500-17501750-2000
REGION 6ADT Range (in thousands)
Appendix A
A-19

Table A5 ‐ Candidate and Selected Bridges
# pick Bridge intersected type region adt code length code1 I-17-CD road CBG 2 3 1
I-17-CE not selected not selected not selected not selected not selected1 F-16-NC road CBG 6 2 21 G-17-BH road CBG 1 4 11 I-17-LX road CBG 2 4 11 E-16-RB road CBG 6 6 11 G-09-N other CBG 3 1 4
G-09-O not selected not selected not selected not selected not selected1 A-27-P other CBG 4 1 21 F-17-KK road CBG 6 1 61 E-17-ZN road CBG 6 5 21 F-15-DG road CBG 1 2 1
F-15-DI not selected not selected not selected not selected not selectedF-15-DJ not selected not selected not selected not selected not selectedF-16-UA not selected not selected not selected not selected not selected
1 I-17-LR road CBG 2 3 1I-17-LT not selected not selected not selected not selected not selected
1 I-17-FJ road CBG 2 5 41 E-16-HK road CBG 4 4 11 L-11-G other CBG 5 1 11 F-17-GX road CBG 6 4 2
F-17-GZ not selected not selected not selected not selected not selected1 F-17-IL other CBG 6 7 11 F-16-JK road CBG 6 8 71 N-28-M other CI 2 1 11 E-17-ZK road CI 6 3 21 B-23-BA road CPG 4 1 1
B-23-BB not selected not selected not selected not selected not selected1 B-24-AD road CPG 4 1 1
B-24-AI not selected not selected not selected not selected not selected1 B-24-AU road CPG 4 1 1
B-24-AV not selected not selected not selected not selected not selectedB-24-AW not selected not selected not selected not selected not selectedB-24-AX not selected not selected not selected not selected not selectedB-24-AY not selected not selected not selected not selected not selectedB-24-AZ not selected not selected not selected not selected not selected
1 N-03-J other CPG 5 1 11 E-17-UK other CPG 6 2 11 F-15-DH road CPG 1 2 1
F-16-JB not selected not selected not selected not selected not selected1 G-17-BG road CPG 1 4 21 L-18-BD road CPG 2 1 2
Characteristics (see Table A3 for codes)
Appendix A
A-20

Table A5 ‐ Candidate and Selected Bridges
# pick Bridge intersected type region adt code length code1 J-18-Q road CPG 2 3 11 F-10-D road CPG 3 1 1
F-10-W not selected not selected not selected not selected not selected1 E-17-QP road CPG 6 2 4
E-17-UG not selected not selected not selected not selected not selectedE-17-ZA not selected not selected not selected not selected not selectedE-17-ZO not selected not selected not selected not selected not selected
1 E-17-UR road CPG 6 4 8E-17-UU not selected not selected not selected not selected not selected
1 E-16-KY road CPG 6 5 2F-17-MQ not selected not selected not selected not selected not selectedF-17-NJ not selected not selected not selected not selected not selected
1 F-17-NC road CPG 6 8 2F-17-NI not selected not selected not selected not selected not selected
1 F-17-NZ road CSG 6 4 21 E-17-UY road CSG 6 7 11 F-17-KJ road S/W 6 2 31 E-17-ZM road S/W 6 5 61 G-17-DA road S/W 1 4 31 K-18-BV road S/W 2 3 51 D-05-A other S/W 3 1 21 E-17-QS road S/W 6 4 21 E-17-ZD road S/W 6 5 61 F-15-AD other S/W 1 1 143
Appendix A
A-21
Appendix B
1 A-27-P CBGCP 6 Rural 1500 10% 42 B-23-BA CPG 5 Rural 4200 30% 43 B-24-AI CPG 1 Rural 4200 30% 44 B-24-AV CPG 5 Rural 4200 30% 45 D-05-A WGCK 4 Rural 2300 18% 36 E-16-HK CBGP 5 Urban 78600 4% 47 E-17-UK CPG 5 Rural 24300 21% 68 F-15-DG CBGP 5 Rural 25100 5% 19 F-15-DI CBGP 5 Rural 20900 5% 110 F-16-JB CPGC 6 Rural 25800 8% 111 F-16-UA CBGP 5 Rural 22800 5% 112 F-17-GZ CBGP 6 Urban 78700 4% 613 G-17-BG CPGC 5 Urban 73100 10% 114 G-17-BH CBGC 6 Urban 78100 9% 115 G-17-DA WG 3 Urban 65500 9% 116 I-17-FJ CBGP 5 Urban 88200 9% 217 I-17-LX CBGC 6 Urban 61700 11% 218 J-18-Q CPGC 6 Urban 44300 12% 219 L-18-BD CPGC 5 Rural 7200 6% 220 N-28-M CICK 3 Rural 170 24% 2
ConiferConifer
Highlands Ranch
CDOT Region
Location (Nearest Town)
Structure Type
JulesburgSterling
SterlingSterling
ConiferDenver/Aurora
Castle RockCastle Rock
Castle Rock
Colorado SpringsColorado Springs
Fountain
ADT
Table B1. Study Bridge Characteristics
Bridge Type
% ADT Truck
MeekerBroomfield
Commerce City
PuebloLycan
Study No.
Structure No.
Rural/ Urban
B‐1
Appendix B
1 $0.00 $4.21 0.00 -100% 0% 0% 1500 102 $0.22 $2.81 0.08 -100% 67% -100% 4200 243 $0.11 $2.81 0.04 -33% 100% 0% 4200 124 $0.22 $2.81 0.08 -60% 0% 0% 4200 245 $1.20 $4.70 0.26 -60% -100% 0% 2300 146 $0.93 N/A N/A 87% 28% -100% 78600 167 $1.16 $4.68 0.25 13% -33% 0% 24300 128 $25.35 $6.28 4.04 34% 96% 234% 25100 279 $30.49 $6.28 4.86 3% 33% 324% 20900 2710 $0.64 $6.32 0.10 104% 39% -100% 25800 1011 $2.27 N/A N/A -29% -48% 167% 22800 1212 $15.18 $6.71 2.26 -82% -85% -33% 78700 2113 $0.00 $9.73 0.00 108% 80% 0% 73100 1414 $5.52 $2.68 2.06 17% 42% -100% 78100 2415 $3.09 $4.63 0.67 -23% 52% -100% 65500 1016 $28.34 $6.64 4.27 48% 45% -100% 88200 2017 $9.60 $6.96 1.38 10% 2% -11% 61700 3618 $2.68 $12.10 0.22 41% -27% -100% 44300 1219 $0.46 $5.57 0.08 104% 83% 0% 7200 1520 $0.00 $1.20 0.00 -100% 0% 0% 170 11
AVE $6.37 $5.39 1.15 -0.89% 18.65% -0.95%
ADTConst.
Duration (mo.)
Delay Cost
(mill. $)
Bridge Cost
(mill. $) PDO
% Difference in SafetyCost Ratio INJ FAT
Table B2. Study Bridge Accident Data
Study No.
B‐2

Appendix B
1 CBGCP 10 1.24 NO NO2 CPG 24 1.02 NO NO3 CPG 12 1.01 NO NO4 CPG 24 1.02 NO NO5 WGCK 14 4.11 NO YES6 CBGP 16 0.31 YES YES7 CPG 12 1.00 NO NO8 CBGP 27 4.50 NO NO9 CBGP 27 4.50 NO NO10 CPGC 10 0.90 YES NO11 CBGP 12 1.00 YES YES12 CBGP 21 1.00 YES YES13 CPGC 14 0.00 YES NO14 CBGC 24 2.50 NO NO15 WG 10 2.00 NO NO16 CBGP 20 3.04 NO Intermittent17 CBGC 36 0.38 YES Intermittent18 CPGC 12 0.38 YES Intermittent19 CPGC 15 1.78 NO YES20 CICK 11 0.40 YES NO
Bridge Type
Const. Duration
(mo.)Detour
Closure/Detour
Shifting Lanes, Reduction in Lane Width & no. of Lanes
One Lane Operation Only, Shifting Lanes, Reduction in Lane Width & no. of Lanes, Closure/Detour (Same for Both)
Table B3. Study Bridge Construction Practices
Congestion Noticeable
Closure/Detour
Closure/DetourShifting Lanes
Shifting Lanes, Lane Width Reduction
Shifting Lanes
Shifting Lanes
Other: Complete Diversion Around BridgeShifting LanesShifting LanesShifting LanesShifting Lanes
Methods of Handling TrafficLength
Affected (mi.)
Shifting Lanes
Study No.
Other: New Structure Building Adjacent to ExistingShifting LanesShifting Lanes
One Lane Operation Only, Other: Shoulder Width Reduction
B‐3
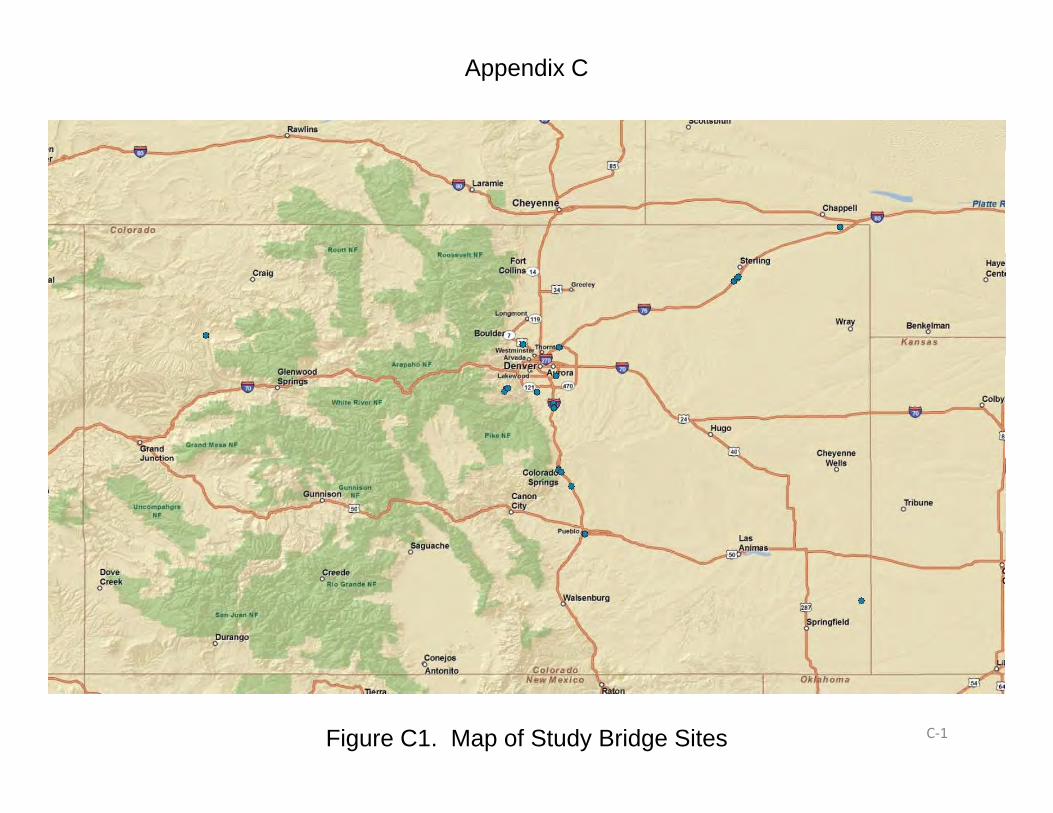
Appendix C
Figure C1. Map of Study Bridge Sites C‐1

!( CBGCP
!( CPG
!( WGCK
!( CBGP
!( WG
!( CBGC
( CPGC!( CPGC
!( CICK
Figure C2. Map of Bridge Structure Types C‐2

!( 0 - 20000
!( 20000 - 40000
!( 40000 - 60000
!( 60000 - 80000
!( 80000 - 100000
Figure C3. Map of Bridge ADT C‐3
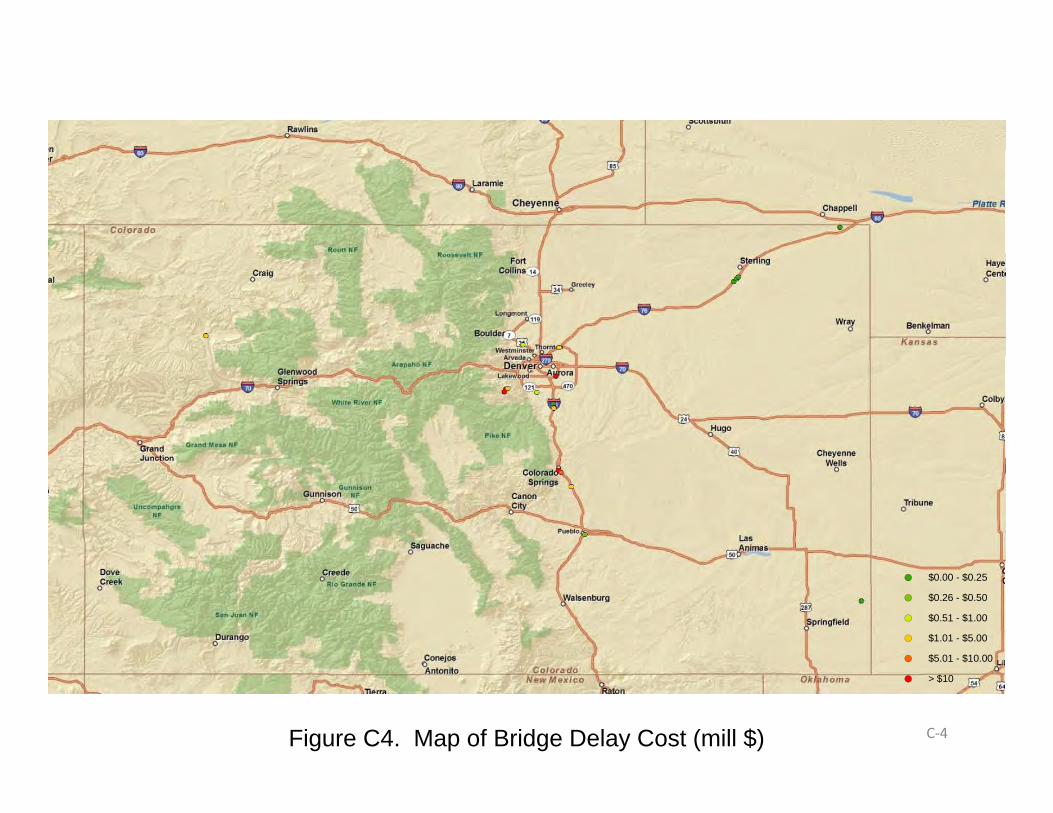
!( $0.00 - $0.25
!( $0.26 - $0.50
!( $0.51 - $1.00
!( $1.01 - $5.00
!( $5.01 - $10.00
!( > $10
Figure C4. Map of Bridge Delay Cost (mill $) C‐4
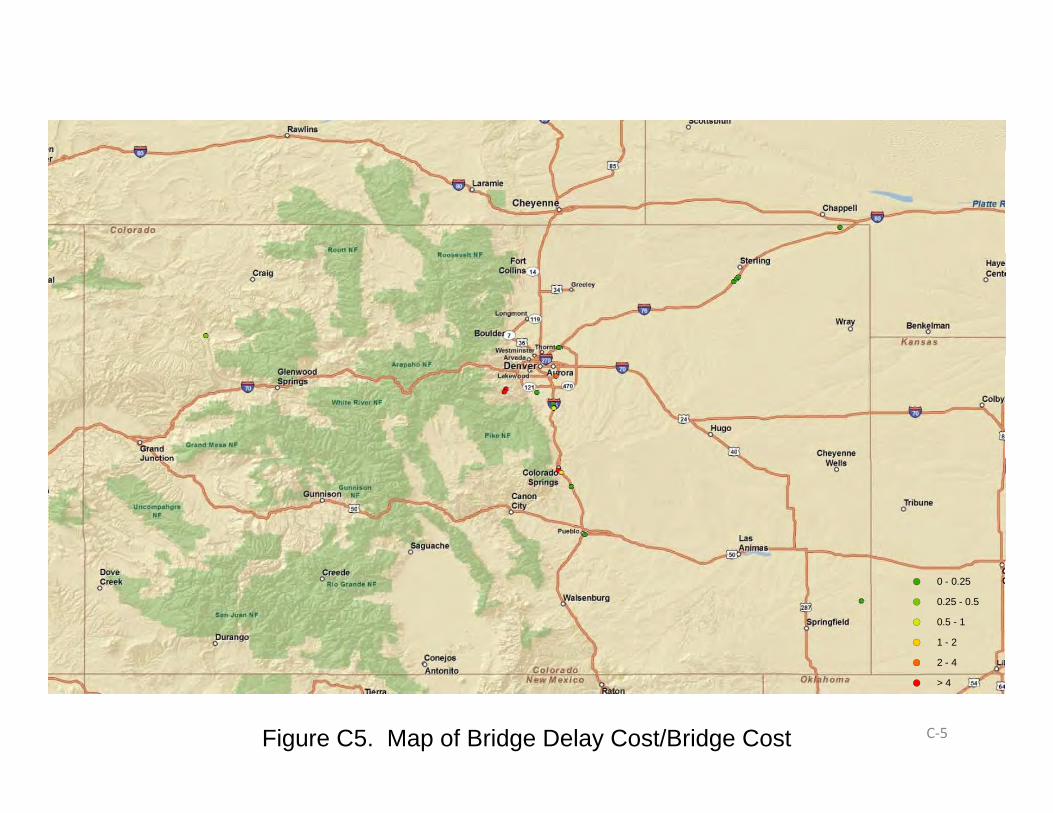
!( 0 - 0.25
!( 0.25 - 0.5
!( 0.5 - 1
!( 1 - 2
!( 2 - 4!( 2 - 4
!( > 4
Figure C5. Map of Bridge Delay Cost/Bridge Cost C‐5

Colorado Department of Transportation/University of Colorado Bridge Research Project – Risk Based Structure Selection
Form Rev. 1 – August 2008 General Project Information - Page 1
The purpose of this research project is to evaluate the benefit and value of including construction risk and user costs into the CDOT structure selection process. One of the pre-selected bridge projects that we will be analyzing is one in which you had a recent key role. To assist us with this research project, we are requesting your input regarding construction information and method(s) used to handle traffic during construction of the bridge(s). Please review the information that we’ve provided for accuracy and fill-in the absent data to the best of your knowledge. We thank you for your time and assistance. INTERVIEW INFORMATION CDOT Person Interviewed:
Date: September 18, 2008 PART 1 - GENERAL PROJECT INFORMATION (information to be provided by CU team) Project Location: Nearest Town State Hwy 138 near Julesburg Rural Urban Project Bridge Structure Number: A-27-P Sub-account number: 10786 Project Number(s): C138A-006 Year Built: 2000 Route: 138A Mile Post: MP 47.0 CDOT Region Region 4 Resident Engineer: Brett Locke Program Engineer: Rick Gabel Project Engineer: Frank Lopez Second Project Engineer (if applicable):
A. Bridge Information 1. What type of bridge was constructed? (to be provided by CU team from CDOT
Structure Log).
Appendix D
D-1

Colorado Department of Transportation/University of Colorado Bridge Research Project – Risk Based Structure Selection
Form Rev. 1 – August 2008 General Project Information - Page 2
2. Type of Project: Bridge Replacement: Yes No New Alignment/New Structure: Yes No Interchange Reconstruction: Yes No Other:
Additional Project Information (provide any description that you feel would be helpful to
better explain the nature of the project):
3. Was the bridge construction phased?
(may be available on plans) Yes No
If so, how many phases were used? Two phases 4. Was a unique bridge construction
method used? Yes No
If yes, please provide a brief summary.
5. Was falsework and/or shoring adjacent to the traveling public (within
typical roadway section) required for construction of the bridge? Yes No
If Yes was there a vertical height restriction? Yes No If Yes was there a horizontal restriction in lane or shoulder width? Yes No B. Project Limits And Construction Duration 1. What was the duration of construction? Date construction began: March 22, 2000 Date of substantial completion: January 10, 2001 2. What were the mile points at the beginning and end of the work zone? (available on plans) Mile point at beginning: 46.877 Mile point at end: 47.123 C. Construction Traffic Control Plans It would be helpful to the research project to have a set of these plans and associated specifications from the Contract Documents for our use. Are copies of the plans still available? Yes No
If so, please provide us a scanned pdf copy of the construction traffic control plans and specifications for our use; and return with this questionnaire.
Appendix D
D-2
Colorado Department of Transportation/University of Colorado Bridge Research Project – Risk Based Structure Selection
Form Rev. 1 – August 2008 General Project Information - Page 3
D. Alternative Construction (Suggestion: Respond to this question after completing Part 2 for actual construction traffic control used on project.)
1. In hindsight, could the project have been designed or constructed differently to reduce
construction time or impact to traffic? Please explain. No 2. Could working multiple shifts have occurred without an increase in traffic obstruction time?
Please explain. No 3. Was there non-traffic construction work that could have been done on a different shift that
would have shortened the project time? Please explain. No 4. Other thoughts/comments:
Appendix D
D-3

Colorado Department of Transportation/University of Colorado Bridge Research Project – Risk Based Structure Selection
Form Rev. 1 – August 2008 Phase 1 - Page 1
PART 2 – CONSTRUCTION INFORMATION Complete Sections A through C for each major construction phase (additional pages have been included for up to 3 phases. Add/complete more pages if necessary for additional phases). Phase 1 A. Construction Traffic Control 1. Was traffic control required during construction? Yes No
2. Did the contractor propose and use an alternate method of traffic
control other than that shown in the contract documents? Yes No
If yes, please provide a brief explanation:
3. What was the basic method of handling traffic? (Check all that apply.)
One Lane Operation Only (Flagging or signal) Shifting Lanes Closure/Detour Reduction in Number of Lanes Lane Width Reduction Other: Traffic used existing roadway while new structure was built adjacent
a. Was this method short duration (during the construction day only) or used for multiple
days/weeks?
Short Duration Multiple
4. What was the length of time that traffic was impacted during the bridge construction and/or
project? 6 months 5. Was traffic impacted differently for the individual phases of the bridge construction project?
Yes 6. What time of day did construction work occur that impacted traffic? Mornings and evenings
7. Was there traffic impact to the facility intersected (the feature beneath the bridge) as a result of
bridge constructed? Yes No 8. Was a speed reduction required through the construction zone, and if so what was the posted
speed? No 9. In your opinion was congestion due to construction traffic control noticeable?
Yes No Intermittent Throughout project
Appendix D
D-4

Colorado Department of Transportation/University of Colorado Bridge Research Project – Risk Based Structure Selection
Form Rev. 1 – August 2008 Phase 1 - Page 2
B. Detour Information 1. Was a detour employed during bridge construction? Yes No 2. What was the nature of the detour? n/a 3. What was the time period of the detour? (in place during construction day only, permanent
during construction period, etc.) n/a 4. What were the mile points at the start and end of the detour?
Mile point at start: n/a Mile point at end: n/a
5. What was the length of the detour? n/a 6. What was the speed through the detour compared to the normal operating conditions of the
detoured area? n/a 7. What was the impact to users as a result of the detour route? n/a 8. How much congestion was there along the detour route relative to normal operating
conditions of the original route? n/a 9. Were variable message signs used? Yes No 10. Was a website and/or newsletters used? Yes No C. Accidents During Construction for this Phase 1. Were there any accidents in the work zone during construction?
Yes No 2. Were any of these accidents construction related, in your opinion?
Yes No
Appendix D
D-5

Colorado Department of Transportation/University of Colorado Bridge Research Project – Risk Based Structure Selection
Form Rev. 1 – August 2008 Phase 2 - Page 1
PART 2 – CONSTRUCTION INFORMATION Complete Sections A through C for each major construction phase (additional pages have been included for up to 3 phases. Add/complete more pages if necessary for additional phases). Phase 2 A. Construction Traffic Control 1. Was traffic control required during construction? Yes No
2. Did the contractor propose and use an alternate method of traffic
control other than that shown in the contract documents? Yes No
If yes, please provide a brief explanation:
3. What was the basic method of handling traffic? (Check all that apply.)
One Lane Operation Only (Flagging or signal) Shifting Lanes Closure/Detour Reduction in Number of Lanes Lane Width Reduction Other: Traffic used existing roadway while new structure was built adjacent
a. Was this method short duration (during the construction day only) or used for multiple
days/weeks?
Short Duration Multiple
4. What was the length of time that traffic was impacted during the bridge construction and/or
project? 6 months 5. Was traffic impacted differently for the individual phases of the bridge construction project?
Yes 6. What time of day did construction work occur that impacted traffic? Mornings and evenings
7. Was there traffic impact to the facility intersected (the feature beneath the bridge) as a result of
bridge constructed? Yes No 8. Was a speed reduction required through the construction zone, and if so what was the posted
speed? No 9. In your opinion was congestion due to construction traffic control noticeable?
Yes No Intermittent Throughout project
Appendix D
D-6
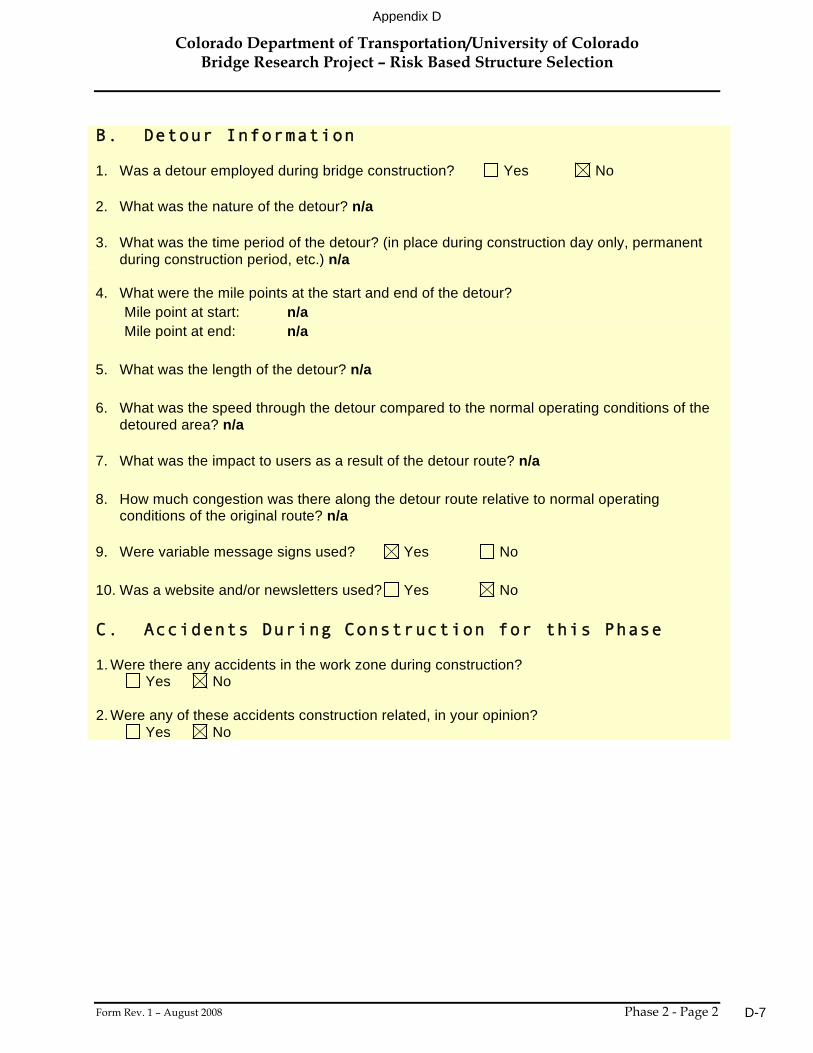
Colorado Department of Transportation/University of Colorado Bridge Research Project – Risk Based Structure Selection
Form Rev. 1 – August 2008 Phase 2 - Page 2
B. Detour Information 1. Was a detour employed during bridge construction? Yes No 2. What was the nature of the detour? n/a 3. What was the time period of the detour? (in place during construction day only, permanent
during construction period, etc.) n/a 4. What were the mile points at the start and end of the detour?
Mile point at start: n/a Mile point at end: n/a
5. What was the length of the detour? n/a 6. What was the speed through the detour compared to the normal operating conditions of the
detoured area? n/a 7. What was the impact to users as a result of the detour route? n/a 8. How much congestion was there along the detour route relative to normal operating
conditions of the original route? n/a 9. Were variable message signs used? Yes No 10. Was a website and/or newsletters used? Yes No C. Accidents During Construction for this Phase 1. Were there any accidents in the work zone during construction?
Yes No 2. Were any of these accidents construction related, in your opinion?
Yes No
Appendix D
D-7
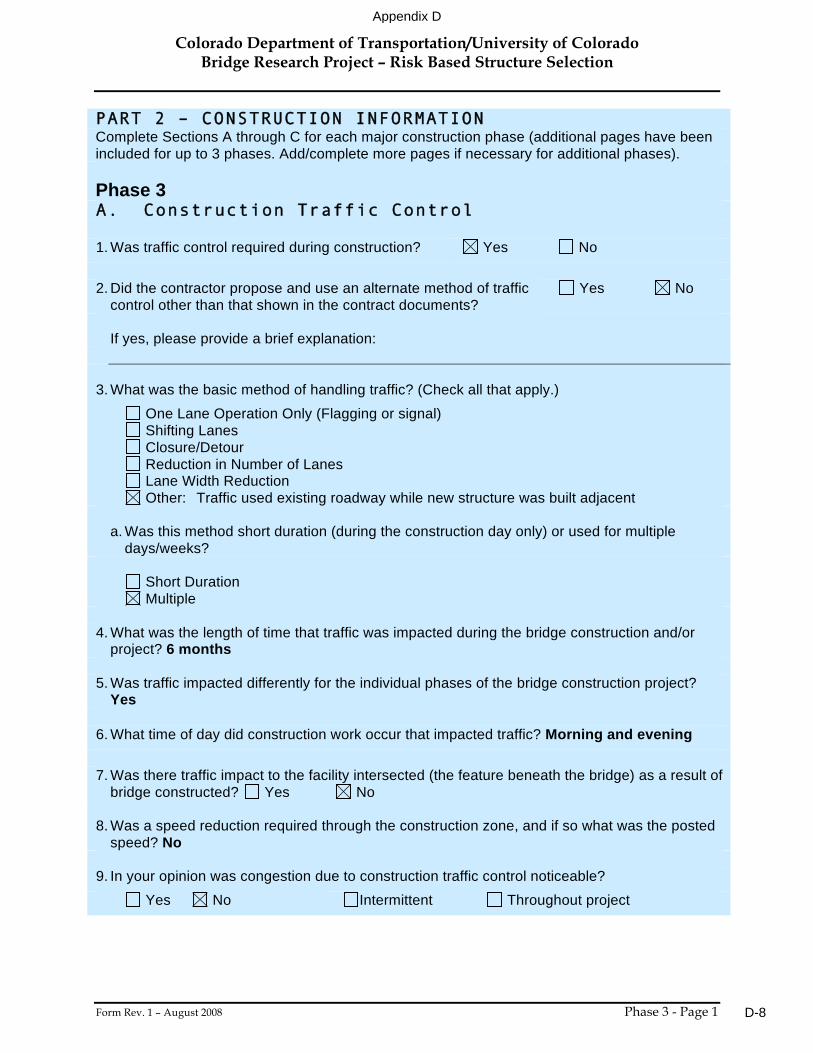
Colorado Department of Transportation/University of Colorado Bridge Research Project – Risk Based Structure Selection
Form Rev. 1 – August 2008 Phase 3 - Page 1
PART 2 – CONSTRUCTION INFORMATION Complete Sections A through C for each major construction phase (additional pages have been included for up to 3 phases. Add/complete more pages if necessary for additional phases). Phase 3 A. Construction Traffic Control 1. Was traffic control required during construction? Yes No
2. Did the contractor propose and use an alternate method of traffic
control other than that shown in the contract documents? Yes No
If yes, please provide a brief explanation:
3. What was the basic method of handling traffic? (Check all that apply.)
One Lane Operation Only (Flagging or signal) Shifting Lanes Closure/Detour Reduction in Number of Lanes Lane Width Reduction Other: Traffic used existing roadway while new structure was built adjacent
a. Was this method short duration (during the construction day only) or used for multiple
days/weeks?
Short Duration Multiple
4. What was the length of time that traffic was impacted during the bridge construction and/or
project? 6 months 5. Was traffic impacted differently for the individual phases of the bridge construction project?
Yes 6. What time of day did construction work occur that impacted traffic? Morning and evening
7. Was there traffic impact to the facility intersected (the feature beneath the bridge) as a result of
bridge constructed? Yes No 8. Was a speed reduction required through the construction zone, and if so what was the posted
speed? No 9. In your opinion was congestion due to construction traffic control noticeable?
Yes No Intermittent Throughout project
Appendix D
D-8
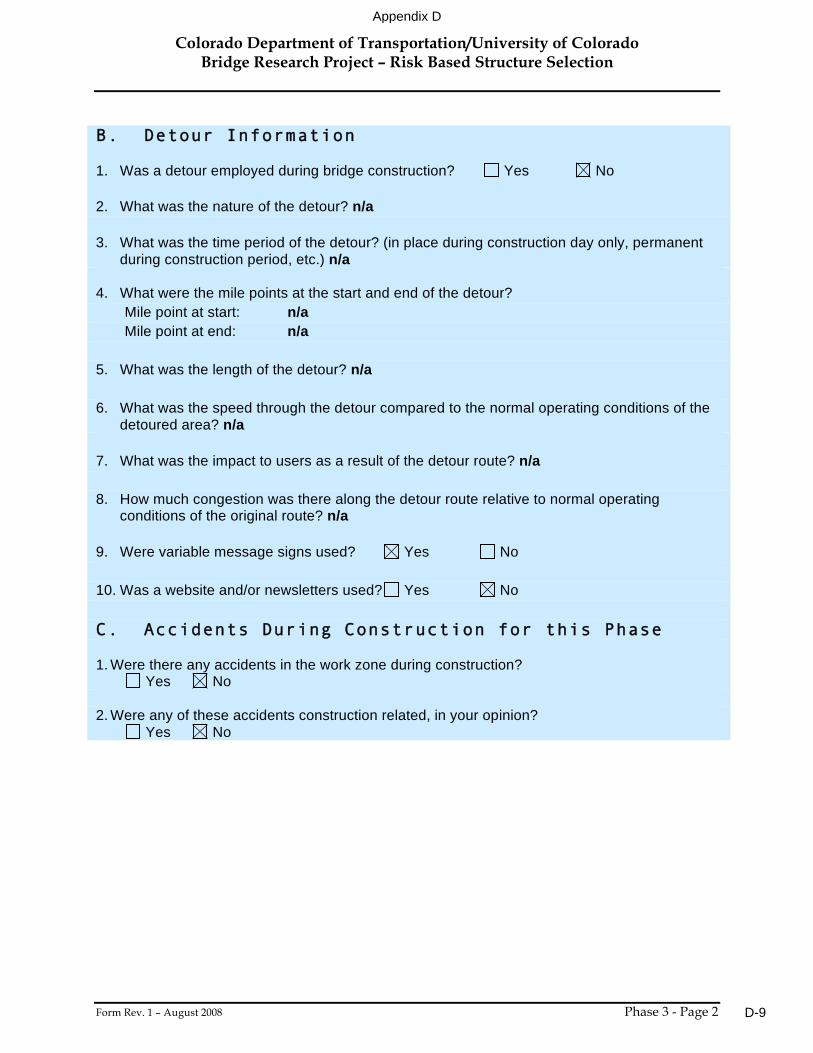
Colorado Department of Transportation/University of Colorado Bridge Research Project – Risk Based Structure Selection
Form Rev. 1 – August 2008 Phase 3 - Page 2
B. Detour Information 1. Was a detour employed during bridge construction? Yes No 2. What was the nature of the detour? n/a 3. What was the time period of the detour? (in place during construction day only, permanent
during construction period, etc.) n/a 4. What were the mile points at the start and end of the detour?
Mile point at start: n/a Mile point at end: n/a
5. What was the length of the detour? n/a 6. What was the speed through the detour compared to the normal operating conditions of the
detoured area? n/a 7. What was the impact to users as a result of the detour route? n/a 8. How much congestion was there along the detour route relative to normal operating
conditions of the original route? n/a 9. Were variable message signs used? Yes No 10. Was a website and/or newsletters used? Yes No C. Accidents During Construction for this Phase 1. Were there any accidents in the work zone during construction?
Yes No 2. Were any of these accidents construction related, in your opinion?
Yes No
Appendix D
D-9