comprehensive pedestrian enforcement captain thomas c. didone montgomery county, md police...
TRANSCRIPT

Comprehensive Pedestrian Enforcement
Captain Thomas C. DidoneMontgomery County, MD Police Department
1

Pedestrian Safety Initiative – Results
2
Com
preh
ensi
ve P
edes
tria
n En
forc
emen
t

Comprehensive Pedestrian Enforcement
• Problem Identification
• Engineering Concerns
• Education Programs
• Enforcement Operations
3
Com
preh
ensi
ve P
edes
tria
n En
forc
emen
t

Changing Pedestrian and
Driver Behavior
Engineering Enforcement
Three Pronged Approach Close Coordination of Engineering, Education, and Enforcement
Education
4
Com
preh
ensi
ve P
edes
tria
n En
forc
emen
t

Do You Have a Problem?
5
Com
preh
ensi
ve P
edes
tria
n En
forc
emen
t

Comprehensive Pedestrian Enforcement
• Identifying the problem•Data Driven •Statistics
• Who, How & When• Where do they occur? -High Incidence Areas, Hot Spots• Causation factors
6
Com
preh
ensi
ve P
edes
tria
n En
forc
emen
t

CountyStat
Montgomery County Pedestrian Collisions and FatalitiesWith four years of data since the launch of the Pedestrian Safety Initiative in July 2009, DOT and
MCPD looked at the change in the average number of collisions pre- and post-launch.
2005 2006 2007 2008 2009 2010 2011 2012 2013Pre-Initiative
Average(2005-2009)
Post-Initiative Average
(2010-2013)Change
January 36 31 32 48 34 34 28 40 50 36 38 +6%February 28 28 33 30 37 39 27 36 38 31 35 +13%
March 37 28 34 37 31 33 38 27 36 33 34 +3%April 26 25 35 34 28 33 36 27 43 30 35 +17%May 27 36 34 47 46 33 28 36 40 38 35 -8%June 41 33 29 24 41 33 17 35 35 34 30 -12%July 24 29 20 37 36 33 24 23 30 29 28 -3%
August 28 37 26 36 32 26 33 31 36 32 32 0%September 39 39 38 35 30 41 32 35 41 36 37 +3%
October 48 42 37 31 41 44 43 44 56 40 47 +10%November 48 49 60 38 46 43 42 48 40 48 43 -18%December 52 52 34 47 52 44 51 41 38 47 44 -6%
Total Collisions 434 429 412 444 454 436 399 423 483 435 435 0%Per 100,000 46.7 45.9 43.8 46.6 46.8 44.9 40.5 42.8 47.5 46.0 43.9 -5%
Level 4 & 5 Collisions (% of total)
130(30%)
142(33%)
119(29%)
115(26%)
132(29%)
113(26%)
104(26%)
82(19%)
85(18%) 128 96 -25%
Per 100,000 14.0 15.2 12.7 12.1 13.6 11.6 10.6 8.6 8.4 13.5 9.8 -27%Total Fatalities* 10 18 17 19 14 13 11 6 13 16 11 -31%
Per 100,000 1.1 1.9 1.8 2 1.4 1.3 1.1 0.6 1.3 1.6 1.1 -31%
7/23/20147Pedestrian Safety Initiative
*Does not include bicycle fatalitiesSource: MCPD. Data reporting prior to 2008 may not have been consistent with present practices.

Pedestrian Collision Annual Trends
% Change
-2% -5% +6% 0% -4% -10% +6%
Total collisions per 100,000 population increased in 2012 , attributed to an increase in the number of collisions occurring in parking lots. The 2012 total remains below the pre-initiative
average (2005 – 2009.)
The number of severe collisions (level 4-5) have dropped by 21% from the pre-initiative average (2005-2009.)
% Change +9% -16% -3% +14% -14% -8% -18%
8
Com
preh
ensi
ve P
edes
tria
n En
forc
emen
t

CountyStat9Pedestrian Safety
Initiative7/23/2014
2007 2008 2009 2010 2011 2012 20130
20
40
60
80
100
120
140
160
180
StateCountyMunicipalParkingOther/Unknown
Nu
mb
er
of
Co
llis
ion
sCollisions by Roadway Type
In 2013, a plurality of collisions occurred on state maintained roadways which also represented the greatest increase in pedestrian collisions. Parking lot collisions rose
sharply from 2010 to 2012 before dropping slightly in 2013. This may be an indication that the recently implemented parking lot initiative is working.
Source: MCPD
Highway Lane Miles
State County Toll Municipal Total
1,395.14 4,846.58 88.01 761.36 7,091.09
20% 68% 1% 11% 100%

CountyStat
12AM
-1AM
1AM
-2AM
2AM
-3AM
3AM
-4AM
4AM
-5AM
5AM
-6AM
6AM
-7AM
7AM
-8AM
8AM
-9AM
9AM
-10A
M
10AM
-11A
M
11AM
-12P
M
12PM
-1PM
1PM
-2PM
2PM
-3PM
3PM
-4PM
4PM
-5PM
5PM
-6PM
6PM
-7PM
7PM
-8PM
8PM
-9PM
9PM
-10P
M
10PM
-11P
M
11PM
-12A
M
0
10
20
30
40
50
60
2011 2012 2013
Pe
de
str
ian
Co
llis
ion
sPedestrian Collisions: Evening Commute
In 2012 and 2013, 27% of all collisions occurred between the hours of 5-8pm, up from 23% in 2011. The overall number of collisions in this time frame continues to rise.
7/23/201410Pedestrian Safety Initiative
Source: MCPD

CountyStat
Pedestrian Collision Variables: Fault
2008 2009 2010 2011 2012 20130%
10%
20%
30%
40%
50%
60%
70%
80%
90%
100%
41% 46% 49%56% 59% 62%
44%42%
43%40% 35% 32%
2% 1%3%
4% 5% 6%13% 11%
5%
Not De-termined
Both
Pedestrian
Driver
% o
f T
ota
l
In 2013, the percentage of collisions where the driver was at fault continued to rise. Early education and enforcement efforts focused on pedestrians, but in 2013 these
efforts began targeting drivers.
7/23/201411Pedestrian Safety Initiative
Source: MCPD

CountyStat
Pedestrian Collision Variables: Fault
There was a 5 percentage point increase in at fault pedestrians between the ages of 10 and 19 (school age children and young adults). Pedestrians at fault between the ages of 10 and 29 are over-represented compared to their share of the population as a whole. At fault drivers over age 80 appear
to be slightly over-represented.
0-9
yrs
10-1
9 yr
s20
-29
yrs
30-3
9 yr
s40
-49
yrs
50-5
9 yr
s60
-69
yrs
70-7
9 yr
s
80+
0%
5%
10%
15%
20%
25%Age of Driver at Fault
2012 2013 % of 2012 MoCo Registered Drivers
% o
f T
ota
l
0-9
yrs
10-1
9 yr
s20
-29
yrs
30-3
9 yr
s40
-49
yrs
50-5
9 yr
s60
-69
yrs
70-7
9 yr
s
80+
0%
5%
10%
15%
20%
25%
Age of Pedestrian at Fault
2012 2013 % of MoCo Population
% o
f T
ota
l
N/A
7/23/201412Pedestrian Safety Initiative
Source: MCPD; ACS 2012 5 Year Population Estimate; Maryland Highway Safety Office

High Incidence Areas (HIAs)/High Crash Locations (HCLs)(hot spots)
Areas with highest density of pedestrian crashes
High traffic volume + High pedestrian volume
HIA/HCL
Com
preh
ensi
ve P
edes
tria
n En
forc
emen
t
13
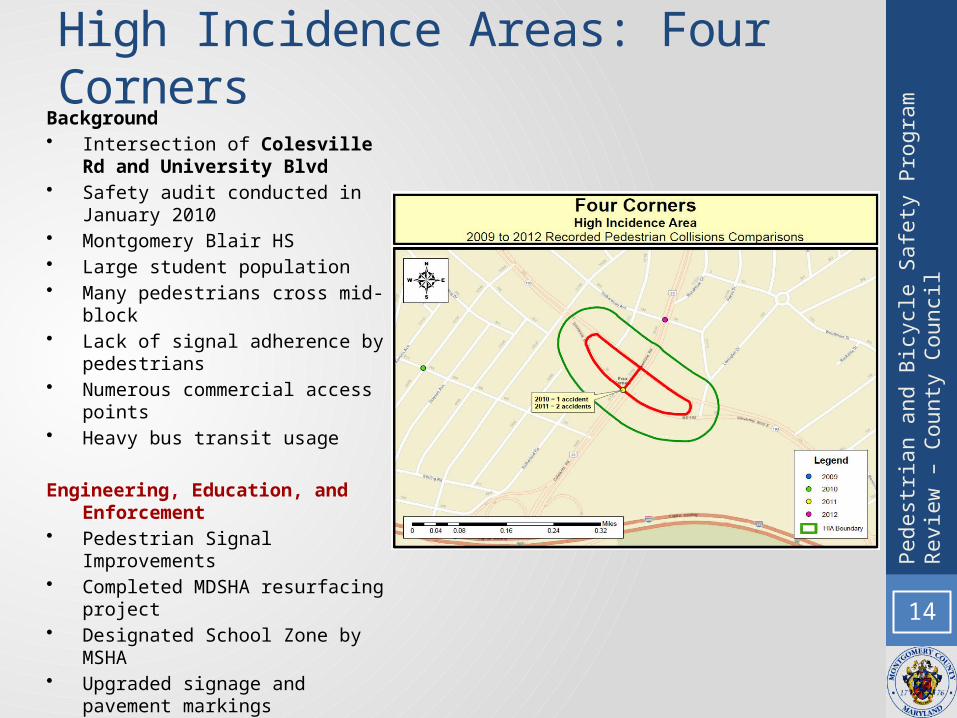
High Incidence Areas: Four CornersBackground• Intersection of Colesville Rd and
University Blvd• Safety audit conducted in January 2010• Montgomery Blair HS• Large student population• Many pedestrians cross mid-block• Lack of signal adherence by pedestrians • Numerous commercial access points• Heavy bus transit usage
Engineering, Education, and Enforcement• Pedestrian Signal Improvements• Completed MDSHA resurfacing project• Designated School Zone by MSHA• Upgraded signage and pavement
markings• Montgomery Blair HS Education &
Outreach Campaign (Fall 2011 - 2012)• Targeted Enforcement (2012 and 2013) 14
Pede
stria
n an
d Bi
cycl
e Sa
fety
Pro
gram
Rev
iew
– C
ount
y Co
unci
l

Engineering Concerns
15
Com
preh
ensi
ve P
edes
tria
n En
forc
emen
t

Engineering• Working with Local Department of Transportation• Infrastructure is critical for effective enforcement
16
Com
preh
ensi
ve P
edes
tria
n En
forc
emen
t
Audible Push Button Regulatory and Warning Signs Flashing Beacons
Curb Markers Countdown Pedestrian Indicators

Engineering
• Conduct Audits
• Perform Maintenance
• Produce Enhancements
• Traffic Calming
• Infrastructure Improvements
• Automation
• Funding17
Com
preh
ensi
ve P
edes
tria
n En
forc
emen
t

Education Programs
18
Com
preh
ensi
ve P
edes
tria
n En
forc
emen
t

Community Education• Educate the public on pedestrian traffic laws
• If public does not know the law, hard for them to follow it• Cooperative effort with Department of Transportation, Fire
& Rescue, Citizen Groups
19
Com
preh
ensi
ve P
edes
tria
n En
forc
emen
t

Officer Education• Educate officers on pedestrian traffic laws
• Officers more likely to enforce if they have knowledge• Knowledge is power
20
Com
preh
ensi
ve P
edes
tria
n En
forc
emen
t

Enforcement Operations
21
Com
preh
ensi
ve P
edes
tria
n En
forc
emen
t

Enforcement
• Team Approach• Increase citizen contacts• Officer safety
• Highly motivated officers• Identify times and locations based on crash data
• High Incidence Areas• Crosswalk stings
• Both pedestrians and drivers are charged• Tickets not warnings
22
Com
preh
ensi
ve P
edes
tria
n En
forc
emen
t

23
2011 2012 2013
Pedestrian Citations 402 1219 630
Driver Citations 23 42 651
100
300
500
700
900
1100
1300
Pedestrian and Driver Citations, 2011-2013
Pedestrian Citations Driver Citations
Com
preh
ensi
ve P
edes
tria
n En
forc
emen
tThree-Year Citation Total:2,967

Enforcement (Continued)
• Pedestrian Violations• Midblock crossing• Crossing against the signal• Crossing unsafely
• Driver Violations• Failing to yield right of way in crosswalk• Failing to yield on left and right turns• Speed enforcement
24
Com
preh
ensi
ve P
edes
tria
n En
forc
emen
t

Crosswalk Sting
25
Com
preh
ensi
ve P
edes
tria
n En
forc
emen
t

Crosswalk “Stings”
2626
Com
preh
ensi
ve P
edes
tria
n En
forc
emen
t

• Come prepared with pictures and statistics• Articulate, Articulate, Articulate• Know the laws, Knowledge is Power!• Explain to the Court why this is being done
27
Final Phase….Courts
When this has been done in Montgomery County the District Court judges have been
fully behind our enforcement efforts Com
preh
ensi
ve P
edes
tria
n En
forc
emen
t

Summary
• Need motivated officers• Team approach at locations• Warnings are less effective• Heavy enforcement changes behavior• Return trips keeps behavior in check
28
Com
preh
ensi
ve P
edes
tria
n En
forc
emen
t

Questions
Captain Thomas C. Didone
Officer Jeremy Smalley
Montgomery County Police
29
Com
preh
ensi
ve P
edes
tria
n En
forc
emen
t