comprehensive particle characterization by homogeneous...
TRANSCRIPT
© 2015 LUM GmbH
1
Comprehensive particle characterization
by homogeneous-start
centrifugal sedimentation technique
Dietmar Lerche, Prof. Dr. Dr.
LUM Berlin, Germany
1. Introduction
2. In-situ visualization of separation by STEP-Technology
3. Velocity and size distribution of particles
4. Magnetophoretic velocity
5. Density determination of particles dispersed in liquid
6. Characterization of particle surface properties
Focus User Meeting: The Centrifugal Sedimentation TechniqueBushy House, London; 29 – 30 Nov. 2016
The Next STEP® in Dispersion Analysis & Materials Testing www.lum-gmbh.com www.dispersion-letters.com
© 2015 LUM GmbH
2
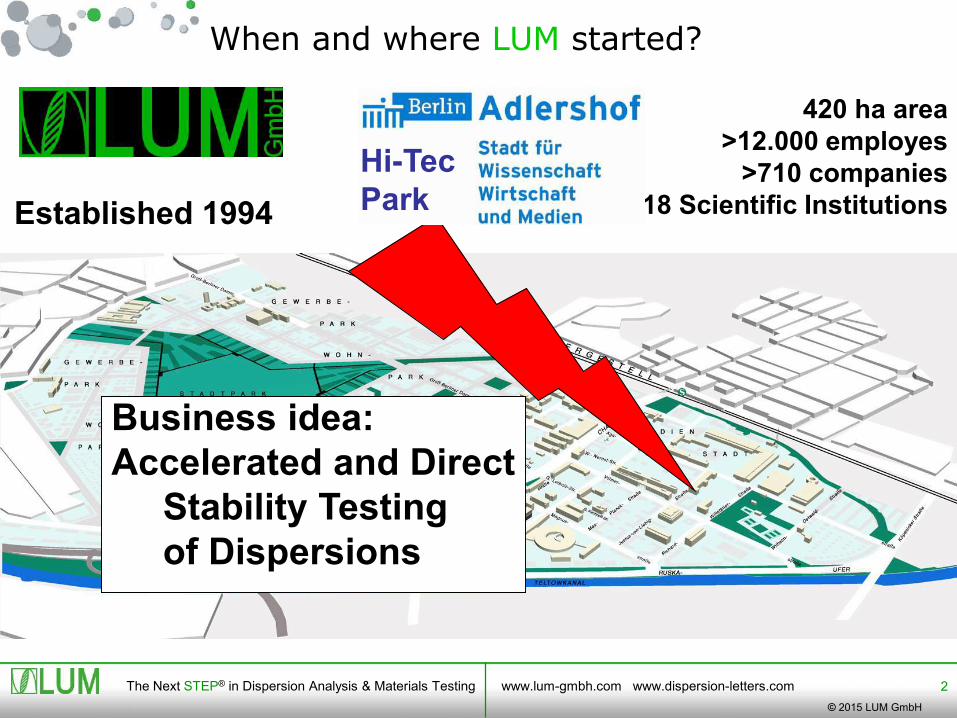
420 ha area
>12.000 employes
>710 companies
18 Scientific Institutions
When and where LUM started?
Established 1994
Hi-Tec
Park
Business idea:
Accelerated and Direct
Stability Testing
of Dispersions

The Next STEP® in Dispersion Analysis & Materials Testing www.lum-gmbh.com www.dispersion-letters.com
© 2015 LUM GmbH
3
Multisampling
SEPView 6.4 Software
Real-time Accelerated
Multi-wavelength
SEPView 7
Efficient and easy
Units placed in 45 countries all over the world
LUM now provides solutionsfor entire life cycles
1.Particles 2. Dispersions3. Composite
Materials
The Next STEP® in Dispersion Analysis & Materials Testing www.lum-gmbh.com www.dispersion-letters.com
© 2015 LUM GmbH
4
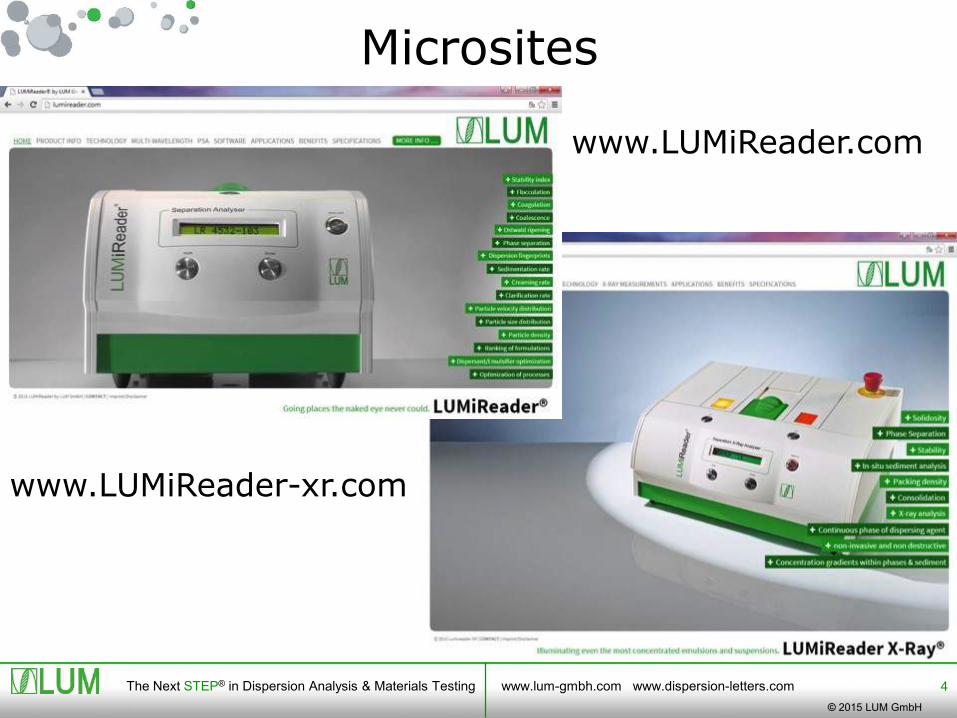
1. Foöl. LUMiReder
2. Folie LUMiReader x-Ray
www.LUMiReader.com
www.LUMiReader-xr.com
Microsites
The Next STEP® in Dispersion Analysis & Materials Testing www.lum-gmbh.com www.dispersion-letters.com
© 2015 LUM GmbH
5
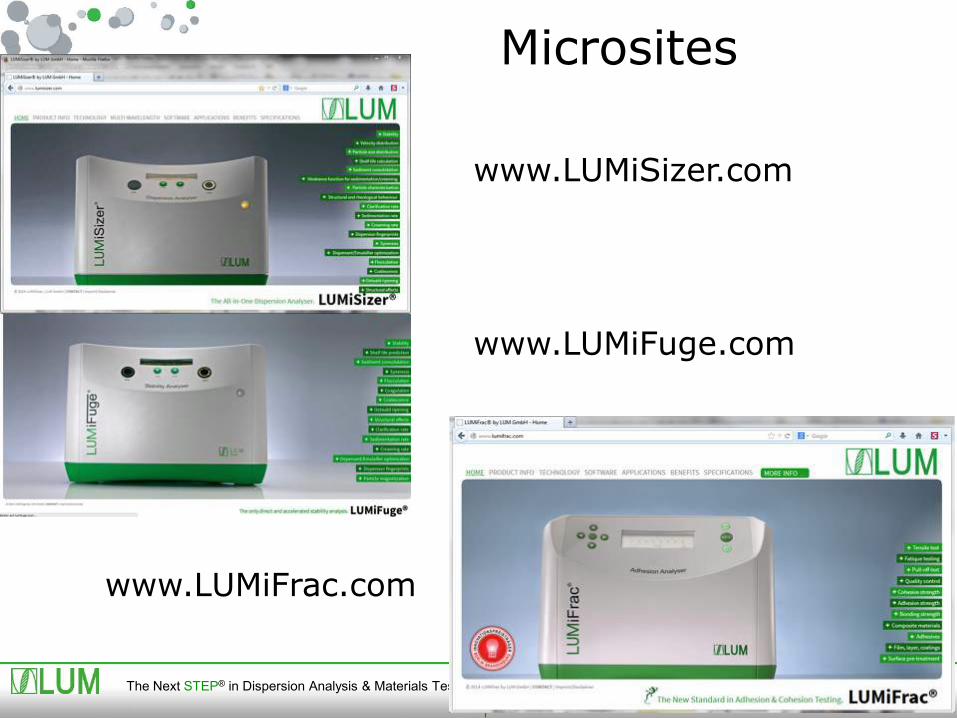
www.LUMiFrac.com
www.LUMiSizer.com
www.LUMiFuge.com
Microsites

The Next STEP® in Dispersion Analysis & Materials Testing www.lum-gmbh.com www.dispersion-letters.com
© 2015 LUM GmbH
6
1.Particles 2. Dispersions3. Composite
Materials
Multisampling
SEPView 6.4 Software
Real-timeISO/TR 13097, ISO 13317
ASTM D7827-12
AcceleratedISO/TR 13097
ISO 13318
Multi-wavelength
SEPView 7
Efficient and easyEN ISO 4624 DIN EN 15870
CharacterizationState,
StabilityStrength
LUMiINSTRUMENTS are state-of-the-art

The Next STEP® in Dispersion Analysis & Materials Testing www.lum-gmbh.com www.dispersion-letters.com
© 2015 LUM GmbH
7
In-situ visualization of dispersion stateby STEP-Technology
NIR
VL
X-Ray
12 channels,
l = 870, 470 nm
t1 > t0
Conventional“one point” techniques
Space and Time resolved
Extinction Profiles
Animation see:youtube
The Next STEP® in Dispersion Analysis & Materials Testing www.lum-gmbh.com www.dispersion-letters.com
© 2015 LUM GmbH
8
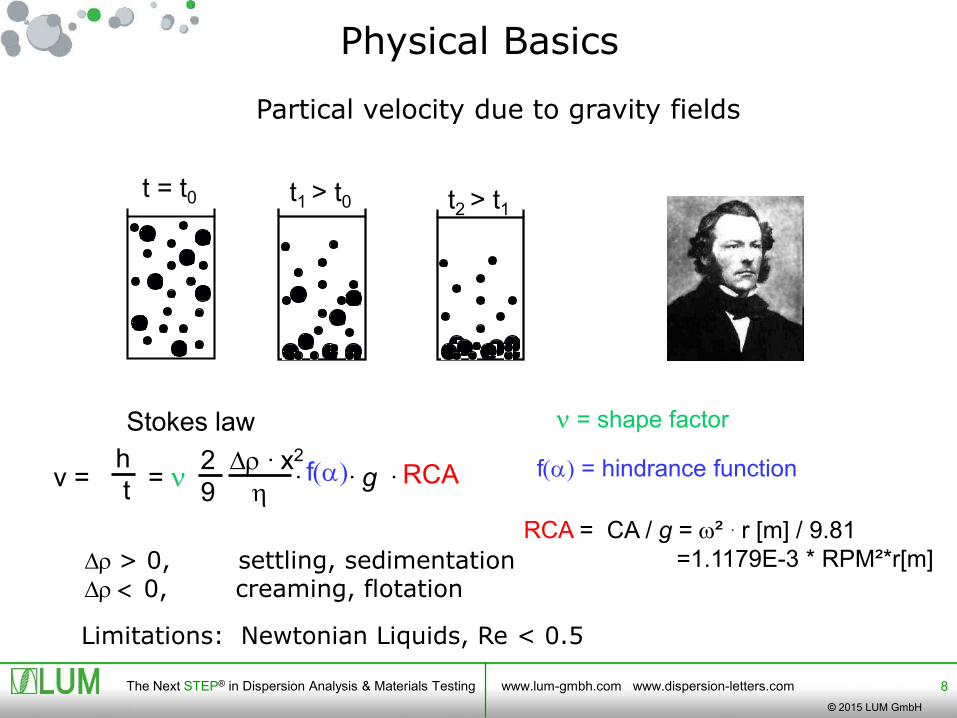
Partical velocity due to gravity fields
Stokes law
Physical Basics
Dr > 0, settling, sedimentationDr < 0, creaming, flotation
t = t0 t1 > t0 t2 > t1
Limitations: Newtonian Liquids, Re < 0.5
v = = n . . g .2 Dr . x2
9 hRCAf(a)
h
t
RCA = CA / g = w² . r [m] / 9.81
=1.1179E-3 * RPM²*r[m]
f(a) = hindrance function
n = shape factor
The Next STEP® in Dispersion Analysis & Materials Testing www.lum-gmbh.com www.dispersion-letters.com
© 2015 LUM GmbH
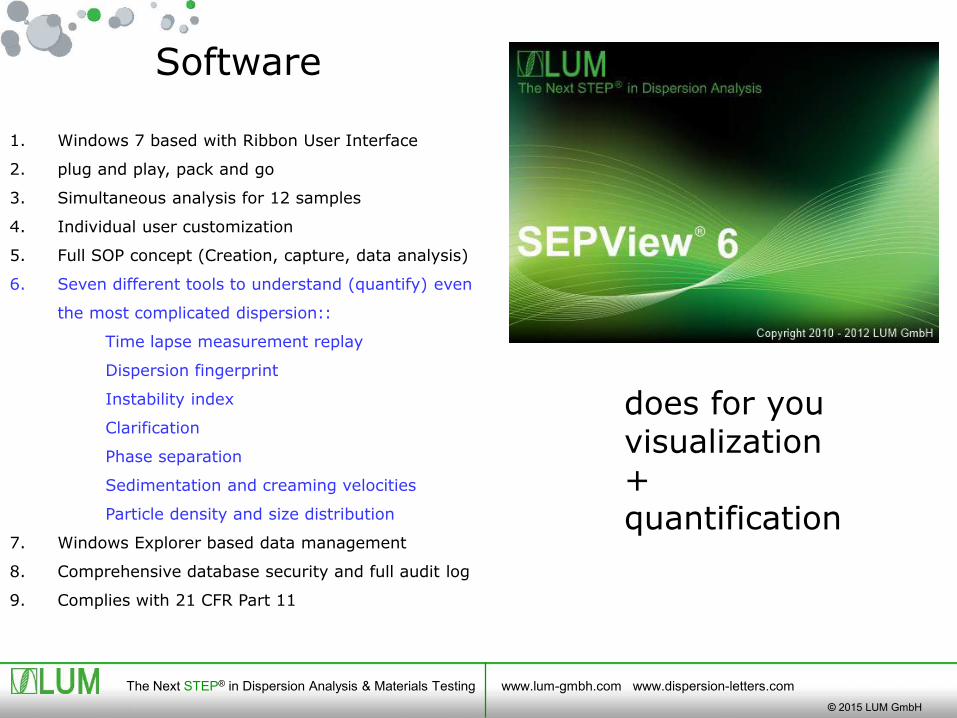
does for youvisualization+ quantification
1. Windows 7 based with Ribbon User Interface
2. plug and play, pack and go
3. Simultaneous analysis for 12 samples
4. Individual user customization
5. Full SOP concept (Creation, capture, data analysis)
6. Seven different tools to understand (quantify) even
the most complicated dispersion::
Time lapse measurement replay
Dispersion fingerprint
Instability index
Clarification
Phase separation
Sedimentation and creaming velocities
Particle density and size distribution
7. Windows Explorer based data management
8. Comprehensive database security and full audit log
9. Complies with 21 CFR Part 11
Software

The Next STEP® in Dispersion Analysis & Materials Testing www.lum-gmbh.com www.dispersion-letters.com
© 2015 LUM GmbH
Meniscus Cell Bottom
STEP-Technology: In-situ visualization of separation behavior
Qualitative: FingerprintsQuantitative: Instability Index,
Fronttracking, IntegrationParticle velocity and size
1 = Red
last = Green

The Next STEP® in Dispersion Analysis & Materials Testing www.lum-gmbh.com www.dispersion-letters.com
© 2015 LUM GmbH
Concentration 10.5% (v/v)
Concentration 19,8% (v/v)
Fingerprint: Monodisperse silica particles
monomodal
Silica, 280 nm,
1100 x g
The Next STEP® in Dispersion Analysis & Materials Testing www.lum-gmbh.com www.dispersion-letters.com
© 2015 LUM GmbH
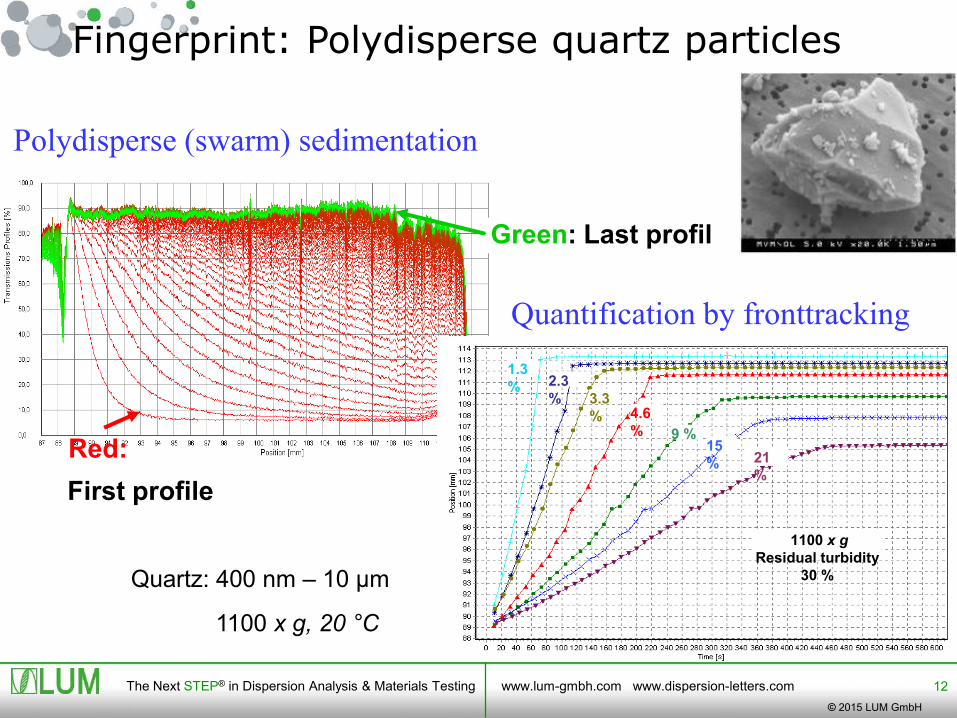
12
Green: Last profil
1100 x g, 20 °C
Quartz: 400 nm – 10 µm
First profile
Red: 21
%
15
%
9 %
4.6
%
3.3
%
1.3
% 2.3
%
1100 x g
Residual turbidity
30 %
Fingerprint: Polydisperse quartz particles
Polydisperse (swarm) sedimentation
Quantification by fronttracking
The Next STEP® in Dispersion Analysis & Materials Testing www.lum-gmbh.com www.dispersion-letters.com
© 2015 LUM GmbH
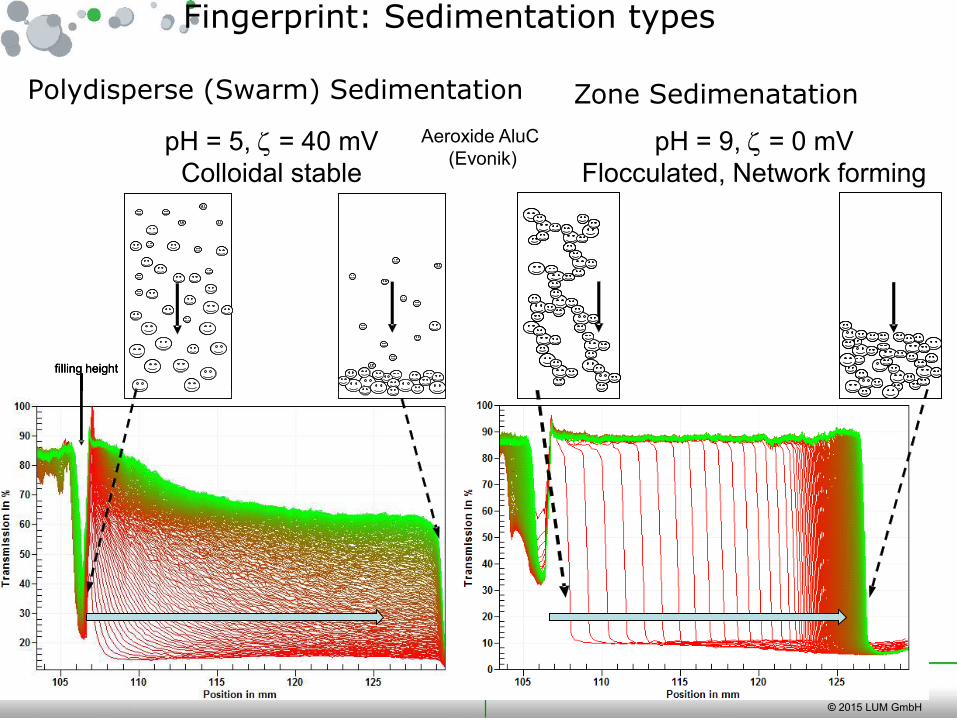
Fingerprint: Sedimentation types
Polydisperse (Swarm) Sedimentation
Aeroxide AluC
(Evonik)
Colloidal stable
pH = 5, z = 40 mV
Colloidal stable
pH = 9, z = 0 mV
Flocculated, Network forming
filling heightfilling heightfilling height
Zone Sedimenatation
The Next STEP® in Dispersion Analysis & Materials Testing www.lum-gmbh.com www.dispersion-letters.com
© 2015 LUM GmbH
14
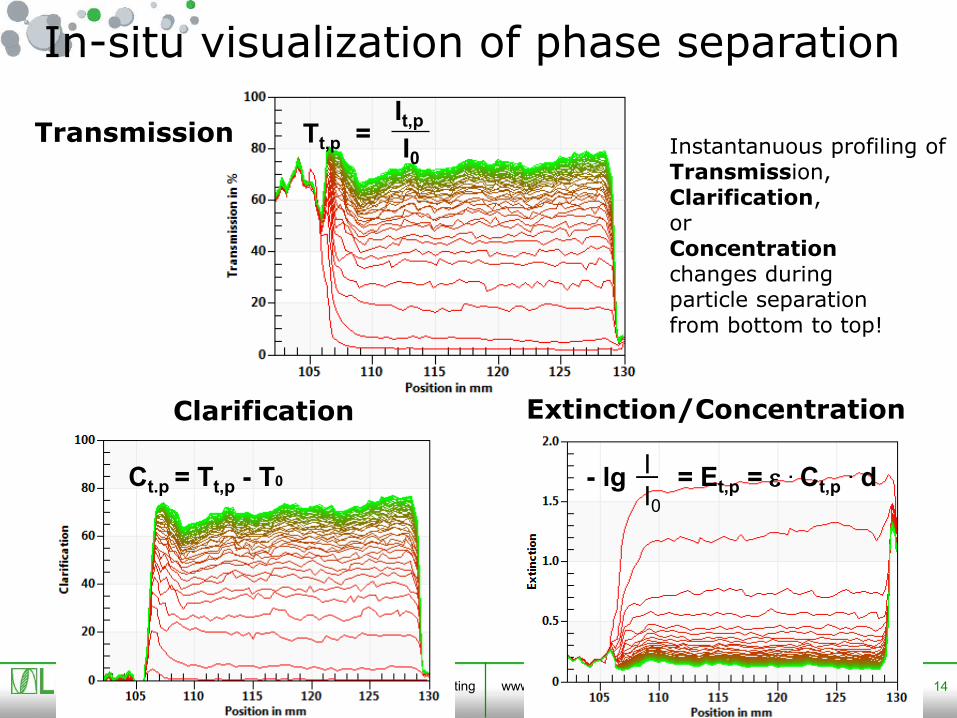
In-situ visualization of phase separation
Instantanuous profiling ofTransmission,Clarification,orConcentrationchanges duringparticle separationfrom bottom to top!
I
I0- lg = Et,p = e . Ct,p
. dCt.p = Tt,p - T0
Clarification Extinction/Concentration
Tt,p = TransmissionIt,pI0

The Next STEP® in Dispersion Analysis & Materials Testing www.lum-gmbh.com www.dispersion-letters.com
© 2015 LUM GmbH
STEP - Fingerprints
Suspension
monomodal monodisperse
Suspension
tetramodal monodisperse
Suspension
polydisperse
Suspension
particle – particle - interaction
Emulsion
rather monodisperse Suspoemulsion
flotation and sedimentation
First transmission profil: red Last transmission profil: green
The Next STEP® in Dispersion Analysis & Materials Testing www.lum-gmbh.com www.dispersion-letters.com
© 2015 LUM GmbH
Zeit t [s]
0 100 200 300 400 500
Po
sit
ion
r [
mm
]
90
95
100
105
110
115
1.3 %
2.3 %
3.3 %
4.6 %
9 %
15 %
21 %
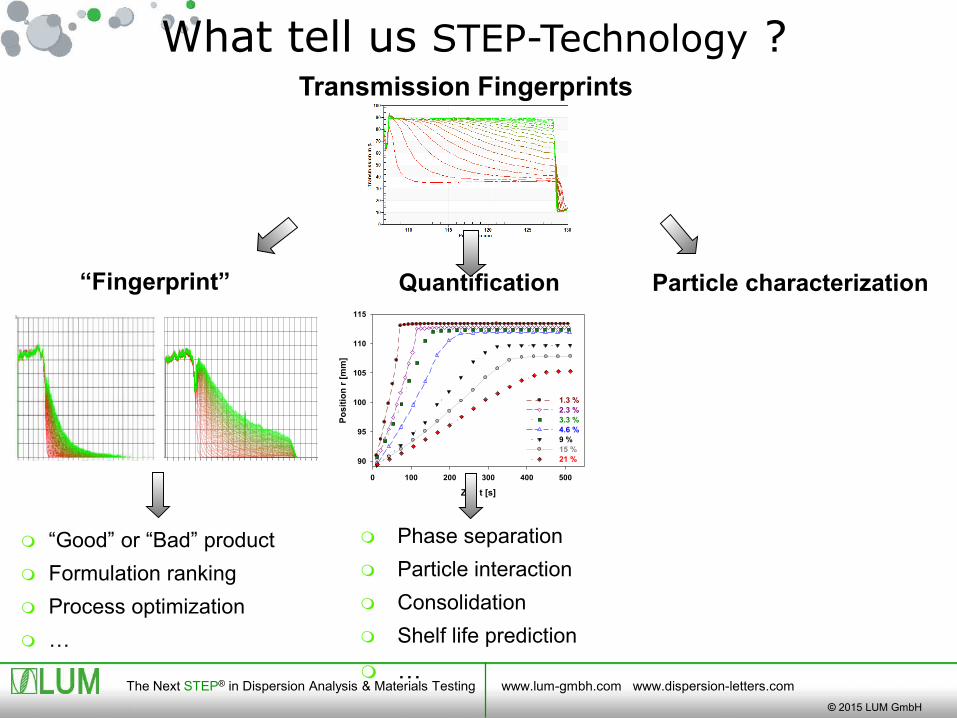
Phase separation
Particle interaction
Consolidation
Shelf life prediction
…
Particle characterization
Transmission Fingerprints
“Fingerprint”
“Good” or “Bad” product
Formulation ranking
Process optimization
…
Radius [mm]
110.0105.0100.095.090.0
100.0
50.0
Quantification
What tell us STEP-Technology ?

The Next STEP® in Dispersion Analysis & Materials Testing www.lum-gmbh.com www.dispersion-letters.com
© 2015 LUM GmbH
Partikelgröße x [µm]
0.1 1
dif
f. V
olu
men
vert
eilu
ng
q3(l
n x
) [-
]
0.0
0.5
1.0
1.5
2.0
2.5
3.0
ku
mu
lati
ve V
olu
men
vert
eilu
ng
Q3(x
) [%
]
0
20
40
60
80
100
q3(ln x)
Q3(x)
Velocity distribution
Particle size distribution
Density distribution
Magnetization
…
Zeit t [s]
0 100 200 300 400 500
Po
sit
ion
r [
mm
]
90
95
100
105
110
115
1.3 %
2.3 %
3.3 %
4.6 %
9 %
15 %
21 %
Phase separation
Particle interaction
Consolidation
Shelf life prediction
…
Particle characterization
Transmission Fingerprints
“Fingerprint”
“Good” or “Bad” product
Formulation ranking
Process optimization
…
Radius [mm]
110.0105.0100.095.090.0
100.0
50.0
Quantification
What tell us STEP-Technology ?
Original concentration
no dilution, no preparation!
The Next STEP® in Dispersion Analysis & Materials Testing www.lum-gmbh.com www.dispersion-letters.com
© 2015 LUM GmbH
18
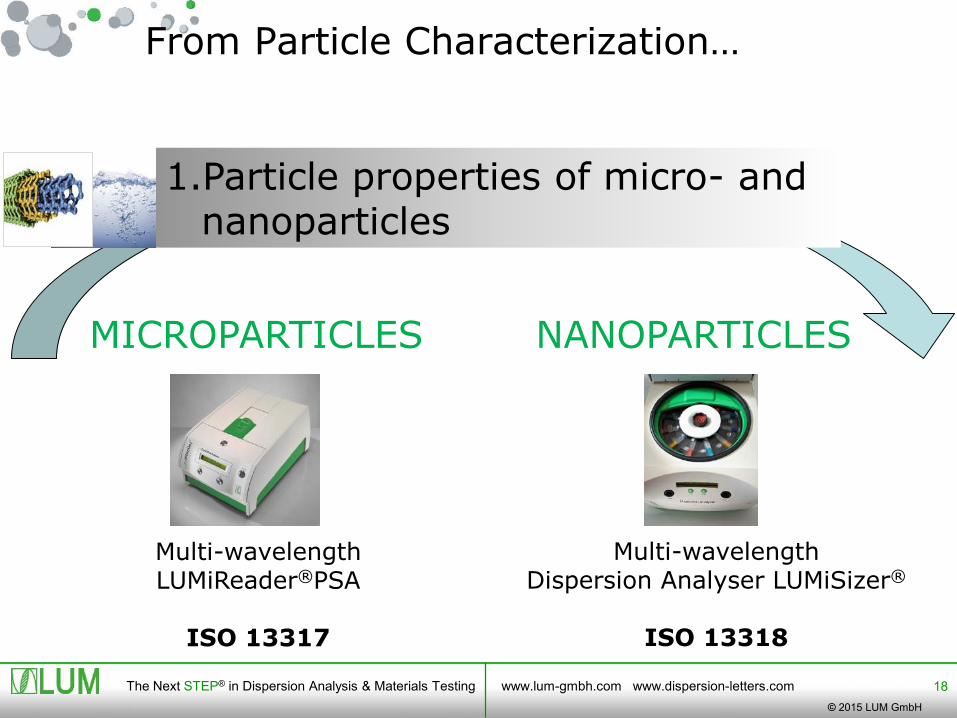
From Particle Characterization…
Multi-wavelengthLUMiReader®PSA
ISO 13317
1.Particle properties of micro- andnanoparticles
Multi-wavelengthDispersion Analyser LUMiSizer®
ISO 13318
MICROPARTICLES NANOPARTICLES
The Next STEP® in Dispersion Analysis & Materials Testing www.lum-gmbh.com www.dispersion-letters.com
© 2015 LUM GmbH
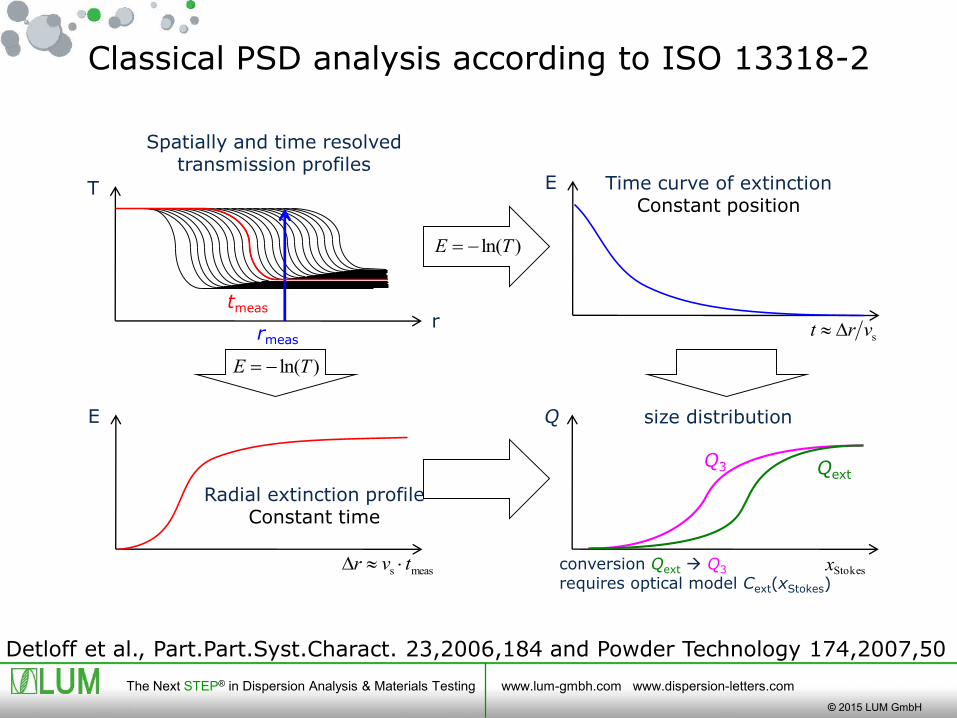
T
r
Spatially and time resolved transmission profiles
Classical PSD analysis according to ISO 13318-2
rmeas
)ln(TE
Time curve of extinctionConstant position
E
svrt D
tmeas
Radial extinction profileConstant time
E
meass tvr D
)ln(TE
Q3
conversion Qext Q3
requires optical model Cext(xStokes)
size distributionQ
Stokesx
Qext
Detloff et al., Part.Part.Syst.Charact. 23,2006,184 and Powder Technology 174,2007,50

The Next STEP® in Dispersion Analysis & Materials Testing www.lum-gmbh.com www.dispersion-letters.com
© 2015 LUM GmbH20
E(t)
t1 t2 Zeit t
E(t)
t1 t2 Zeit t
Velocity distribution
Velocity v Particle Concentration
v
)E(max
E)v(Q ii
tm
r0rt
Time
Distancev
-==
Determination of velocity distribution: 2 modes
Mode: Constant time Mode: Constant position
Important: Absolute method, no assumptions, no calibration, no gradient, constant T
E(r)
Position r
E(r)
r1 r2

The Next STEP® in Dispersion Analysis & Materials Testing www.lum-gmbh.com www.dispersion-letters.com
© 2015 LUM GmbH
21
92 94 96 98 100 102 104 106 108 110 112
Position r [mm]
100
0
50
Lig
ht
tran
sm
issio
n [
%]
114
Space and Time Resolved Extinction Profils
Mixture by volume A: 66,7%, 280nm; B: 33,3%, 545 nm
Fingerprint: Bimodal Silica
X50=280 nm
X50=545 nm

The Next STEP® in Dispersion Analysis & Materials Testing www.lum-gmbh.com www.dispersion-letters.com
© 2015 LUM GmbH
22
0
0.2
0.4
0.6
0.8
1
0.8 0.82 0.84 0.86 0.88 0.9 0.92 0.94
Velocity v [mm/s]
Cu
mu
lati
ve
Ve
loc
ity
Dis
trib
uti
on
Qv(v
) [-
]
0
5
10
15
20
25
30
35
40
Ve
loc
ity
Dis
trib
uti
on
qv(v
)
[s/m
m]
Velocity distribution
Bimodal silica: 280 nm + 545 nm, Ratio: 2/1
Sepview 6: Mode particle characterization/velocity distribution

The Next STEP® in Dispersion Analysis & Materials Testing www.lum-gmbh.com www.dispersion-letters.com
© 2015 LUM GmbH
23
Particle characterization (I)
1. Velocity and velocity distribution
PMMA
PMMA+ 1% oversized
API
Mono- & polydispersity
Duration,Grinding bodies
Hindrance function and shapeDetection of oversized
Optimization of milling
Redpigmentpastes
Peng He(2010)
The Next STEP® in Dispersion Analysis & Materials Testing www.lum-gmbh.com www.dispersion-letters.com
© 2015 LUM GmbH
24
Particle size x in µm
1 10 100 1000
Cu
mu
lati
ve
vo
lum
e d
istr
ibu
tio
n Q
3(x
)
0.0
0.2
0.4
0.6
0.8
1.0
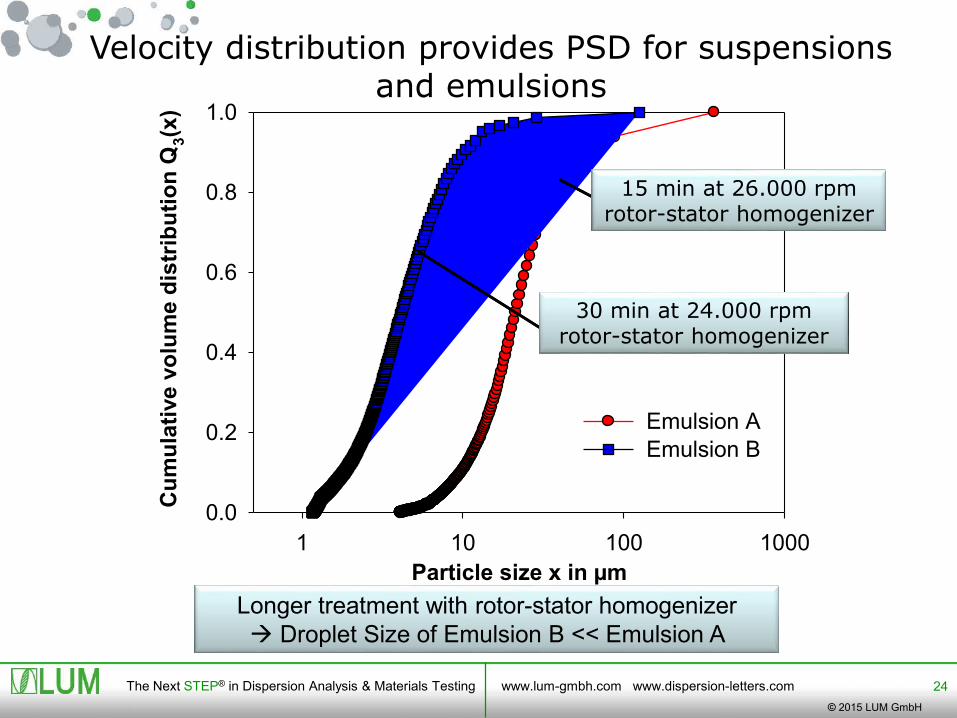
Emulsion A
Emulsion B
15 min at 26.000 rpmrotor-stator homogenizer
Longer treatment with rotor-stator homogenizer
Droplet Size of Emulsion B << Emulsion A
30 min at 24.000 rpmrotor-stator homogenizer
Velocity distribution provides PSD for suspensions and emulsions
The Next STEP® in Dispersion Analysis & Materials Testing www.lum-gmbh.com www.dispersion-letters.com
© 2015 LUM GmbH
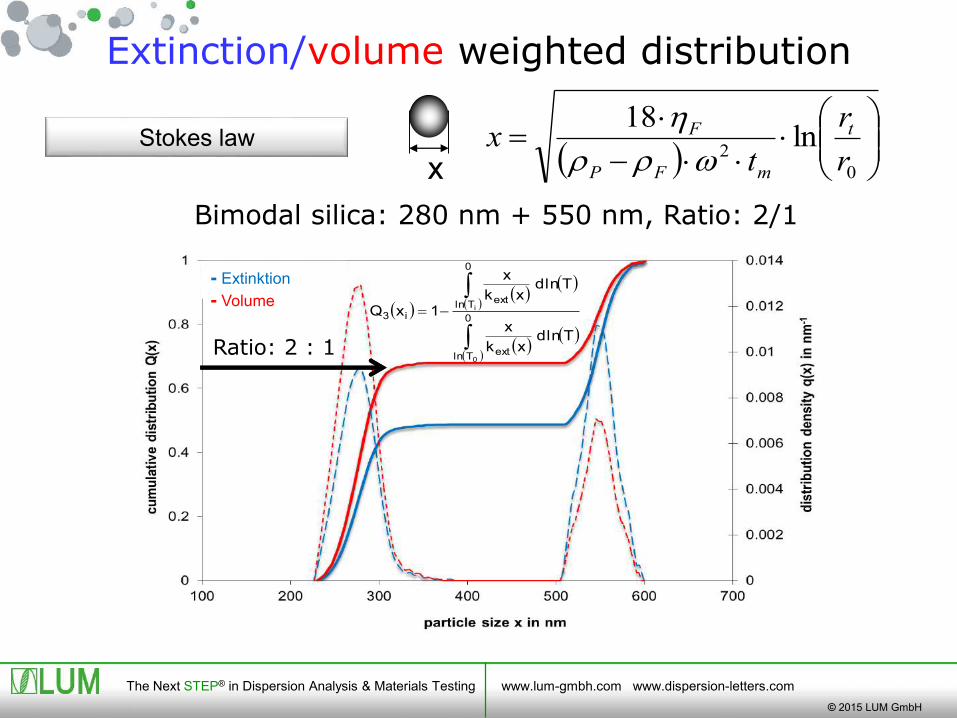
Extinction/volume weighted distribution
Bimodal silica: 280 nm + 550 nm, Ratio: 2/1
Ratio: 2 : 1
( )( )
( )
( )
( )( )
( )Tlndxk
x
Tlndxk
x
1xQ0
Tln ext
0
Tln ext
i3
0
i
Stokes law( )
0
2ln
18
r
r
tx t
mFP
F
wrr
h
x
- Extinktion
- Volume

The Next STEP® in Dispersion Analysis & Materials Testing www.lum-gmbh.com www.dispersion-letters.com
© 2015 LUM GmbH
0
0.2
0.4
0.6
0.8
1
100 1000 10000
particle size x [nm]
cu
mu
lati
ve d
istr
ibu
tio
n Q
(x)
[-]
280 nm LUMiSizer
280 nm PCS 173 °
550 nm LUMiSizer
550 nm PCS 173 °
550 nm SEM
1550 nm LUMiSizer
1550 nm PCS 173 °
1550 nm SEM
LUMiSizer vs. PCS 173° und SEM
PCS...Photon Correlation Spectroscopy SEM...Scanning Electron Microscopy
Validation
The Next STEP® in Dispersion Analysis & Materials Testing www.lum-gmbh.com www.dispersion-letters.com
© 2015 LUM GmbH
27
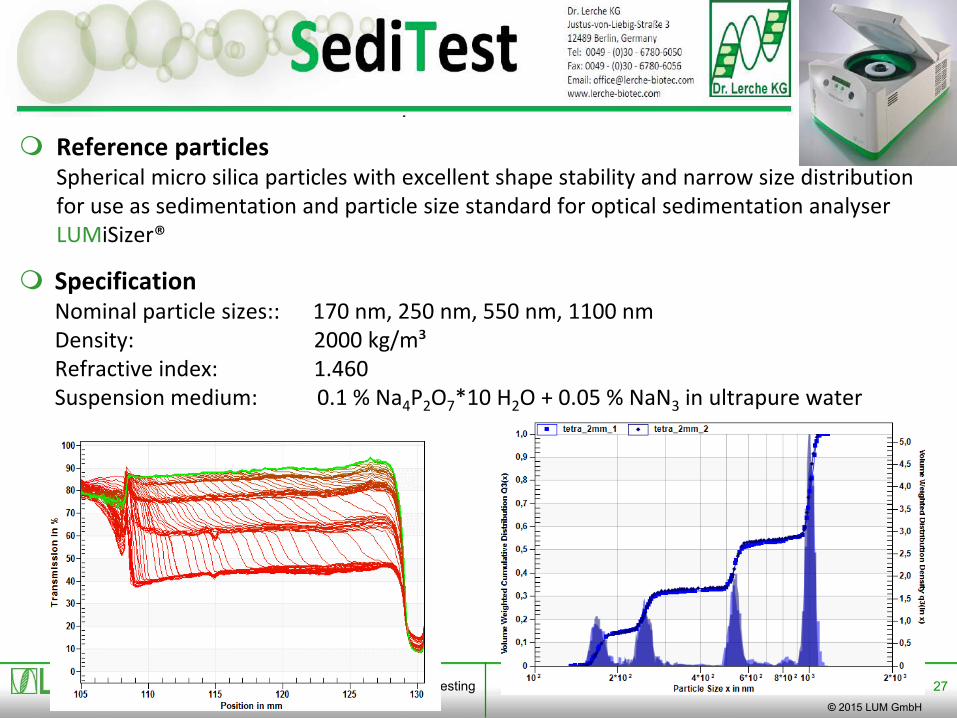
Reference particlesSpherical micro silica particles with excellent shape stability and narrow size distribution for use as sedimentation and particle size standard for optical sedimentation analyser LUMiSizer®
SpecificationNominal particle sizes:: 170 nm, 250 nm, 550 nm, 1100 nmDensity: 2000 kg/m³ Refractive index: 1.460Suspension medium: 0.1 % Na4P2O7*10 H2O + 0.05 % NaN3 in ultrapure water

The Next STEP® in Dispersion Analysis & Materials Testing www.lum-gmbh.com www.dispersion-letters.com
© 2015 LUM GmbH
Klebosol
1508-35 150H50 1630/26
Me
an
pa
rtic
le s
ize
[n
m]
0
20
40
60
80
100
120
LUMiSizer
XDC
PCS
TEM
SEM
Klebosol – different measurement techniques
XDC…X-Ray disc centrifuge, PCS…Photon correlation spectroscopy (dynamic light scattering),
TEM…Transmission electron microscope, SEM…Scanning electron microscope
T. Detloff, D. Lerche: Evaluation of particle size analysis by novel centrifugal sedimentation method,
Proceedings and poster Partec 2007 Int. Cong. on Particle Technology, Nuremberg, Germany, 27–29.3.2007
The Next STEP® in Dispersion Analysis & Materials Testing www.lum-gmbh.com www.dispersion-letters.com
© 2015 LUM GmbH
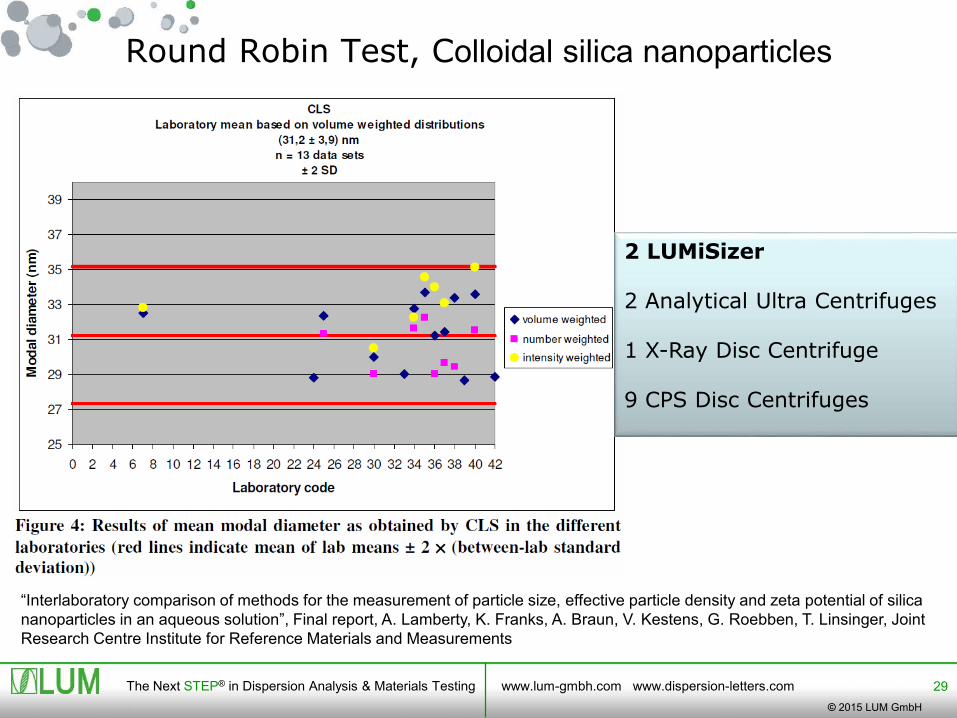
Round Robin Test, Colloidal silica nanoparticles
29
2 LUMiSizer
2 Analytical Ultra Centrifuges
1 X-Ray Disc Centrifuge
9 CPS Disc Centrifuges
“Interlaboratory comparison of methods for the measurement of particle size, effective particle density and zeta potential of silica
nanoparticles in an aqueous solution”, Final report, A. Lamberty, K. Franks, A. Braun, V. Kestens, G. Roebben, T. Linsinger, Joint
Research Centre Institute for Reference Materials and Measurements

The Next STEP® in Dispersion Analysis & Materials Testing www.lum-gmbh.com www.dispersion-letters.com
© 2015 LUM GmbH
30
Flexibility by variability of optical path and wavelengtho.p. = 1, 2 and 10 mm, l = 470 and 870 nmAu, Ag1, Ag2: 470 nm, 2 mm Ag3: 870 nm, 10 mm
Sobisch et al., Dispersion Letters 4 (2013) 9-11
SAXS (BAM) size:
Au NP 8; 54 nm
Au NP II; 18 nm
SAXS (BAM) size:
Ag 1; 59 nm
Ag 2; 37 nm
Ag 3: 19 nm
Size distribution of Au-NP and Ag-NP bymultiwavelength LUMiSizer compared to SAXS
The Next STEP® in Dispersion Analysis & Materials Testing www.lum-gmbh.com www.dispersion-letters.com
© 2015 LUM GmbH
particle size [nm]
100 1000 10000
cu
mu
lati
ve
vo
lum
e w
eig
hte
d d
istr
ibu
tio
n
[
%]
0
20
40
60
80
100
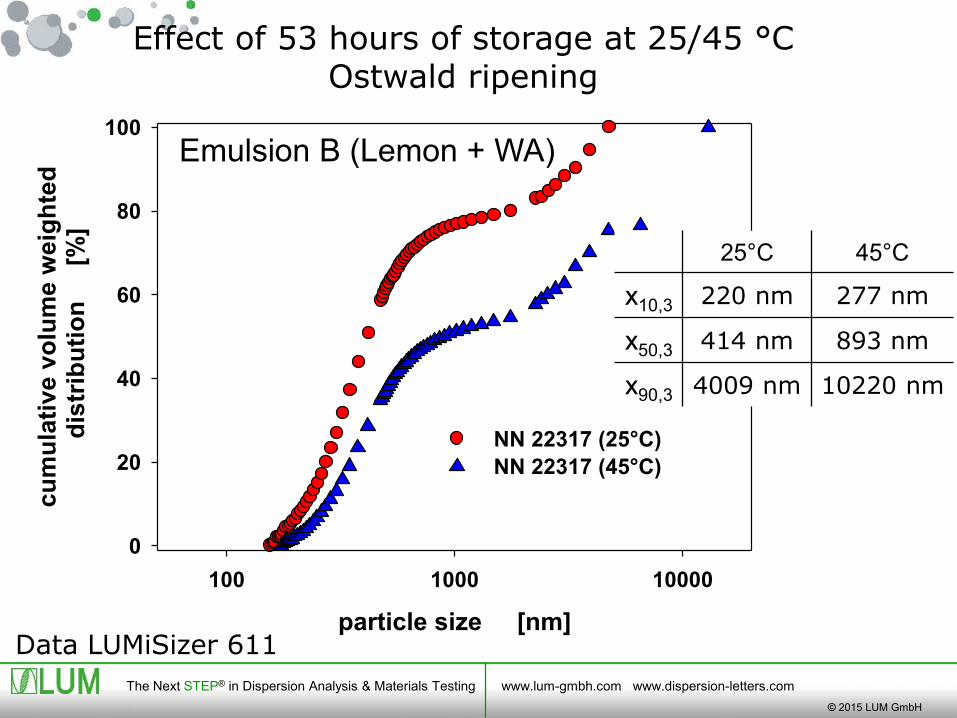
NN 22317 (25°C)
NN 22317 (45°C)
Effect of 53 hours of storage at 25/45 °COstwald ripening
Emulsion B (Lemon + WA)
25°C 45°C
x10,3 220 nm 277 nm
x50,3 414 nm 893 nm
x90,3 4009 nm 10220 nm
Data LUMiSizer 611

The Next STEP® in Dispersion Analysis & Materials Testing www.lum-gmbh.com www.dispersion-letters.com
© 2015 LUM GmbH
32
10 100 1000 10000
0
20
40
60
80
100
PEI-to-iron w/w ratio (%): 0 4 6 8 10 12
Volu
me
weig
hte
d
cum
ula
tive s
ize
dis
trib
utio
n Q
3 [%
]
Hydrodynamic diameter [nm]
equivalent particle diameter [nm]
300 500 2000 3000 5000 200001000 10000
cu
mu
lati
ve i
nte
ns
ity w
eih
gte
d
dis
trib
uti
on
[%
]
0
20
40
60
80
100
Iolitec
Nanocyl
Polytech&Net
0
Dispersed brands of MCNT
Soft silica shell magnetic core NPParticle recharging by PEIStable-flocculation-stable
Note: Large dynamic rangefrom 10 nm to 50 µm (LUMiSizer)
.
Size distribution of very polydisperse samples by LUMiSizer NIR

The Next STEP® in Dispersion Analysis & Materials Testing www.lum-gmbh.com www.dispersion-letters.com
© 2015 LUM GmbH
Klebosol 1508-35 150H50 1630/26
1 “batch” /
6 repetitions
49 nm 0.05 nm
= 0.1 %
84 nm 0.27 nm
= 0.3 %
102 nm 0.42 nm
= 0.4 %
6 “batches”49 nm 0.54 nm
= 1.1 %
84 nm 0.33 nm
= 0.4 %
103 nm 0.63 nm
= 0.6 %
Median x50,0 of different colloidal silica suspensions
LUMiSizer - Measurement Repetition
T. Detloff, D. Lerche: Evaluation of particle size analysis by novel centrifugal sedimentation method, Proceedings
and poster Partec 2007 International Congress on Particle Technology, Nuremberg, Germany, 27–29.3.2007
The Next STEP® in Dispersion Analysis & Materials Testing www.lum-gmbh.com www.dispersion-letters.com
© 2015 LUM GmbH
Particle size x in µm
0.6 1.0 1.4 1.80.4 0.8 1.2 1.6 2.0
Cu
mu
lati
ve
vo
lum
e d
istr
iuti
on
Q3(x
) in
%
0
20
40
60
80
100
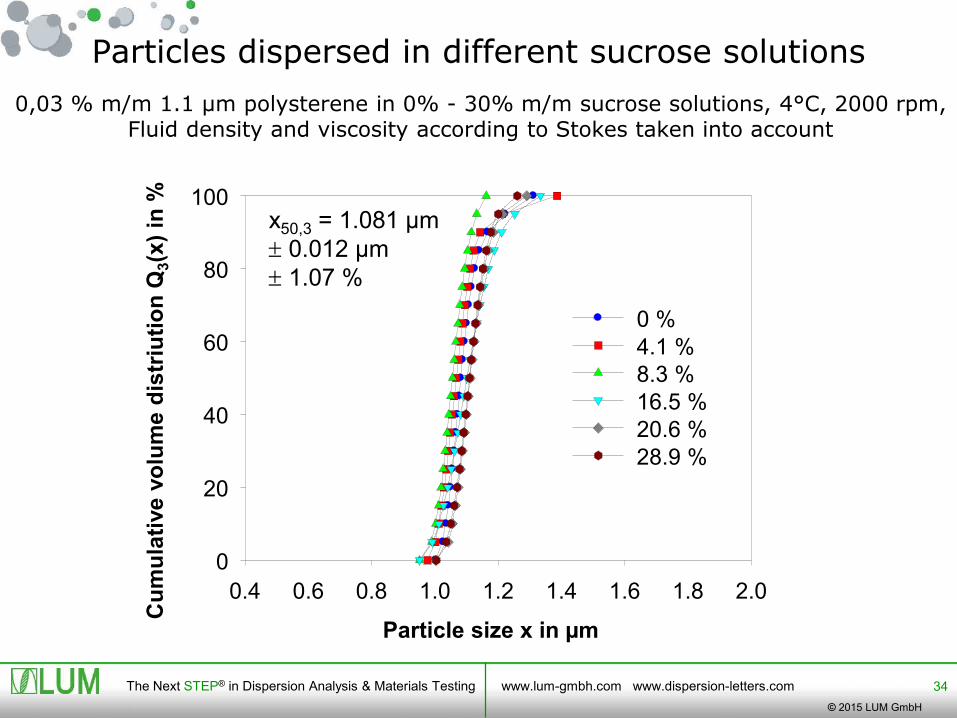
0 %
4.1 %
8.3 %
16.5 %
20.6 %
28.9 %
34
0,03 % m/m 1.1 µm polysterene in 0% - 30% m/m sucrose solutions, 4°C, 2000 rpm,Fluid density and viscosity according to Stokes taken into account
x50,3 = 1.081 µm
0.012 µm
1.07 %
Particles dispersed in different sucrose solutions

The Next STEP® in Dispersion Analysis & Materials Testing www.lum-gmbh.com www.dispersion-letters.com
© 2015 LUM GmbH
Particle size distribution at high concentration
0
20
40
60
80
100
50 100 150 200 250 300
Particle size x [nm]
Cu
m.
vo
l.-w
eig
hte
d
pa
rtic
le s
ize
dis
trib
uti
on
Q3(x
) [%
]
9.9% 7.2% 5.2% 3.2% 2.2%
1.1% 0.7% 0.4% 0.2% SEM
0
20
40
60
80
100
50 100 150 200 250 300
Particle size x [nm]
Cu
m. vo
l.-w
eig
hte
d p
art
icle
siz
e
dis
trib
uti
on
Q3(x
) [%
]
Correction for onlymulitiple scattering
Silica 175 nm
Correction for mulitiplescattering and hindrance
Silica 175 nm
0
20
40
60
80
100
50 100 150 200 250 300
Particle size x [nm]
Cum
. vol.
-wei
gh
ted
par
ticl
e si
ze
dis
trib
uti
on
Q3(x
) [%
]
Detloff et al., Powder Technology 174,2007,50

The Next STEP® in Dispersion Analysis & Materials Testing www.lum-gmbh.com www.dispersion-letters.com
© 2015 LUM GmbH
LUM workshop 2016, Berlin
Concentration profile analysis by AUC approaches Direct boundary method (DBM)
Walter et al., Nanoscale, 7(17):6574-6587, 2015
measured by K. Obata, Y. Mori (Doshisha University, Kyoto, Japan)
polydisperse silica polydisperse silica, different grades
„S“ = 0.1-0.5µm „M“ = 0.15-0.6µm „L“= 0.2…1.2µm
The Next STEP® in Dispersion Analysis & Materials Testing www.lum-gmbh.com www.dispersion-letters.com
© 2015 LUM GmbH
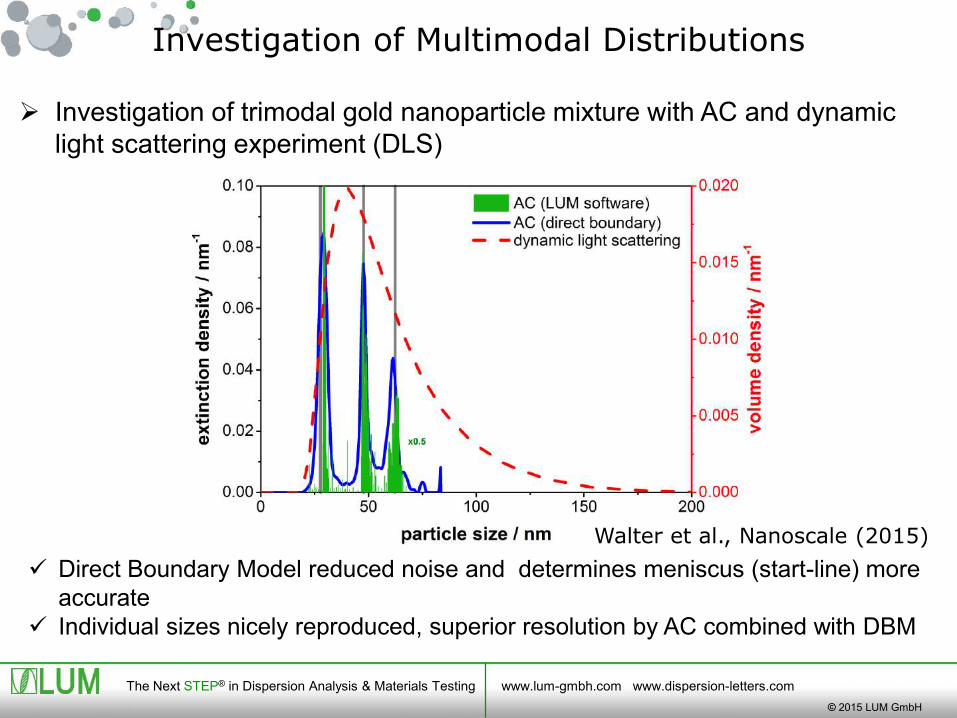
Investigation of Multimodal Distributions
Investigation of trimodal gold nanoparticle mixture with AC and dynamic
light scattering experiment (DLS)
Direct Boundary Model reduced noise and determines meniscus (start-line) more
accurate
Individual sizes nicely reproduced, superior resolution by AC combined with DBM
Walter et al., Nanoscale (2015)
The Next STEP® in Dispersion Analysis & Materials Testing www.lum-gmbh.com www.dispersion-letters.com
© 2015 LUM GmbH
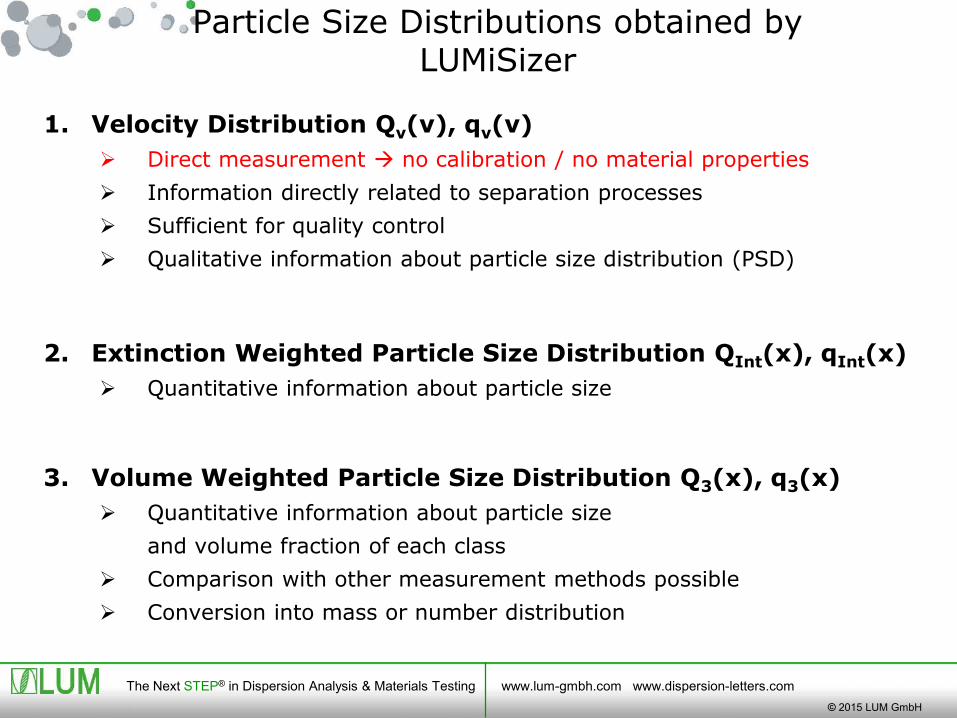
1. Velocity Distribution Qv(v), qv(v)
Direct measurement no calibration / no material properties
Information directly related to separation processes
Sufficient for quality control
Qualitative information about particle size distribution (PSD)
2. Extinction Weighted Particle Size Distribution QInt(x), qInt(x)
Quantitative information about particle size
3. Volume Weighted Particle Size Distribution Q3(x), q3(x)
Quantitative information about particle size
and volume fraction of each class
Comparison with other measurement methods possible
Conversion into mass or number distribution
Particle Size Distributions obtained by LUMiSizer
The Next STEP® in Dispersion Analysis & Materials Testing www.lum-gmbh.com www.dispersion-letters.com
© 2015 LUM GmbH
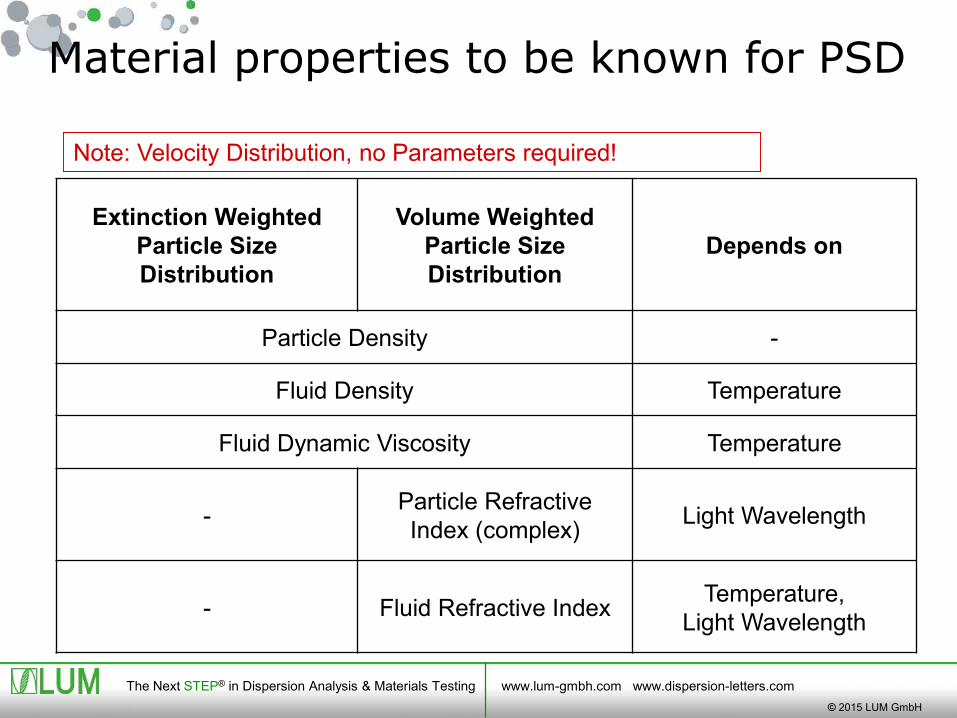
Material properties to be known for PSD
Extinction Weighted
Particle Size
Distribution
Volume Weighted
Particle Size
Distribution
Depends on
Particle Density -
Fluid Density Temperature
Fluid Dynamic Viscosity Temperature
-Particle Refractive
Index (complex)Light Wavelength
- Fluid Refractive IndexTemperature,
Light Wavelength
Note: Velocity Distribution, no Parameters required!
The Next STEP® in Dispersion Analysis & Materials Testing www.lum-gmbh.com www.dispersion-letters.com
© 2015 LUM GmbH
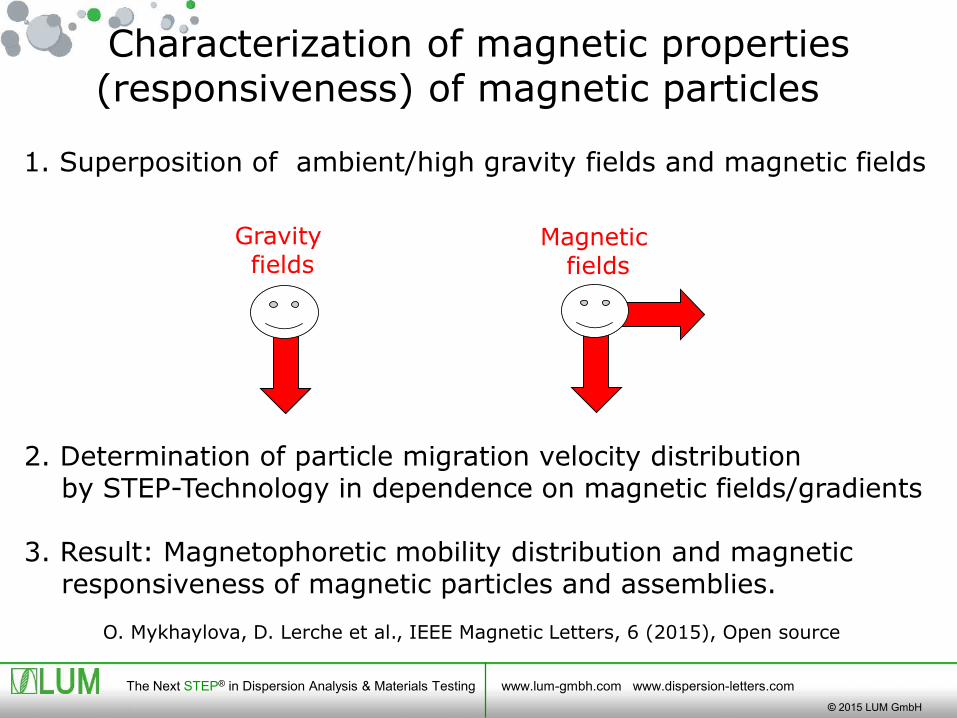
Characterization of magnetic properties(responsiveness) of magnetic particles
1. Superposition of ambient/high gravity fields and magnetic fields
Magneticfields
Gravity fields
2. Determination of particle migration velocity distributionby STEP-Technology in dependence on magnetic fields/gradients
3. Result: Magnetophoretic mobility distribution and magneticresponsiveness of magnetic particles and assemblies.
O. Mykhaylova, D. Lerche et al., IEEE Magnetic Letters, 6 (2015), Open source
The Next STEP® in Dispersion Analysis & Materials Testing www.lum-gmbh.com www.dispersion-letters.com
© 2015 LUM GmbH
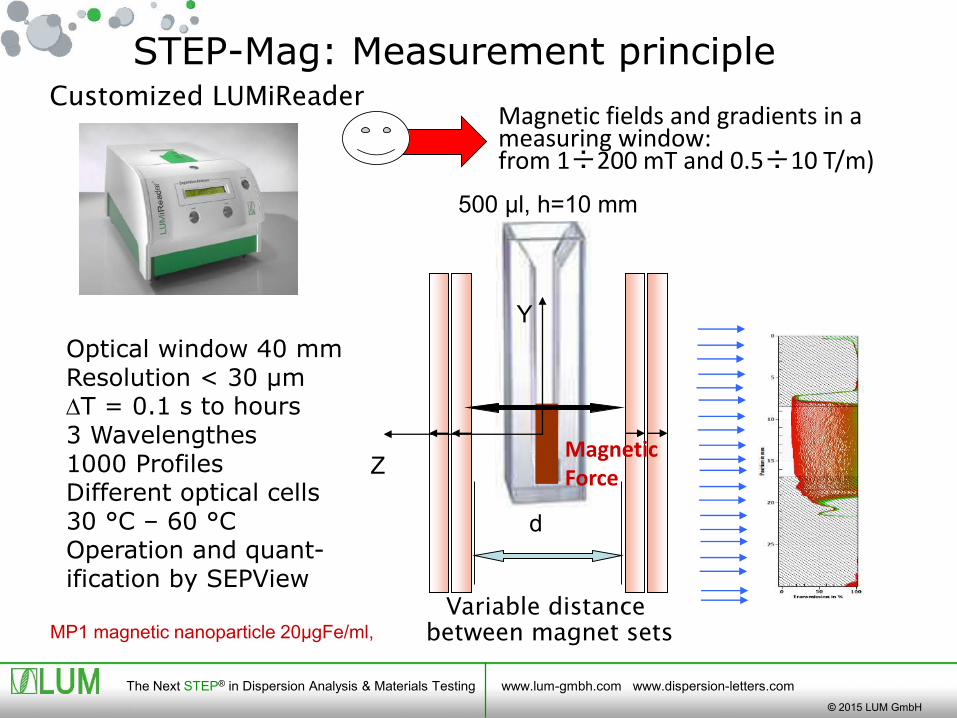
MP1 magnetic nanoparticle 20µgFe/ml,
500 µl, h=10 mm
Variable distance
between magnet sets
d
Z
Y
Magnetic Force
STEP-Mag: Measurement principleCustomized LUMiReader
Optical window 40 mmResolution < 30 µmDT = 0.1 s to hours3 Wavelengthes1000 ProfilesDifferent optical cells30 °C – 60 °COperation and quant-ification by SEPView
Magnetic fields and gradients in a measuring window: from 1÷200 mT and 0.5÷10 T/m)

The Next STEP® in Dispersion Analysis & Materials Testing www.lum-gmbh.com www.dispersion-letters.com
© 2015 LUM GmbH
Unstable suspension, Settling of MP6 under gravity
0 200 400 600 800 1000
24.5 mm
34.4 mm
43.6 mm
53.4 mm
63.4 mm
73.4 mm
no MF
Choice of the conditions for registration of the clarification in applied magnetic fields (Sedimentation vs. Magnetophoresis)
84.1 mm between magnetsMesurment duration 15 min
No magnetsMesurment duration 15 min
Time (s)
Microparticles MP6, 20µgFe/ml
D470
nm
averaged through the profile and
norm
alized
Magnetophoresis Sedimentation
The Next STEP® in Dispersion Analysis & Materials Testing www.lum-gmbh.com www.dispersion-letters.com
© 2015 LUM GmbH
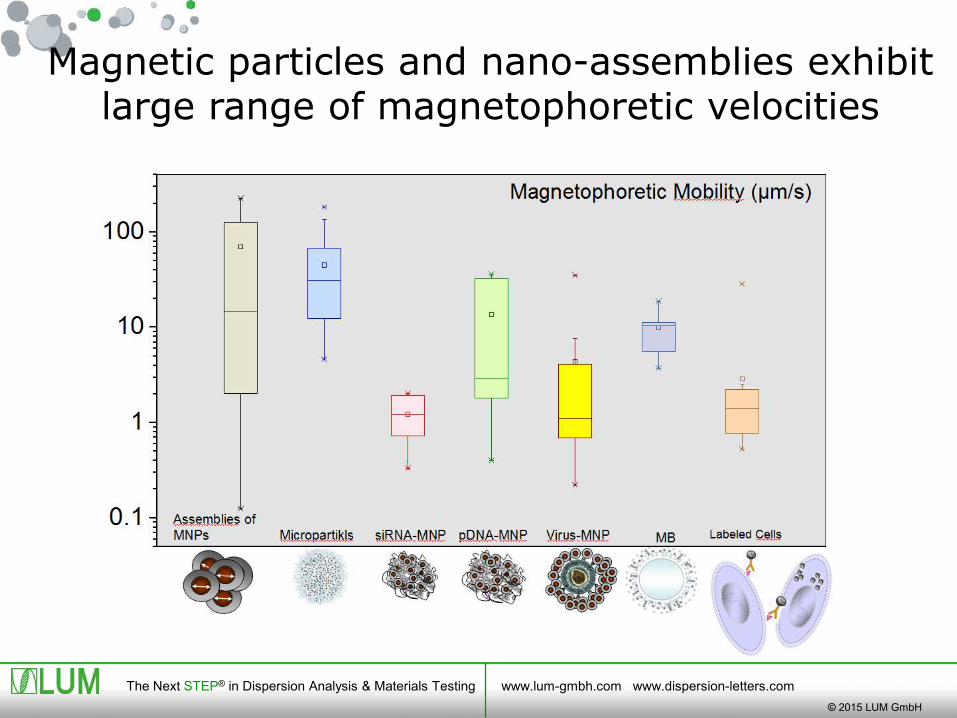
Magnetic particles and nano-assemblies exhibitlarge range of magnetophoretic velocities
The Next STEP® in Dispersion Analysis & Materials Testing www.lum-gmbh.com www.dispersion-letters.com
© 2015 LUM GmbH
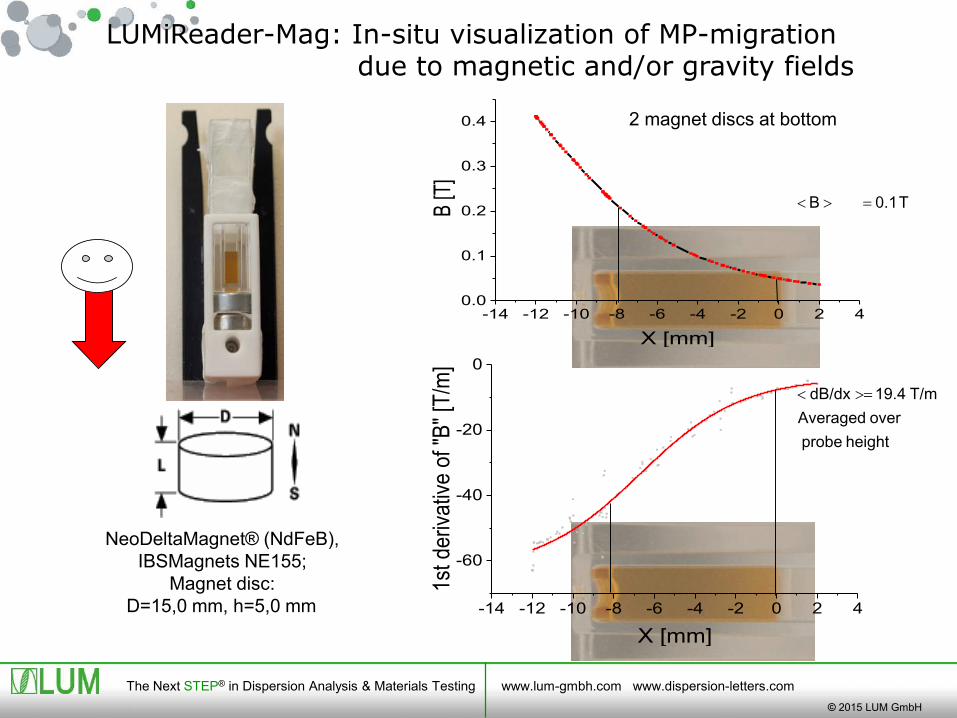
LUMiReader-Mag: In-situ visualization of MP-migration due to magnetic and/or gravity fields
-14 -12 -10 -8 -6 -4 -2 0 2 40.0
0.1
0.2
0.3
0.4
B [T
]
X [mm]
-14 -12 -10 -8 -6 -4 -2 0 2 4
-60
-40
-20
0
1st
de
riva
tive
of
"B"
[T/m
]
X [mm]
NeoDeltaMagnet® (NdFeB),
IBSMagnets NE155;
Magnet disc:
D=15,0 mm, h=5,0 mm
height probe
over Averaged
T/m 19.4dB/dx
T 0.1B
<
<
2 magnet discs at bottom
The Next STEP® in Dispersion Analysis & Materials Testing www.lum-gmbh.com www.dispersion-letters.com
© 2015 LUM GmbH
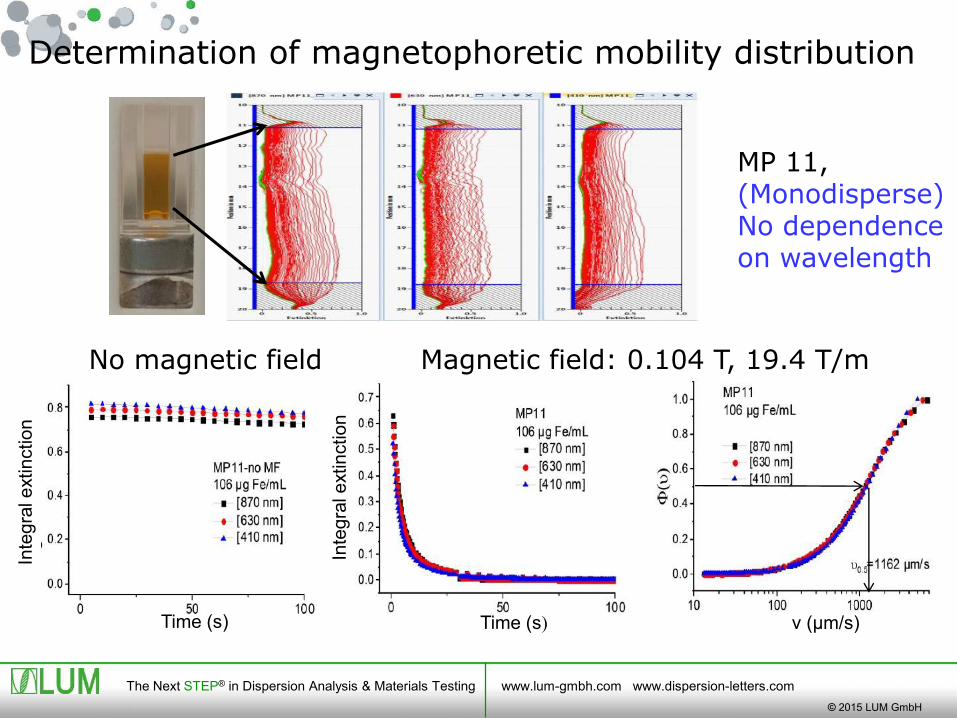
v (µm/s)
Inte
gra
l e
xtin
ctio
n
Inte
gra
l e
xtin
ctio
n
Time (s)Time (s)
No magnetic field Magnetic field: 0.104 T, 19.4 T/m
Determination of magnetophoretic mobility distribution
MP 11, (Monodisperse)No dependenceon wavelength

The Next STEP® in Dispersion Analysis & Materials Testing www.lum-gmbh.com www.dispersion-letters.com
© 2015 LUM GmbH
410 n
m630 n
m870 n
m
0 20 40 60 80 100-0.2
0.0
0.2
0.4
0.6
0.8
1.0
1.2
No
rma
lize
d I
nte
gra
l E
xtin
ctio
n
Time (s)
l = 410 nm
l = 630 nm
l = 870 nm
height sample
over Averaged
T/m5.33dB/dx
T16.0B
<
<
Magnetophoretic mobility analysedat different wavelengthes
MP 1, Polydisperse,Blue light datafocus more onsmall particles
The Next STEP® in Dispersion Analysis & Materials Testing www.lum-gmbh.com www.dispersion-letters.com
© 2015 LUM GmbH
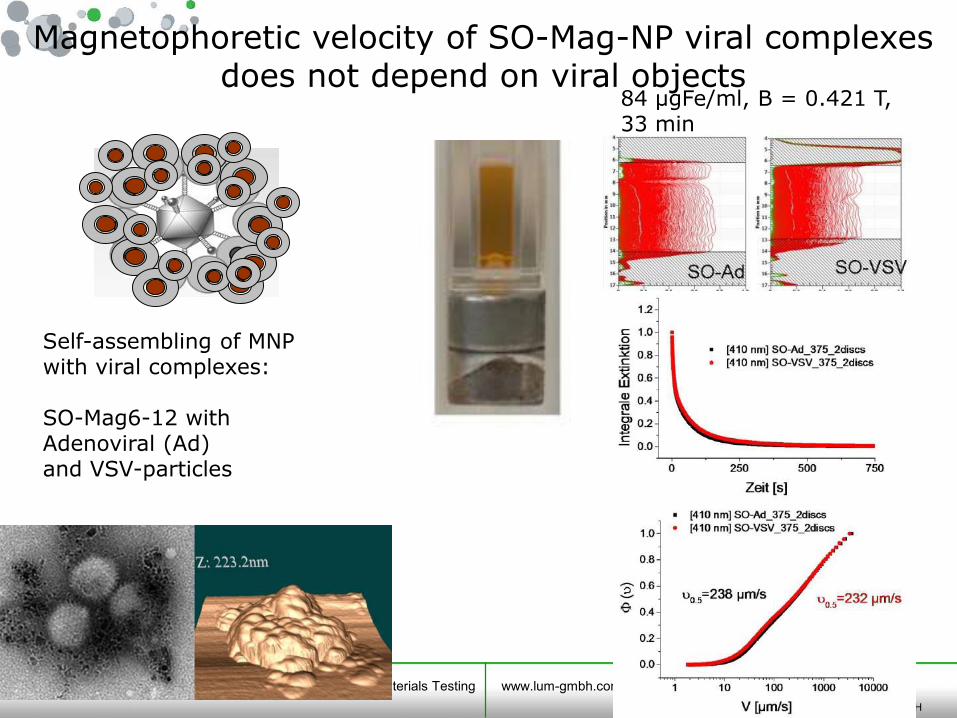
Self-assembling of MNP with viral complexes:
SO-Mag6-12 withAdenoviral (Ad)and VSV-particles
Magnetophoretic velocity of SO-Mag-NP viral complexesdoes not depend on viral objects
84 µgFe/ml, B = 0.421 T, 33 min
The Next STEP® in Dispersion Analysis & Materials Testing www.lum-gmbh.com www.dispersion-letters.com
© 2015 LUM GmbH
1. „Zero interpolation separation velocity” (Archimedian) approach (ISO/WD 18747-1):
Density determination by „keeping particles in suspense“, then density of the particle equals density of the fluid
Hydrodynamic density determinationof nano- @ microparticles dispersed in a liquid
49
Following slides see also: Woehlecke et al., Dispersion Letters 3 (2012) 12-15
The Next STEP® in Dispersion Analysis & Materials Testing www.lum-gmbh.com www.dispersion-letters.com
© 2015 LUM GmbH
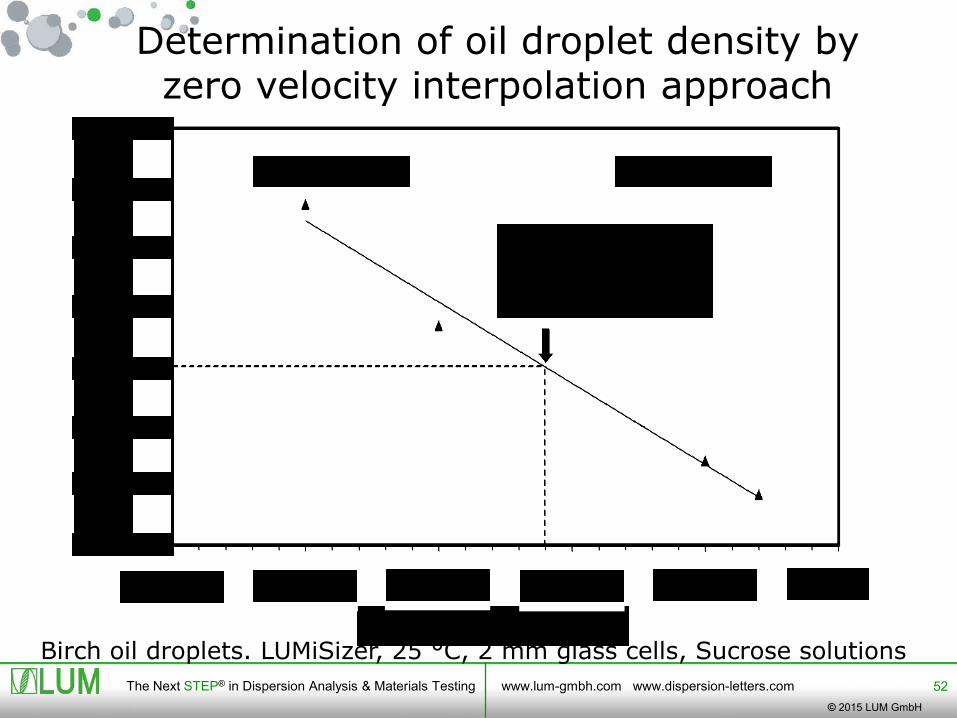
52
liquid density rL in kg/m³
pa
rti
cle
ve
locit
y y
× v
isc
os
ity h
in µ
m/s
× m
Pa·s
1050 1100 1150 1200 1250 1000
200
150
100
50
0
-50
-100
-150
sedimentation creaming
droplet density Interpolation y = 0
rP = 1139,6 kg/m³
Birch oil droplets. LUMiSizer, 25 °C, 2 mm glass cells, Sucrose solutions
Determination of oil droplet density byzero velocity interpolation approach

The Next STEP® in Dispersion Analysis & Materials Testing www.lum-gmbh.com www.dispersion-letters.com
© 2015 LUM GmbH
Sodium polytungstate concentration in % m/m
0 20 40 60 80
Den
sit
y r
in k
g/
m³
1000
1500
2000
2500
3000 Vis
co
sity
hin
mP
a s
0
10
20
30
40
50
60
DensityViscosity
TC-Tungsten Compounds, Germany
25°C
Density, Viscosity of sodium polytungstate solution
53
The Next STEP® in Dispersion Analysis & Materials Testing www.lum-gmbh.com www.dispersion-letters.com
© 2015 LUM GmbH
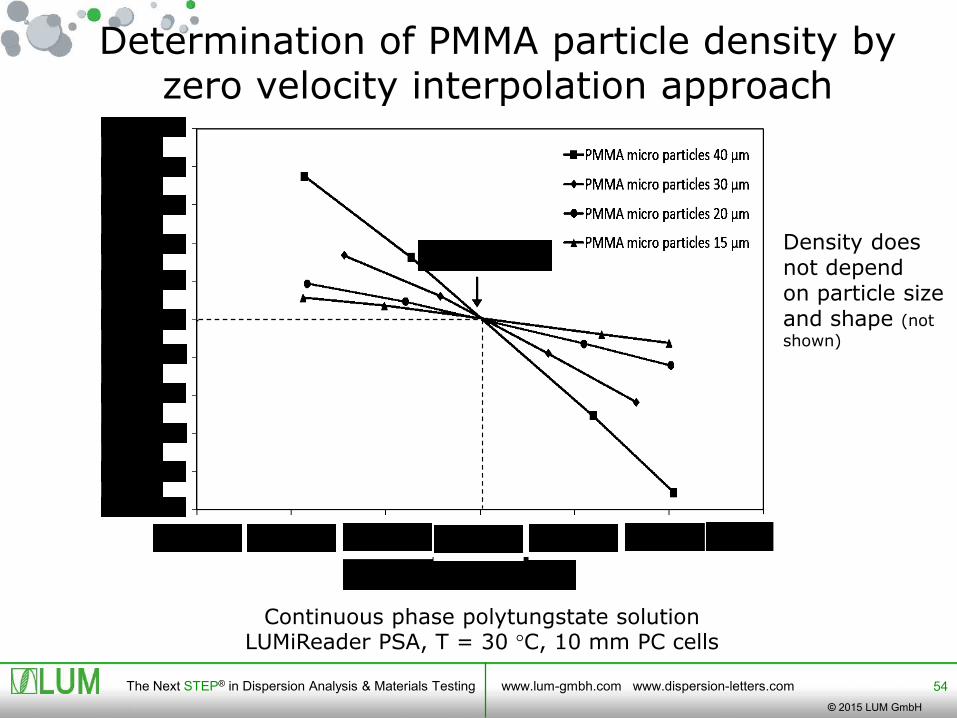
54
liquid density rL in kg/m³
parti
cle
velo
cit
y y
× v
isco
sit
y h
in µ
m/s
× m
Pa·s
1100 1150 1250 1300 1350 1050
100
80
40
20
0
-40
-60
-80
60
-100
-20
1200
rP = 1202 kg/m³
Continuous phase polytungstate solutionLUMiReader PSA, T = 30 °C, 10 mm PC cells
Determination of PMMA particle density byzero velocity interpolation approach
Density doesnot dependon particle sizeand shape (not
shown)
The Next STEP® in Dispersion Analysis & Materials Testing www.lum-gmbh.com www.dispersion-letters.com
© 2015 LUM GmbH
1. „Zero interpolation separation velocity” (Archimedian) approach (ISO/WD 18747-1):
Density determination by „keeping particles in suspense“, then density of the particle equals density of the fluid
2. „Two separation velocity” approach (ISO/WD 18747-2) :
Density determination by measuring separation velocities of dispersed particles in two continuous phases with different density
Hydrodynamic density determinationof nano- @ microparticles dispersed in a liquid
55
The Next STEP® in Dispersion Analysis & Materials Testing www.lum-gmbh.com www.dispersion-letters.com
© 2015 LUM GmbH
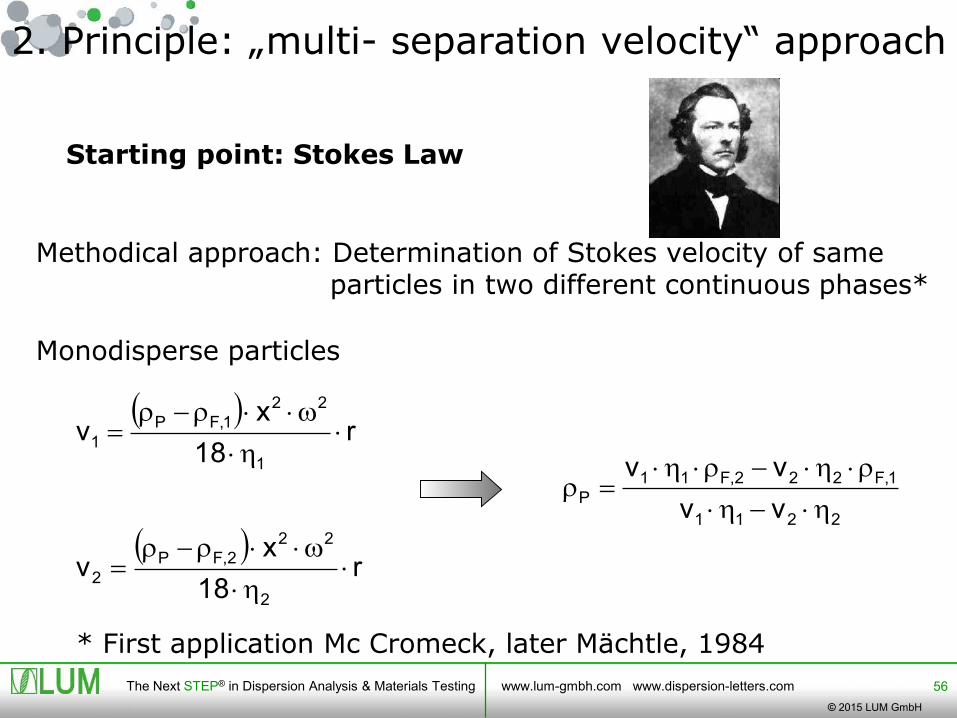
Starting point: Stokes Law
Methodical approach: Determination of Stokes velocity of same particles in two different continuous phases*
Monodisperse particles
* First application Mc Cromeck, later Mächtle, 1984
2211
1,F222,F11
Pvv
vv
hh
rhrhr
( )r
18
xv
1
22
1,FP
1 h
wrr
( )r
18
xv
2
22
2,FP
2 h
wrr
2. Principle: „multi- separation velocity“ approach
56
The Next STEP® in Dispersion Analysis & Materials Testing www.lum-gmbh.com www.dispersion-letters.com
© 2015 LUM GmbH
2211
1,F222,F11
Pvv
vv
hh
rhrhr
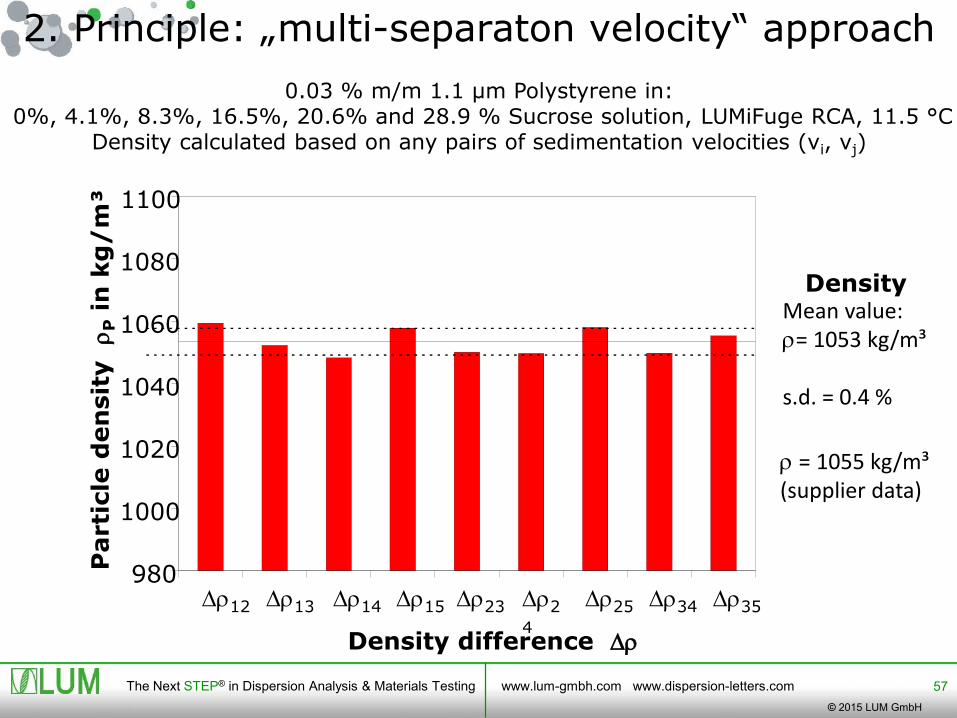
Mean value: r= 1053 kg/m³
s.d. = 0.4 %
0.03 % m/m 1.1 µm Polystyrene in:0%, 4.1%, 8.3%, 16.5%, 20.6% and 28.9 % Sucrose solution, LUMiFuge RCA, 11.5 °C
Density calculated based on any pairs of sedimentation velocities (vi, vj)
r = 1055 kg/m³ (supplier data)
Dr12 Dr13 Dr14 Dr23 Dr2
4
Dr34Dr15 Dr25 Dr35
Density
2. Principle: „multi-separaton velocity“ approach
57
980
1000
1020
1040
1060
1080
1100
Density difference Dr
Parti
cle
den
sit
y
rP
in k
g/
m³

The Next STEP® in Dispersion Analysis & Materials Testing www.lum-gmbh.com www.dispersion-letters.com
© 2015 LUM GmbH
Creaming velocity v in µm/s0,1 1 10 100C
um
. in
tensity d
istr
ibution Q
(v)
in %
0
20
40
60
80
100
Creaming of loaded beverage droplets dispersed in H2O and D2OLUMiSizer data, Velocity distribution, 4000 rpm, 7°C
H2O(r = 997 kg/m³)
D2O(r = 1100 kg/m³)
2. Principle: „Multi-separation velocity“ approach
58

The Next STEP® in Dispersion Analysis & Materials Testing www.lum-gmbh.com www.dispersion-letters.com
© 2015 LUM GmbH
940
945
950
955
960
0 20 40 60 80 100
Quantile velocity distribution Q(v) in %
Parti
cle
den
sit
y r
Pin
kg
/m
³
))v(Q(v))v(Q(v
))v(Q(v))v(Q(v
21
1,F22,F1
P
rrr
59
Large droplets,less dense
Small droplets,more dense
2. Principle: „two separation velocity“ approach
Density distribution of loaded droplets calculated based on creaming velocity distribution in H2O and D2O
The Next STEP® in Dispersion Analysis & Materials Testing www.lum-gmbh.com www.dispersion-letters.com
© 2015 LUM GmbH
60
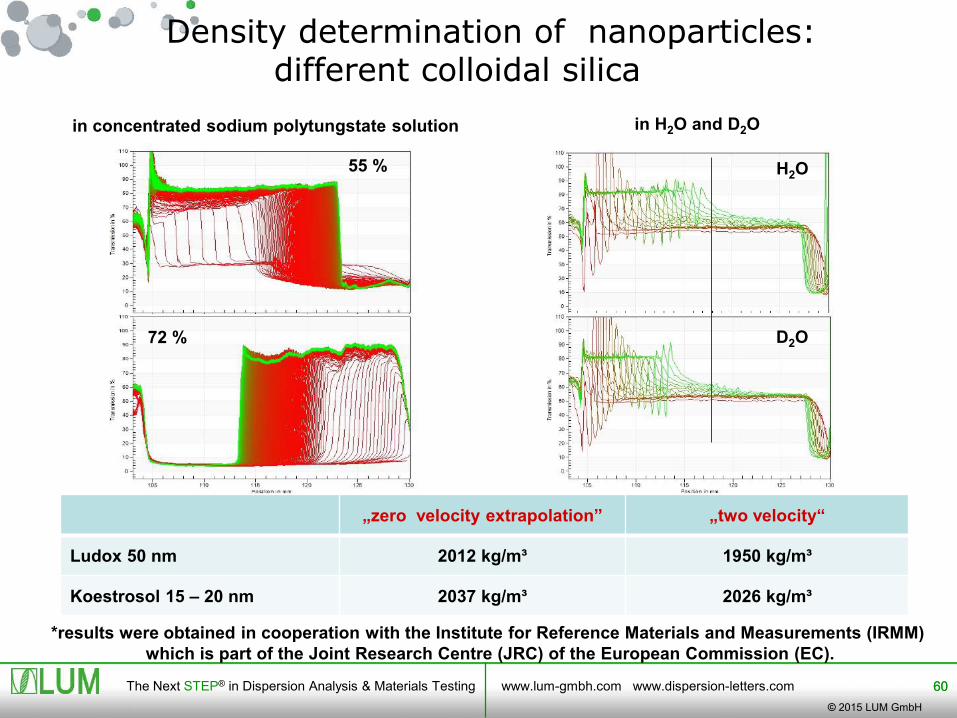
in concentrated sodium polytungstate solution
72 %
55 %
„zero velocity extrapolation” „two velocity“
Ludox 50 nm 2012 kg/m³ 1950 kg/m³
Koestrosol 15 – 20 nm 2037 kg/m³ 2026 kg/m³
H2O
D2O
in H2O and D2O
60
*results were obtained in cooperation with the Institute for Reference Materials and Measurements (IRMM)
which is part of the Joint Research Centre (JRC) of the European Commission (EC).
Density determination of nanoparticles: different colloidal silica
The Next STEP® in Dispersion Analysis & Materials Testing www.lum-gmbh.com www.dispersion-letters.com
© 2015 LUM GmbH
61
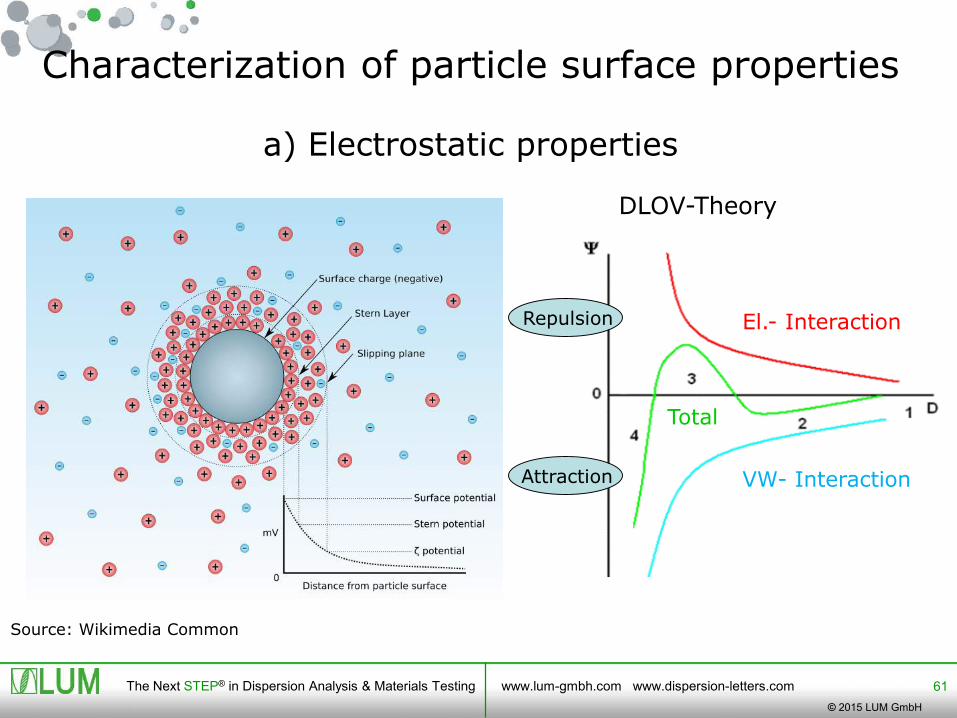
Characterization of particle surface properties
a) Electrostatic properties
DLOV-Theory
El.- Interaction
VW- Interaction
Total
Source: Wikimedia Common
Repulsion
Attraction

The Next STEP® in Dispersion Analysis & Materials Testing www.lum-gmbh.com www.dispersion-letters.com
© 2015 LUM GmbH
63
Electrostatic surface structure of„electrokinetic soft particles“ are not
assessible by Zeta
Contradictions to Smoluchowski:
1. 3D distribution of charges (radial, circumferential), volume charge
density [As/m³]
2. 3D-surface structure comparable to Debye-Hueckel length
3. Ion penetrable surface layer of e.g. polyelectrolytes
By Oshima

The Next STEP® in Dispersion Analysis & Materials Testing www.lum-gmbh.com www.dispersion-letters.com
© 2015 LUM GmbH
25 kD branched polyethylene imine
SO-Mag5 SO-Mag6-n
n=PEI-to-iron
w/w ratio (%)
Decoration of plain SO-Mag5 with branched 25 kDpolyethylene imine (PEI) to recharge surface
TEM AFM
Adenovirus-MNP-Assemblies
200 nm
MS = 94 emu/g iron; PO4 sites 8.4/nm²Zeta = -34 +/- 2mV
Primary CS-MNP Final Viral-MNP-Complex
Pharm Res. Mykhaylyk et al.,
DOI 10.1007/s11095-011-0661-9

The Next STEP® in Dispersion Analysis & Materials Testing www.lum-gmbh.com www.dispersion-letters.com
© 2015 LUM GmbH
0 5 10 15
-50
-25
0
25
50
Ele
ctr
okim
etic
pote
ntial [m
V]
0 2 4 6 8 10 12
10
100
1000
10000 Intensity PSD
NumberPSD
Hyd
rod
yn
am
ic d
iam
ete
r [n
m]
n= 0 1 1.5 2 4 6 8 10 12
In water
„Stability“ characterization by naked eye, electrokinetic potential, and particle size (DSL)
PEI-to-Iron w/w ratio n [%]
Nanosizer data
Conclusion: Ratio 4 – 5 is o.k. but clinical evaluation did not proof!
Decoration of plain SO-Mag5 with branched 25 kD
polyethylene imine (PEI) to recharge surface
Pharm Res. Mykhaylyk et al.,
DOI 10.1007/s11095-011-0661-9
The Next STEP® in Dispersion Analysis & Materials Testing www.lum-gmbh.com www.dispersion-letters.com
© 2015 LUM GmbH
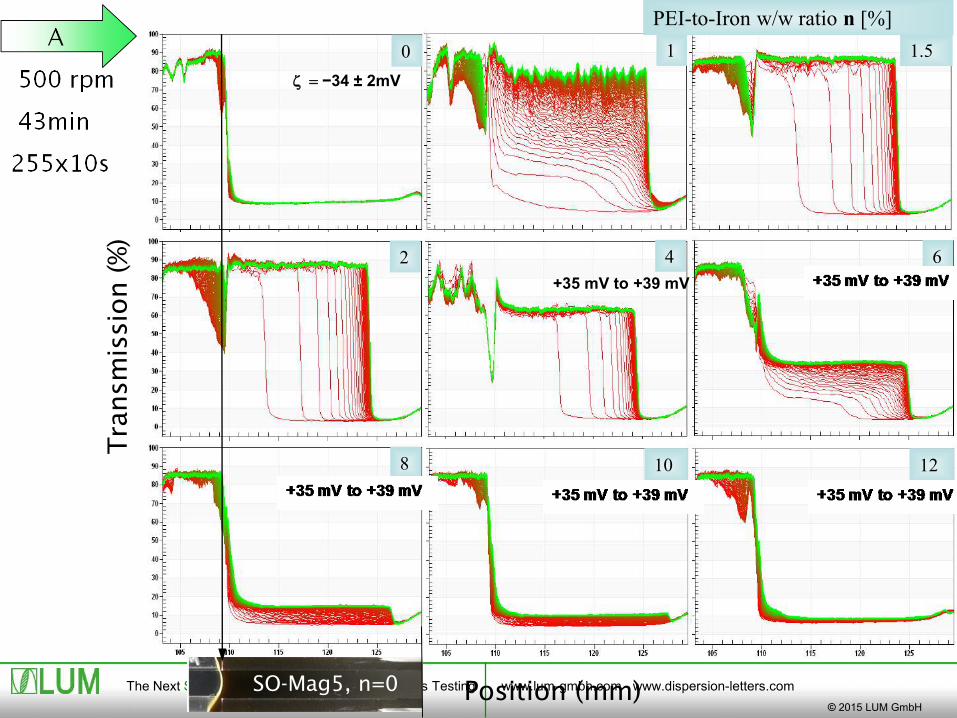
Transm
ission (%
)
Position (mm)
0 1 1.5
10
2 4
12
6
8
PEI-to-Iron w/w ratio n [%]
SO-Mag5, n=0
z −34 ± 2mV
+35 mV to +39 mV
The Next STEP® in Dispersion Analysis & Materials Testing www.lum-gmbh.com www.dispersion-letters.com
© 2015 LUM GmbH
68
0 2 4 6 8 10 12
1
2
4
8
16
32
64
128
256
Me
an
ma
gn
eto
ph
ore
tic
mo
bili
ty [
µm
/s]
PEI-to-Iron w/w ratio [%]
1 10 100 1000
0
20
40
60
80
100
120
PEI-to-Iron w/w ratio
0 12 1 1.5
2 4 6 8 10
Cu
mu
lative
dis
trib
utio
n f
un
ctio
n [
%]
Magnetophoretic mobility [µm/s]
10 100 1000 10000
0
20
40
60
80
100
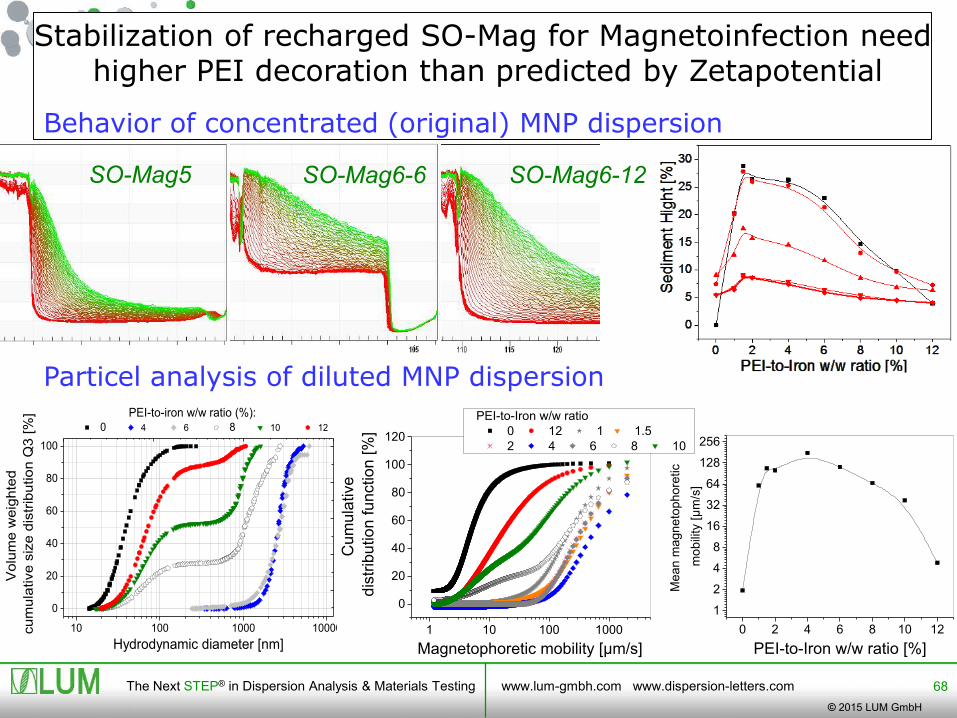
PEI-to-iron w/w ratio (%): 0 4 6 8 10 12
Vo
lum
e w
eig
hte
d
cu
mu
lative
siz
e d
istr
ibu
tio
n Q
3 [%
]
Hydrodynamic diameter [nm]
SO-Mag5 SO-Mag6-6 SO-Mag6-12
Stabilization of recharged SO-Mag for Magnetoinfection needhigher PEI decoration than predicted by Zetapotential
Behavior of concentrated (original) MNP dispersion
Particel analysis of diluted MNP dispersion

The Next STEP® in Dispersion Analysis & Materials Testing www.lum-gmbh.com www.dispersion-letters.com
© 2015 LUM GmbH
69
Good Affinity = Particles easy to disperse and stay dispersed
Bad Affinity = Particles difficult to disperse, state unstable
Prediction: 1. Measure the dispersibility of nano particles in different solvents with known HSP.
2. Calculate HSP (HDP) for particles.
Characterization of solubility (1936)
Hansen:
Dispersion forces (dD),
Polar interactions (dP),
Hydrogen bonding (dH).
Characterization of particle surface propertiesb) Hansen Solubilty Parameters (HSPs)

The Next STEP® in Dispersion Analysis & Materials Testing www.lum-gmbh.com www.dispersion-letters.com
© 2015 LUM GmbH
72
General SOP: 3. Calculate sedimentation time (ST)
based on Integral Extinction
Sedimentation time
E0 = extinction ofpure liquid
ST = time toreachE0 + 0.15
The Next STEP® in Dispersion Analysis & Materials Testing www.lum-gmbh.com www.dispersion-letters.com
© 2015 LUM GmbH
73
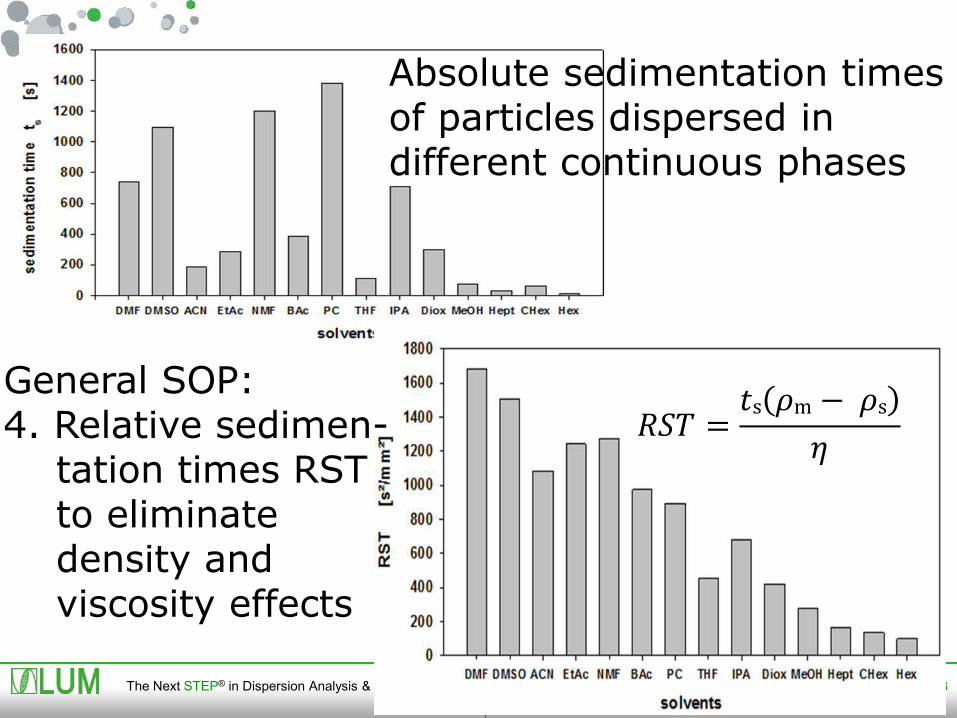
𝑅𝑆𝑇 =𝑡s 𝜌m − 𝜌s
𝜂
Absolute sedimentation timesof particles dispersed indifferent continuous phases
General SOP: 4. Relative sedimen-
tation times RSTto eliminatedensity andviscosity effects
The Next STEP® in Dispersion Analysis & Materials Testing www.lum-gmbh.com www.dispersion-letters.com
© 2015 LUM GmbH74
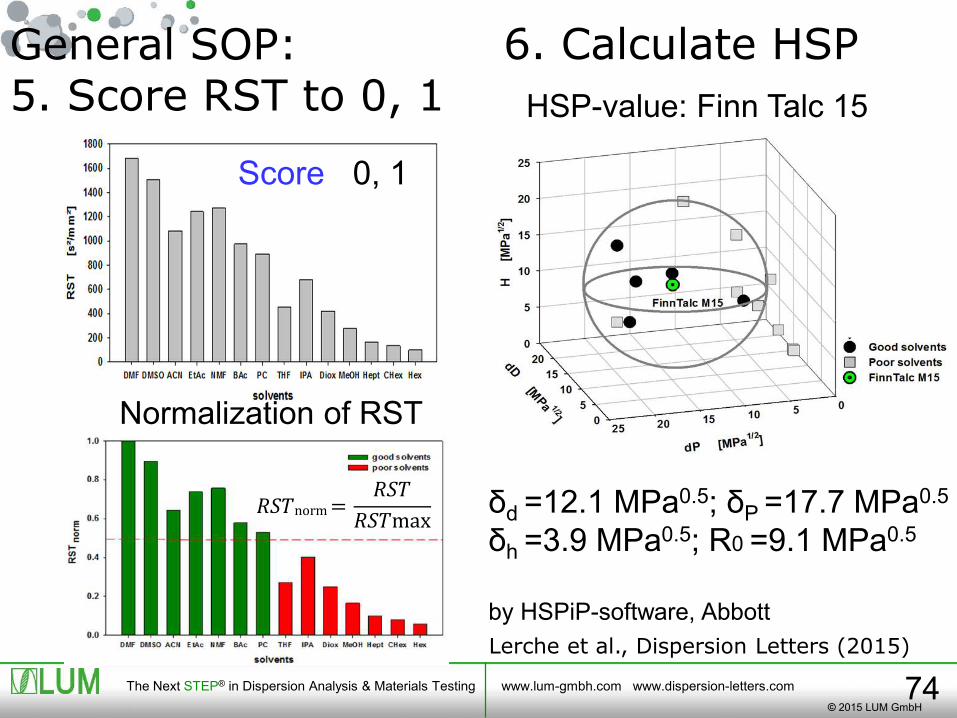
Score 0, 1
HSP-value: Finn Talc 15
δd =12.1 MPa0.5; δP =17.7 MPa0.5
δh =3.9 MPa0.5; R0 =9.1 MPa0.5
by HSPiP-software, Abbott
Lerche et al., Dispersion Letters (2015)
𝑅𝑆𝑇norm =
𝑅𝑆𝑇
𝑅𝑆𝑇max
Normalization of RST
General SOP: 5. Score RST to 0, 1
6. Calculate HSP
The Next STEP® in Dispersion Analysis & Materials Testing www.lum-gmbh.com www.dispersion-letters.com
© 2015 LUM GmbH
77
Particle sedimentation or creamingSeparation velocity distributionParticle size distributionParticle density (distribution)Particle magnetizationSurface characterization of particles
Summary: Particle Characterizationby Analytical Centrifugation
with STEP-Technology

The Next STEP® in Dispersion Analysis & Materials Testing www.lum-gmbh.com www.dispersion-letters.com
© 2015 LUM GmbH
Thank you so much for spending your time with us !!!
More Information: See exhibition by Adaptive Instruments (Colin Jenkins).
www.LUM-GmbH.com, www.adaptive-instruments.com
www.Dispersion-Letters.com