comprehensive housing market analysis for laredo… · comprehensive housing market analysis...
TRANSCRIPT

C O M P R E H E N S I V E H O U S I N G M A R K E T A N A L Y S I S
Laredo, TexasU.S. Department of Housing and Urban Development Office of Policy Development and Research As of February 1, 2015
Mexico
Texas
Webb
DimmitLa Salle
Mav
eric
k
Duval
Zapata Jim Hogg
McM
ulle
n
Housing Market Area
The Laredo Housing Market Area (HMA) is coterminous with the Laredo, TX Metropolitan Statistical Area, which consists of Webb County, Texas. In sou - thern Texas on the border with Mexico, the Port of Laredo is the largest inland port in the United States.
SummaryEconomy Job growth associated with oil and natural gas exploration and interna-tional trade has contributed to sig - nificant improvement in economic conditions in the Laredo HMA since 2010. Nonfarm payrolls increased 2.3 percent during the 12 months ending January 2015, unchanged from the rate of growth during the 12 months ending January 2014. The unemploy-ment rate averaged 5.0 percent during the 12 months ending January 2015, down from 6.0 percent during the pre vious 12 months. Job growth is expected to average 2.5 percent annu - ally during the 3-year forecast period. Table DP-1 at the end of this report provides employment data for the HMA.
Sales MarketThe sales housing market in the HMA is currently balanced. The estimated sales vacancy rate is 1.4 percent, down from 1.9 percent in April 2010. The inventory of homes for sale declined from 5.9 months in January 2014 to 5.2 months in January 2015 (Real Estate Center at Texas A&M Uni-versity). During the forecast period, demand is expected for 3,225 new homes, including 125 mobile homes (Table 1). The 290 homes currently under construction and a portion of
the estimated 3,700 other vacant units that may come back on the market will satisfy part of the demand.
Rental MarketThe rental housing market in the HMA is currently balanced. The overall rental vacancy rate is estimated at 6.6 percent, down from 7.8 percent in April 2010. Elevated building activity since 2012 has stabilized the rental market after an influx of workers associated with the Eagle Ford Shale oil and natural gas field resulted in a shortage of rental housing from 2010 to 2012. During the forecast period, demand is estimated for 1,300 market-rate rental units (Table 1). The 1,000 units currently under con - struction will satisfy most of that demand.
Table 1. Housing Demand in the Laredo HMA During the Forecast Period
Laredo HMA
SalesUnits
RentalUnits
Total demand 3,225 1,300
Under construction 290 1,000
Notes: Total demand represents estimated production necessary to achieve a balanced market at the end of the forecast period. Units under construction as of February 1, 2015. A portion of the estimated 3,700 other vacant units in the HMA will likely satisfy some of the forecast demand. Includes an estimated demand for 125 mobile homes. The forecast period is February 1, 2015, to February 1, 2018. Source: Estimates by analysts
Market DetailsEconomic Conditions ............... 2
Population and Households ..... 6
Housing Market Trends ............ 8
Data Profile ............................. 11

La
red
o,
TX
• C
OM
PR
EH
EN
SIV
E H
OU
SIN
G M
AR
KE
T A
NA
LYS
IS
2Economic Conditions
Economic conditions remain strong in the Laredo HMA as
nonfarm payrolls continue to grow, a trend that began during 2010. During the 12 months ending January 2015, nonfarm payrolls reached a new peak of 98,500 jobs, an increase of 2,200 jobs, or 2.3 percent, compared with the number of jobs during the 12 months ending January 2014 (Table 2). The current rate of growth is unchanged from the 12 months ending January 2014. Job growth during the 12 months ending January 2015 was led by the leisure and hospitality sector, which increased by 600 jobs, or 6.1 percent, from the previous 12 months. The un - employment rate during the 12 months
ending January 2015 averaged 5.0 per - cent, down from the 6.0-percent rate during the 12 months ending January 2014. After peaking at 8.5 percent in 2009, the unemployment rate is now only slightly above the previous low of 4.7 percent in 2007 (Figure 1). In ter national trade and the Eagle Ford Shale development have been the major factors contributing to the growth in the HMA since 2010.
Because it is within 100 miles of the industrial center of Monterrey, Mexico, the HMA has an economic base in international trade, a trait that has strengthened since the implementation of the North American Free Trade Agreement (NAFTA) in 1994. Trade between the United States and Mexico, as measured by the dollar value of goods crossing the border, has increased more than 230 percent, after adjusting for inflation, since the passage of NAFTA. During 2014, $91.8 billion of U.S exports and $107.4 billion of U.S. imports passed through the Port of Laredo, both up 11 percent compared with the dollar value of exports and imports in 2013 and up from $58.1 billion and $68.3 billion in 2010 (U.S. Department of Commerce, Census Bureau, Foreign Trade Division). The increase in international trade increased demand for warehouse stor-age facilities. In 2014, 21 warehouses were permitted with a total value of $29 million, up significantly from the 6 warehouses permitted in 2010 with a total value of $6 million (city of Laredo building permit data). In addition to warehouse facilities con - tributing to the wholesale trade sub - sector, many people who live in Nuevo Laredo, Mexico, cross the border to shop in the Laredo HMA, supporting the retail trade subsector. Vehicle cross - ings, excluding large trucks, averaged
Table 2. 12-Month Average Nonfarm Payroll Jobs in the Laredo HMA, by Sector
12 Months EndingAbsolute Change
Percent ChangeJanuary
2014January
2015
Total nonfarm payroll jobs 96,300 98,500 2,200 2.3Goods-producing sectors 5,500 5,600 100 1.8
Mining, logging, & construction 4,800 4,900 100 2.1Manufacturing 800 700 – 100 – 12.5
Service-providing sectors 90,800 92,900 2,100 2.3Wholesale & retail trade 15,800 16,000 200 1.3Transportation & utilities 13,700 14,000 300 2.2Information 700 700 0 0.0Financial activities 3,800 3,800 0 0.0Professional & business services 7,700 8,000 300 3.9Education & health services 14,700 14,900 200 1.4Leisure & hospitality 9,800 10,400 600 6.1Other services 2,500 2,600 100 4.0Government 22,200 22,500 300 1.4
Notes: Numbers may not add to totals because of rounding. Based on 12-month averages through January 2014 and January 2015.Source: U.S. Bureau of Labor Statistics
Figure 1. Trends in Labor Force, Resident Employment, and Unem-ployment Rate in the Laredo HMA, 2000 Through 2014
Source: U.S. Bureau of Labor Statistics
Une
mpl
oym
ent r
ate
Labo
r fo
rce
and
resi
dent
em
ploy
men
t
120,000
110,000
100,000
90,000
80,000
70,000
60,000
2000
2002
2004
Labor force Resident employment Unemployment rate
10.0
8.0
6.0
4.0
2.0
0.0
2006
2001
2003
2005
2007
2009
2010
2008
2012
2013
2014
2011

La
red
o,
TX
• C
OM
PR
EH
EN
SIV
E H
OU
SIN
G M
AR
KE
T A
NA
LYS
IS
3
17,700 a day and pedestrian crossings averaged 17,300 a day during the 12 months ending September 2014 (the most recent data available). Interna-tional trade supports many jobs in the wholesale and retail trade and the transportation and utilities sectors. The transportation and utilities sector currently accounts for 14.2 percent of all nonfarm payroll jobs in the HMA (Figure 2) compared with 4.1 percent in Texas and 3.7 percent nationally. Nonfarm payrolls in the transportation and utilities sector increased by 300 jobs, or 2.2 percent, to 14,000 jobs during the 12 months ending January 2015 compared with nonfarm payrolls during the previous 12 months. The wholesale and retail trade sector in-creased by 200 jobs, or 1.3 during the same period and benefited from an increase in the Mexican sales tax dur-ing 2014, which provided more of an
incentive for shoppers from Mexico to cross the border for shopping in the HMA.
The proximity of the HMA to the U.S. border with Mexico also has a significant effect on the government sector, the largest sector in the HMA with 22.8 percent of all nonfarm pay-roll jobs during the 12 months ending January 2015. The Laredo Sector of the U.S. Border Patrol is currently one of the largest employers in the HMA, with 2,100 employees (Table 3). The number of border patrol agents working out of the Laredo field office nearly doubled from 2004 to 2010 as a result of the 2004 Intelligence Reform and Terrorism Prevention Act. The increase in border patrol agents contributed to average annual growth of 750 jobs, or 3.7 percent, in the government sector from 2004 through 2010. Since 2010, the number of jobs in the federal gov-ernment subsector has been relatively unchanged in the HMA. During 2011 and 2012, revenue-constrained state and local government agencies contrib - uted to a decline of 400 jobs, or 1.8 percent, annually in the government sector. Since 2012, state and local government agencies have recovered some of the jobs lost during the pre - vious 2 years, and the government sector has increased by 150 jobs, or 0.7 percent, annually.
The Laredo HMA is within the Eagle Ford Shale formation, a large area of oil and gas drilling in southern Texas that extends more than 400 miles from Webb County in the west to Gonzales County in the east. Many of the firms in the oil and natural gas extraction industries are regional operations with central offices in Houston, San Antonio, or elsewhere and outstation transient workers who perform much of the
Figure 2. Current Nonfarm Payroll Jobs in the Laredo HMA, by Sector
Note: Based on 12-month averages through January 2015.Source: U.S. Bureau of Labor Statistics
Table 3. Major Employers in the Laredo HMA
Name of Employer Nonfarm Payroll Sector Number of Employees
City of Laredo Government 2,465Laredo Sector of the U.S. Border Patrol Government 2,100HEB Grocery Company, LP Wholesale & retail trade 1,800McDonald’s Restaurant Wholesale & retail trade 1,540Laredo Medical Center Education & health services 1,500Webb County Government 1,500Texas A&M International University Government 1,325Wal-Mart Stores, Inc. Wholesale & retail trade 1,175Convergys Information 940Laredo Community College Government 930
Note: Excludes local school districts.Source: Laredo Development Foundation
Economic Conditions Continued
Government 22.8%
Leisure & hospitality 10.6%
Other services 2.6%
Education & health services 15.2% Professional & business services 8.1%
Wholesale & retail trade 16.2%
Manufacturing 0.7%Mining, logging, & construction 4.9%
Information 0.7%
Transportation & utilities 14.2%
Financial activities 3.9%

La
red
o,
TX
• C
OM
PR
EH
EN
SIV
E H
OU
SIN
G M
AR
KE
T A
NA
LYS
IS
4
work in the oil fields. Because these transient workers move from location to location working on the wells, many maintain a permanent residence near the re gional office and may not be included in employment statistics in the counties where the wells are being drilled. The HMA, as the only metropol - itan area in the southwestern portion of the Eagle Ford Shale development, was the closest location where workers in the oil field could get a hotel room or apartment at which to stay when they were on rotation in the oil fields in an adjacent county, which greatly reduced both hotel and apartment vacancy rates. During 2014 (the most recent data available), 3,125 people were employed in the natural resources and mining subsector, which is an increase of 225 jobs, or 8.0 percent, compared with the number of workers during the previous year and double the number of workers in 2010 (Quar terly Census of Employment and Wages [QCEW]). Despite recent employment gains, this subsector accounts for only 3 percent of total nonfarm payrolls in the HMA. As of February 1, 2015, 17 oil and natural gas rigs were operating within the HMA, down from 20 rigs operating on February 1, 2014, and an estimated peak of 40 in mid-2012. This drop is attributable to firms slow-ing exploration for natural gas and oil, initially because of the decline in natural gas prices and then because of the subsequent decline in crude oil prices. The development of the Eagle Ford Shale positively affected wages in the Laredo HMA despite slower wage growth nationally after the national economic recession that ended in June 2009. From 2010 through 2012, wages increased at a rate of 6.1 percent an-nually in the HMA compared with a
national rate of 3.5 percent (QCEW). Since 2012, wage growth in the HMA has slowed to a rate of 1.9 percent on an annualized basis through 2014 (the most recent data available), a rate that is slightly lower than the national rate of 2.0 percent. This wage growth slowdown is primarily the result of job creation shifting away from higher paying oil- and gas-related jobs to trade, transportation, and leisure and hospi - tality jobs. The amount of sales subject to state tax, a measure of the oil and gas industries’ effect on an area, in-creased in the HMA by an average of $186 million, or 9.5 percent, annually to $2.343 billion from 2010 through 2012. Since 2012, sales subject to state tax in the HMA have increased at a more modest 4.2 percent annually. Although growth is expected to be limited, employment from oil and natural gas extraction is expected to remain stable during the next 3 years, despite lower gas and oil prices.
Economic conditions in the Laredo HMA have improved significantly since a decline in nonfarm payrolls in 2009 because of increased trade and the oil and gas development in the Eagle Ford Shale, although the rate of job growth remains below the rate during much of the 2000s. From 2000 through 2008, nonfarm payrolls in the HMA increased by an average of 2,750 jobs, or 3.5 percent, annually, to 90,900 jobs. During this time, the government sector led job growth and added an average of 760 jobs, an increase of 6.5 percent, annually. The education and health services sector, which has been the fastest grow - ing sector in the HMA since 2000 (Figure 3), added an average of 650 jobs, an increase of 4.1 percent, an-nually from 2000 through 2008.
Economic Conditions Continued

La
red
o,
TX
• C
OM
PR
EH
EN
SIV
E H
OU
SIN
G M
AR
KE
T A
NA
LYS
IS
5
Figure 3. Sector Growth in the Laredo HMA, Percentage Change, 2000 to Current
Note: Current is based on 12-month averages through January 2015.Source: U.S. Bureau of Labor Statistics
Nonfarm payrolls declined by 3,000 jobs, or 3.3 percent, in 2009 as a result of the effects of the national recession. During that year, the transportation and utilities sector lost the most jobs, declining by 1,100 jobs, or 10.2 per - cent, primarily because of a 17-percent decline in the dollar value of goods traded between the United States and Mexico during 2009 compared with the value in 2008 (U.S. Department of Commerce, Census Bureau, Foreign Trade Division). Other sectors with large job losses during 2009 were the mining, logging, and construction sector and the retail trade subsector, which declined by 800 and 1,000 jobs, or 17.7 and 7.6 percent, respectively.
Job growth averaged 2.6 percent a year from 2010 through 2014, with job creation related to oil and natural gas exploration in the Eagle Ford Shale formation leading gains from 2010 through 2012. During 2013, as the price of natural gas declined, drilling activity began to leave the HMA and move to other areas of the formation that produced more crude oil. With
the Eagle Ford Shale formation not providing as much of a boost to non - farm payroll growth because of the drop in natural gas prices, employ-ment sectors that are affected by oil and natural gas development started to have slower growth. From 2010 through 2012, nonfarm payroll gains in the mining, logging, and construc-tion sector averaged 350, or 9.3 per-cent, annually before slowing to 300, or 6.8 percent, annually from 2012 through 2014. The professional and business services sector, also affected by oil and gas exploration activity, increased by 700 jobs, or 9.8 percent, annually from 2010 through 2012 before slowing to an increase of 150, or 2.0 percent, annually from 2012 through 2014. From 2012 through 2014, the leisure and hospitality sector increased by 600 jobs, or 6.3 percent, annually unchanged from the previ-ous 2 years.
During the 3-year forecast period, non - farm payrolls are expected to increase by an average of 2,500 jobs, or 2.5 per - cent, annually. Job growth is expected
Economic Conditions Continued
Total nonfarm payroll jobs
Goods-producing sectors
Mining, logging, & construction
Manufacturing
Service-providing sectors
Information
Financial activities
Professional & business services
Education & health services
Government
Other services
Leisure & hospitality
Transportation & utilities
Wholesale & retail trade
– 20 – 10 200 10– 30– 60 – 40– 50 30 40 50 60 70 9080

La
red
o,
TX
• C
OM
PR
EH
EN
SIV
E H
OU
SIN
G M
AR
KE
T A
NA
LYS
IS
6
to be broad based across all employment sectors and increase during each year of the forecast period as international trade expands and despite slowing explo ration for natural gas and oil in the Eagle Ford Shale. The El Portal Outlet mall, an $80 million project in the city of Laredo, will begin con-struction in the spring of 2015 and is expected to create more than 700 construction jobs and 500 permanent
jobs when complete in 2017. The HMA is also expected to benefit from the development of the Cuenca de Burgos Shale Basin in Mexico, which is directly south of the Rio Grande River. With Mexico’s recent decision to allow foreign development of its oil fields, many of the oil and gas firms in the HMA are likely to see increased demand for their services during the next 3 years.
Population and Households
The population of the Laredo HMA has increased since 2010
by an estimated 3,800, or 1.5 percent, annually, to 268,700. Population growth in the HMA since 2000 was greatest from 2000 to 2004 (Census Bureau July 1 estimates), when it averaged 5,825 people, or 2.9 percent, annually before dropping slightly to an average of 5,575, or 2.4 percent, annually from 2005 to 2010. Net in- migration averaged 890 people annually from 2000 to 2004 but declined 24 percent, to 680 annually, from 2005 to 2010. Since 2010, despite strong em - ployment growth, the HMA has ex - perienced net out-migration of 420 people annually, partly because many
young people in the HMA move to larger metropolitan areas to attend college or for greater employment opportunities. In 2011, the most recent data available, more than 55 percent of people leaving the HMA are relocat - ing to a larger city in Texas, with 21 percent moving to San Antonio (Inter - nal Revenue Service migration data). The levels of net out-migration from the HMA were much higher during 2013 and 2014, when the number of people leaving the HMA remained fairly stable, but the number of people moving into the HMA declined as employment growth from the Eagle Ford Shale area slowed. Net natural increase (resident births minus resident deaths) has accounted for all the popu - lation increase since 2010. Net natural increase accounted for 85 percent of the population growth from 2000 to 2004 but increased to 88 percent from 2005 to 2010. Figure 4 shows the components of population change since 2000.
Similar to other metropolitan areas near the U.S.-Mexico border, the Laredo HMA has a very high average
Figure 4. Components of Population Change in the Laredo HMA, 2000 to Forecast
Notes: The current date is February 1, 2015. The forecast date is February 1, 2018.Sources: 2000 and 2010—2000 Census and 2010 Census; current and forecast—estimates by analysts
Economic Conditions Continued
5,000
4,000
3,000
2,000
1,000
0
– 1,0002000 to 2010 2010 to current Current to forecast
Ave
rage
ann
ual c
hang
e
Net natural change Net migration

La
red
o,
TX
• C
OM
PR
EH
EN
SIV
E H
OU
SIN
G M
AR
KE
T A
NA
LYS
IS
7
household size compared with the average size in the rest of the nation. Because a high percentage of the population growth has come from net natural change since 2000, the HMA includes many households with chil - dren younger than 18 years old, which contribute to the large average house - hold size. In the HMA, 35.2 percent of the population is younger than 18 years of age, which is significantly higher than the national average of 24.0 percent and the Texas average of 27.3 percent (2010 Census). The city of Laredo has one of the youngest populations in the United States, with a median age of 27.9 years compared
with the national median age of 37.2 years (2010 Census). Laredo ranks ninth for youngest median age among places with more than 100,000 inhab - itants (Census Bureau). The cities that rank ahead of Laredo, such as Gaines - ville, Florida, Ann Arbor, Michigan, and Killen, Texas, all have a large university or military presence, which would tend to decrease the median age.
An estimated 73,100 households cur - rently are in the HMA, which is an increase of 1,250 households, or 1.8 percent, annually since 2010. The number of households in the HMA increased by 1,625, or 2.8 percent, annually from 50,740 households in 2000 to 67,106 in 2010. The home-ownership rate steadily declined in the HMA from 2000 to 2010, from 65.7 to 64.5 percent. This decline has continued from 2010 to the current date; the current homeownership rate is estimated at 62.0 percent. The de - cline in the homeownership rate has followed the national trend as lending institutions have tightened lending requirements and more people have chosen to rent rather than purchase a home. Figure 5 shows the number of households by tenure.
During the 3-year forecast period, population and household growth are expected to resemble the rates recorded from 2010 to the current date. The population is forecast to increase by an average of 4,400, or 1.6 percent, annually, and the number of house-holds is expected to grow by an aver - age of 1,375, or 1.9 percent, annually during the next 3 years. Figure 6 shows population and household growth in the Laredo HMA from 2000 through the forecast period.
Figure 5. Number of Households by Tenure in the Laredo HMA, 2000 to Current
Note: The current date is February 1, 2015.Sources: 2000 and 2010—2000 Census and 2010 Census; current—estimates by analysts
Figure 6. Population and Household Growth in the Laredo HMA, 2000 to Forecast
Notes: The current date is February 1, 2015. The forecast date is February 1, 2018.Sources: 2000 and 2010—2000 Census and 2010 Census; current and forecast—estimates by analysts
Population and Households Continued
Population Households
6,000
5,000
4,000
3,000
2,000
1,000
02000 to 2010 2010 to current Current to forecast
Ave
rage
ann
ual c
hang
e
2000 2010 Current
Renter Owner
50,000
45,000
40,000
35,000
30,000
25,000
20,000
15,000
10,000
5,000
0

La
red
o,
TX
• C
OM
PR
EH
EN
SIV
E H
OU
SIN
G M
AR
KE
T A
NA
LYS
IS
8Housing Market Trends
Sales Market
The sales housing market in the Laredo HMA is currently balanced. The sales vacancy rate is estimated at 1.4 percent, down from 1.9 percent in April 2010. The number of new homes sold (including single-family homes, townhomes, and condomini-ums) during the 12 months ending January 2015 totaled 510, down 9 per - cent from the nearly 560 homes sold during the 12 months ending January 2014 (Metrostudy, A Hanley Wood Company). New home sales are down 67 percent from the peak average of 1,580 sold annually during 2006 and 2007 and remain 31 percent less than the average of 640 homes sold annually from 2008 through 2012. The average sales price of a new home was $199,500 during the 12 months ending January 2015, up $8,700, or nearly 5 percent, compared with the sales price a year earlier. By comparison, the average sales price of new homes peaked at $203,400 during 2006 and 2007.
Existing home sales totaled 2,200 during the 12 months ending January 2015, an increase of slightly less than 1 percent compared with sales during the 12 months ending January 2014. Existing home sales are 24 percent less than the peak of 2,900 homes sold annually during 2005 and 2006 but are slightly more than the average of 1,725 homes sold from 2008 through 2012. The average sales price of an existing home was $153,300 during the 12 months ending January 2015, up $2,375, or more than 1 percent, compared with the sales price during the 12 months ending January 2014.
For the 12 months ending January 2015, real estate owned (REO) prop - erty sales totaled 350, or less than 12 percent of all home sales in the
HMA, which is down from the 440 REO sales during the 12 months end - ing January 2014, when REO sales accounted for 14 percent of all existing single-family home sales. During 2005 and 2006, before the housing downturn, REO sales averaged 130 annually and accounted for approximately 3 percent of all home sales. The average sales price of an REO home is less than the average sales price of a non-REO home in the HMA, and the high per - centage of REO sales, relative to recent history, continues to negatively affect existing single-family sales prices. The average sales price of an REO home was $115,600 during the 12 months ending January 2015, which is down more than 2 percent from $118,500 for the 12 months ending January 2014. The number of home loans in the Laredo HMA that were seriously de-linquent (90 or more days delinquent or in foreclosure) or had transitioned into REO status decreased to 4.9 per - cent of total loans in January 2015, down from 5.2 percent in January 2014 (Black Knight Financial Services, Inc.). The current percentage of seriously delinquent loans and REO properties in the HMA compares with 3.7 per-cent in Texas, 4.5 percent nationally, and a local peak of 10.1 percent in January 2010.
Single-family homebuilding activity, as measured by the number of single- family homes permitted, has increased each year since 2011 but remains be-low prerecession levels. The number of single-family homes permitted during the 12 months ending January 2015 increased by 50, or 5 percent, to 960 single-family homes compared with the number of homes permitted during the 12 months ending January
La
red
o,
TX
• C
OM
PR
EH
EN
SIV
E H
OU
SIN
G M
AR
KE
T A
NA
LYS
IS
9
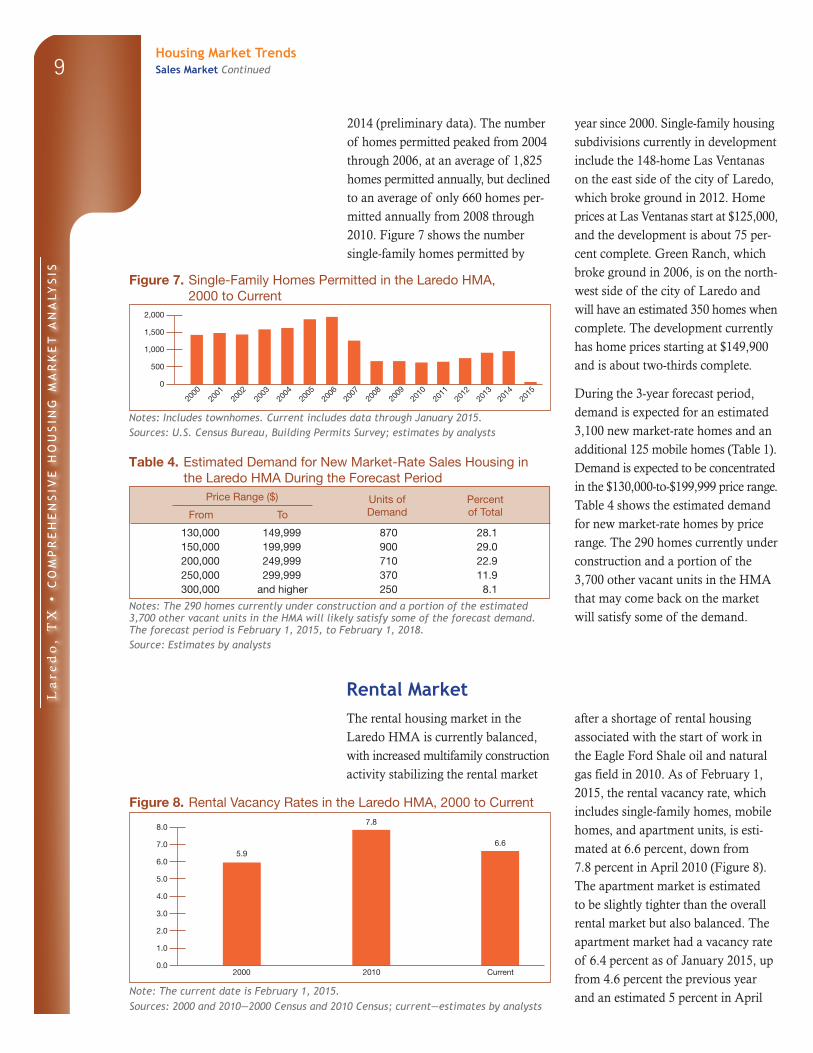
2014 (preliminary data). The number of homes permitted peaked from 2004 through 2006, at an average of 1,825 homes permitted annually, but declined to an average of only 660 homes per-mitted annually from 2008 through 2010. Figure 7 shows the number single-family homes permitted by
year since 2000. Single-family housing subdivisions currently in development include the 148-home Las Ventanas on the east side of the city of Laredo, which broke ground in 2012. Home prices at Las Ventanas start at $125,000, and the development is about 75 per - cent complete. Green Ranch, which broke ground in 2006, is on the north - west side of the city of Laredo and will have an estimated 350 homes when complete. The development currently has home prices starting at $149,900 and is about two-thirds complete.
During the 3-year forecast period, demand is expected for an estimated 3,100 new market-rate homes and an additional 125 mobile homes (Table 1). Demand is expected to be concentrated in the $130,000-to-$199,999 price range. Table 4 shows the estimated demand for new market-rate homes by price range. The 290 homes currently under construction and a portion of the 3,700 other vacant units in the HMA that may come back on the market will satisfy some of the demand.
Figure 7. Single-Family Homes Permitted in the Laredo HMA, 2000 to Current
Notes: Includes townhomes. Current includes data through January 2015.Sources: U.S. Census Bureau, Building Permits Survey; estimates by analysts
Table 4. Estimated Demand for New Market-Rate Sales Housing in the Laredo HMA During the Forecast Period
Price Range ($) Units of PercentFrom To Demand of Total
130,000 149,999 870 28.1150,000 199,999 900 29.0200,000 249,999 710 22.9250,000 299,999 370 11.9300,000 and higher 250 8.1
Notes: The 290 homes currently under construction and a portion of the estimated 3,700 other vacant units in the HMA will likely satisfy some of the forecast demand. The forecast period is February 1, 2015, to February 1, 2018.Source: Estimates by analysts
Rental MarketThe rental housing market in the Laredo HMA is currently balanced, with increased multifamily construction activity stabilizing the rental market
after a shortage of rental housing associated with the start of work in the Eagle Ford Shale oil and natural gas field in 2010. As of February 1, 2015, the rental vacancy rate, which includes single-family homes, mobile homes, and apartment units, is esti - mated at 6.6 percent, down from 7.8 percent in April 2010 (Figure 8). The apartment market is estimated to be slightly tighter than the overall rental market but also balanced. The apartment market had a vacancy rate of 6.4 percent as of January 2015, up from 4.6 percent the previous year and an estimated 5 percent in April
Figure 8. Rental Vacancy Rates in the Laredo HMA, 2000 to Current
Note: The current date is February 1, 2015.Sources: 2000 and 2010—2000 Census and 2010 Census; current—estimates by analysts
Housing Market TrendsSales Market Continued
2000
2001
2002
2003
2004
2005
2006
2,000
1,500
1,000
500
0
2008
2009
2010
2011
2013
2015
2014
2012
2007
2000 Current2010
5.96.6
7.88.0
7.0
6.0
5.0
4.0
3.0
2.0
1.0
0.0

La
red
o,
TX
• C
OM
PR
EH
EN
SIV
E H
OU
SIN
G M
AR
KE
T A
NA
LYS
IS
10
2010 (Reis, Inc.). During January 2015, apartment rents averaged $672, $823, and $1,009 for one-, two-, and three-bedroom units, respectively. Rent increases have averaged $40, $20, and $45, or 6, 3, and 5 percent, annually for one-, two-, and three-bedroom units, respectively, since 2010.
Beginning in late 2010, the overall rental market tightened significantly in response to the influx of workers into the Eagle Ford Shale area. The oil and natural gas field workers moved into the HMA fairly quickly and absorbed many of the available units, and no immediate increase in the number of available rental housing units was made to meet this demand; therefore, vacancy rates dropped and rents rose. Development of new rental units, which began in late 2011, began to balance the market, however. Dur - ing the first quarter of 2013, when the rental market is estimated to have been the tightest, the apartment vacancy rate was 3.3 percent. A common sched - ule for workers in the Eagle Ford Shale consists of working for 3 weeks straight, followed by 2 weeks off. The individ-uals, or sometimes the firms they work for, lease housing units in the area. The workers are not considered residents because it is likely that they will return to their permanent place of residence
when they are not working. Such workers are not included in the popu-lation or resident employment counts in the HMA, but they may be counted as being at the location of a regional office. Although these employees do not establish a permanent residence in the HMA, they have a significant effect on its rental housing market.
Multifamily development has increased substantially since the late 2000s and remains at record-high levels. During the 12 months ending January 2015, 1,125 multifamily units were permitted, up 47 percent from 760 units permit-ted during the previous 12 months, all intended for renter occupancy (prelimi - nary data). The rate of building activ-ity in 2014 was nearly double the 575 multifamily units permitted in 2004, which was the prerecession peak year for multifamily units permitted (Fig-ure 9). From 2004 through 2008, the number of multifamily units permit-ted averaged 430 a year. The number declined to an average of only 95 multi family units permitted annually during 2009 and 2010. An average of 740 multifamily units were permitted each year from 2011 through 2014.
Two developments currently under construction in the HMA are Cibolo Crossing Apartments and River Bank Crossing Apartments. The Cibolo Crossing Apartments is a 236-unit development consisting of one-, two-, and three-bedroom units with rents ranging from $850 to $1,675. River Bank Crossing Apartments is a 152- unit development consisting of one-, two-, and three-bedroom units with rents ranging from $800 to $1,175. Both projects are expected to be com - plete by the end of 2015.
Figure 9. Multifamily Units Permitted in the Laredo HMA, 2000 to Current
Notes: Excludes townhomes. Current includes data through January 2015.Sources: U.S. Census Bureau, Building Permits Survey; estimates by analysts
Housing Market TrendsRental Market Continued
2000
2001
2002
2003
2004
2005
2006
1,200
1,000
800
600
400
200
0
2008
2009
2010
2011
2013
2015
2014
2012
2007

La
red
o,
TX
• C
OM
PR
EH
EN
SIV
E H
OU
SIN
G M
AR
KE
T A
NA
LYS
IS
11
Demand for an estimated 1,300 new rental units is expected during the 3-year forecast period (Table 1). The 1,000 units currently under construc-tion will meet most of this demand; most of the units are expected to be
complete during the first year of the forecast period. Demand is expected to be strongest for one-bedroom units with gross monthly rents ranging from $800 to $999 (Table 5).
Table 5. Estimated Demand for New Market-Rate Rental Housing in the Laredo HMA During the Forecast Period
Zero Bedrooms One Bedroom Two Bedrooms Three or More Bedrooms
Monthly Gross Rent ($)
Units of Demand
Monthly Gross Rent ($)
Units of Demand
Monthly Gross Rent ($)
Units of Demand
Monthly Gross Rent ($)
Units of Demand
650 or more 30 800 to 999 640 1,000 to 1,199 360 1,180 to 1,379 501,000 to 1,199 75 1,200 to 1,399 70 1,380 or more 15
0 1,200 or more 40 1,400 or more 25Total 25 Total 750 Total 450 Total 65
Notes: Numbers may not add to totals because of rounding. The 1,000 units currently under construction will likely satisfy some of the estimated demand. The forecast period is February 1, 2015, to February 1, 2018.Source: Estimates by analysts
Data Profile
Table DP-1. Laredo HMA Data Profile, 2000 to Current
Average Annual Change (%)
2000 2010 Current 2000 to 2010 2010 to Current
Total resident employment 66,705 96,364 106,400 3.7 2.5
Unemployment rate 6.0% 8.2% 5.0%
Nonfarm payroll jobs 68,900 88,700 98,500 2.6 2.6
Total population 193,117 250,304 268,700 2.6 1.5
Total households 50,740 67,106 73,100 2.8 1.8
Owner households 33,322 43,286 45,350 2.7 1.0
Percent owner 65.7% 64.5% 62.0%
Renter households 17,418 23,820 27,750 3.2 3.2
Percent renter 34.3% 35.5% 38.0%
Total housing units 55,206 73,496 79,400 2.9 1.6
Owner vacancy rate 1.4% 1.9% 1.4%
Rental vacancy rate 5.9% 7.8% 6.6%
Median Family Income $29,394 $39,280 $42,773 2.9 2.2
Notes: Numbers may not add to totals because of rounding. Employment data represent annual averages for 2000, 2010, and the 12 months through January 2015. Median Family Incomes are for 1999, 2009, and 2013. The current date is Fabruary 1, 2015.Sources: U.S. Census Bureau; U.S. Department of Housing and Urban Development; estimates by analysts
Housing Market TrendsRental Market Continued

La
red
o,
TX
• C
OM
PR
EH
EN
SIV
E H
OU
SIN
G M
AR
KE
T A
NA
LYS
IS
12
Data Definitions and Sources
2000: 4/1/2000—U.S. Decennial Census
2010: 4/1/2010—U.S. Decennial Census
Current date: 2/1/2015—Analysts’ estimates
Forecast period: 2/1/2015–2/1/2018—Analysts’
estimates
The metropolitan statistical area definition in this
report is based on the delineations established by
the Office of Management and Budget (OMB) in
the OMB Bulletin dated February 28, 2013.
Demand: The demand estimates in the analysis
are not a forecast of building activity. They are
the estimates of the total housing production
needed to achieve a balanced market at the end
of the 3-year forecast period given conditions on
the as-of date of the analysis, growth, losses, and
excess vacancies. The estimates do not account
for units currently under construction or units in
the development pipeline.
Other Vacant Units: In the U.S. Department of
Housing and Urban Development’s (HUD’s)
analysis, other vacant units include all vacant
units that are not available for sale or for rent.
The term therefore includes units rented or sold
but not occupied; held for seasonal, recreational,
or occasional use; used by migrant workers; and
the category specified as “other” vacant by the
Census Bureau.
Building Permits: Building permits do not neces-
sarily reflect all residential building activity that
occurs in an HMA. Some units are constructed
or created without a building permit or are issued
a different type of building permit. For example,
some units classified as commercial structures are
not reflected in the residential building permits.
As a result, the analysts, through diligent fieldwork,
make an estimate of this additional construction activity.
Some
of these estimates are included in the discussions of
single-family and multifamily building permits.
For additional data pertaining to the housing market
for this HMA, go to huduser.gov/publications/pdf/
CMARtables_LaredoTX_15.pdf.
Contact Information
EMAD Staff
Fort Worth HUD Regional Office
817–978–9414
This analysis has been prepared for the assistance and
guidance of HUD in its operations. The factual informa-
tion, findings, and conclusions may also be useful to
builders, mortgagees, and others concerned with local
housing market conditions and trends. The analysis
does not purport to make determinations regarding the
acceptability of any mortgage insurance proposals that
may be under consideration by the Department.
The factual framework for this analysis follows the
guidelines and methods developed by HUD’s Economic
and Market Analysis Division. The analysis and findings
are as thorough and current as possible based on informa -
tion available on the as-of date from local and national
sources. As such, findings or conclusions may be modi-
fied by subsequent developments. HUD expresses its
appreciation to those industry sources and state and local
government officials who provided data and information
on local economic and housing market conditions.
For additional reports on other market areas, please go to huduser.gov/portal/ushmc/chma_archive.html.