comprehensive high resolution photoelectron spectra of metal carbonyls using synchrotron radiation
TRANSCRIPT
3716 Inorg. Chem. 1995,34, 3716-3723
Comprehensive High Resolution Photoelectron Spectra of Metal Carbonyls Using Synchrotron Radiation
Yong-Feng Hu, G. Michael Bancroft,* Zhifeng Liu, and Kim H. Tan
Department of Chemistry, University of Western Ontario, London, Ontario, Canada N6A 5B7, and the Canadian Synchrotron Radiation Facility, University of Wisconsin-Madison, Stoughton, Wisconsin 53589
Received October 26, 1994@
High resolution variable energy photoelectron spectra using synchrotron radiation, of valence, inner valence, and core levels of gas phase heavy metal carbonyl compounds [e.g. W(CO)6, Re(C0)5X (X = C1, Br, Re(CO)5] are reported. The high resolution (0.1 eV) metal 4f core level spectra show, for the first time, vibrational splitting. In addition, ligand field broadening is shown to be an important contributor to the 4f linewidth, especially for Os(CO)5. The greatly improved resolution also provides much narrower 4f shake-up peaks in W(CO)6 than have been observed with laboratory X-ray sources. The complete inner valence spectra are interpreted using the inner valence spectrum of CO and the only previously reported complete inner valence spectrum of a metal carbonyl [Cr(C0)6]. The variable energy of synchrotron radiation is especially important for assigning the valence metal d orbitals [in, for example, CpM(CO)3, M = Mn, Re] using the enhancement of metal d cross sections after the excitation of the core p orbitals.
Introduction
Up until about 1990, photoelectron spectroscopy of gas phase inorganic and organometallic compounds had been divided into the two traditional photoelectron areas: first, low resolution (> 1 eV)'s2 and medium resolution (-0.5 eV)'%3 studies of core levels using nonmonochromatized Mg K a and A1 K a sources and monochromatized Al K a sources respectively; and second, high resolution (-20 meV with He I and He I1 sources, and 2200 meV with synchrotron radiation sources) of valence levels,4s5 including several variable energy studies of inorganic6 and organometallic7 compounds.
The high resolution valence level photoelectron studies have been perhaps the most direct technique for characterization of the MO levels of organometallic compounds since the first He
* To whom correspondence should be addressed at the University of
@ Abstract published in Advance ACS Abstracts, June 15, 1995. Westem Ontario.
(1) Jolly, W. L.; Bomben, K. D.; Eyemann, C. J. At. Data Nucl. Data Tables 1984, 90, 433.
(2) Siegbahn, K.; Nordling, C.; Johansson, J.; Hedman, J.; Heden, P. F.; Hamrin, K. ; Gelius, U.; Bergmark, T.; Werme, L. 0.; Manne, R.; Baer, Y. ESCA Applied to Free Molecules; North-Holland: Amsterdam, 1969.
(3) (a) Gelius, U. J . Elect. Spec?. Relat. Phenom. 1974, 5, 985. (b) Bancroft, G. M.; Malmquist, P.-A,; Svensson, S . : Basilier, E.; Gelius, U.; Siegbahn, K. Inorg. Chem. 1978, 11, 1595.
(4) (a) Cowley, A. H. Prog. Inorg. Chem. 1979, 26, 46. (b) Green, J. C. Struct. Bonding (Berlin) 1981, 43, 37.
(5) Lichtenberger, D. L.; Kellogg, G. E. Acc. Chem. Res. 1987, 20, 379. (6) For example, (a) Yates, B. W.; Tan, K. H.; Bancroft, G. M.;
Coatsworth, L. L.; Tse, J. S. J . Chem. Phys. 1985,83,4906. (b) Yates, B. W.; Tan, K. H.; Bancroft, G. M.; Coatsworth, L. L.; Tse, J. S.; Schrobilgen, G. J. J . Chem. Phys. 1986,84,3603. (c) Addison-Jones, B. M.; Tan, K. H.; Yates, B. W.; Cutler, J. N.; Bancroft, G. M.; Tse, J. S . J . Electron. Saecrrosc. Relat. Phenom. 1989.48. 155. (d) Bozek. J. D.; Cutler, J. N.; Bancroft, G. M.; Tan, K. H.; Yates, B: W.; Tse, J. S. Chem. Phys. 1989, 132, 257.
(7) (a) Green, J. C. Acc. Chem. Res. 1994,27, 131. (b) Cooper, G.; Green, J. C.; Payne, M. P.; Dobson, P. R.; Hillier, I. H. J . Am. Chem. Soc. 1987, 109, 3836. (c) Brennan, J. G.; Green, J. C.; Redfem, C. M. J . Am. Chem. SOC. 1989, 111, 1989. (d) Brennan, J. G.; Cooper, G.; Green, J. C.; Kaltsoyannis, N.; MacDonald, M. A,; Payne, M. P.; Redfem, C. M.: Sze, K. H. Chem. Phys. 1992, 64, 271.
0020-1669/95/1334-37 16$09.00/0
I studies of Ni(C0)4, Fe(C0)5, and Mn(C0)sX complexes in 1969.8 Variable energy spectra of organometallic c ~ m p l e x e s ~ . ~ give an especially powerful tool for determining the MO levels (using the variable cross sections and resonances at the core p levels7), especially when combined with MS -Xa cross section calculation^.^
Up until 1990, there were no reports of high resolution (-0.1 eV) photoelectron spectra of inner valence or core levels of any inorganic or organometallic molecules. In the last few years, high resolution synchrotron radiation has made it possible to obtain high resolution core level spectra of Si, S, Ge, Sn, I, and Br inorganic molecules,'O but no high resolution core level spectra of organometallic molecules had been obtained until our preliminary report.'' Also, in the inner valence region, mainly because of the low intensity, only one medium resolution inner valence X-ray spectrum of one organometallic molecule Cr- (CO)6 has been obtained.I2
(8) (a) Lloyd, D. R.; Schlag, E. W. Inorg. Chem. 1969,8,2544. (b) Evans, S . ; Green, J. C.; Green, M. L. H.; Orchard, A. F.; Turner, D. W. Discuss. Faraday SOC. 1969, 47, 112.
(9) (a) Yang, D. S.; Bancroft, G. M.; Puddephatt, R. J.; Tan, K. H.; Cutler, J. N.; Bozek, J. D. Inorg. Chem. 1990,29,4956. (b) Li, X.; Bancroft, G. M.; Puddephatt, R. J.; Hu, Y. F.; Liu, Z. F.; Tan, K. H. Inorg. Chem. 1992, 31, 5162. (c) Li, X.; Bancroft, G. M.; Puddephatt, R. J.; Hu, Y. F.; Liu, Z. F.; Sutherland, D. G. J.; Tan, K. H. J . Chem. SOC., Chem. Commun. 1993, 67. (d) Li, X.; Bancroft, G. M.; Puddephatt, R. J.: Liu, Z. F.; Hu, Y. F.; Tan, K. H. J . Am. Chem. SOC. 1994, 116, 9543.
(10) (a) Bozek, J. D.; Cutler, J. N.; Bancroft, G. M.; Coatsworth, L. L.; Tan, K. H.; Yang, D. S.; Cavell, R. G. Chem. Phys. Lett. 1990, 165. 1. (b) Sutherland, D. G. J.; Bancroft, G. M.; Tan, K. H. J . Chem. Phys. 1992, 97, 7918. (c) Cutler, J. N.; Bancroft, G. M.; Tan, K. H. J . Chem. Phys. 1992, 97, 7932. (d) Sutherland, D. G. J.; Bancroft, G. M.; Liu, 2. F. Nucl. Inst. Methods B 1994, 87, 183. (e) Cutler, J. N.; Bancroft, G. M.; Tan, K. H. Chem. Phys. 1994, 181, 461. (0 Sveqsson, S.; Ausmees, A,; Osbome, S . J.; Bray, G.; Gel'mukhanov. F.; Agren, H.; Naves de Brito, A,; Sairanen, 0.-P.: KivimXki, A,; N6mmiste, E.; Aksela, H.; Aksela, S . Phys. Rev. Lett. 1994, 72, 3021.
(1 1) Hu, Y. F.; Bancroft, G. M.; Bozek, J. D.; Liu, Z. F.; Sutherland, D. G. J.; Tan, K. H. J . Chem. Soc., Chem. Commun. 1992, 1276.
(12) Nilsson, A.; Mipensson, N.; Svensson, S.; Karlsson, L.: Nordfors, D.; Gelius, U.; Agren, H. J. Chem. Phys. 1992, 96, 8770.
0 1995 American Chemical Society
Spectra of Metal Carbonyls
In this paper, we use monochromatized synchrotron radiation and our newly developed photoelectron s p e ~ t r o m e t e r ~ ~ ~ ' ~ to obtain high resolution valence, inner valence, and core level spectra of organometallic compounds. We have two major objectives. First, we wanted to demonstrate the importance of the high resolution and high intensity of synchrotron radiation to obtain, for the first time, high resolution (-0.1 eV) inner valence and core level spectra of organometallics. The high resolutiodintensity is critical for resolving and clarifying features in both inner valence and core level spectra. Second, we wanted to emphasize the importance of the tunability of synchrotron radiation to enhance specific core level cross sections and for studying resonances in valence band cross section^.^
Experimental Section
All the samples with the exception of O s ( c 0 ) ~ were commercially obtained and used directly without further purification. Os(CO), was prepared by R. K. Pomeroy by methods described e1~ewhere.l~
All the spectra were obtained with the Grasshopper beamline at the Canadian Synchrotron Radiation Facility (CSRF) which is located at the Aladdin storage ring, University of Wi~consin-Madison.~~ A 1800 g/mm grating gave photon energies between 70-200 eV, and a 600 g/mm grating gave photon energies between 22-72 eV. The perfor- mance of the ESCA 36 photoelectron spectrometer has been discussed previously.I0 Typically, the photon resolution was 30 meV at 40 eV and 60 meV at 80 eV, while the total instrumental resolution was 60 meV at 40 eV and 100 meV at 80 eV photon energies. For the broad- scan spectra spanning 40-50 eV reported in the present paper, the instrumental resolution at 70 eV photon energy can be calculated as 170 meV (photon slit width at 50pm). In order to enhance the intensity of the signal and so minimize the experimental time, a Quantar Model 3395A position sensitive detector (PSD) was used in this study.13 By using the PSD, the count rate can be increased by 20-50 times over our previous channeltron system.I0 This high intensity is critical to our inner valence study here, because the inner valence levels have low cross section and are very broad.
The calibration of the spectra was carried out as follows: first, the He I spectra of samples were obtained by our laboratory McPherson ESCA 36 photoelectron spectrometer calibrated with the Ar 2p3/2 at a binding energy (BE) of 15.759 eV; then, the spectra at higher photon energies were calibrated using the Xe 5s at a BE of 23.397 eV with the 600 g/mm grating and by Kr 3d512 at a BE of 93.795 eV with an 1800 g/mm grating. The binding energies are accurate to within 50.01 eV.
All the solid samples were introduced into the gas cell of the spectrometer directly via the heatable probe. The less volatile samples required heating at the temperatures ranging from 40 to 110 O C in order to generate enough vapor pressure. Os(C0)s is very volatile, so it was kept under ice water and leaked into the gas cell. The pressure in the sample chamber is controlled around 4 x Torr, while the pressure in the gas cell was -5 x low3 Torr.
Spectra were deconvoluted with a Gaussian-Lorentzian line shape using a nonlinear least-squares procedure described previously.16
Results and Discussion
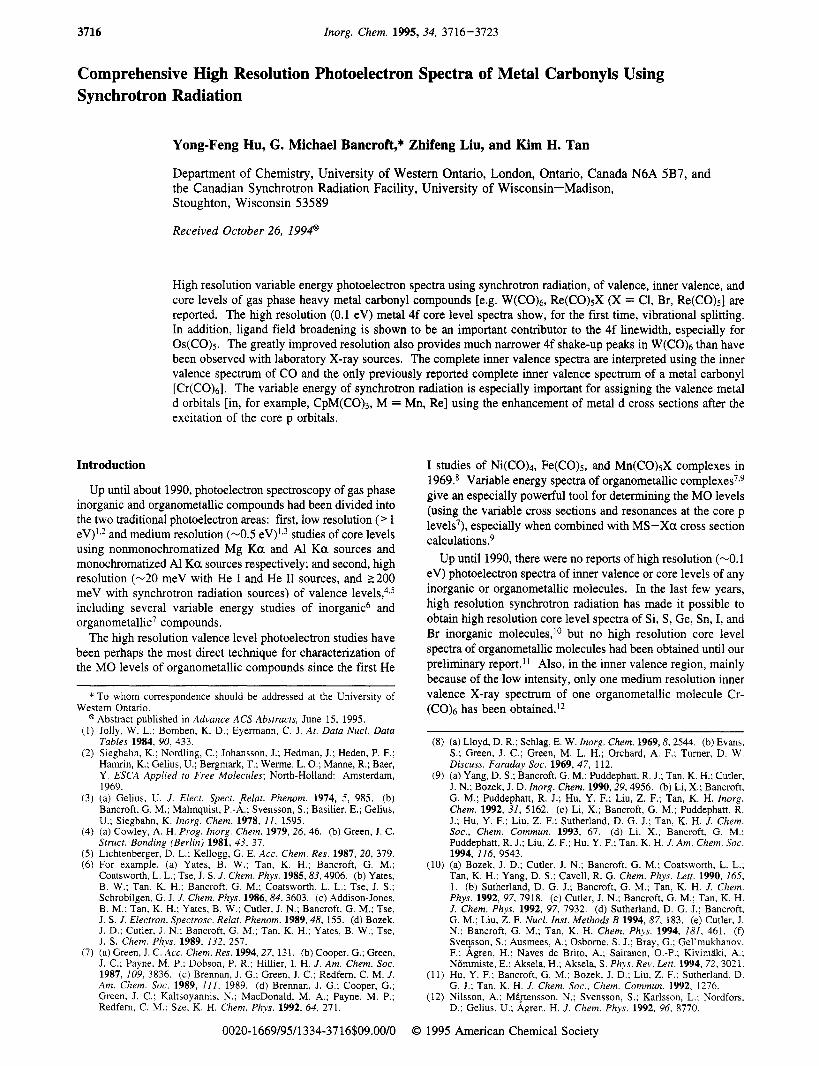
A. General Features and Inner Valence Assignments. (a) W(CO)6. The high resolution broad-scan spectrum of W(CO)6 at 80 eV photon energy is illustrated in Figure 1. Peak positions and assignments are given in Table 1. The spectrum in Figure 1 was taken at a total resolution of 10.2 eV; while the spectrum in the insert was taken at a total resolution of '0.1 eV. These
Inorganic Chemistry, Vol. 34, No. 14, 1995 3717
(13) Liu. 2. F.: Bancroft. G. M.: Coatsworth. L. L.: Tan. K. H. Chem. . , , , ,
Phys. Lett.' 1993, 203, 331. (14) Rushman, P.; van Buuren, G. N.; Shiralian, M.; Pomerov, R, K.
Organometallics 1983, 2, 693.
Phys. 1982, 60, 131.
Brown, J. D.; Westwood, W. D. Anal. Chem. 1975, 47, 586.
(15) Tan, K. H.; Bancroft, G. M.; Coatsworth, L. L.; Yates, B. W. Can. J .
(16) Bancroft, G. M.; Adams, I.; Coatsworth, L. L.; Bennewitz, C. D.;
I I I I
40.0 30.0 20.0 10.0
Binding Energy (eV) Figure 1. High resolution broad-scan photoelectron spectrum of W(CO)6 at 80 eV photon energy. The valence level peaks are labeled with the numbers (1-7) in an increasing binding energy. Peak S is assigned to a shake-up peak (see text). The inner-valence peaks are labeled with letters (A-D). The three core level peaks are labeled with C1, CZ and C3, respectively. The insert spectrum is taken at 40 eV photon energy, which resolves peak 6' between peak 6 and peak 7.
Table 1. Binding Energies, Widths, and the Assignments of W(CO)6 at a Total Resolution of 50.2 eVa
peak binding width label energy (eV) (eV) majority character MO
1 8.57 0.57 W 5d and CO 2 n 2t2, 2 13.38 0.66 CO l n a n d 5 a 8t1, 3 14.21 0.66 CO In and 5 0 ltl,, 1t2" 4 14.83 0.65 CO h a n d 5 0 5e, 5 15.42 1.20 CO I n and 5 0 7t1,, lt2,, 8a1, 6 17.63 0.46 CO 4 0 6t1u 6' 18.06 0.47 CO 40 4% 7 18.52 0.46 C 0 4 0 7a1, S 20.06 2.90 shake-up A 23.63 2.23 satellite 1 B 27.06 2.15 satellite 2 C 30.34 2.86 satellite 3 D 35.29 4.29 CO 30 CI 37.98 c2 40.16
0.37 W 4f712 0.37 W 4fy2
c3 43.85 2.28 W 5~312
The positions and widths of peaks 6, 6', and 7 are taken from the insert spectrum in Figure 1.
spectra can be divided into the three traditional regions: valence or outer valence levels with BE less than -20 eV (labeled with the numbers 1-7 and S); inner valence levels with BE between -20 and -40 eV (labeled with A-D); and the core levels CI , C2, C3 with BE - 40 eV. All features are immediately seen in one spectrum: the intense, relatively narrow valence bands (except for the very broad peak S); the weak, broad inner valence bands; and both very narrow core levels (Cl and C2) and a weak, broad core level (C3). The resolution of the valence band spectrum at 40 eV photon energy (insert) is much better than the previously published He I1 spectrum which gives peaks up to 24 eV BE (Figure 2 in ref 17a) but slightly poorer than the previous He I spectra up to 16 eV BE. For example, our high resolution spectrum (insert) readily shows three peaks in the -18 eV band which were not seen previously in the He I1 spectrum.'7a This observation is important for the complete assignment. The inner valence peaks above 24 eV have not been observed previously, the W 4f peaks (Cl and Cz) have
(17) (a) Higginson, B.; Lloyd, D. R.; Burroughs, P.; Gibson, D. M.; Orchard, A. F. J . Chem. SOC., Faraday Trans. 2 1973,69, 1659. (b) Hubbard, J. L.; Lichtenberger, D. L. J . Am. Chem. SOC. 1982, 104, 2132.

3718 Inorganic Chemistry, Vol. 34, No. 14, 1995
been observed previously at low resolution,I8 but the broad core level peak C3 has not been previously observed.
The assignment of the valence band spectrum up to 16 eV (Table 1) follows exactly from that of Higginson et al.,17a and requires little comment. Peaks 1 is broadened by the spin-orbit split W 5d t2, ionizations. Vibrational structure has also been observed with He I The next four peaks (2-5) arise from seven MO’s of mainly CO I n and 5 0 character (Table 1). Our BE values are in excellent agreement with the previous He I results.””
The assignments of the peaks at -18 and 20 eV are not at all straightforward, but our spectra put the assignment on a very firm footing. Our assignment requires the He III8 and X-ray spectrumI2 of Cr(C0)6 in this BE region; the core-level shake- up spectra of C03a and W(CO)6,I9 the inner valence spectrum of C0,20 and theoretical calculations.2’ The resolution of the band at -18 eV into three peaks of intensity --3:2:1 confirms that these peaks are due to the 6tl,, 4e,, and 7a1, orbitals of CO 40 character; while the peak at 20 eV must be due to an intense shape-up peak from the 5 0 and In CO orbitals around 15 eV BE. This assignment agrees with the previous assignment given by Plummer et aLI8 for the analogous molecule Cr(C0)6. However, our assignment is contrary to that given originally by Higginson et al.17a for W(CO)6 and very recently by Nilson et al. for Cr(C0)6.I2 They assigned the unresolved band at -18 eV (peaks 6, 6‘, 7) to the combined 4e, and 6t1, ionizations, and the broad band at 20 eV to the 7a1, ionization. Our assignment is strongly supported by several theoretical and experimental findings. First, theoretical calculations2’ show that the splitting of the majority 40 levels should be I 1 eV as in our assignment. Second, the intensity and width of peak S is not consistent with the ionization from a nondegenerate a’, orbital. For example, peak S is more intense than peaks 6, 6‘, and 7 at all photon energies studied between 40 and 90 eV; whereas, the Gelius intensity treatment3a certainly predicts that the 4alg intensity should be -33% of the 6t1, intensity, as for our assignment. We have shown in previous s t ~ d i e s ~ . ~ ~ that the Gelius treatment works well down to photon energies of -50 eV.M,9d Third, our fit of the insert spectrum in Figure 1 yields a ratio of intensities for peaks 6, 6’, 7, and S of 1:2.5: 3.8: 10, consistent with our assignment. Also, the separation between peaks 6, 6’, and 7 (-0.4 eV, Table 1) is too large to be of vibrational origin. Fourth, the intensity of peak S is consistent with that expected for a shake-up peak of peaks 2-5, as suggested by Plummer et al. for Cr(C0)6.I8 The core level spectra (C 1s and 0 1s) of the M(CO)6 compounds (M = Cr, Mo, W) give very intense shake-ups (-30% of the intensity of the “main” line) -5 eV from the main line.’8,19 The intensity of peak S is about 35-40% of the intensity of peaks 2-5 over the photon energy range 40-90 eV. This large shake-up intensity in metal carbonyls contrasts with the very low shake- up intensity (-3%) in CO on both the C 1s core and valence shake-ups at 21 eV BE (our unpublished results). In CO, the 21 eV shake-up peak is not observable with the medium resolution X-rayi2 or synchrotron spectra.20 These results show
Hu et al.
Rajoria, D. S.; Kovnat. L.; Plummer, E. W.; Salaneck, W. R. Chem. Phys. Lett. 1977, 49, 64. (a) Bancroft, G. M.; Boyd, B. D.; Creber, D. K. Inorg. Chem. 1978, 17, 1008. (a) Krummacher, S.; Schmidt, V.; Wuilleumier, F.; Bizau, J. M.; Edderer, D. J . Phys. B: At. Mol. Phys. 1983, Z6, 1733. (b) Svensson, S.; Carlsson-Giithe, M.; Karlsson, L.; Nilsson, A.; Miirtensson, N.; Gelius, U. Phys. Scr. 1991, 44, 184. (a) Ohno, M.; von Niessen, W.; Tarantelli, F. Phys. Rev. B 1992,45, 1851. (b) Johnson, J. B.; Klemperer, W. G. J . Am. Chem. SOC. 1977, 22, 7132. (c) Baerends, E. J.; Ros, P. Mol. Phys. 1975, 30, 1735. (d) Yang, C. Y.; Arratia-Petez, R.; Lopez, J. P. Chem. Phys. Lett. 1984, 107, 112.
stronglyI8 that the shake-up positions and intensities are very similar for both C 1s and 0 1s core levels and valence levels for carbonyl compounds.
The contributions from CO 30 orbital and satellites corre- sponding to the shake-up process from CO 40 and 50 orbitals dominated the inner-valence spectrum of Cr(C0)6.I2 The high resolution inner-valence spectrum of free CO molecule has also been studied re~ent1y.I~ The effects of vibronic coupling and configuration interaction in this region have been clearly resolved. The spectrum of W(CO)6 can be interpreted by comparing our results with those from Cr(C0)6 and free CO. Peak A at 23.63 eV binding energy can be assigned to the so- called C state in free CO with a predominant final 50-’ 1n-12n1 state configuration which can be considered as a normal monopole shake-up state that gains intensity by configuration interaction with the 40-’ state. A similar peak has been observed at 23.7 eV for free C020 and 23 eV binding energy of Cr(C0)6.I2 Peak B is relatively weak at 27.06 eV binding energy. This peak was not resolved in Cr(C0)6 but is evident in free CO at 28.5 eV corresponding to the 4 0 - ’ 1 ~ - ~ 2 d final state. The satellite peak C is associated with the n-2-n2 double shake-up process accompanying the 5 a ionization in free CO, as in the Cr(C0)6.I2 The broad and intense peak D at 35.29 eV arises mainly from the CO 30 orbital. The complete breakdown of the single-particle picture for the 30 ionization has been discussed in the free CO m~lecule , ’~ and the vibrational fine structure has been the focus of these studies. Therefore, these peaks are all very broad with linewidths of 2 2 eV. These fits can only be approximate because many vibronically coupled and correlated states 0ver1ap.I~ Another satellite state has been observed in Cr(C0)6 at 41 eV associated with a shake-up transition from the 30 ionization. Because of the presence of the intense W 4f512 peak at 40.18 eV binding energy, this satellite peak can not be observed in the spectrum of W(CO)6.
The last part of Figure 1 is the core level region and is characterized easily. The first two peaks, CI and C2, can be clearly assigned to the two spin orbit components of W 4f orbital at 37.98 and 40.16 eV binding energy.22 The third peak C3 is the 5~312 level of W at 43.85 eV, At first glance, another possible assignment for this peak is that this peak is the 5~112 level of W, while another spin orbit component 5~312 overlaps with the 30 of CO around 36 eV. However, the 5~112 peak of W at -53 eV can be observed in other spectra taken at higher photon energies, though it is very weak because the W 5p cross section becomes weaker relative to that of W 4f at higher photon energies.23
The measurement of W 5p binding energies can be used to predict at what photon energies the 5p-5d resonance effects7 can be observed (see later). The 5p binding energies of atomic W have been reported to be 41 and 51 eV referenced to the vacuum In the previous synchrotron radiation study of W(CO)6?b the experimental 5p binding energies were not available, but two cross section maxima of the W 5d ionizations were observed around 44 and 53 eV photon energy. Our report of W 5p binding energies agrees well with the previous experimental results, and also confirms our assignment. We will also show in the following discussion how the np binding energies can be used to observe the np - nd resonance effects in CpM(C0)3 complexes.
(b) Re(C0)sX and CpM(C0h Compounds. To further illustrate our comprehensive spectra, Figure 2 shows broad-
(22) Jolly, W. L.; Perry, W. B. Inorg. Chem. 1974, 13, 2686. (23) Yeh, J. J.; Lindau, I. At. Data Nucl. Data Tables 1985, 32, 1. (24) Carlson, T. A. Photoelectron and Auger Spectroscopy; Plenum: New
York, 1975.

Spectra of Metal Carbonyls Inorganic Chemistry, Vol. 34, No. 14, 1995 3719
the metal carbonyls discussed above, these complexes contain carbonyl and cyclopentadienyl ligands which both contribute to the inner-valence region. The valence-only spectra of these complexes have been well studied by the combination of He VHe I1 sources, and CO vibrational fine structure has been observed.26 Our valence peak positions agree with previous studies,26 but our relative intensities are quite different. This is due to the variation of photoionization cross sections of individual orbitals at different photon energies. The resonances of metal nd orbitals of these molecules will be examined in the following section to further explain this feature.
The inner-valence spectra of the CpM(C0)3 complexes have not appeared in the literature before. The key to understanding the inner-valence spectra of these molecules lies in the comparison of our spectra with those of metal carbonyls and (Cp)2M. The valence photoelectron spectra of (Cp)zM (M = Fe, Ru, and Os) have been the subjects of previous studies,27 but only one peak around 19 eV in the inner-valence region of these molecules has been reported to be high carbon 2s character in (Cp)zFe by Green et al.27b The inner-valence spectra of these molecules have the same general features as those of the carbonyls (S, A, B, C, and D; Table 3) and can be assigned identically. However, noticeable differences are seen in the relative intensities of the peaks A, and the peak at -16.5 eV. Both of these peaks must have a substantial contribution from the C 2s on the Cp ring. The remainder of the peaks A-D are at very similar positions to those of the W and Re carbonyls, and can be assigned identically (Table 3).
B. Core Levels. (a) High Resolution Metal Core Level Studies. Up until recently, the major useful core level effect was the chemical shift. However, with high resolution, it has been possible to resolve vibrational and ligand field splittings on the p and d levels of inorganic molecules.I0 We wanted to see whether we could observe such effects on the heavy metal 4f levels. Vibrational splitting has already been observed on the valence W 5d levels in W(CO)6, and on other valence metal d 1 e ~ e l s . I ~ ~
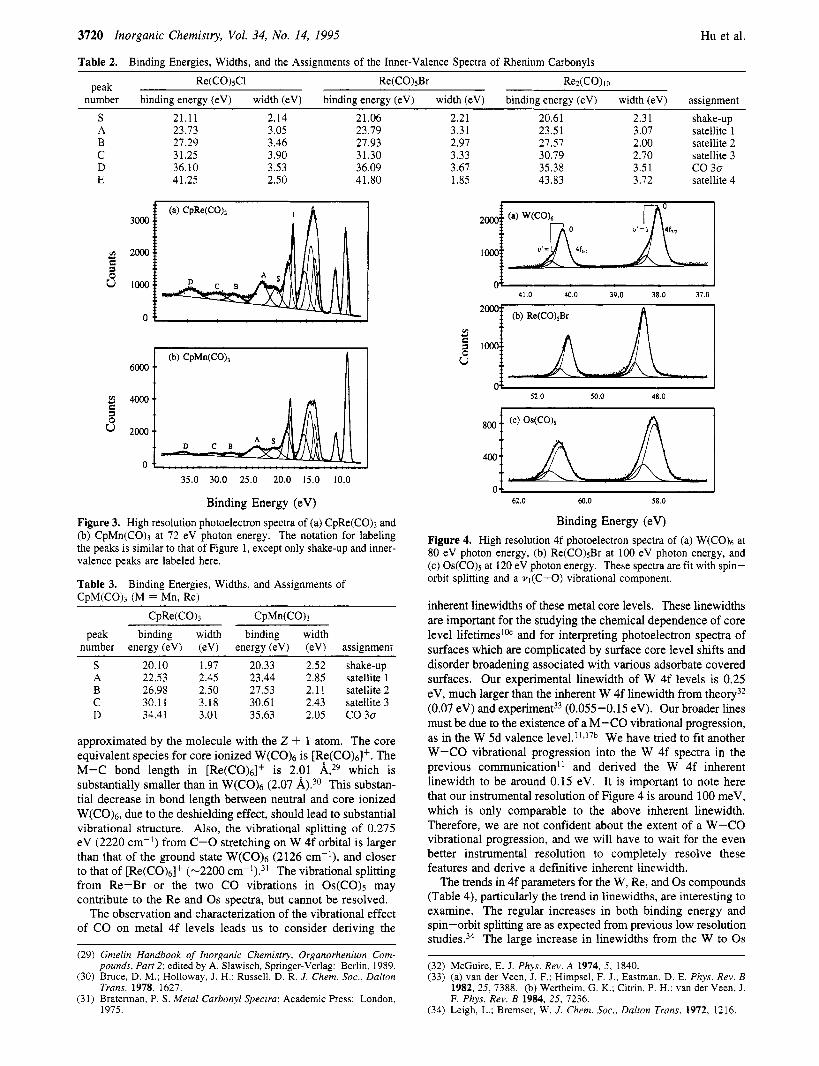
Figure 4 shows the metal 4f spectra of W(CO)6, Re(CO)sBr, and OS(CO)~ at photon energies of 80, 100, and 120 eV, respectively. It should be noted that in the spectrum of Re- (COkBr, there is a small peak (at 49 eV) in the high binding energy side of Re 4f71z peak which is due to the overlap of the Re 5 ~ 3 1 2 ionization (Figure 2). It is necessary to go to 100 eV photon energy to minimize the contribution of 5~312 peak, while maintaining the reasonable resolution from the photon source, in order to resolve the vibrational fine structure. There is a definite shoulder on the higher binding energy side of the 4f levels in W(CO)6 and Re(C0)sBr. The splitting is very similar to the ground state CO stretch. The spectra were fitted with the spin-orbital splitting and the vibrational splitting from CO stretching mode. Table 4 summarizes the fitting parameters of Figure 4. This is the first observation of a ligand vibration effecting a metal core level ionization.
The vibrational effect in the heavy metal 4f spectra is expected after considering the core equivalent In this model, the properties of a molecular ion with a core hole are
2000 $ (a) Re(CO),CI 1 1000
0
50.0 40.0 30.0 20.0 10.0
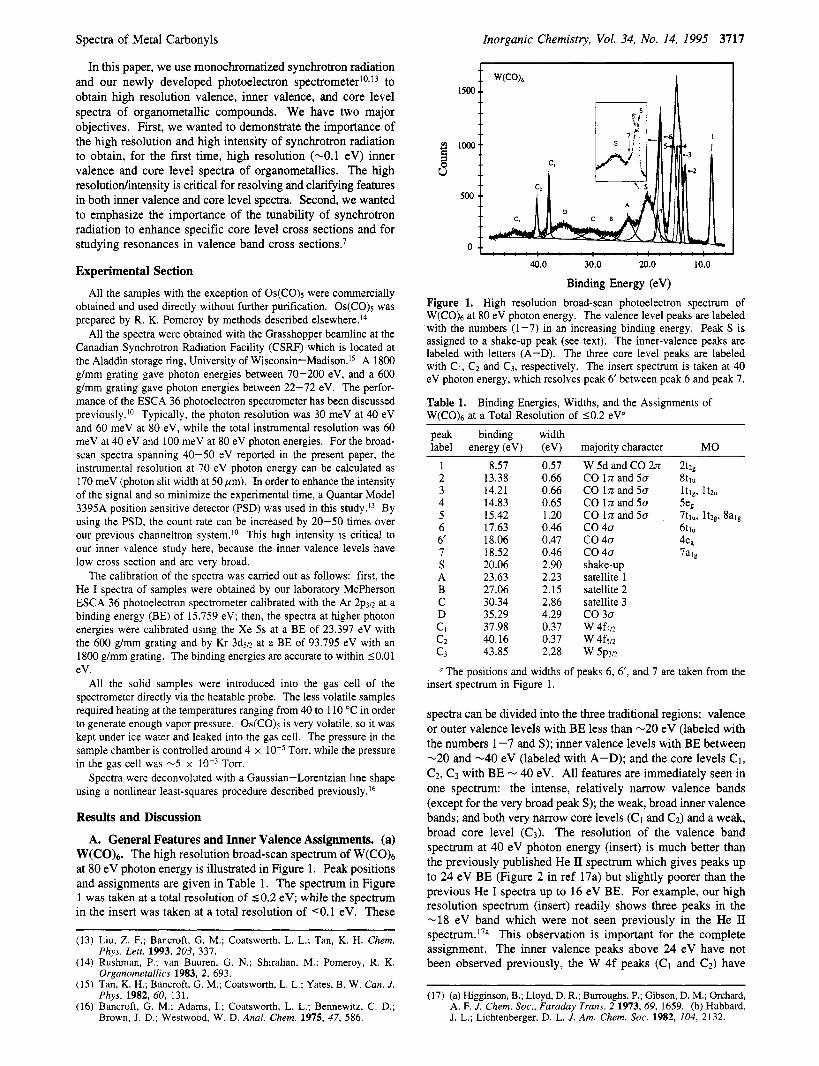
Binding Energy (eV) Figure 2. High resolution broad-scan photoelectron spectra of (a) Re- (C0)sCI at 72 eV photon energy, (b) Re(C0)sBr at 72 eV photon energy, and (c) Rez(CO)lo at 70 eV photon energy. These spectra are labeled identically to Figure 1.
scan spectra of the three Re compounds Re(C0)5Cl, Re(C0)sBr and Rez(C0)lo. Apart from the valence band peaks 1, 2, and 3, these three spectra are remarkably similar qualitatively and can be assigned in a manner very similar to that used for the W(CO)6 spectrum.
The valence band spectra have been obtained previously with He I and He 11 r a d i a t i ~ n , ~ ~ and they have been assigned. We will concentrate only on the peaks above 18 eV that have not been observed previously. As for W(CO)6, the peak at -18.5 eV (peaks 7 and 8) is due to all of the 40 CO ionizations (2a1, b2, and e), and peak S is the shake-up peak from the 50 and 1n ionizations (peaks 4,5, and 6). The inner valence region (peaks A to D) (Table 2) is virtually identical to that of W(CO)6, although another peak E is evident above 40 eV BE. There is no evidence for the C13s or Br 4s ionizations in the Re(C0)5X compounds at about 25 eV, due to their very small cross sections relative to the C 2s and 0 2s cross sections.23 It is also obvious that the Rez(C0)lo spectrum is extremely similar to the other two spectra between 20 and 30 eV, showing once again that the C1 3s and Br 4s levels give no noticeable Contribution. Similar to W(CO)6, the peaks A, B, and C between 23 to 32 eV binding energy can be assigned to shake-up peaks with the final states of 5a-'ln-'2n1, 4a-'ln-'2n', and r2-n2 double shake-up processes, respectively, as discussed above. The CO 3 a orbital can be found around 36 eV as a very broad and relative intense peak D. Another very weak peak can be identified around 41 eV binding energy, labeled E. A corre- sponding peak has been observed in the free CO molecule and Cr(C0)6, but not W(CO)6, as discussed above. This peak can be assigned to the shake-up process from the CO 30 orbital.
The three peaks on the higher energy side of peak E are derived from the Re 4f (CI and C3) and 5~312 (C2) core orbitals and they will be examined in more detail in section B.
Figure 3 presents the valence and inner-valence spectra of another two organometallic complexes, CpM(C0)3, where Cp = q5-C5H5 and M = Re and Mn, at 72 eV photon energy. Unlike
(25) (a) Higginson, B. R.; Lloyd, D. R.; Evans, S. ; Orchard, A. F. J. Chem. Soc., Faraday Trans. 2 1975, 71, 1913. (b) Hall, M. B. J . Am. Chem. SOC. 1975, 97, 2057.
(26) (a) Calabro, D. C.; Hubbard, J. L.; Blevins, C. H., 11; Campbell, A. C.; Lichtenberger, D. L. J . Am. Chem. Soc. 1981, 103, 6839. (b) Lichtenberger, D. L.; Fenske, R. F. J . Am. Chem. Soc. 1976, 98, 50.
(27) (a) Cooper, G.; Green, J. C.; Payne, M. P. Mol. Phys. 1988,63, 1031. (b) Cauletti, C.; Green, J. C.; Kelly, M. R. J . Electron Spectrosc. Relat. Phenom. 1980, 19, 327. (c) Evans, S . ; Green, M. L. H.; Jewitt, B.; Orchard, A. F.; Pygall, C. F. J. Chem. Soc., Faraday Trans. 2 1972, 68, 1847.
(28) (a) Jolly, Wb L.; Hendrickson, D. N. J . Am. Chem. SOC. 1980, 92, 1863. (b) Agren, H.; Selander, L.; Nordgren, J.; Nordling, C.; Siegbahn, K.; Muller, J. Chem. Phys. 1979, 37, 161.
3720 Inorganic Chemistry, Vol. 34, No. 14, 1995
Table 2. Binding Energies, Widths, and the Assignments of the Inner-Valence Spectra of Rhenium Carbonyls
Hu et al.
Re(C0)sCl Re(C0)sBr ReACO) I o Peak number binding energy (eV) width (eV) binding energy (eV) width (eV) binding energy (eV) width (eV) assignment
S 21.11 2.14 21.06 A 23.73 3.05 23.79 B 27.29 3.46 27.93 C 3 1.25 3.90 31.30 D 36.10 3.53 36.09 E 41.25 2.50 41.80
2.21 20.61 2.31 shake-up 3.31 23.5 1 3.07 satellite 1 2.97 27.57 2.00 satellite 2 3.33 30.79 2.70 satellite 3 3.67 35.38 3.51 co 3 a 1.85 43.83 3.72 satellite 4
t II I
35.0 30.0 25.0 20.0 15.0 10.0
Binding Energy (eV) Figure 3. High resolution photoelectron spectra of (a) CpRe(CO), and (b) CpMn(CO), at 72 eV photon energy. The notation for labeling the peaks is similar to that of Figure 1, except only shake-up and inner- valence peaks are labeled here.
Table 3. CpM(CO)? (M = Mn, Re)
Binding Energies, Widths, and Assignments of
CpRe(CO)3 CpMn(CQ3 peak binding width binding width
number energy (eV) (eV) energy (eV) (eV) assignment S 20.10 1.97 20.33 2.52 shake-up A 22.53 2.45 23.44 2.85 satellite 1 B 26.98 2.50 27.53 2.1 1 satellite 2 C 30.11 3.18 30.61 2.43 satellite 3 D 34.41 3.01 35.63 2.05 CO 30
approximated by the molecule with the Z + 1 atom. The core equivalent species for core ionized W(CO)6 is [Re(CO)6]+. The M-C bond length in [Re(Co)6]+ is 2.01 A,29 which is substantially smaller than in W(CO)6 (2.07 A).30 This substan- tial decrease in bond length between neutral and core ionized W(CO)6, due to the deshielding effect, should lead to substantial vibrational structure. Also, the vibrational splitting of 0.275 eV (2220 cm-’) from C-0 stretching on W 4f orbital is larger than that of the ground state W(CO)6 (2126 cm-I), and closer to that of [Re(CO)& (-2200 ~ m - ’ ) . ~ ’ The vibrational splitting from Re-Br or the two CO vibrations in Os(C0)s may contribute to the Re and Os spectra, but cannot be resolved.
The observation and characterization of the vibrational effect of CO on metal 4f levels leads us to consider deriving the
(29) Gmelin Handbook of Inorganic Chemistry, Organorhenium Com- pounds, Parr 2; edited by A. Slawisch, Springer-Verlag: Berlin, 1989.
(30) Bruce, D. M.; Holloway, J. H.; Russell, D. R. J . Chem. Soc., Dalton Trans. 1978, 1627.
(31) Braterman, P. S. Metal Carbonyl Spectra; Academic Press: London, 1975.
I 41.0 40.0 39.0 38.0 37.0
v1
52.0 50.0 48.0
O+ I 62.0 60.0 58.0
Binding Energy (eV) Figure 4. High resolution 4f photoelectron spectra of (a) W(CO)6 at 80 eV photon energy, (b) Re(C0)sBr at 100 eV photon energy, and (c) Os(C0)s at 120 eV photon energy. These spectra are fit with spin- orbit splitting and a YI(C-0) vibrational component.
inherent linewidths of these metal core levels. These linewidths are important for the studying the chemical dependence of core level lifetimes’& and for interpreting photoelectron spectra of surfaces which are complicated by surface core level shifts and disorder broadening associated with various adsorbate covered surfaces. Our experimental linewidth of W 4f levels is 0.25 eV, much larger than the inherent W 4f linewidth from theory32 (0.07 eV) and experiment33 (0.055-0.15 eV). Our broader lines must be due to the existence of a M-CO vibrational progression, as in the W 5d valence l e ~ e l . ’ ’ ~ ” ~ We have tried to fit another W-CO vibrational progression into the W 4f spectra in the previous communication’’ and derived the W 4f inherent linewidth to be around 0.15 eV. It is important to note here that our instrumental resolution of Figure 4 is around 100 meV, which is only comparable to the above inherent linewidth. Therefore, we are not confident about the extent of a W-CO vibrational progression, and we will have to wait for the even better instrumental resolution to completely resolve these features and derive a definitive inherent linewidth.
The trends in 4f parameters for the W, Re, and Os compounds (Table 4), particularly the trend in linewidths, are interesting to examine. The regular increases in both binding energy and spin-orbit splitting are as expected from previous low resolution studies.34 The large increase in linewidths from the W to Os
(32) McGuire, E. J. Phys. Rev. A 1974, 5, 1840. (33) (a) van der Veen, J. F.; Himpsel, F. J.; Eastman, D. E. Phys. Rev. B
1982, 25, 7388. (b) Wertheim, G. K.; Citrin, P. H.; van der Veen, J. F. Phys. Rev. B 1984, 25, 7236.
(34) Leigh, L.; Bremser. W. J . Chem. Soc., Dalton Trans. 1972, 1216.

Spectra of Metal Carbonyls Inorganic Chemistry, Vol. 34, No. 14, 1995 3721
Table 4. Fitting Parameters of W, Re, and Os 4f Spectra binding energy
4fm (eV) SO splitting (eV) SO intensity ratio (eV) rexptl (eV) vl(C-0) (cm-') W(C0)6 37.92(3) 2.165(5) 0.65(3) 0.25(2) 2220(40) RelCOhBr 48.47(3) 2.42961 0.60i3j 0.35i2j 23ooi4oj
0.60(3) 0.5 3 (2) (2580)
compound (0.25-0.53 eV) is certainly surprising. There are four possible causes of this large increase: (a) an increase in experimental resolution; (b) an increase in inherent linewidth; (c) an increase in vibrational broadening; and (d) an increase in ligand field splitting (LFS) which splits the 4f7/2 and 4 f 5 ~ levels. The first two of the above can be quickly ruled out. The increase in experimental resolution from 80 eV photon energy to 120 eV photon energy is only about 60 meV, and would not affect the observed linewidths noticeably. As shown by M c G ~ i r e , ~ ~ the increase in natural linewidth would be only 150 meV, and also would not affect the observed linewidths noticeably. The contributions from vibrational effects cannot be easily evaluated at this time, especially because the core equivalent species for Os(C0)5[Ir(CO)5+] is not known to examine the difference in M-C bond lengths between ground and core-ionized states.
Ligand field ~ p l i t t i n g ' ~ ~ ~ ~ - ~ ~ is the most likely cause of the majority of this 4f line broadening. LFS has been observed mostly on core d levels, but has recently been resolved on the S 2p level in H2S.Iof It has not been observed on core f levels. However, Os(CO), should have a very large asymmetric ligand field which would split the 4 f ~ and 4fv2 levels into three and four r e s p e c t i ~ e l y , ~ ~ , ~ ~ leading to line broadening. We have shown p r e v i ~ u s l y ~ ~ - ~ ~ that the core level LFS is proportional to the electric field gradient (EFG) at the nucleus, as normally measured by Mossbauer or nuclear quadrupole resonance spectroscopies. Unfortunately, the EFG's for our three com- pounds are not known. Qualitatively, however, we know that octahedral W(CO)6 (oh symmetry) must have zero EFG or LFS, and OS(CO)~ (D3h symmetry) should have a large EFG and LFS. Semiquantitatively, it is possible to calculate the relative magnitudes of the LFS for the third row transition metal species, by looking at the EFG for the first row analogues Cr(C0)6, Mn- (C0)5Br, and Fe(C0)s. The Mossbauer quadrupole splittings (proportional to the EFG and LFS) are 0, 0.50, and 2.66 "/ s.38-40 The above trend in EFG and LFS shows that the order of LFS in our compounds should be as follows: W(CO)6 .e Re(C0)sBr << OS(CO)~. This order is just the same as seen in the 4f linewidths, strongly suggesting that LFS is the dominant factor controlling the linewidth trend.
Our observation of the vibrational fine structure and ligand field splitting on the 4f levels of this series of metal carbonyls is important for surface scientists studying small adsorbates on metals with high resolution photoelectron spectroscopy of narrow metal levels such as W and Re 4f or Pd 3d.4' When
(35) Bancroft, G. M.; Tse, J. S . Comments Inorg. Chem. 1986, 5, 89 and references therein.
(36) Gupta, R. P.; Tse, J. S.; Bancroft, G. M. Philos. Trans. R. SOC. 1980, 293, 535.
(37) Bancroft, G. M.; Creber, D. K.; Basch, H. J . Chem. Phys. 1977, 67, 4891.
(38) Bancroft, G. M.; Clark, H. C.; Kidd, R. G.; Rake, A. T.; Spinney, H. G. Inorg. Chem. 1973, 12, 728.
(39) Bancroft, G. M.; Platt, R. H. Adv. Inorg. Chem. Radiochem. 1972, 15, 59.
(40) Clark, M. G.; Cullen, W. R.; Garrod, R. E. B.; Maddock, A. G.; Sams, J. R. Inorg. Chem. 1973, 12, 1045.
(41) (a) Andersen, J. N.; Ovarford, M.; Nyholm, R.; Sorenson, S. L.; Wigren, C. Phys. Rev. Lett. 1991, 67, 2822. (b) Spanjaard, D.; Suillot, C.; Desjonqueres, M. C.; Treglia, G.; LeCante, J. Surf. Sci. Rep. 1985, 5, 1.
v) c)
3
3000- I 2000-
1ooO.
0.. , , .sP?",, , . , , , , . , , ,
60.0 55.0 50.0 45.0 40 0 35.0
Binding Energy (eV) Figure 5. W 4f and associated satellite spectrum of W(CO)6 at 150 eV photon energy. See Table 5 and text for assignment.
deconvoluting complex overlapping spectra of, for example, H, CO, 02, N2, etc. adsorbed on metals, our result indicates that vibrational and ligand field contributions to the metal spectra must be considered. Such vibrational contributions on the ligand levels (e.g. in the C 1s spectra of CO) have already been widely recognized$2 but to our knowledge no vibrational contributions have been taken into consideration for the metal levels.
(b) Core Level Shake-up Spectra. Traditionally, the shake- up satellites of the core level in organometallic complexes have been observed using low resolution laboratory sources.43 We were interested to examine the effect of high resolution, variable photon energy studies on the linewidth of the normally broad shake-up peaks and the relative intensity (relative to the main line) of the shake-up peaks as a function of photon energy. Unfortunately, because the overlap of the 5p and 4f lines (Figures 1 and 2), good shake-up spectra could not be taken below about 120 eV. The W(CO)6 spectrum at 150 eV at an instrumental resolution of 0.45 eV is shown in Figure 5. This spectrum is qualitatively very similar to the X-ray spectrum, and the positions and relative intensities are very similar to the previous results. However, the W 4f linewidth is less than one- half of the previous X-ray spectrum, and most of the shake-up peaks are much narrower than the previous results. Indeed, the M2 peak widths (0.75 eV) are very similar to the main line peak width of 0.61 eV (Table 5). This suggested the possibility of narrowing the shake-up peak widths even further with the improved experimental resolution. However, going to 120 eV at -0.35 eV resolution, the main 4f peaks narrowed to 0.50 eV, but the M2 shake-up peaks did not narrow. This study does show that good resolution does improve the shake-up widths considerably, and that the relative shake-up intensities do not change appreciably over the kinetic energy range of -80 eV to 1200 eV.
(42) (a) Martensson, N.; Nilsson, A. Surf. Sci. 1989, 211, 303. (b) Martensson, N.; Nilsson, A. J . Electron Spectrosc. Relat. Phenom. 1990, 52, 1.
(43) (a) Bancroft, G. M.; Boyd, B. D.; Creber, D. K. Inorg. Chem. 1978, 17, 1008. (b) Brisk, M. A.; Baker, A. D. J . Electron Specfrosc. Relat. Phenom. 1975, 7, 197. (c) Vemon, G. A,; Stucky, G.; Carlson, T. A. Inorg. Chem. 1975, 15, 278.

3122 Inorganic Chemistry, Vol. 34, No. 14, 1995
Table 5.
Hu et al.
Shake-up Energies and Widths of W 4f of W(COj6" A binding energy (eV) (I&j width (eV)
peak labeled 150 eV 120 eV XPSb 150 eV 120 eV XPSC assignment
0.62 0.60
5.78 (0.06) 5.4 (0.14) 6.1 (0.06) 1.18 5.58 5.4 5.5 1.02 8.87 (0.07) 8.87 (0.1 1 j 8.8 (0.06) 0.78 8.82 8.86 8.4 0.12
15.36(0.04) d 15.0(0.03) 1.48 15.45 d 15.0 1.48
0.50 0.50 1.31 1.14 0.81 0.73 d d
1.27 1.28 1.6 2t2g-3t2g 1.7 2t2g-3t2p 1.4 2eg-3e, 1.5 2e,-3eg 1.6 le,-3eg 1.7 1 e,-3eg
Errors are 0.1 in the A binding energies and peak widths. Reference 43a. Line widths of XPS are estimated from spectrum in ref 43a. Not observed.
The assignment of this spectrum is as given previously.43a The energy of the first shake-up peak (2tzg - 3t2g) is in good agreement with that expected from the Z + 1 approximation. The electronic spectrum of W(CO)6 places the 2tzg - 3bg excitation energy at 4.53 eVS4 However, for the core equivalent species Re(C0)6+, this transition energy increases to 5.82 eV, in good agreement with our shake-up energy of 5.7 f 0.1 eV. The M2 and M3 shake-up peaks at 8.8 and 15.4 eV are beyond the UV absorption range, so we cannot use the Z + 1 approximation. The assignment of these peaks is still tenuous. It is possible, as suggested recently, that the M3 peaks at -15 eV are due to shake-off.'*
C. Valence np - nd resonance effects of CpM(CO)3 (M = Mn and Re). The valence photoelectron spectra of CpM- (CO)3 complexes have been studied extensively with He I and He I1 source^.^.^^ An empirical intensity rule3 was successfully used to assign metal d orbitals based on the He W e I1 intensity differences. However, the He I/He II techniques, even combined with the theoretical studies have failed to yield the definitive assignment of the valence spectrum of even relatively simple molecules, such as The definitive assignment of Ni 3d orbital can only be obtained with variable energy synchrotron radiatiomgd Green et al. have observed the metal np - nd giant resonance effects in some organometallic ~ys t ems ,~ which can also provide the definitive assignment of metal d-based ionizations in the valence region. Here, we report the observation of the np - nd resonance in CpM(C0)3 (M = Mn and Re) complexes to show again the power of this technique for assigning the metal d orbitals.
The np - nd resonance phenomenon can be explained as due to the following process:'
np6ndx -+ np5ndx+' - np6ndx-' + e (1)
First, an inner np electron is excited to one of the unfilled nd levels. Subsequently, an electron falls back into the np hole and a valence nd electron is ionized-a so-called super Coster- Kronig transition. Therefore, an enhancement of the nd band in the region of the np absorption may be observed. It is helpful to observe such resonance effects with variable photon energies if the binding energies of the np levels can be determined. From separate higher photon energies studies, we observed the binding energies of Mn 3p of CpMn(C0)3 and Re 5~112 and 5~312 of CpRe(CO)3 are at 55, 49, and 58 eV, respectively.
Photoelectron spectra of CpMn(C0)3 at 54, 56, 58, and 60 eV photon energies are illustrated in Figure 6 . These spectra show clearly, that the relative intensity of the first peak, A, with
(44) Beach, N. A,: Gray, H. B. J . Am. Chem. Soc. 1968, 90, 5713. (45) (a) Moncneff, D.; Hillier, I. H.; Saunder, V. R.; von Niessen, W. Chem.
Phys. Lett. 1986, J3Z, 545. (b) Decleva, P.: Fronzoni, G.; Lisini, A. Chem. Phys. 1989, 134, 307.
6ooo 5000
Li 18 16 14 12 10 8 6
6ooo ;osa.v 2500
2000 5000 3
4000 c, 2 3000
2000
1000
0 18 16 14 12 10 8 6
I :; I
18 16 14 12 10 8 6
Binding Energy (eV) Binding Energy (ev) Figure 6. Valence level spectra of CpMn(CO)3 at (a) 54, (b) 56, (c) 58, and (d) 60 eV photon energy, showing the maximum relative intensity of peak A around 58 eV photon energy.
the lowest binding energy increases dramatically from 54 eV photon energy to 56 and 58 eV photon energies, and begins to decrease from 58 eV photon energy to 60 eV photon energy. This is the photon energy region one would expect to observe the Mn 3p - 3d resonance on the 3d band. So, it is straightforward that the first peak can be assigned to Mn 3d orbitals, in agreement with the previous a s ~ i g n m e n t . ~ . ~ ~ This feature can be seen even more clearly in the relative partial photoionization cross sections over the complete photon energy range from 22 to 130 eV.46
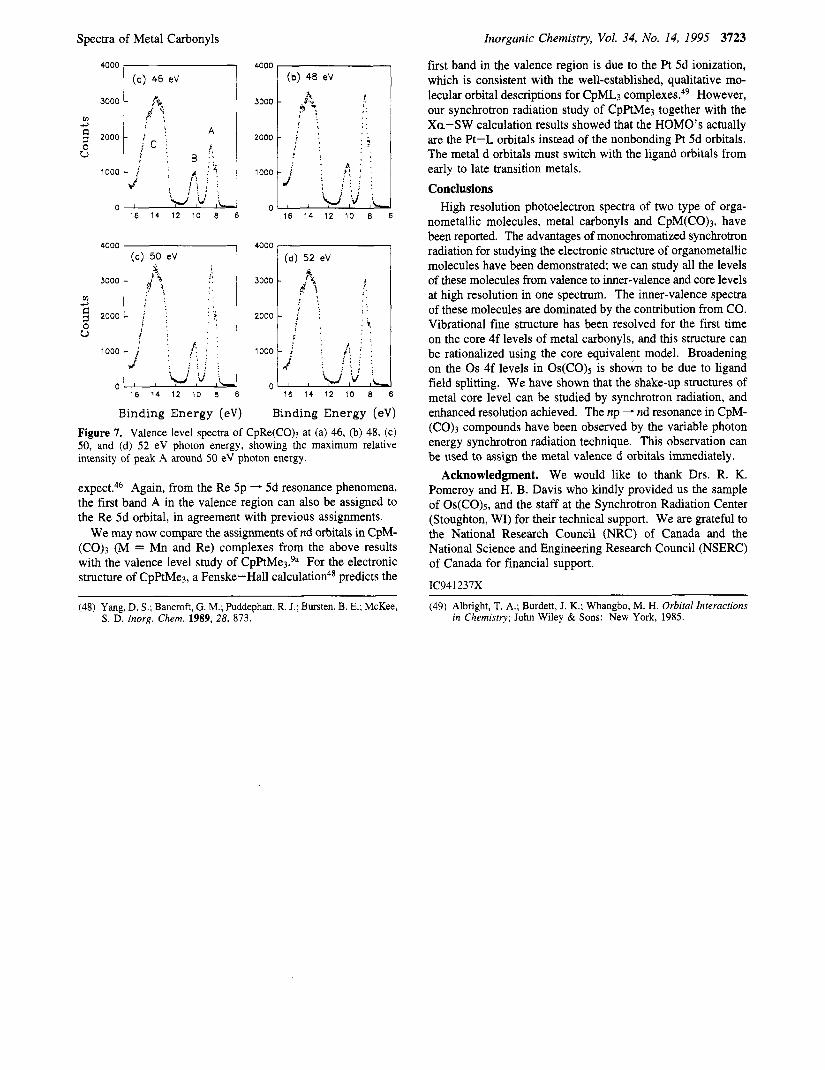
A similar observation would be expected for CpRe(C0)3, though one would expect to observe two resonances: 5~112 - 5d and 5~312 - 5d, because the spin-orbit splitting of the third row transition metal is much larger than that of first row transition metals.47 Figure 7 illustrates the photoelectron spectra of CpRe(C0)3 at 46, 48, 50, and 52 eV. The first band, A, obviously increases in intensity from 46 eV to 48 and 50 eV before decreasing at 52 eV, due to the 5~112 - 5d resonance. The observation of the Re 5~312 - 5d resonance can also be made at the photon energies region around 58 eV, as one would
(46) Hu, Y. F.; Bancroft, G. M.; Tan, K. H.; Yang, D. S. To be published. (47) Eland, J. H. D. Photoelectron Spectroscopy: Wiley: New York, 1984.
Spectra of Metal Carbonyls
4000
3000
rA 4
2000 2 u 1000
0
4000
3000
rA 4
2000 2 u
1000
0
(a) 46 eV
16 14 12 10 8 6
(c) 50 eV
I (
16 14 12 10 8 6
4000
3000
2000
1000
0
4000
3000
2000
1000
0
(b) 48 eV
16 14 12 10 8 6
(d) 52 eV
16 14 12 10 8 6
Binding Energy (eV) Binding Energy (eV) Figure 7. Valence level spectra of CpRe(C0)3 at (a) 46, (b) 48, (c) 50, and (d) 52 eV photon energy, showing the maximum relative intensity of peak A around 50 eV photon energy.
expect.46 Again, from the Re 5p - 5d resonance phenomena, the first band A in the valence region can also be assigned to the Re 5d orbital, in agreement with previous assignments.
We may now compare the assignments of nd orbitals in CpM- (CO)3 (M = Mn and Re) complexes from the above results with the valence level study of c ~ P t M e 3 . ~ ~ For the electronic structure of CpPtMes, a Fenske-Hall calculation4* predicts the
(48) Yang, D. S.; Bancroft, G. M.; Puddephatt, R. J.; Bursten, B. E.; McKee, S . D. Inorg. Chem. 1989, 28, 873.
Inorganic Chemistry, Vol. 34, No. 14, 1995 3723
first band in the valence region is due to the Pt 5d ionization, which is consistent with the well-established, qualitative mo- lecular orbital descriptions for CpML3 comple~es."~ However, our synchrotron radiation study of CpPtMe3 together with the Xu-SW calculation results showed that the HOMO'S actually are the Pt-L orbitals instead of the nonbonding Pt 5d orbitals. The metal d orbitals must switch with the ligand orbitals from early to late transition metals. Conclusions
High resolution photoelectron spectra of two type of orga- nometallic molecules, metal carbonyls and CpM(CO)3, have been reported. The advantages of monochromatized synchrotron radiation for studying the electronic structure of organometallic molecules have been demonstrated; we can study all the levels of these molecules from valence to inner-valence and core levels at high resolution in one spectrum. The inner-valence spectra of these molecules are dominated by the contribution from CO. Vibrational fine structure has been resolved for the first time on the core 4f levels of metal carbonyls, and this structure can be rationalized using the core equivalent model. Broadening on the Os 4f levels in OS(CO)~ is shown to be due to ligand field splitting. We have shown that the shake-up structures of metal core level can be studied by synchrotron radiation, and enhanced resolution achieved. The np - nd resonance in CpM- (CO)3 compounds have been observed by the variable photon energy synchrotron radiation technique. This observation can be used to assign the metal valence d orbitals immediately.
Acknowledgment. We would like to thank Drs. R. K. Pomeroy and H. B. Davis who kindly provided us the sample of OS(CO)~, and the staff at the Synchrotron Radiation Center (Stoughton, WI) for their technical support. We are grateful to the National Research Council (NRC) of Canada and the National Science and Engineering Research Council (NSERC) of Canada for financial support.
IC941237X
(49) Albright, T. A.; Burdett, J. K.; Whangbo, M. H. Orbital Interactions in Chemistry; John Wiley & Sons: New York, 1985.