comprehensive annual financial report - lynx · increases or decreases in the authority’s net...
TRANSCRIPT

Comprehensive Annual Financial ReportFor Year Ended September 30, 2012
CENTRAL FLORIDA REGIONAL TRANSPORTATION AUTHORITY

COMPREHENSIVE ANNUAL FINANCIAL REPORT
of the
CENTRAL FLORIDA REGIONAL TRANSPORTATION AUTHORITY d/b/a
LYNX
FOR YEAR ENDED SEPTEMBER 30, 2012
PREPARED BY THE FINANCE DEPARTMENT
Blanche W. Sherman, CPA, Director of Finance Starlin W. Rolle, CPA, Interim Manager of Finance
Patti Bryant, Manager of Accounting

John M. Lewis Jr.
CHIEF EXECUTIVE OFFICER
Edward Johnson
GENERAL MANAGER
Vice-Chairman Brandon Arrington
OSCEOLA COUNTY COMMISSIONER
LYNX BOARD OF DIRECTORS
LYNX EXECUTIVE MANAGEMENT
Secretary Teresa Jacobs
ORANGE COUNTY MAYOR
Noranne Downs
FDOT DISTRICT 5 SECRETARY
Introductory Section
CENTRAL FLORIDA REGIONAL TRANSPORTATION AUTHORITY
Carlton HenleySEMINOLE COUNTY
COMMISSIONER
Chairman Buddy Dyer
MAYOR OF ORLANDO

i
TABLE OF CONTENTS i
BOARD OF DIRECTORS, EXECUTIVE DIRECTOR, STAFF iii
ORGANIZATIONAL CHART iv
LETTER OF TRANSMITTAL 1
CERTIFICATE OF ACHIEVEMENT 14
REPORT OF INDEPENDENT AUDITOR 15 MANAGEMENT'S DISCUSSION AND ANALYSIS 17
BASIC FINANCIAL STATEMENTS:
BALANCE SHEETS 22
STATEMENTS OF REVENUES, EXPENSES, AND CHANGES IN NET ASSETS 24
STATEMENTS OF CASH FLOWS 25
NOTES TO FINANCIAL STATEMENTS 26
REQUIRED SUPPLEMENTARY INFORMATION:
UNION PENSION PLAN SCHEDULE OF FUNDING PROGRESS 38
OTHER POSTEMPLOYMENT BENEFITS (OPEB) SCHEDULE OF FUNDING PROGRESS 39
SUPPLEMENTARY SCHEDULE OF REVENUES AND EXPENSES-BUDGET VS. ACTUAL (BUDGETARY BASIS) 40
STATISTICAL INFORMATION 41
MISCELLANEOUS STATISTICS 42
REVENUES, EXPENSES, AND CHANGES IN NET ASSETS-LAST TEN YEARS 43
CONDENSED SUMMARY OF NET ASSETS-LAST TEN YEARS 44
TOTAL DEBT-LAST TEN YEARS 45
REVENUE BY SOURCE-LAST TEN YEARS 46
REVENUES BY SOURCE (PERCENTAGES)-LAST TEN YEARS 47
COMPREHENSIVE ANNUAL FINANCIAL REPORTTABLE OF CONTENTS
INTRODUCTORY SECTION
CENTRAL FLORIDA REGIONAL TRANSPORTATION AUTHORITY d/b/a LYNX
FINANCIAL SECTION
STATISTICAL SECTION
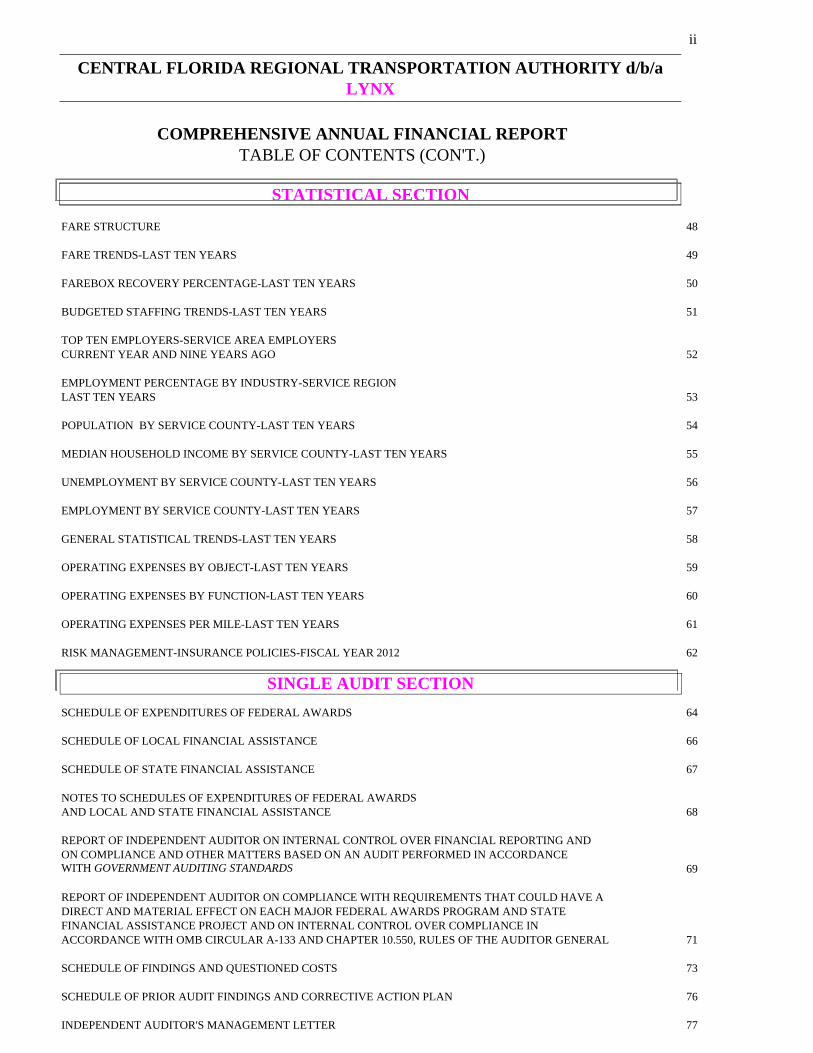
FARE STRUCTURE 48
FARE TRENDS-LAST TEN YEARS 49
FAREBOX RECOVERY PERCENTAGE-LAST TEN YEARS 50
BUDGETED STAFFING TRENDS-LAST TEN YEARS 51
TOP TEN EMPLOYERS-SERVICE AREA EMPLOYERSCURRENT YEAR AND NINE YEARS AGO 52
EMPLOYMENT PERCENTAGE BY INDUSTRY-SERVICE REGIONLAST TEN YEARS 53
POPULATION BY SERVICE COUNTY-LAST TEN YEARS 54
MEDIAN HOUSEHOLD INCOME BY SERVICE COUNTY-LAST TEN YEARS 55
UNEMPLOYMENT BY SERVICE COUNTY-LAST TEN YEARS 56
EMPLOYMENT BY SERVICE COUNTY-LAST TEN YEARS 57
GENERAL STATISTICAL TRENDS-LAST TEN YEARS 58
OPERATING EXPENSES BY OBJECT-LAST TEN YEARS 59
OPERATING EXPENSES BY FUNCTION-LAST TEN YEARS 60
OPERATING EXPENSES PER MILE-LAST TEN YEARS 61
RISK MANAGEMENT-INSURANCE POLICIES-FISCAL YEAR 2012 62
SCHEDULE OF EXPENDITURES OF FEDERAL AWARDS 64
SCHEDULE OF LOCAL FINANCIAL ASSISTANCE 66
SCHEDULE OF STATE FINANCIAL ASSISTANCE 67
NOTES TO SCHEDULES OF EXPENDITURES OF FEDERAL AWARDS AND LOCAL AND STATE FINANCIAL ASSISTANCE 68
REPORT OF INDEPENDENT AUDITOR ON INTERNAL CONTROL OVER FINANCIAL REPORTING ANDON COMPLIANCE AND OTHER MATTERS BASED ON AN AUDIT PERFORMED IN ACCORDANCEWITH GOVERNMENT AUDITING STANDARDS 69
REPORT OF INDEPENDENT AUDITOR ON COMPLIANCE WITH REQUIREMENTS THAT COULD HAVE ADIRECT AND MATERIAL EFFECT ON EACH MAJOR FEDERAL AWARDS PROGRAM AND STATEFINANCIAL ASSISTANCE PROJECT AND ON INTERNAL CONTROL OVER COMPLIANCE IN ACCORDANCE WITH OMB CIRCULAR A-133 AND CHAPTER 10.550, RULES OF THE AUDITOR GENERAL 71
SCHEDULE OF FINDINGS AND QUESTIONED COSTS 73 SCHEDULE OF PRIOR AUDIT FINDINGS AND CORRECTIVE ACTION PLAN 76
INDEPENDENT AUDITOR'S MANAGEMENT LETTER 77
SINGLE AUDIT SECTION
CENTRAL FLORIDA REGIONAL TRANSPORTATION AUTHORITY d/b/a LYNX
STATISTICAL SECTION
COMPREHENSIVE ANNUAL FINANCIAL REPORTTABLE OF CONTENTS (CON'T.)
ii
iii
CCEENNTTRRAALL FFLLOORRIIDDAA RREEGGIIOONNAALL TTRRAANNSSPPOORRTTAATTIIOONN AAUUTTHHOORRIITTYY dd//bb//aa
LLYYNNXX
BOARD OF DIRECTORS Mayor Buddy Dyer Chairman, City of Orlando
Commissioner Brandon Arrington Vice-Chairman, Osceola County Mayor Teresa Jacobs Board Member, Orange County
Commissioner Carlton Henley Board Member, Seminole County FDOT District 5 Secretary, Noranne Downs Board Member, FDOT
LYNX EXECUTIVE STAFF John M. Lewis, Jr. Chief Executive Officer
Edward Johnson General Manager
DEPARTMENT HEADS Blanche W. Sherman, CPA Director of Finance
J. Marsh McLawhorn Chief Government Relations Officer Lisa Darnall Chief Operating Officer
Belinda Balleras Interim Director of Planning Donna Tefertiller Director of Human Resources
Craig Bayard Director of Information Technology Kathy Clary Director of Communications
Bernard Guida Director of Procurement Baunie McConnell Director of Risk Mgmt and Safety
FINANCE DIVISION Starlin Rolle, CPA Interim Manager of Finance
Patti Bryant Manager of Accounting Pedro Bustamante, CPA Senior Accountant
Nancy Navarro AccountantDenise Callihan AccountantBlanca Matute AccountantVicki Hoffman Fiscal Assistant
Suzan Zaki Senior Accounting Technician Edward Velez Property Officer
Elaine Buhrow Accounting Technician Jo Ann Pfenning Accounting Technician Samorea Nelson Accounting Technician Christine Geller Fare Collection Clerk

CH
IEF EXEC
UTIVE O
FFICER
John M. Lew
is, Jr.
MA
NA
GER
OF
CO
MPLIA
NC
ED
esna Hunte
BO
AR
D O
F DIR
ECTO
RS
EXECU
TIVE A
SSISTAN
TD
eborah Morrow
CH
IEF GO
VERN
MEN
T A
FFAIR
S OFFIC
ERJ M
arsh McLaw
horn
LYNX O
RG
AN
IZATIO
NA
L CH
AR
TSeptem
ber 28, 2012
GEN
ERA
L MA
NA
GER
Edward Johnson
DIR
ECTO
R O
F FIN
AN
CE
Blanche Sherm
an
DIR
ECTO
R O
F H
UM
AN
RESO
UR
CES
Donna Tefertiller
DIR
ECTO
R O
F PLA
NN
ING
Tony Walter
INTER
IM D
IREC
TOR
O
F INFO
RM
ATIO
N
TECH
NO
LOG
YC
raig Bayard
DIR
ECTO
R O
F RISK
M
AN
AG
EMEN
T &
SAFETY
Baunie M
cConnell
DIR
ECTO
R O
F PR
OC
UR
EMEN
TB
en Guida
DIR
ECTO
R O
F M
AR
KETIN
G
CO
MM
UN
ICA
TION
SK
athy Clary
CH
IEF OPER
ATIN
G
OFFIC
ERLisa D
arnall
AD
MIN
ISTRA
TIVE A
SSISTAN
TSherry Zielonka
TRA
NSPO
RTA
TION
MA
INTEN
AN
CE
PAR
ATR
AN
SIT
AC
CO
UN
TING
&
FINA
NC
E
MA
TERIA
L C
ON
TRO
L
TRA
ININ
G &
D
EVELOPM
ENT
PLAN
NIN
G &
D
EVELOPM
ENT
STRA
TEGIC
PLA
NN
ING
SERVIC
E PLA
NN
ING
MA
RK
ETING
C
OM
MU
NIC
ATIO
NS
CU
STOM
ER
SERVIC
E
AD
VERTISIN
G
SALES
GR
AN
TS
DIR
ECTO
R O
F EN
GIN
EERIN
G
Daniel H
ealy
SECU
RITY &
FA
CILITIES


Certificate of
Presented to
Central Florida Regional
For its Comprehensive Annual
September 30, 2011
President
Executive Director
Financial Report
for the Fiscal Year Ended
Reportingin Financial
for ExcellenceAchievement
Text38:Tranportation Authority
A Certificate of Achievement for Excellence in FinancialReporting is presented by the Government Finance Officers
Association of the United States and Canada togovernment units and public employee retirement
systems whose comprehensive annual financialreports (CAFRs) achieve the higheststandards in government accounting
and financial reporting.

Financial Section
CENTRAL FLORIDA REGIONAL TRANSPORTATION AUTHORITY


17
MANAGEMENT’S DISCUSSION AND ANALYSIS This section of the comprehensive annual financial report of Central Florida Regional Transportation Authority d/b/a LYNX (the “Authority”) presents management’s analysis of the Authority’s financial performance during the Fiscal Years that ended on September 30, 2012 and 2011, respectively. Please read it in conjunction with the financial statements, which follow this section. Financial Highlights
Fiscal 2012 Customer fares increased by 10%, or $2.5 million, from FY2011. This was due to an increase in ridership of
4%, combined with the fare policy implemented April 2011 requiring passengers to present an Authority issued identification card in order to qualify for reduced fares. This policy has resulted in an increase in sales of full adult fare media and a decrease in sales of reduced fare media.
Advertising revenue increased significantly from FY2011, providing $1.2 million in revenue in FY2012. This
is due in part to a new advertising contract effective January 2012. Fuel costs increased by 6% from FY2011, primarily due to an increase in fuel consumption. The Authority
continued fuel hedging activities that began in FY2011 in an effort to stabilize fuel cost.
Fiscal 2011 Customer fares increased by $3.7 million primarily due to an increase in ridership of 9%. As in previous years,
rising gas price translates into higher ridership.
The Authority’s local funding partners decreased their funding by 7%, $3.6 million dollars from FY2010 levels, due to various budget constraints. The Authority continued to implement operating efficiencies and utilized $5.9 in Federal stimulus funds to minimize the impact of funding reductions and increasing expenses.
The price of fuel significantly increased in FY2011, resulting in a $4.5 million dollar increase in fuel expenses
compared to FY2010. Overview of the Financial Statements This discussion and analysis is intended to serve as an introduction to the Authority’s basic financial statements. The financial statements consist of two parts: Fund Financial Statements and Notes to the Financial Statements. The report also contains supplementary information in addition to the financial statements themselves. Required Financial Statements The financial statements of the Authority report information about the Authority using full accrual accounting methods similar to those used by private sector companies. These statements offer short-term and long-term financial information about its activities. The Balance Sheet includes all of the Authority’s assets and liabilities and provides information about the nature and amounts of investments in resources (assets) and the obligations to Authority creditors (liabilities). The assets and liabilities are presented in a classified format, which distinguishes between current and long-term assets and liabilities. It also provides the basis for computing the rate of return, evaluation of the capital structure of the Authority and assessing the liquidity and financial flexibility of the Authority. All of the current year’s revenues and expenses are accounted for in the Statement of Revenues, Expenses, and Changes in Net Assets. This statement measures the success of the Authority’s operations over the past year and can be used to determine whether the Authority has successfully recovered all its costs through its customer fares, contract services, and operating subsidies, as well as its profitability and credit worthiness. The final required financial statement is the Statement of Cash Flows. The primary purpose of this statement is to provide information about the Authority’s cash receipts and cash payments during the reporting period. The statement

18
reports cash receipts, cash payments, and net changes in cash resulting from operating, investing, and financing activities and provides answers to such questions as where did cash come from, what was cash used for, and what was the change in the cash balance during the reporting period. Financial Analysis of the Authority Our analysis of the Authority begins below with the Financial Statements. One of the most important questions asked about the Authority’s finances is “Is the Authority, as a whole, better off or worse off as a result of the year’s activities?” The Balance Sheet and the Statement of Revenues, Expenses, and Changes in Net Assets report information about the Authority’s activities in a way that will help answer this question. These two statements report the net assets of the Authority and changes in them. You can think of the Authority’s net assets---the difference between assets and liabilities---as one way to measure financial health or financial position. Over time, increases or decreases in the Authority’s net assets are one indicator of whether its financial health is improving or deteriorating. However, you will need to consider other non-financial factors such as changes in economic conditions, population growth, regulation, and new or changed government legislation. Net Assets To begin our analysis, a summary of the Authority’s Balance Sheets is presented in Table A-1. Table A-1 Condensed Statement of Net Assets (Balance Sheets) (In millions of dollars)
September 30, FY2012 FY2011 FY2010 Assets: Current and other assets $ 59.3 $ 54.9 $ 50.6 Capital assets 131.7 139.4 135.3
Total assets $191.0 $194.3 $185.9
Liabilities: Current liabilities $ 21.8 $ 19.0 $ 18.0 Long-term liabilities 12.7 15.4 16.7
Total liabilities $ 34.5 $ 34.4 $ 34.7
Net Assets: Invested in capital assets,
net of related debt $124.9 $131.1 $125.1 Restricted .5 .5 .5 Unrestricted 31.1 28.3 25.6
Total net assets $156.5 $159.9 $151.2
The Balance Sheets show the change in assets, liabilities, and the resulting net assets. Net assets may serve, over time, as a useful indicator of a government’s overall financial position. As can be seen from the Table A-1, Net Assets decreased $3.4 million to $156.5 million in FY2012 from $159.9 million in FY2011. Compared to FY2011, Net Assets Invested in Capital Assets, Net of Related Debt, decreased $6.2 million, Unrestricted Net Assets increased $2.8 million, and Restricted Net Assets did not change.

19
Table A-2 Condensed Statement of Revenues, Expenses, and Changes in Net Assets (In millions of dollars)
September 30, FY2012 FY2011 FY2010Operating Revenues:
Customer fares $ 28.6 $ 26.1 $ 22.4 Contract services 16.5 19.4 19.5 Advertising revenue 1.2 .8 .9 Other income .4 .4 .4 Total operating revenue 46.7 46.7 43.2
Nonoperating Revenues (Expenses), net:
Federal 19.7 19.0 15.9 State 10.5 11.2 11.5 Local 38.0 37.2 40.2 Interest and other income (expense) (.1) (.8) (.2) Total nonoperating revenue 68.1 66.6 67.4 Total Revenues 114.8 113.3 110.6
Depreciation Expense
19.2
18.2
17.0
Operating Expenses:
Salaries and wages 38.2 37.8 38.5 Fringe benefits 20.8 20.1 20.9 Purchased transportation services 20.7 21.2 20.1 Fuel 16.5 15.5 11.0 Materials and supplies 6.3 5.6 5.5 Professional services 5.4 5.7 6.4 Lease and miscellaneous .7 .7 .7 Casualty and liability insurance 1.6 2.1 1.8 Utilities, taxes, and licenses 1.8 1.9 1.8 Total operating expenses 112.0 110.6 106.7 Total Expenses 131.7 223.9 123.7
Loss before Capital Contributions (16.4) (15.5) (13.1) Capital Contributions 13.0 24.2 18.6 Change in Net Assets (3.4) 8.7 5.5 Beginning Net Assets 159.9 151.2 145.7 Ending Net Assets $156.5 $159.9 $151.2
The Statements of Revenues, Expenses, and Changes in Net Assets provide answers as to the nature and source of changes in Net Assets. As shown in Table A-2, the $3.4 million decrease in net assets in FY2012 is due to the decrease in Capital Contributions of $13 million over the Loss before Capital Contributions of $16.4 million. The increase in Customer Fares resulted from the increase in ridership of 4% compared to last year, combined with an increase in the sale of full fare tickets and passes as compared to reduced fare tickets and passes. The decrease in contract services was primarily due to a $1.6 million reduction in services for Disney and reductions in contract services for certain local governments. The increase in Nonoperating Revenue is primarily due to an increase in funding from the Authority’s local funding partners. The increase in Operating Expenses is mainly due to the increase in fuel costs, salaries, wages, and fringe benefits.

20
Capital Assets At the end of FY2012, the Authority had a broad range of Capital Assets, consisting of Land, Buildings and Shelters, Revenue Vehicles, Equipment, and Leasehold Improvements. Table A-3 Capital Assets (In millions of dollars)
September 30, FY 2012 FY 2011 FY 2010 Land $ 8.6 $ 8.6 $ 8.6 Buildings and Shelters 92.4 89.3 83.8 Revenue Vehicles 108.4 108.8 102.1 Equipment 24.0 21.9 21.3 Subtotal 233.4 228.6 215.8 Less Accumulated Depreciation (111.1) (100.5) (87.1)
Subtotal 122.3 128.1 128.7
Construction in Progress:
Bus Shelters .2 1.4 2.9 Facility Capital Improvements .2 3.7 1.0 Other Miscellaneous Projects 9.0 6.2 2.7
Subtotal 9.4 11.3 6.6
Net Capital Assets $131.7 $139.4 $135.3
Long-Term Obligations On August 16, 2001, the Authority entered into a State Infrastructure Bank (SIB) Loan Agreement (SIB #1), allowing draws of up to $7,958,991 for the construction of the LYNX Central Station. The loan matured in FY2011 and there was no outstanding balance at September 30, 2012. On June 9, 2004, the Authority entered into a second SIB Loan (SIB #2), allowing draws of up to $7,600,000 for the construction of the LYNX Operations Center Facility. This loan matures in FY2017; the outstanding loan balance as of September 30, 2012 was $3,909,775. On August 14, 2006, the Authority entered into a third SIB Loan (SIB #3), allowing draws of up to $7,140,000 for the acquisition of rolling stock, including paratransit vehicles. The outstanding loan balance as of September 30, 2012 was $4,255,022. In July 2012, a loan modification was executed deferring the final annual repayment until FY2014. On August 16, 2007, the Authority leased 21 buses requiring 28 quarterly lease payments over seven years, with principal totaling $7,632,976; the unpaid principal balance as of September 30, 2012, was $2,398,522. Diesel Fuel Hedging GASB Statement No. 53, Accounting and Financial Reporting for Derivative Instruments, was implemented in FY2011. This accounting standard requires that hedging derivative instruments be reported at fair value on the Balance Sheet. Beginning in July 2011, the Authority entered into several fuel hedging contracts with a counterparty to cover a significant portion of planned diesel fuel purchases in fiscal years ending September 30, 2011 and September 30, 2012. The objective is to smooth out the fluctuation in fuel prices and to limit the extent to which the price paid for fuel could increase during the fiscal year. As of September 30, 2012 the maturity dates of the open contracts range from October 2012 to September 2013. Because the fuel hedging contracts are considered effective hedges, the fair value of the asset and the liability related to the open contracts at September 30, 2012 fully offset each other.
21
Economic Factors and Next Year’s Budget and Rates The Authority’s Board of Directors and Management considered many factors when setting the FY2012 budget and contract services hourly rates. These factors include the expected demand of the Authority’s Funding Partners, which in turn consider such factors as anticipated population growth of the three counties and the economy of the region as a whole.

FINANCIAL STATEMENTS
22
CENTRAL FLORIDA REGIONAL TRANSPORTATION AUTHORITY d/b/a LYNXBALANCE SHEETS
SEPTEMBER 30, 2012 AND 2011
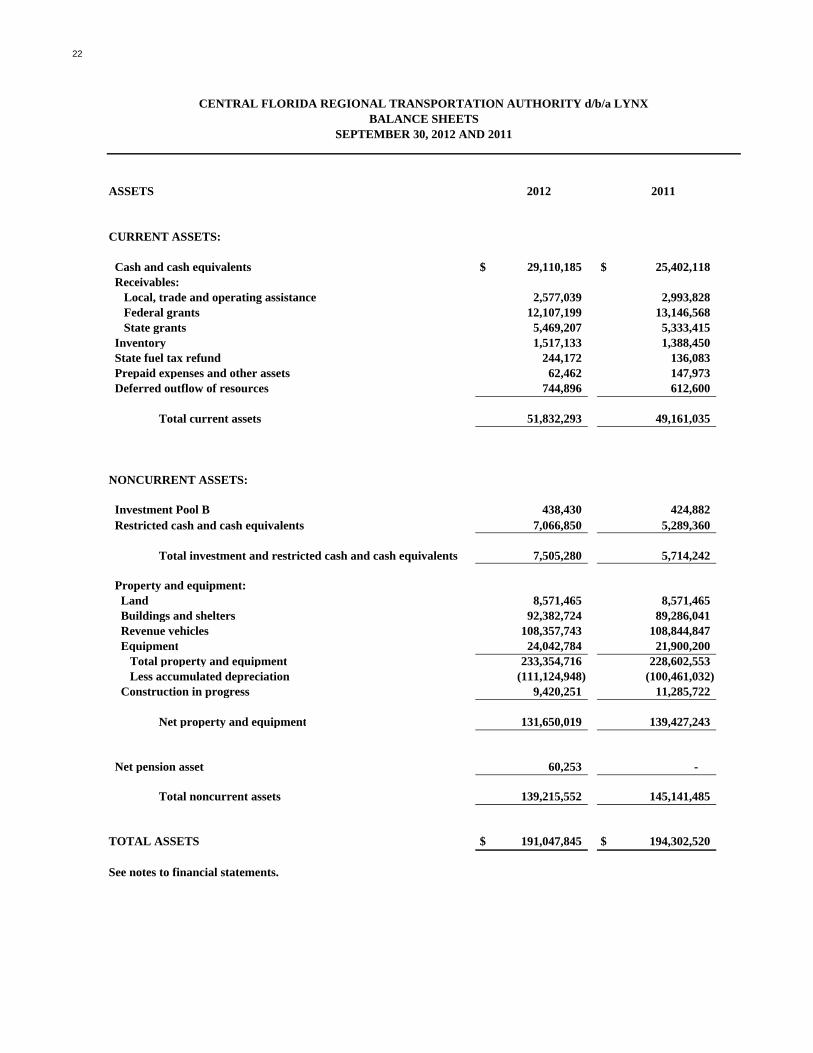
ASSETS 2012 2011
CURRENT ASSETS:
Cash and cash equivalents $ 29,110,185 $ 25,402,118 Receivables: Local, trade and operating assistance 2,577,039 2,993,828 Federal grants 12,107,199 13,146,568 State grants 5,469,207 5,333,415 Inventory 1,517,133 1,388,450 State fuel tax refund 244,172 136,083 Prepaid expenses and other assets 62,462 147,973 Deferred outflow of resources 744,896 612,600
Total current assets 51,832,293 49,161,035
NONCURRENT ASSETS:
Investment Pool B 438,430 424,882 Restricted cash and cash equivalents 7,066,850 5,289,360
Total investment and restricted cash and cash equivalents 7,505,280 5,714,242
Property and equipment: Land 8,571,465 8,571,465 Buildings and shelters 92,382,724 89,286,041 Revenue vehicles 108,357,743 108,844,847 Equipment 24,042,784 21,900,200 Total property and equipment 233,354,716 228,602,553 Less accumulated depreciation (111,124,948) (100,461,032) Construction in progress 9,420,251 11,285,722
Net property and equipment 131,650,019 139,427,243
Net pension asset 60,253 -
Total noncurrent assets 139,215,552 145,141,485
TOTAL ASSETS $ 191,047,845 $ 194,302,520
See notes to financial statements.

23
CENTRAL FLORIDA REGIONAL TRANSPORTATION AUTHORITY d/b/a LYNXBALANCE SHEETS
SEPTEMBER 30, 2012 AND 2011
LIABILITIES AND NET ASSETS 2012 2011
CURRENT LIABILITIES: Accounts payable $ 9,489,829 $ 9,451,628 Accrued salaries and related taxes 956,422 761,144 Accrued compensated absences, current 3,830,765 3,756,007 Accrued self-insurance liability, current 2,128,388 1,835,748 Leases payable, current 1,175,754 1,130,548 Loans payable, current 751,296 736,565 Deferred operating revenue 419,126 134,619 Deferred capital 2,335,039 557,548 Derivative financial instruments 744,896 612,600
Total current liabilities 21,831,515 18,976,407
NONCURRENT LIABILITIES:
Leases payable, long-term 1,222,768 2,398,522 Loans payable, long-term 7,413,500 8,164,797 Net pension and OPEB obligation 962,525 743,346 Accrued compensated absences, long-term 522,445 501,360 Accrued self-insurance liability, long-term 2,604,634 3,571,896
Total noncurrent liabilities 12,725,872 15,379,921
Total liabilities 34,557,387 34,356,328
NET ASSETS:
Invested in capital assets, net of related debt 124,856,579 131,097,480 Restricted-capital projects 536,749 536,749 Unrestricted 31,097,130 28,311,963
Total net assets 156,490,458 159,946,192
TOTAL LIABILITIES AND NET ASSETS $ 191,047,845 $ 194,302,520
See notes to financial statements.
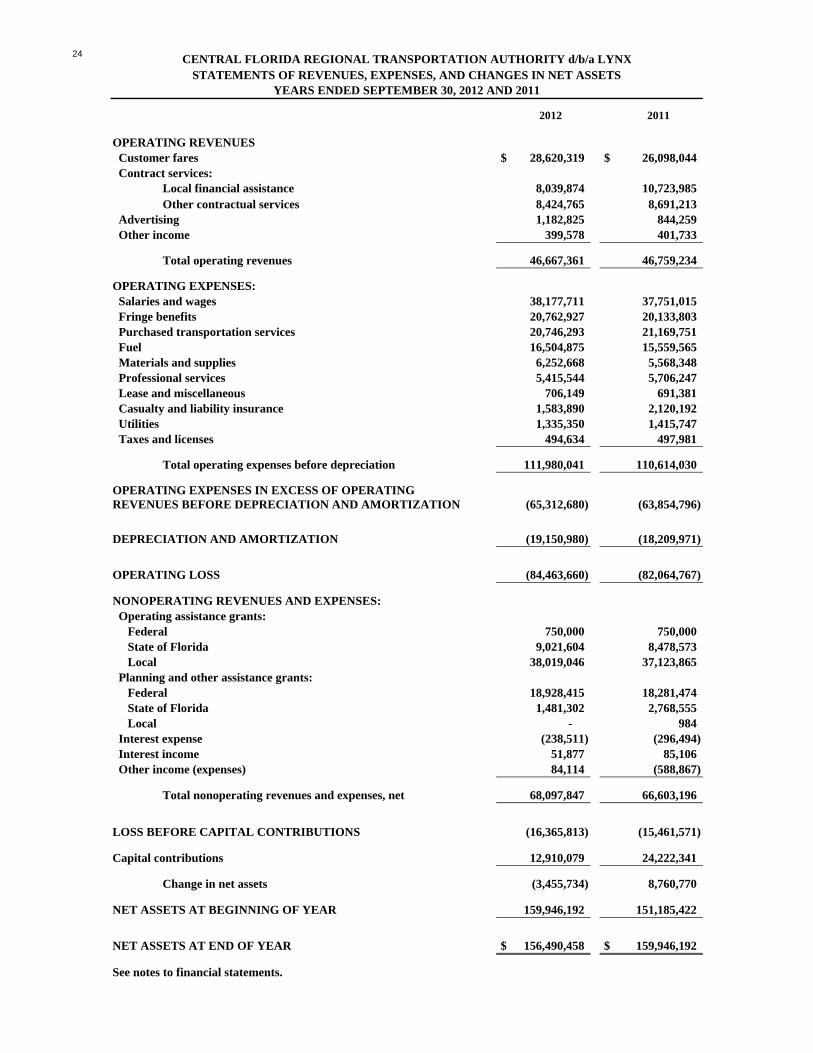
24 CENTRAL FLORIDA REGIONAL TRANSPORTATION AUTHORITY d/b/a LYNXSTATEMENTS OF REVENUES, EXPENSES, AND CHANGES IN NET ASSETS
YEARS ENDED SEPTEMBER 30, 2012 AND 2011
2012 2011
OPERATING REVENUES Customer fares $ 28,620,319 $ 26,098,044 Contract services:
Local financial assistance 8,039,874 10,723,985 Other contractual services 8,424,765 8,691,213
Advertising 1,182,825 844,259 Other income 399,578 401,733
Total operating revenues 46,667,361 46,759,234
OPERATING EXPENSES: Salaries and wages 38,177,711 37,751,015 Fringe benefits 20,762,927 20,133,803 Purchased transportation services 20,746,293 21,169,751 Fuel 16,504,875 15,559,565 Materials and supplies 6,252,668 5,568,348 Professional services 5,415,544 5,706,247 Lease and miscellaneous 706,149 691,381 Casualty and liability insurance 1,583,890 2,120,192 Utilities 1,335,350 1,415,747 Taxes and licenses 494,634 497,981
Total operating expenses before depreciation 111,980,041 110,614,030
OPERATING EXPENSES IN EXCESS OF OPERATINGREVENUES BEFORE DEPRECIATION AND AMORTIZATION (65,312,680) (63,854,796)
DEPRECIATION AND AMORTIZATION (19,150,980) (18,209,971)
OPERATING LOSS (84,463,660) (82,064,767)
NONOPERATING REVENUES AND EXPENSES: Operating assistance grants: Federal 750,000 750,000 State of Florida 9,021,604 8,478,573 Local 38,019,046 37,123,865 Planning and other assistance grants: Federal 18,928,415 18,281,474 State of Florida 1,481,302 2,768,555 Local - 984 Interest expense (238,511) (296,494) Interest income 51,877 85,106 Other income (expenses) 84,114 (588,867)
Total nonoperating revenues and expenses, net 68,097,847 66,603,196 LOSS BEFORE CAPITAL CONTRIBUTIONS (16,365,813) (15,461,571)
Capital contributions 12,910,079 24,222,341
Change in net assets (3,455,734) 8,760,770
NET ASSETS AT BEGINNING OF YEAR 159,946,192 151,185,422
NET ASSETS AT END OF YEAR $ 156,490,458 $ 159,946,192
See notes to financial statements.

25 CENTRAL FLORIDA REGIONAL TRANSPORTATION AUTHORITY d/b/a LYNXSTATEMENTS OF CASH FLOWS
YEARS ENDED SEPTEMBER 30, 2012 AND 2011
2012 2011
CASH FLOWS FROM OPERATING ACTIVITIES: Cash received from customers $ 28,620,319 $ 26,098,044 Cash received for contract services 16,753,192 19,466,141 Cash paid to employees (44,374,851) (43,795,354) Cash paid to suppliers (67,956,373) (64,303,819) Cash received from advertising and miscellaneous 1,718,389 1,165,535
Net cash used in operating activities (65,239,324) (61,369,453)
CASH FLOWS FROM NONCAPITAL FINANCING ACTIVITIES: Proceeds from assistance grants 72,503,577 67,086,206
Net cash provided by noncapital financing activities 72,503,577 67,086,206
CASH FLOWS FROM CAPITAL AND RELATEDFINANCING ACTIVITIES: Construction and acquisition of property and equipment (11,787,489) (23,624,070) Principal paid on loans and capital leases (1,867,114) (2,015,609) Interest paid on capital leases and SIB loans (238,511) (296,494) Capital assistance grants 11,949,610 22,249,907
Net cash provided by (used in) capital and related financing activities (1,943,504) (3,686,266)
CASH FLOWS FROM INVESTING ACTIVITIES: Interest income 51,877 85,106 Pool B investment withdrawals 112,931 72,588
Net cash provided by investing activities 164,808 157,694
NET CHANGE IN CASH AND CASH EQUIVALENTS 5,485,557 2,188,181
CASH AND CASH EQUIVALENTS, BEGINNING OF YEAR 30,691,478 28,503,297
CASH AND CASH EQUIVALENTS, END OF YEAR $ 36,177,035 $ 30,691,478
RECONCILIATION OF OPERATING LOSS TO NET CASH USEDIN OPERATING ACTIVITIES:
Operating Loss $ (84,463,660) $ (82,064,767)
Adjustments to reconcile operating loss to net cash used in operating activities: Depreciation and Amortization 19,150,980 18,209,971
Changes in operating assets and liabilities: Local, Trade, and Operating Assistance Receivable 424,539 (29,514) Inventory (128,683) 147,025 State fuel tax refund receivable (108,089) (31,730) Prepaid expenses and other assets 11,710 4,660 Accounts payable 38,201 2,747,361 Accrued salaries and related taxes 414,457 (998,740) Accrued compensated absences 95,843 (122,329) Accrued self-insurance liability (674,622) 768,610
Net cash used in operating activities $ (65,239,324) $ (61,369,453)
NONCASH INVESTING ACTIVITY: Unrealized gain on investments $ 112,931 $ 70,561
See notes to financial statements.

26
CENTRAL FLORIDA REGIONAL TRANSPORTATION AUTHORITY d/b/a LYNX
NOTES TO FINANCIAL STATEMENTS YEARS ENDED SEPTEMBER 30, 2012 AND 2011
1. SIGNIFICANT ACCOUNTING POLICIES
Organization - The Central Florida Regional Transportation Authority (the “Authority”) was created in 1989 pursuant to Section 343.63, Florida Statutes. This same legislation was amended in 1993, allowing the Authority to assume the operations of the entity formerly known as Central Florida Commuter Rail Authority and providing an opportunity to merge with the local transportation provider, Orange-Seminole-Osceola Transportation Authority (OSOTA) d/b/a LYNX, thereby, creating a one-stop public transportation entity. The Authority continues to use LYNX as its doing business as name and serves as the focal point in developing all modes of public transportation in the Central Florida region. Through formal action by both the Authority and OSOTA Board of Directors, the merger of the two organizations was ratified March 1994 and became effective October 1, 1994. The Authority provides public transportation services to the general public in the Orlando, Florida metropolitan area--Orange County, Seminole County, and Osceola County.
Reporting Entity - The Authority is a stand-alone governmental unit.
Basis of Accounting – The Authority accounts for its activities through the use of an enterprise fund. Enterprise funds are used to account for activities similar to those found in the private sector, where the determination of a change in financial position is necessary or useful for sound financial administration (business-type activities). Because the Authority has only business-type activities, it is considered to be a special-purpose government for financial reporting under Governmental Accounting Standards Board (GASB) No. 34 Basic Financial Statements-and Management’s Discussion and Analysis-for State and Local Governments (GASB 34). Accordingly, the Authority only presents fund financial statements as defined in GASB 34. The financial statements are reported using the economic resources measurement focus and the accrual basis of accounting. Under the accrual basis, revenues are recognized when earned and expenses when incurred. The Authority’s property and equipment acquisitions and operations are subsidized by the Federal Transit Administration, the Florida Department of Transportation, and local governments. Capital grants for the acquisition of property and equipment (reimbursement type grants) are recorded as grant receivables and credited to capital contributions when the related qualified expenditures are incurred. Unrestricted net assets consist of state and local government operating subsidies received in excess of net expenses. The Authority has elected not to apply Financial Accounting Standards Board Statements and Interpretations issued after November 30, 1989, as permitted by GASB No. 20, Accounting and Financial Reporting for Proprietary Funds and Other Governmental Entities that use Proprietary Fund Accounting.
Cash and Cash Equivalents and Investments - For purposes of the statements of cash flows, the Authority considers all investments with a maturity of three months or less when purchased to be cash equivalents. All cash and cash equivalents are insured by the Federal Deposit Insurance Corporation or are considered insured by the State of Florida collateral pool. The State of Florida collateral pool is a multiple financial institution pool with the ability to assess its members for collateral shortfalls if a member institution fails.
The Authority’s policy allows for investments in the Local Governmental Surplus Funds Investment Pool (the “Pool”), which is administered by the State Board of Administration of Florida. The Pool includes direct obligations of the United States government or its agencies and instrumentalities, interest bearing time deposits or saving accounts, mortgage-backed securities, collateralized mortgage obligations, bankers acceptance, commercial paper, repurchase agreements, and shares in common-law trust established under Florida Statutes Section 163.01. The Pool allocates investment earnings to participants monthly, based on a prorated dollar days participation of each account in the Pool.
The Authority held investments throughout fiscal years 2012 and 2011 in the Pool, which are considered cash and cash equivalents for financial reporting purposes. During fiscal year 2008 some securities were downgraded and the

27
Pool was subdivided into Pool A and Pool B. During fiscal year 2009, Pool A was renamed “Florida PRIME” by the SBA. The Authority presents all investments at fair value as follows:
September 30, 2012 2011
Pool Investments -Florida PRIME $ 153,389 $ 53,685 Pool Investments -Pool B 438,430 424,882 Bank Deposits 36,023,646 30,637,793 Total Cash and Cash Equivalents and Investments $ 36,615,465 $ 31,116,360
Florida PRIME qualifies under GASB 31, Accounting and Financial Reporting for Certain Investments and for External Investment Pools, to be treated as a “2a-7 like pool” because it has a policy that it will, and does, operate in a manner consistent with Rule 2a-7 under the Investment Company Act of 1940. The current rating of Florida PRIME by Standard and Poors is AAAm and the weighted average days to maturity at September 30, 2012 were 39 days. Pool B is not rated by any nationally recognized statistical rating agency and has a weighted life at September 30, 2012 of 4.08 years. The securities in Florida PRIME are presented at fair value based on $1 per share and securities in Pool B are presented at estimated fair value (cost less unrealized loss) based on an independently calculated fair value factor of .94896811 at September 30, 2012 and .7568386 at September 30, 2011. It is the policy of the Authority to diversify its investment portfolios so as to protect against issuer defaults, market price changes, technical complications leading to temporary lack of liquidity, or other risks resulting from an over concentration of assets in a specific maturity, a specific issuer, a specific geographical distribution, or a specific class of securities. The Authority’s investment policy’s objectives are preservation of the principal of funds within its portfolio, ensure that funds are available to meet reasonably anticipated cash flow requirements, and maximize return on investments, while meeting the established quality, safety and liquidity restrictions. To limit credit risk, in addition to diversification, the Authority has established a list of authorized investments, the principal ones are: (1) The Local Government Surplus Funds Trust Fund; (2) United States Treasury and Agency securities; (3) Interest-bearing time deposits or savings accounts in Qualified Public Depositories; (4) Obligations of the Federal Farm Credit Banks and the Federal Home Loan Mortgage Corporation; and (5) Deposits, federal funds or bankers acceptance of any domestic bank.
Receivables - Local, Trade, Operating Assistance – Includes receivables from customers, Local Funding Partners and Medicaid Assistance. As of September 30, 2012 and 2011, the Authority had receivables, net of allowances, as follows:
September 30, 2012 2011
Customers $ 1,368,548 $ 1,205,618 Local Funding Partners 207,543 368,613 Medicaid Assistance 1,000,948 1,419,597 Total $ 2,577,039 $ 2,993,828
Inventory - Inventory, consisting of minor repair parts and fuel, is valued at the lower of cost or market. Cost is determined using the first-in, first-out method.
State Fuel Tax Refund - Represents claims refundable from the State of Florida Department of Revenue for fuel tax.
Restricted Assets - When both restricted and unrestricted resources are available for use, the Authority’s policy is to use restricted resources first, and then unrestricted resources, as they are needed. Restricted assets include $7,066,850 and $5,289,360 of cash and cash equivalents for the FlexBus Project, LYMMO East-West Project, planning projects, shelters, bus procurement and other enhancements, and various capital projects as of September 30, 2012 and 2011, respectively.

28
Property and Equipment - Property and equipment in the amount of $300 or more is recorded at historical cost and depreciated over the following estimated useful lives using the straight-line method:
Years Buildings and shelters 3 - 30
Revenue vehicles 5 - 9
Equipment 3 - 12
Leasehold improvements (shorter of useful lives or lease term) 5 - 10
The remaining construction work in progress primarily relates to design, engineering and construction costs of LYMMO BRT expansion projects, LYNX Central Station Improvements, LYNX Operations Center Modifications, Bus Shelters, Computer Aided Dispatch/Automated Vehicle Locator (CAD/AVL), and other projects. Depreciation commences when projects are completed and the underlying fixed assets are available for use.
Accounts Payable - Accounts payable are recorded as expenses at the time services are rendered and the Authority receives items. As of September 30, 2012 and 2011, the Authority had accounts payable as follows:
September 30, 2012 2011
Trade $ 5,721,750 $ 5,135,443 Commitments (Consultants/Construction) 669,829 657,401 Retainage 27,134 174,767 Other 3,071,116 3,484,017 Total $ 9,489,829 $ 9,451,628
Accrued Compensated Absences - The Authority recognizes the accrual of compensated absences in accordance with GASB No. 16, Accounting for Compensated Absences, accruing vacation pay benefits as earned and sick pay benefits as vested by its employees.
September 30, 2012 2011
Accrued compensated absences liability, beginning of year $ 4,257,367 $ 4,379,696 Obligations 3,926,608 3,633,678 Payments (3,830,765) (3,756,007) Accrued compensated absences liability, end of year $ 4,353,210 $ 4,257,367
Amount due within one year $ 3,830,765 $ 3,756,007
Accrued Self-Insurance Liability - The Authority has a self-insurance program for public liability claims and workers compensation. Estimated claims are accrued in the year expenses are incurred to the extent payment is probable and subject to reasonable estimation.
Deferred Operating Revenue - Deferred operating revenue consists of revenue not yet recognized because services have not yet been rendered, although related cash has been received.
Net Assets - Net assets represents net assets invested in capital assets, net of related debt, restricted assets and unrestricted earnings.
Use of Estimates - The preparation of financial statements in conformity with accounting principles generally accepted in the United States requires management to make estimates and assumptions that affect the reported amounts of assets and liabilities, the disclosure of contingent assets and liabilities at the date of the financial statements, and the reported amounts of revenue and expenses during the reporting period. Actual results could differ from those estimates. Operating Revenues - Transactions reported as operating revenues are those that arise from the activities of
29
primary ongoing operations. Those include: Customer Fares, Contract Services, Advertising and Other Operating Income. Customer fares are recorded as revenue at the time services are performed and revenues pass through the fare box. Contract services are recorded as revenue when services are provided, consisting primarily of bus services to area cities and counties that are funded based on hours of service and paratransit services funded through Medicaid, Transportation Disadvantage, and other means.
Nonoperating Revenues - Transactions reported in the nonoperating revenue category include government subsidies that are not contingent on service hours or other designated criteria, including Federal, State and Local Operating, Planning, and other grant assistance, as well as interest income and gains on the sales of capital assets, if applicable.
Operating Expenses - Transactions reported as operating expenses are those that arise from the activities of primary ongoing operations. Those include: Salaries and Wages, Fringe Benefits, Purchased Transportation Services, Fuel, Materials and Supplies, Professional Services, Leases and Miscellaneous, Casualty and Liability Insurance, Utilities, Taxes and Licenses.
Nonoperating Expenses - Transactions reported in the nonoperating expense category include those that do not arise from the activities of primary ongoing operations. These include interest expense for leases and loans as well as losses on the sales of capital assets, if applicable.
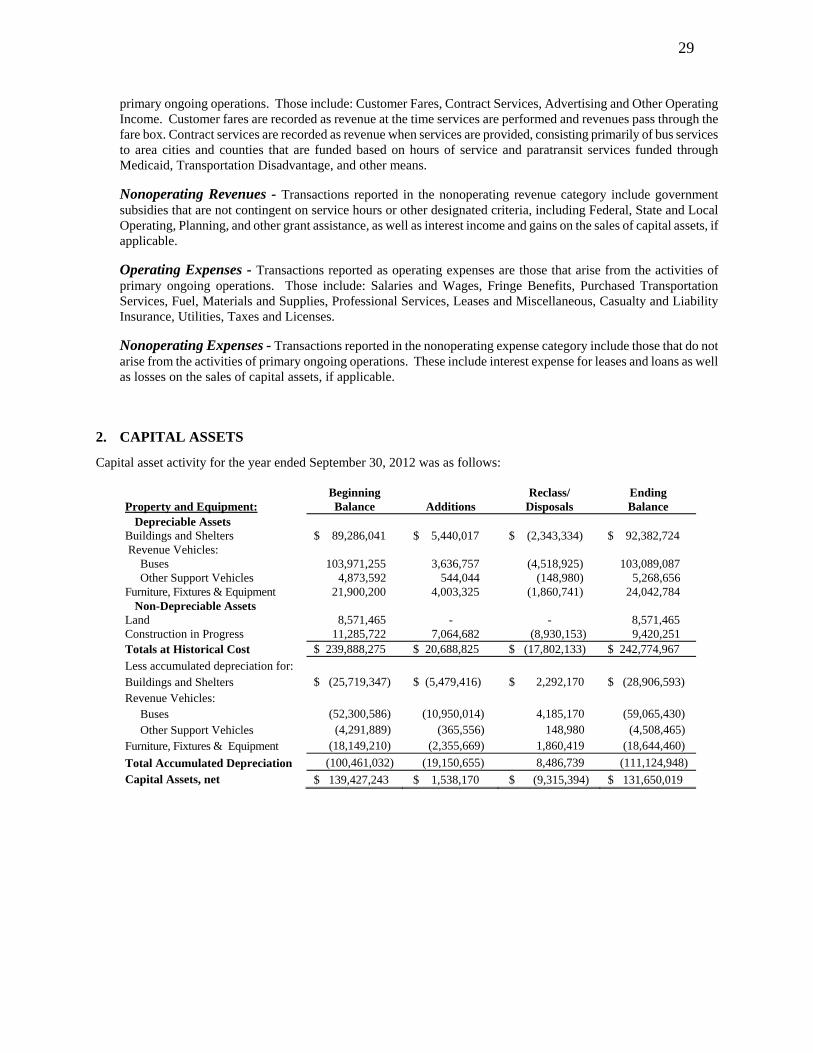
2. CAPITAL ASSETS
Capital asset activity for the year ended September 30, 2012 was as follows:
Property and Equipment:
Beginning Balance
Additions
Reclass/ Disposals
Ending Balance
Depreciable Assets Buildings and Shelters $ 89,286,041 $ 5,440,017 $ (2,343,334) $ 92,382,724 Revenue Vehicles: Buses 103,971,255 3,636,757 (4,518,925) 103,089,087 Other Support Vehicles 4,873,592 544,044 (148,980) 5,268,656 Furniture, Fixtures & Equipment 21,900,200 4,003,325 (1,860,741) 24,042,784
Non-Depreciable Assets Land 8,571,465 - - 8,571,465 Construction in Progress 11,285,722 7,064,682 (8,930,153) 9,420,251 Totals at Historical Cost $ 239,888,275 $ 20,688,825 $ (17,802,133) $ 242,774,967
Less accumulated depreciation for: Buildings and Shelters $ (25,719,347) $ (5,479,416) $ 2,292,170 $ (28,906,593) Revenue Vehicles: Buses (52,300,586) (10,950,014) 4,185,170 (59,065,430) Other Support Vehicles (4,291,889) (365,556) 148,980 (4,508,465) Furniture, Fixtures & Equipment (18,149,210) (2,355,669) 1,860,419 (18,644,460)
Total Accumulated Depreciation (100,461,032) (19,150,655) 8,486,739 (111,124,948)
Capital Assets, net $ 139,427,243 $ 1,538,170 $ (9,315,394) $ 131,650,019
30
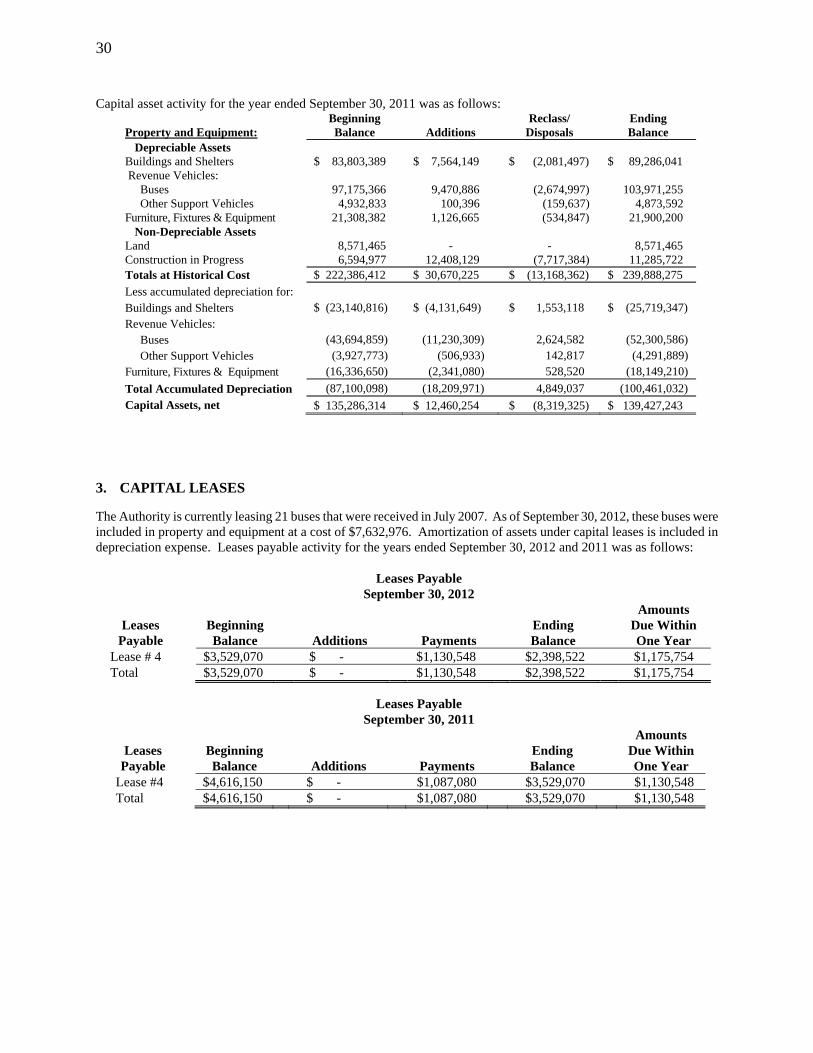
Capital asset activity for the year ended September 30, 2011 was as follows: Property and Equipment:
Beginning Balance
Additions
Reclass/ Disposals
Ending Balance
Depreciable Assets Buildings and Shelters $ 83,803,389 $ 7,564,149 $ (2,081,497) $ 89,286,041 Revenue Vehicles: Buses 97,175,366 9,470,886 (2,674,997) 103,971,255 Other Support Vehicles 4,932,833 100,396 (159,637) 4,873,592 Furniture, Fixtures & Equipment 21,308,382 1,126,665 (534,847) 21,900,200
Non-Depreciable Assets Land 8,571,465 - - 8,571,465 Construction in Progress 6,594,977 12,408,129 (7,717,384) 11,285,722 Totals at Historical Cost $ 222,386,412 $ 30,670,225 $ (13,168,362) $ 239,888,275
Less accumulated depreciation for: Buildings and Shelters $ (23,140,816) $ (4,131,649) $ 1,553,118 $ (25,719,347) Revenue Vehicles: Buses (43,694,859) (11,230,309) 2,624,582 (52,300,586) Other Support Vehicles (3,927,773) (506,933) 142,817 (4,291,889) Furniture, Fixtures & Equipment (16,336,650) (2,341,080) 528,520 (18,149,210)
Total Accumulated Depreciation (87,100,098) (18,209,971) 4,849,037 (100,461,032)
Capital Assets, net $ 135,286,314 $ 12,460,254 $ (8,319,325) $ 139,427,243
3. CAPITAL LEASES
The Authority is currently leasing 21 buses that were received in July 2007. As of September 30, 2012, these buses were included in property and equipment at a cost of $7,632,976. Amortization of assets under capital leases is included in depreciation expense. Leases payable activity for the years ended September 30, 2012 and 2011 was as follows:
Leases Payable
September 30, 2012
Leases Payable
Beginning Balance
Additions
Payments
Ending Balance
Amounts Due Within One Year
Lease # 4 $3,529,070 $ - $1,130,548 $2,398,522 $1,175,754 Total $3,529,070 $ - $1,130,548 $2,398,522 $1,175,754
Leases Payable September 30, 2011
Leases Payable
Beginning Balance
Additions
Payments
Ending Balance
Amounts Due Within One Year
Lease #4 $4,616,150 $ - $1,087,080 $3,529,070 $1,130,548 Total $4,616,150 $ - $1,087,080 $3,529,070 $1,130,548
31
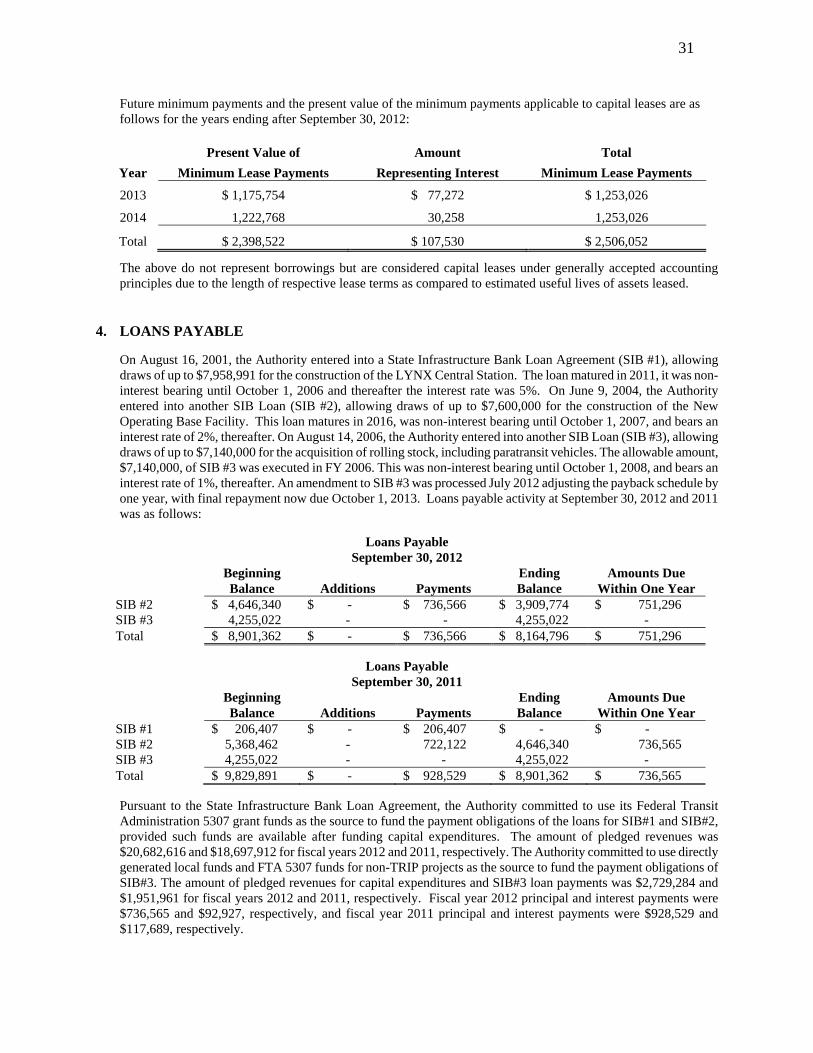
Future minimum payments and the present value of the minimum payments applicable to capital leases are as follows for the years ending after September 30, 2012:
Present Value of Amount Total
Year Minimum Lease Payments Representing Interest Minimum Lease Payments
2013 $ 1,175,754 $ 77,272 $ 1,253,026
2014 1,222,768 30,258 1,253,026
Total $ 2,398,522 $ 107,530 $ 2,506,052
The above do not represent borrowings but are considered capital leases under generally accepted accounting principles due to the length of respective lease terms as compared to estimated useful lives of assets leased.
4. LOANS PAYABLE
On August 16, 2001, the Authority entered into a State Infrastructure Bank Loan Agreement (SIB #1), allowing draws of up to $7,958,991 for the construction of the LYNX Central Station. The loan matured in 2011, it was non-interest bearing until October 1, 2006 and thereafter the interest rate was 5%. On June 9, 2004, the Authority entered into another SIB Loan (SIB #2), allowing draws of up to $7,600,000 for the construction of the New Operating Base Facility. This loan matures in 2016, was non-interest bearing until October 1, 2007, and bears an interest rate of 2%, thereafter. On August 14, 2006, the Authority entered into another SIB Loan (SIB #3), allowing draws of up to $7,140,000 for the acquisition of rolling stock, including paratransit vehicles. The allowable amount, $7,140,000, of SIB #3 was executed in FY 2006. This was non-interest bearing until October 1, 2008, and bears an interest rate of 1%, thereafter. An amendment to SIB #3 was processed July 2012 adjusting the payback schedule by one year, with final repayment now due October 1, 2013. Loans payable activity at September 30, 2012 and 2011 was as follows:
Loans Payable September 30, 2012
Beginning Balance Additions Payments
Ending Balance
Amounts Due Within One Year
SIB #2 $ 4,646,340 $ - $ 736,566 $ 3,909,774 $ 751,296 SIB #3 4,255,022 - - 4,255,022 - Total $ 8,901,362 $ - $ 736,566 $ 8,164,796 $ 751,296
Loans Payable September 30, 2011
Beginning Balance Additions Payments
Ending Balance
Amounts Due Within One Year
SIB #1 $ 206,407 $ - $ 206,407 $ - $ - SIB #2 5,368,462 - 722,122 4,646,340 736,565 SIB #3 4,255,022 - - 4,255,022 - Total $ 9,829,891 $ - $ 928,529 $ 8,901,362 $ 736,565
Pursuant to the State Infrastructure Bank Loan Agreement, the Authority committed to use its Federal Transit Administration 5307 grant funds as the source to fund the payment obligations of the loans for SIB#1 and SIB#2, provided such funds are available after funding capital expenditures. The amount of pledged revenues was $20,682,616 and $18,697,912 for fiscal years 2012 and 2011, respectively. The Authority committed to use directly generated local funds and FTA 5307 funds for non-TRIP projects as the source to fund the payment obligations of SIB#3. The amount of pledged revenues for capital expenditures and SIB#3 loan payments was $2,729,284 and $1,951,961 for fiscal years 2012 and 2011, respectively. Fiscal year 2012 principal and interest payments were $736,565 and $92,927, respectively, and fiscal year 2011 principal and interest payments were $928,529 and $117,689, respectively.

32
Repayments to be made in fiscal years 2013 through 2017 are as follows:
Fiscal Year Principal Interest Total 2013 $ 751,296 $ 207,126 $ 958,422 2014 5,021,344 105,720 5,127,064 2015 781,649 47,843 829,492 2016 797,282 32,210 829,492 2017 813,225 16,265 829,490
Totals $ 8,164,796 $ 409,164 $ 8,573,960
5. ACCRUED SELF-INSURANCE LIABILITY
The Authority has been self-insured since 1986 for personal injury coverage related to its transit coaches and since 1991 for workers compensation coverage; all other risks of loss are covered through the purchase of commercial insurance. The Authority has sovereign immunity with respect to personal injury claims, which limits its liability to $100,000 for each claim and $200,000 for each accident. Settled claims have not exceeded commercial coverage in any of the past three fiscal years.
The amounts recorded as accrued self-insurance liability at September 30, 2012 and 2011, the current portion of which represents an estimate of payments required in the next fiscal year, are at present value based on estimates derived through actuarial determinations discounted at a range of 4% for the fiscal years 2012 and 2011. Such estimates are subject to change based on circumstances surrounding each claim. Changes in the balances of accrued self-insurance liability, including incurred but not reported claims (IBNR), were as follows during the years ended:
September 30 2012 2011
Accrued self-insurance liability, beginning of year $ 5,407,644 $ 4,639,034 Insured claims (including IBNR’s) 1,583,890 2,120,192 Claim payments (2,258,512) (1,351,582) Accrued self-insurance liability, end of year $ 4,733,022 $ 5,407,644
The estimated amounts due in one year are $2,128,388 and $1,835,748 at September 30, 2012 and 2011, respectively.
6. PENSION PLANS
State Plan - Plan Description
There are six (6) employees of the Authority who are not represented by the Amalgamated Transit Union (the “Union”) and are participants in the Florida Retirement System (FRS), a cost-sharing multiple-employer public employee retirement system (PERS) administered by the Florida Department of Administration. Employees not filling regular established positions but working as temporary employees are not covered by the FRS. The Authority participated in the regular FRS class of membership, with a contribution rate of 7.91% and 10.77% in effect during the State’s fiscal years ended June 30, 2012 and June 30, 2011 respectively. Contribution rates equal actuarially determined rates. Beginning July 2011, employers were required to contribute at a rate of 4.91% and employees were required to contribute at a rate of 3.00%.
Benefits are established by Chapter 121, Florida Statutes, and Chapter 22B, Florida Administrative Code. Amendments to the law can be made only by an act of the Florida Legislature. Benefits are computed on the basis of age, average final compensation, and service credit. Members are also eligible for in-line-of duty or regular disability benefits, if permanently disabled and unable to work. Regular class employees who retire at or after age 62 with 6 years of credited service or 30 years of service regardless of age are entitled to a retirement benefit payable monthly for life, equal to 1.6% of their final average compensation for each year of credited service. Vested employees with less than 30 years of service may retire before age 62 and receive reduced retirement benefits. A post-employment health insurance subsidy is also provided to eligible retirement employees through the FRS in accordance with Florida Statutes. Section 121.031 (3), Florida Statutes requires that an actuarial valuation of FRS be performed biannually. The
33
conclusions of the valuation and historical trend data are included in the annual report of the FRS. Further information about the progress made by the FRS in accumulating sufficient assets to pay benefits when due, including 10-year historical trend information, is included in the State of Florida Comprehensive Annual Financial Report and various publications available from the Florida Department of Administration.
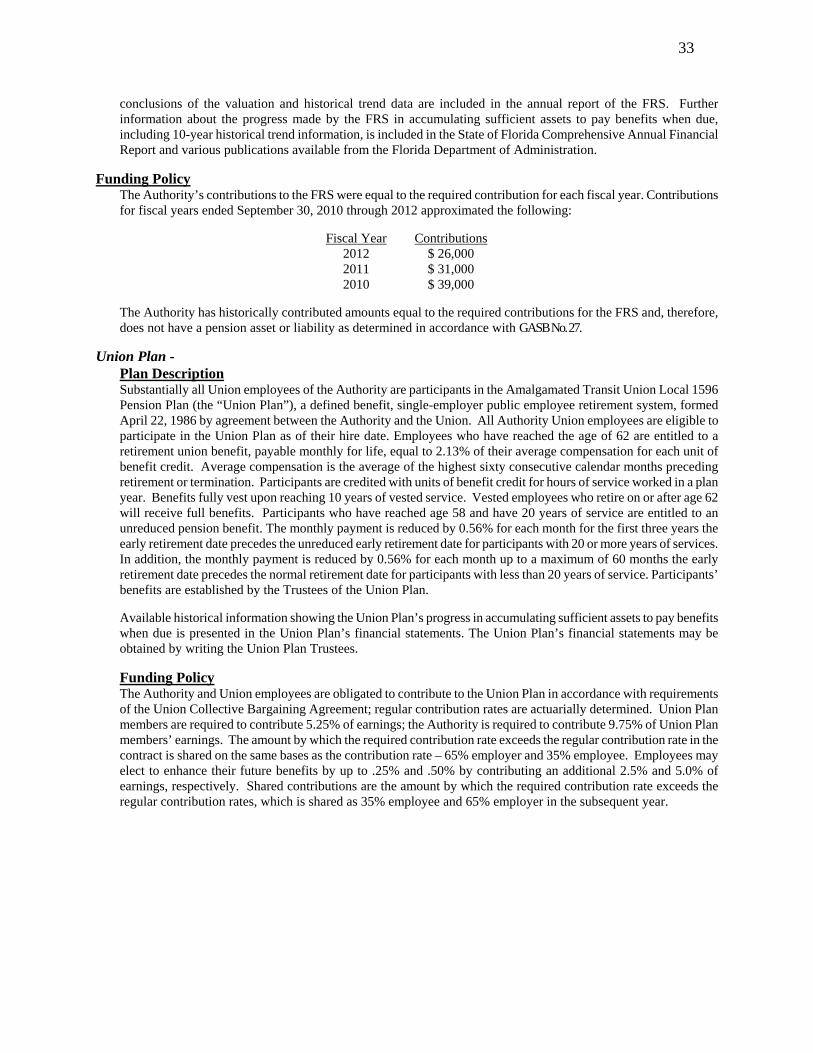
Funding Policy The Authority’s contributions to the FRS were equal to the required contribution for each fiscal year. Contributions for fiscal years ended September 30, 2010 through 2012 approximated the following:
Fiscal Year Contributions 2012 $ 26,000 2011 $ 31,000 2010 $ 39,000
The Authority has historically contributed amounts equal to the required contributions for the FRS and, therefore, does not have a pension asset or liability as determined in accordance with GASB No. 27.
Union Plan - Plan Description
Substantially all Union employees of the Authority are participants in the Amalgamated Transit Union Local 1596 Pension Plan (the “Union Plan”), a defined benefit, single-employer public employee retirement system, formed April 22, 1986 by agreement between the Authority and the Union. All Authority Union employees are eligible to participate in the Union Plan as of their hire date. Employees who have reached the age of 62 are entitled to a retirement union benefit, payable monthly for life, equal to 2.13% of their average compensation for each unit of benefit credit. Average compensation is the average of the highest sixty consecutive calendar months preceding retirement or termination. Participants are credited with units of benefit credit for hours of service worked in a plan year. Benefits fully vest upon reaching 10 years of vested service. Vested employees who retire on or after age 62 will receive full benefits. Participants who have reached age 58 and have 20 years of service are entitled to an unreduced pension benefit. The monthly payment is reduced by 0.56% for each month for the first three years the early retirement date precedes the unreduced early retirement date for participants with 20 or more years of services. In addition, the monthly payment is reduced by 0.56% for each month up to a maximum of 60 months the early retirement date precedes the normal retirement date for participants with less than 20 years of service. Participants’ benefits are established by the Trustees of the Union Plan.
Available historical information showing the Union Plan’s progress in accumulating sufficient assets to pay benefits when due is presented in the Union Plan’s financial statements. The Union Plan’s financial statements may be obtained by writing the Union Plan Trustees.
Funding Policy The Authority and Union employees are obligated to contribute to the Union Plan in accordance with requirements of the Union Collective Bargaining Agreement; regular contribution rates are actuarially determined. Union Plan members are required to contribute 5.25% of earnings; the Authority is required to contribute 9.75% of Union Plan members’ earnings. The amount by which the required contribution rate exceeds the regular contribution rate in the contract is shared on the same bases as the contribution rate – 65% employer and 35% employee. Employees may elect to enhance their future benefits by up to .25% and .50% by contributing an additional 2.5% and 5.0% of earnings, respectively. Shared contributions are the amount by which the required contribution rate exceeds the regular contribution rates, which is shared as 35% employee and 65% employer in the subsequent year.
34
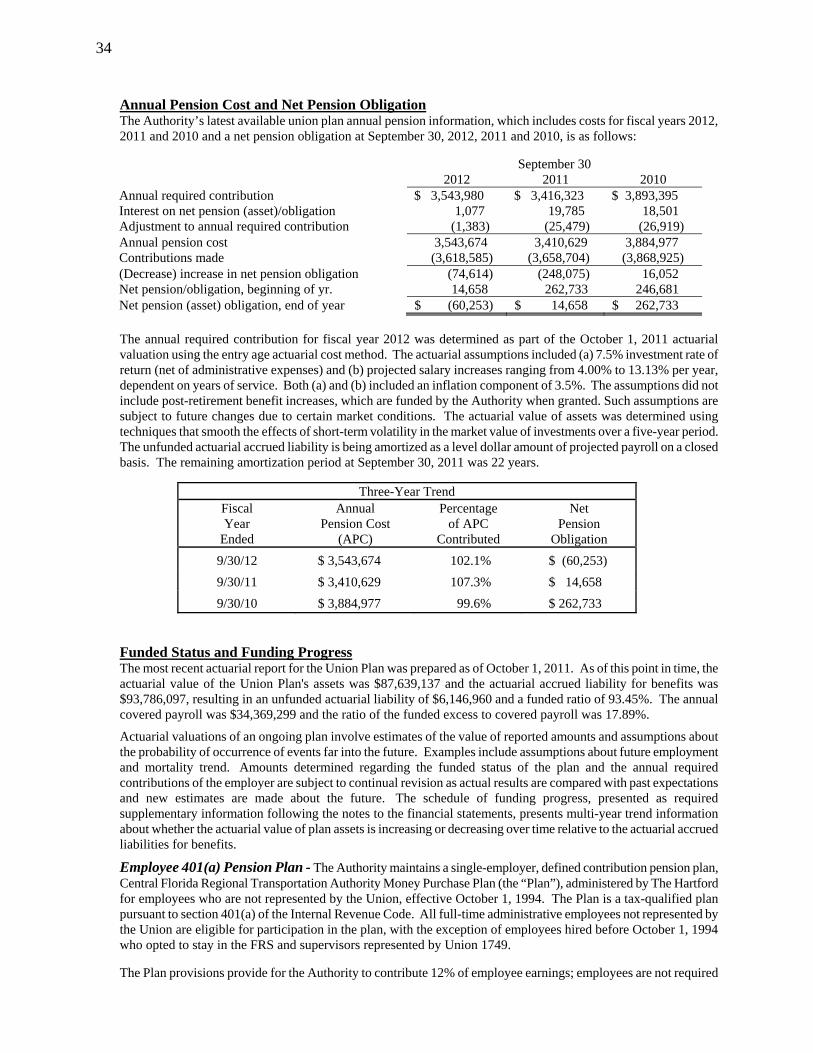
Annual Pension Cost and Net Pension Obligation The Authority’s latest available union plan annual pension information, which includes costs for fiscal years 2012, 2011 and 2010 and a net pension obligation at September 30, 2012, 2011 and 2010, is as follows:
September 30 2012 2011 2010 Annual required contribution $ 3,543,980 $ 3,416,323 $ 3,893,395 Interest on net pension (asset)/obligation 1,077 19,785 18,501 Adjustment to annual required contribution (1,383) (25,479) (26,919) Annual pension cost 3,543,674 3,410,629 3,884,977 Contributions made (3,618,585) (3,658,704) (3,868,925) (Decrease) increase in net pension obligation (74,614) (248,075) 16,052 Net pension/obligation, beginning of yr. 14,658 262,733 246,681 Net pension (asset) obligation, end of year $ (60,253) $ 14,658 $ 262,733
The annual required contribution for fiscal year 2012 was determined as part of the October 1, 2011 actuarial valuation using the entry age actuarial cost method. The actuarial assumptions included (a) 7.5% investment rate of return (net of administrative expenses) and (b) projected salary increases ranging from 4.00% to 13.13% per year, dependent on years of service. Both (a) and (b) included an inflation component of 3.5%. The assumptions did not include post-retirement benefit increases, which are funded by the Authority when granted. Such assumptions are subject to future changes due to certain market conditions. The actuarial value of assets was determined using techniques that smooth the effects of short-term volatility in the market value of investments over a five-year period. The unfunded actuarial accrued liability is being amortized as a level dollar amount of projected payroll on a closed basis. The remaining amortization period at September 30, 2011 was 22 years.
Three-Year Trend Fiscal Year
Ended
Annual Pension Cost
(APC)
Percentage of APC
Contributed
Net Pension
Obligation
9/30/12 $ 3,543,674 102.1% $ (60,253)
9/30/11 $ 3,410,629 107.3% $ 14,658
9/30/10 $ 3,884,977 99.6% $ 262,733
Funded Status and Funding Progress The most recent actuarial report for the Union Plan was prepared as of October 1, 2011. As of this point in time, the actuarial value of the Union Plan's assets was $87,639,137 and the actuarial accrued liability for benefits was $93,786,097, resulting in an unfunded actuarial liability of $6,146,960 and a funded ratio of 93.45%. The annual covered payroll was $34,369,299 and the ratio of the funded excess to covered payroll was 17.89%.
Actuarial valuations of an ongoing plan involve estimates of the value of reported amounts and assumptions about the probability of occurrence of events far into the future. Examples include assumptions about future employment and mortality trend. Amounts determined regarding the funded status of the plan and the annual required contributions of the employer are subject to continual revision as actual results are compared with past expectations and new estimates are made about the future. The schedule of funding progress, presented as required supplementary information following the notes to the financial statements, presents multi-year trend information about whether the actuarial value of plan assets is increasing or decreasing over time relative to the actuarial accrued liabilities for benefits.
Employee 401(a) Pension Plan - The Authority maintains a single-employer, defined contribution pension plan, Central Florida Regional Transportation Authority Money Purchase Plan (the “Plan”), administered by The Hartford for employees who are not represented by the Union, effective October 1, 1994. The Plan is a tax-qualified plan pursuant to section 401(a) of the Internal Revenue Code. All full-time administrative employees not represented by the Union are eligible for participation in the plan, with the exception of employees hired before October 1, 1994 who opted to stay in the FRS and supervisors represented by Union 1749.
The Plan provisions provide for the Authority to contribute 12% of employee earnings; employees are not required

35
to make contributions. All plan amendments are administered and authorized by the Plan’s trustees. At the Plan’s inception, employees who switched from the FRS were automatically 100% vested and all other employees are 100% vested after five years of employment with the Authority or other public service or transportation agencies. All employees may withdraw vested balances upon the normal retirement age of 65. The Plan permits withdrawals for retirement, termination, and disability but does not allow participants to borrow against their accounts.
The payroll for Authority employees covered by the plan for the years ended September 30, 2012 and 2011 was $9,998,373 and $9,142,063 respectively. The Authority’s contribution to the plan for the years ended September 30, 2012 and 2011 amounted to $1,166,749 and $1,097,048 respectively, representing 12% of covered payroll less forfeitures.
7. POSTEMPLOYMENT BENEFITS OTHER THAN PENSION BENEFITS
In addition to the pension benefits described in Note 6, effective October 1, 1999, the Authority entered into a contractual agreement with Local 1596 of the Amalgamated Transit Union to provide postemployment health care benefits for those employees who, in accordance with Article 28 of the Amalgamated Transit Union Local 1596 Pension Plan, have at least ten (10) years vesting and retire between the ages of 62 and 67 or until they are eligible for Medicare benefits (whichever occurs first). Benefit provisions and contribution obligations have been established by the Authority’s Board. Eligibility for retirement health care benefits will be determined by the years of credited services.
In order to comply with the requirements of GASB 45, Accounting and Financial Reporting by Employers for Postemployment Benefits Other than Pensions, the Authority contracted with a certified actuarial firm to provide an actuarial valuation of postemployment benefits. The postemployment health insurance benefits will continue to be offered on a pay-as-you-go basis a percentage of the cost of the Consumer Driven Health Plan (CDHP, Employee Only) in accordance with the following schedule:
Years of Service Contribution Rate 10-14 60% of CDHP, Employee Only 15-19 75% of CDHP, Employee Only 20+ 100% of CDHP, Employee Only
Employees who elect to continue their health care coverage upon retirement are responsible for the employee and employer share over and above the previously stated contributions. Dependent coverage is available at the retiree’s expense provided the retiree elects to continue health care coverage. As required by the State of Florida Statute 112.08011, the claims experience of the retirees is co-mingled with active employees in determining the health plan cost. In accordance with GASB 45, the co-mingling of claims requirements equates to an implicit subsidy to retirees that creates another postemployment benefit (OPEB) liability on the part of the Authority. Therefore, the Authority will incur a liability at the beginning of this fiscal year for the implicit rate subsidy as the Authority implements GASB 45. The Authority does not intend to fund the actuarial accrued liability.
The Authority’s annual OPEB cost is calculated based on the annual required contribution (ARC) of the employer, an amount actuarially determined in accordance with the parameters of GASB 45. In the year of implementation, the net OPEB Obligation and the ARC are the same amount. The calculation produced an unfunded obligation of $248,924. The following table shows the components of the Authority’s OPEB cost for the year, the amount contributed to the plan, and changes in the Authority’s net OPEB obligation at September 30, 2012, 2011 and 2010, as follows:

36
September 30 2012 2011 2010 Annual required contribution $ 329,109 $ 335,849 $ 379,227 Interest on net OPEB obligation 29,148 19,249 9,957 Adjustment to annual required contribution (40,519) (26,759) (13,842) Annual OPEB cost 317,738 328,339 375,342 Contributions made (83,901) (80,873) (143,044) Increase in net OPEB obligation 233,837 247,466 232,298 Net OPEB obligation, beginning of year 728,688 481,222 248,924 Net OPEB obligation, end of year $ 962,525 $ 728,688 $ 481,222
As of the October 1, 2012 actuarial valuation date, the unfunded actuarial accrued liability (UAAL) was $4,074,600. The covered payroll (annual payroll of active employees covered by the OPEB Plan) was $38,177,711 and the ratio of the UAAL to the covered payroll was 10.7%. The Authority’s annual OPEB cost, the percentage of annual OPEB cost contributed to the plan, and the net OPEB obligation for the year are as follows:
Year Ending
Annual OPEB Cost
Percentage of OPEB Cost Contributed
Net OPEB Obligation September 30, 2012 $317,738 26.4% $962,525 September 30, 2011 $328,339 24.6% $728,688 September 30, 2010 $375,342 38.1% $481,222
(A schedule of funding progress is presented on page 39.)
Actuarial valuations of an ongoing plan involve estimates of the value of reported amounts and assumptions about probability of occurrence of events far into the future. Examples include assumptions about future employment, mortality, and the healthcare cost trend. Amounts determined regarding the funded status of the plan and the annual required contributions of the employer are subject to continual revision as actual results are compared with past expectations and new estimates are made about the future. The schedule of funding progress, presented as required supplementary information following the notes to the financial statements, presents multiyear trend information about whether the actuarial value of plan assets is increasing or decreasing over time relative to the actuarial accrued liabilities for benefits. (As an unfunded plan, there are no plan assets to report.) Projections of benefits for financial reporting purposes are based on the substantive plan (the plan as understood by the employer and the plan members) and include the types of benefits provided at the time of each valuation and the historical pattern of sharing of benefit costs between the employer and plan members to that point. The actuarial methods and assumptions used include techniques that are designed to reduce the effects of short term volatility in actuarial accrued liabilities and the actuarial value of assets consistent with the long-term perspective of the calculations. The information presented in the required supplementary schedule was determined as a part of the actuarial valuation at the date indicated:
Valuation date October 1, 2011 Actuarial cost method Entry age normal cost Amortization method Level dollar/open Remaining amortization period 30 years Asset valuation method Pay as you go Actuarial assumptions: Projected salary increases 2.50% Investment rate 4.0% per year Healthcare cost trend (including 2.50% inflation)
9% initially and 4.5% ultimately, in 2014

37
8. COMMITMENTS
Operating Lease - Total lease expense amounted to $164,562 and $164,794 during the years ended September 30, 2012 and 2011, respectively.
9. FUEL HEDGE SWAP AGREEMENTS
The Authority first entered into diesel fuel hedge swap agreements (“swaps”) during fiscal year 2011 in order to smooth out the fluctuation in diesel fuel cost and to set predetermined upper limits with respect to the cost of diesel fuel. Eight swaps have occurred through September 30, 2012 as follows:
Trade Total Quantity - Fixed Price Date Effective Date Gallons Per Gallon
05/15/12 10/01/12 – 09/30/13 840,000 $3.0125 05/17/12 10/01/12 – 09/30/13 840,000 $2.9400 06/29/12 10/01/12 – 09/30/13 756,000 $2.3800 06/29/12 10/01/12 – 09/30/13 1,104,000 $2.7300
Trade Total Quantity - Fixed Price Date Effective Date Gallons Per Gallon
05/03/11 05/01/11 – 10/31/11 720,000 $3.3160 05/06/11 05/06/11 – 10/31/11 360,000 $3.0050 05/06/11 11/01/11 – 09/30/12 1,430,000 $3.0420 09/23/11 11/01/11 – 09/30/12 770,000 $2.8900
Settlements with the counterparty are made monthly based on the difference between the number of gallons hedged at the fixed price and the number of gallons hedged at the average price per gallon based on the Gulf Coast Ultra Low Sulfur Diesel Platts U.S. Index (“Platts”). If the Platts price is higher than the fixed price the counterparty pays the Authority a settlement amount and if the fixed price is higher than the Platts price the Authority pays the counterparty. The Authority is exposed to basis risk on the swaps if the index on which fuel is purchased differs from the Platts index specified in the related fuel hedge agreements. During fiscal year 2012, the Authority purchased all diesel fuel from vendors using the Platts index.
The Authority is also exposed to rollover risk on the swaps to the extent that the maturities of fuel hedges differ from the timing of fuel purchases. To the extent there are timing differences, the Authority is re-exposed to the fuel price risks being hedged.
The swaps are considered effective hedges at September 30, 2012 under the dollar-offset method, which compares the changes in expected cash flows of the hedging instruments to the cash flows of the diesel fuel subjected to hedge. Accordingly, the swaps are presented at estimated fair value on the balance sheet, with $744,896 as a deferred outflow of resources and derivative financial instrument on the balance sheet at September 30, 2012. The estimated fair value of the swaps is determined based on contracted strike prices and applicable futures prices at September 30, 2012, and these values represent the change in fair value of the swaps during the fiscal year.
10. LITIGATION
The Authority is contingently liable with respect to lawsuits and other claims incidental to the ordinary course of its operation, most of which are covered by the self-insurance program discussed in Note 5. In the opinion of management, any adjustments that would result from the settlement of lawsuits and other claims would not be significant.

38
REQUIRED SUPPLEMENTARY INFORMATION
UNION PENSION PLAN
Schedule of Funding Progress
Valuation Dates, October 1
2011 2010 2009
Actuarial value of assets $ 87,639,137 $ 82,509,177 $ 76,104,519 Actuarial accrued liability 93,786,097 87,832,036 82,844,514 Unfunded actuarial liability $ 6,146,960 $ 5,322,859 $ 6,739,995 Funded Ratio 93.45% 93.94% 91.86%
Annual covered payroll $ 34,369,299 $ 35,059,922 $ 35,815,773 Unfunded actuarial liability as a percent of annual covered payroll 17.89% 15.18% 18.82%
Actuarial and Benefit Changes Changes in benefit provisions for the Union Pension Plan during prior fiscal years were as follows: Effective October 1, 2004, the Board of Trustees adopted several economic and demographic assumption changes based on the Five Year Experience Study issued November 2004. The combined changes caused the employer contribution to change from $3,060,496 to $3,056,186. Also, effective October 1, 2004, required employer contributions in excess of 9.75% of payroll will be shared between employer (65%) and employees (35%) beginning October 1, 2005. Effective November 9, 2004, amendment No. 4 allows a spouse to waive the joint and survivor form of annuity. Also, effective November 9, 2004, amendment No. 5 provides for an additional level of enhanced benefits. Members elect to receive an additional .25% of final average compensation for service during which they contribute an additional 2.5% of pay as a member contribution. This enhanced benefit is in addition to the previous enhanced benefit available. There is no impact on the plan. The increased member contribution supports the increased benefits. Effective May 10, 2005, amendment No. 6 makes changes in the administration of disability pension benefits. Effective for the contribution year beginning October 1, 2007 the mortality rates were updated to the 1994 Group Annual Mortality (GAM), eliminating the one year set ahead for males, and revised results from October 1, 2002 forward to hold a payable amount for Share Accounts.

39
REQUIRED SUPPLEMENTARY INFORMATION
Schedule of Other Postemployment Benefits (OPEB)
For the Years Ended September 30, 2012, 2011 and 2010
Schedule of Funding Progress
Actuarial Valuation Date
Actuarial Value of Assets
(a)
Actuarial Accrued Liability (normal
cost) Entry Age (b)
Unfunded Actuarial Accrued Liability (UAAL)
(b-a)
Funded Ratio (a/b)
Annual Covered Payroll
(c)
UAAL as a % of
Covered Payroll ((b-a)/c)
October 1, 2012 $ -
$4,074,600
$4,074,600
0.0% $38,177,711 10.7%
October 1, 2011 $ - $3,827,817 $3,827,817 0.0% $37,732,257 10.1% October 1, 2010 $ - $4,837,807 $4,837,807 0.0% $38,482,407 12.6%

40
CENTRAL FLORIDA REGIONAL TRANSPORTATION AUTHORITY d/b/a LYNXSUPPLEMENTAL SCHEDULE OF REVENUES AND EXPENSES
BUDGET VS ACTUAL (BUDGET BASIS)YEAR ENDED SEPTEMBER 30, 2012
Variance Favorable/
Budget Actual (Unfavorable)
OPERATING REVENUES Customer fares $ 23,409,583 $ 28,620,319 $ 5,210,736 Contract services:
Local financial assistance 7,446,887 8,039,874 592,987Other contractual services 9,047,941 8,424,765 (623,176)
Advertising -on Buses 1,105,000 1,182,825 77,825 Other income 435,361 399,578 (35,783)
Total operating revenues 41,444,772 46,667,361 5,222,589
OPERATING EXPENSES: Transportation 39,773,247 38,384,919 1,388,328 Maintenance and operations 61,139,279 61,420,132 (280,853) General and administrative 14,027,145 12,174,990 1,852,155
Total operating expenses before depreciation 114,939,671 111,980,041 2,959,630
OPERATING LOSS (73,494,899) (65,312,680) 8,182,219
NONOPERATING REVENUES/(EXPENSES): Federal 21,653,943 19,678,415 (1,975,528) State of Florida 10,519,010 10,502,906 (16,104) Local 37,994,046 38,019,046 25,000 Interest income 150,000 51,877 (98,123) Interest expense (238,511) (238,511) -
Total nonoperating revenues/(expenses), net 70,078,488 68,013,733 (2,064,755)
Increase/(decrease) in net assets $ (3,416,411) 2,701,053 $ 6,117,464
BASIS DIFFERENCES: Depreciation (19,150,980) Other income (expenses) 84,114
Capital contribution 12,910,079
Increase in net assets - GAAP basis $ (3,455,734)

Statistical Section
CENTRAL FLORIDA REGIONAL TRANSPORTATION AUTHORITY

41
STATISTICAL INFORMATION
This section contains statistical tables reflecting various supplemental financial data concerning the Authority’s operations.
Where applicable, a 10-year history has been depicted to disclose trends in financial operations and other finance-related
matters. These tables have been included as a part of this report for information purposes only, and, therefore, have not
been subjected to audit by the Authority’s independent auditors. Below is a summary of the components and purpose for
the tables provided here-in.
Pages
Debt Capacity
This schedule presents information to help the reader assess the ability of LYNX to service its
outstanding debt.
45
Revenue Capacity
These schedules contain information to help the reader assess LYNX’ most significant revenue sources. 46-48
Financial Trends
These schedules contain trend information to help the reader understand how LYNX’ financial
performance and financial position have changed over time.
43-44,
49-51,
59-61
Demographic and Economic Information
These schedules contain demographic and economic indicators to help the reader understand the
environment within which LYNX’ financial activities take place.
42,
52-57
Other Operating Information
These schedules contain service levels and capital asset data and insurance information to help the
reader understand how the information in LYNX’ financial report relates to the services the Authority
provides to its customers and the community.
58,
62-63

42
Source: Metro Orlando Economic Development Commission National Transportation Database Report
1,125,323
17,258,824
Five (5) Voting
Local Government (Independent Special District)
Area Population
Vehicle Miles Operated
Number of Service Routes
Vehicle Hours Operated
Hours of Operation
Average Weekday Passengers
Peak Vehicle Requirement
CENTRAL FLORIDA REGIONAL TRANSPORATION AUTHORITY
Miscellaneous StatisticsYear End September 30, 2012
(Unaudited)
LYNX
Form of Government
Number of Directors
92,319
225
66
4:00 a.m. to 3:10 a.m.
Counties Served
1,878,762
Orange, Seminole and Osceola

43
2003 2004 2005 2006 2007 2008 2009 2010 2011 2012Operating Revenue: Customer Fares 13.9$ 14.8$ 17.2$ 18.9$ 19.1$ 21.7$ 21.5$ 22.4$ 26.1$ 28.6$ Other 17.1 16.6 18.0 17.1 21.0 20.1 20.8 20.8 20.6 18.0 Total Operating Revenue 31.0 31.4 35.2 36.0 40.1 41.8 42.3 43.2 46.7 46.6
Operating Expenses: Administration, Transportation, and Maintenance 82.3 78.8 86.1 89.1 97.8 110.7 106.6 106.7 110.6 112.0 Depreciation 9.0 7.7 8.7 9.2 10.1 15.2 16.7 17.0 18.2 19.1 Write-off of Assets (Note 1) - - - - - - - - - - Total Operating Expenses 91.3 86.5 94.8 98.3 107.9 125.9 123.3 123.7 128.8 131.1
Operating Loss (60.3) (55.1) (59.6) (62.3) (67.8) (84.1) (81.0) (80.5) (82.1) (84.5)
Non-Operating Revenue (Expenses): Operating Assistance 33.7 35.1 37.6 38.9 53.1 50.1 54.3 48.9 46.4 47.8 Planning and Other Income (Expenses) 17.2 13.0 13.3 16.0 14.1 14.0 14.9 18.5 20.2 20.3 Capital Contributions 7.9 18.0 29.2 30.0 20.4 28.0 17.1 18.6 24.2 12.9 Total Non-Operating Revenue (Expenses) 58.8 66.1 80.1 84.9 87.6 92.1 86.3 86.0 90.8 81.0
Change in Net Assets (1.5)$ 11.0$ 20.5$ 22.6$ 19.8$ 8.0$ 5.3$ 5.5$ 8.7$ (3.5)$
Source: Financial Statements
For the past 10 years the chart shows the change in net assets each year versus the immediately preceding year. Since fiscal 2003, net assets year over year increased every year peakingin fiscal year 2006 at $22.6 million. The design, development and construction of the new LYNX Central Station (LCS) and LYNX Operations Center (LOC) , as well as the acquisitionof rolling stock and other capital assets caused a steep rise from fiscal year 2003, continuing through fiscal year 2006, with a decline in fiscal year 2007 with the completion ofconstruction at the LOC. The increase each fiscal year after fiscal year 2007 was relatively modest compared to fiscal year 2006. The 3.5 million decrease in fiscal year 2012 was belowthat of fiscal year 2011 due mainly to the completion of passenger amenities constructed with ARRA funds.
(Unaudited)
CENTRAL FLORIDA REGIONAL TRANSPORTATION AUTHORITY d/b/a
Revenue, Expenses, and Change in Net Assets
Dollars in Millions
LYNX
Last Ten Years
($10)
($5)
$0
$5
$10
$15
$20
$25
2003 2004 2005 2006 2007 2008 2009 2010 2011 2012
Dol
lars
in M
illi
ons
Year
Change in Net Assets

44
Year 2003 2004 2005 2006 2007 2008 2009 2010 2011 2012
Total Assets $79.4 $103.4 $130.1 $160.9 $178.5 $191.7 $190.9 $185.9 $194.3 $191.0 Total Liabilities $21.0 $34.0 $40.2 $48.3 $46.1 $51.3 $45.2 $34.7 $34.4 $34.5Ending Net Assets $58.4 $69.4 $89.9 $112.6 $132.4 $140.4 $145.7 $151.2 $159.9 $156.5
Invested in capital assets $49.6 $59.8 $80.2 $98.0 $110.2 $123.7 $123.5 $125.1 $131.1 $124.9
Restricted $0.0 $0.0 $0.0 $3.1 $1.3 $0.5 $0.5 $0.5 $0.5 $0.5Unrestricted $8.8 $9.6 $9.7 $11.5 $20.9 $16.2 $21.7 $25.6 $28.3 $31.1
Ending Net Assets $58.4 $69.4 $89.9 $112.6 $132.4 $140.4 $145.7 $151.2 $159.9 $156.5
This chart compares Total Assets, Total Liabilities, and Net Assets values over the last 10 years. Total Assets increased 140% during this periodas the Authority expanded service, acquired new rolling stock, developed land, and constructed the LYNX Central Station and LYNX OperationsCenter. Total Liabilities at the end of fiscal year 2012 are 64% higher than at the end of fiscal year 2003. The increase is due mainly toadditional State Infrastructure Bank loans taken in fiscal years 2004 and 2006, and a 2007 a lease agreement. Net Assets increased every year,except for fiscal years 2003 and 2012; at $156.5 million as of this fiscal year end they are 168% greater than at the end of fiscal year 2003.
CENTRAL FLORIDA REGIONAL TRANSPORTATION AUTHORITY d/b/a
Condensed Summary of Net AssetsLast Ten Years
Dollars in Millions(Unaudited)
LYNX
$-
$50
$100
$150
$200
$250
2003 2004 2005 2006 2007 2008 2009 2010 2011 2012
Dol
lars
in M
illi
ons
Total Assets Total Liabilities Net Assets

45
CENTRAL FLORIDA REGIONAL TRANSPORATION AUTHORITY d/b/aLYNX
Total DebtLast Ten Years
(Unaudited)
Year Total Debt SIB Loans Capital Leases
Annual Debt Service
PaymentsPledged
RevenuesDebt Service
CoverageMedian Income
Debt per Median Income
2003 $6,183,767 $6,000,000 $183,767 - $14,449,402 - $41,773 $148.032004 $11,830,468 $11,749,569 $80,899 - $15,210,218 - $43,159 $274.112005 $15,656,517 $15,558,991 $97,526 - $26,818,013 - $44,984 $348.052006 $21,722,909 $21,677,898 $45,011 $1,021,093 $32,413,802 31.74 $47,445 $457.852007 $25,331,967 $17,698,991 $7,632,976 $3,978,907 $22,551,897 5.67 $51,437 $492.492008 $22,662,882 $15,996,355 $6,666,527 $1,850,585 $33,529,785 18.12 $52,430 $432.252009 $18,576,071 $12,914,638 $5,661,433 $3,321,419 $24,881,390 7.49 $53,583 $346.682010 $14,446,041 $9,829,891 $4,616,150 $3,321,420 $17,211,000 5.18 $52,104 $277.252011 $12,430,432 $8,901,362 $3,529,070 $1,046,219 $20,649,873 19.74 $52,693 $235.902012 $10,563,319 $8,164,797 $2,398,522 $829,492 $23,411,900 28.22 $51,923 $203.44
Source: Financial Statements, NTD Report, and Orlando Economic Development Commission.
Note: Total debt consists of State Infrastructure Bank loans and capital lease obligations but annual debt service payments consist only of payments on State Infrastructure Bankloans. Available pledged revenues are for capital expenditures and debt service payments.
0
10,000,000
20,000,000
30,000,000
40,000,000
2003 2004 2005 2006 2007 2008 2009 2010 2011 2012
Annual Debt Service Payments and Pledged Revenues
Annual Debt Service Payments Pledged Revenues
$0
$100
$200
$300
$400
$500
Debt Service Per Median Income
Median Income

46
Fiscal Year Fares Other Total Local & State Federal Total Total Revenue2003 $13.902 $17.099 $31.001 $37.369 $13.974 $51.343 $82.3442004 $14.832 $16.593 $31.425 $36.912 $11.216 $48.128 $79.5532005 $17.184 $18.032 $35.216 $38.921 $11.887 $50.808 $86.0242006 $18.869 $17.134 $36.003 $39.757 $14.006 $53.763 $89.7662007 $19.127 $21.003 $40.130 $54.914 $11.103 $66.017 $106.1472008 $21.661 $20.179 $41.840 $51.997 $12.077 $64.074 $105.9142009 $21.454 $20.790 $42.244 $55.466 $14.509 $69.975 $112.2192010 $22.363 $20.800 $43.163 $51.684 $15.917 $67.601 $110.7642011 $26.098 $20.661 $46.759 $48.370 $19.031 $67.401 $114.1602012 $28.620 $18.047 $46.667 $48.521 $19.678 $68.199 $114.866
Source: Financial statements and schedules included in the Comprehensive Annual Financial Reports
The table and graph show the primary sources of revenues, the amount received from each source over the last ten years and,consequently, the Authority's relative dependency on each of the revenue sources. Local and state governments haveconsistently been the biggest providers of operating funds. Fares increased in 2012 due to greater ridership; fares were up9.6% compared to 2011. Although the increase in local & state revenues and federal assistanace offset the decrease in otherrevenues from 2011, total revenues were higher due to the increase in fares. The local and state economies remained sluggishthroughout 2012. In 2012 federal revenue continued its increasing trend amounting to 17.1% of LYNX's total revenue versus16.7% in 2011.
OPERATING ASSISTANCEMISCELLANEOUS REVENUEOPERATING AND OTHER
CENTRAL FLORIDA REGIONAL TRANSPORTATION AUTHORITY d/b/a
Revenue by SourceLast Ten Years
LYNX
(Unaudited)Dollars in Millions
0
10
20
30
40
50
60
2003 2004 2005 2006 2007 2008 2009 2010 2011 2012
Dol
lars
in M
illi
ons
Year
LYNX Revenue by Source
Fares Other Local & State Federal

47
OPERATING AND OTHERMISCELLANEOUS REVENUE OPERATING ASSISTANCE
FISCAL LOCAL & TOTALYEAR FARES OTHER TOTAL STATE FEDERAL TOTAL REVENUE
INDUSTRY
2003 32.6% 18.1% 50.7% 43.6% 5.7% 49.3% 100.0%
2004 32.9% 16.7% 49.6% 43.4% 7.0% 50.4% 100.0%
2005 32.4% 7.2% 39.6% 53.1% 7.3% 60.4% 100.0%
2006 33.2% 7.0% 40.2% 52.1% 7.7% 59.8% 100.0%
2007 31.4% 6.5% 37.9% 54.6% 7.5% 62.1% 100.0%
2008 31.3% 6.4% 37.7% 55.3% 7.0% 62.3% 100.0%
2009 31.5% 5.8% 37.4% 54.4% 8.2% 62.6% 100.0%
2010 32.1% 5.4% 37.5% 53.1% 9.4% 62.5% 100.0%
2011 * * 0.0% * * 0.0% 0.0%
2012 * * 0.0% * * 0.0% 0.0%LYNX
2003 16.9% 20.7% 37.6% 45.4% 17.0% 62.4% 100.0%
2004 18.6% 20.9% 39.5% 46.4% 14.1% 60.5% 100.0%
2005 20.0% 21.0% 41.0% 45.2% 13.8% 59.0% 100.0%
2006 21.0% 19.1% 40.1% 47.8% 12.1% 59.9% 100.0%
2007 18.0% 19.8% 37.8% 51.7% 10.5% 62.2% 100.0%
2008 20.4% 19.1% 39.5% 49.1% 11.4% 60.5% 100.0%
2009 19.1% 18.5% 37.6% 49.5% 12.9% 62.4% 100.0%
2010 20.2% 18.8% 39.0% 46.6% 14.4% 61.0% 100.0%
2011 22.9% 18.1% 41.0% 42.4% 16.6% 59.0% 100.0%
2012 24.9% 15.7% 40.6% 42.3% 17.1% 59.4% 100.0%
Source: Financial Statements APTA 2012 Transportation Fact Book Page 29* Not available
(Unaudited)
CENTRAL FLORIDA REGIONAL TRANSPORTATION AUTHORITY d/b/aLYNX
Revenues by SourceLast Ten Years
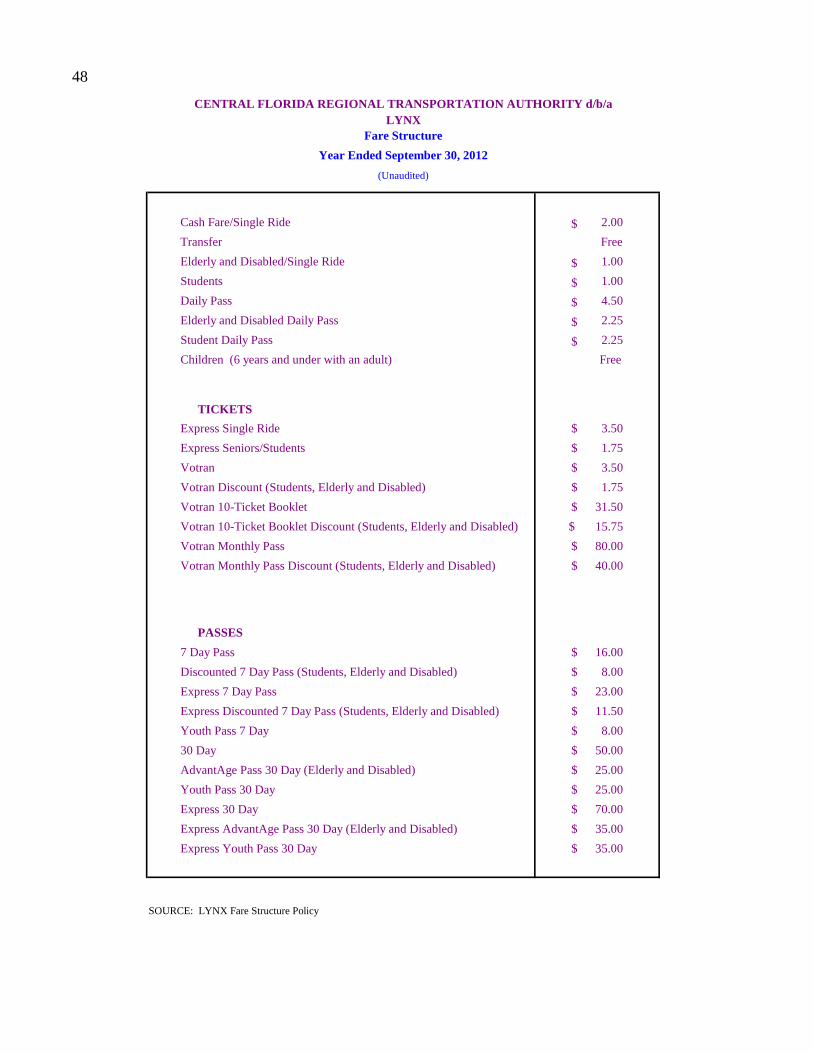
48
Cash Fare/Single Ride $ 2.00
Transfer Free
Elderly and Disabled/Single Ride $ 1.00
Students $ 1.00
Daily Pass $ 4.50
Elderly and Disabled Daily Pass $ 2.25
Student Daily Pass $ 2.25
Children (6 years and under with an adult) Free
TICKETS
Express Single Ride $ 3.50
Express Seniors/Students $ 1.75
Votran $ 3.50
Votran Discount (Students, Elderly and Disabled) $ 1.75
Votran 10-Ticket Booklet $ 31.50
Votran 10-Ticket Booklet Discount (Students, Elderly and Disabled) $ 15.75
Votran Monthly Pass $ 80.00
Votran Monthly Pass Discount (Students, Elderly and Disabled) $ 40.00
PASSES
7 Day Pass $ 16.00
Discounted 7 Day Pass (Students, Elderly and Disabled) $ 8.00
Express 7 Day Pass $ 23.00
Express Discounted 7 Day Pass (Students, Elderly and Disabled) $ 11.50
Youth Pass 7 Day $ 8.00
30 Day $ 50.00
AdvantAge Pass 30 Day (Elderly and Disabled) $ 25.00
Youth Pass 30 Day $ 25.00
Express 30 Day $ 70.00
Express AdvantAge Pass 30 Day (Elderly and Disabled) $ 35.00
Express Youth Pass 30 Day $ 35.00
CENTRAL FLORIDA REGIONAL TRANSPORTATION AUTHORITY d/b/a
SOURCE: LYNX Fare Structure Policy
Year Ended September 30, 2012
Fare Structure
(Unaudited)
LYNX

49
Fiscal Single Discount 1 Day Discount 7 Day Discount 30 Day Discount Year Fare Single Fare 1 Day Pass 7 Day Pass 30 Day 2003 1.25 0.50 3.00 1.50 10.00 5.00 36.00 15.002004 1.25 0.50 3.00 1.50 10.00 5.00 36.00 15.002005 1.50 0.75 3.50 1.75 12.00 6.00 38.00 18.002006 1.50 0.75 3.50 1.75 12.00 6.00 38.00 18.002007 1.50 0.75 3.50 1.75 12.00 6.00 38.00 18.002008 1.75 0.85 4.00 2.00 14.00 7.00 44.00 22.002009 2.00 1.00 4.50 2.25 16.00 8.00 50.00 25.002010 2.00 1.00 4.50 2.25 16.00 8.00 50.00 25.002011 2.00 1.00 4.50 2.25 16.00 8.00 50.00 25.002012 2.00 1.00 4.50 2.25 16.00 8.00 50.00 25.00
Discounted Fares Include: Discounted Passes Include:Youth
Elderly and Handicapped AdvantageDoes Not Include Xpress Links 200 & 204 IQ
The table and graph show the amount of each standard fixed-route fare type by year. In keeping with theAuthority's commitment to keep fares as low as fiscally feasible and to make relatively small rate increasesperiodically, no fare rate increases were made in 2012. In 2012 customer fares were approximately 61% ofoperating revenues and 24.9% of total revenues. The last increase was implemented in January 2009.
Students
CASH FARES PASSES
CENTRAL FLORIDA REGIONAL TRANSPORTATION AUTHORITY d/b/a
Fare TrendsLast Ten Years
(Unaudited)
LYNX
0.50
0.75
1.00
1.25
1.50
1.75
2.00
2003 2004 2005 2006 2007 2008 2009 2010 2011 2012
Fare
($)
Year
Full Single Ride Fare Last Ten Years
Single Ride Fare

50
Fiscal Year Percentage
2003 19%
2004 18%
2005 20%
2006 21%
2007 20%
2008 20%
2009 20%
2010 21%
2011 24%
2012 26%
Farebox Recovery Percentage is the percentage of the total operating cost that is funded by customer fares. It is calculated by dividing totalcustomer fares by total operating cost before depreciation. Beginning with 2003 the recovery rate has remained fairly constant varying byapproximately 1% from year to year. The 2012 rate was 2% higher than 2011 and 7% above the 2003 level. The 2012 increase is due mainlyto higher ridership.
CENTRAL FLORIDA REGIONAL TRANSPORTATION AUTHORITY d/b/a
Farebox Recovery PercentageLast Ten Years
(Unaudited)
LYNX
15%
18%
21%
24%
27%
2003 2004 2005 2006 2007 2008 2009 2010 2011 2012
Fare
box
Rec
over
y Pe
rcen
tage
Year
FAREBOX RECOVERY PERCENTAGE

51
Year Transportation Maintenance Administrative and General Total2003 597 183 154 9342004 600 184 155 9392005 600 193 156 9492006 585 182 168 9352007 639 204 168 1,0112008 656 195 170 1,0212009 641 197 137 9752010 653 199 137 9892011 653 199 139 9912012 693 198 148 1,039
Source: Annual Budgets
The greatest fluctuation during the 10-year period was in the Transportation area with 2012 staffing approximately5.3% above the peak level of the 10-year period shown above. Staffing level increased as a result of increase inservice demand. Despite the Transportation staff increase, the organization wide total from year to year varied lessthan 11.2% with an overall increasing trend.
CENTRAL FLORIDA REGIONAL TRANSPORTATION AUTHORITY d/b/a
Budgeted Staffing TrendsLast Ten Years
(Unaudited)
LYNX
0
100
200
300
400
500
600
700
800
2003 2004 2005 2006 2007 2008 2009 2010 2011 2012
Em
ploy
ees
Year
Staffing Trends
Transportation Maintenance Administrative and General
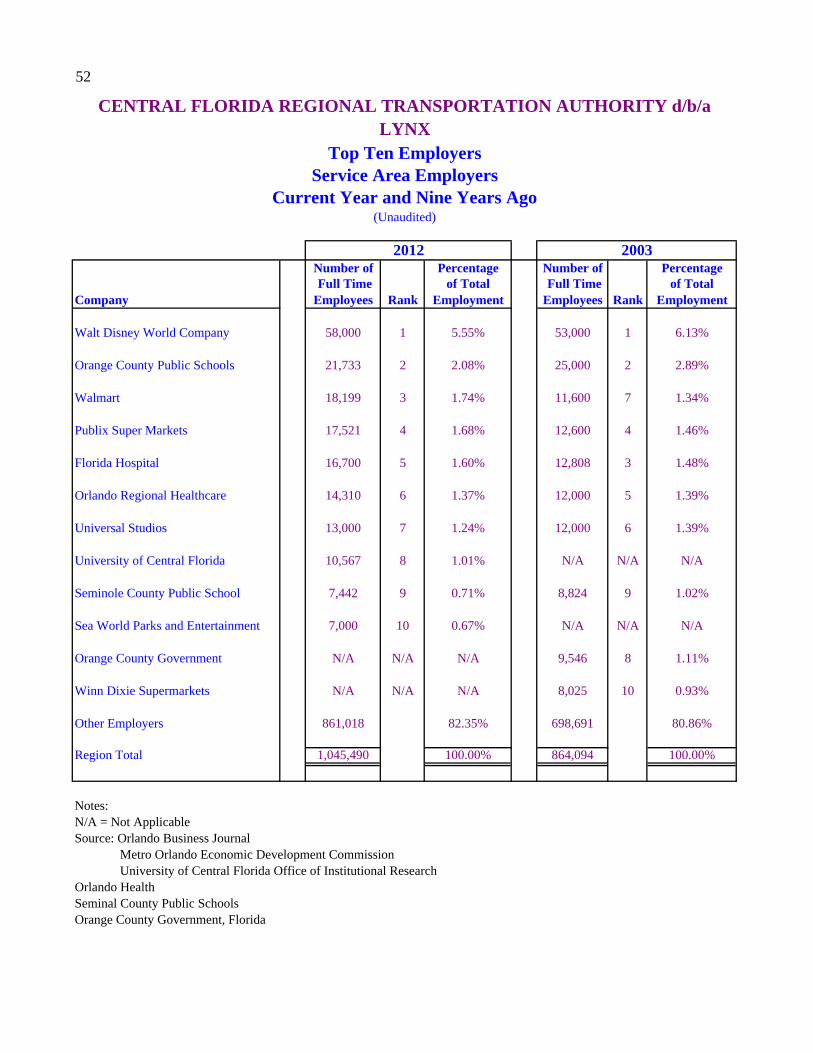
52
Number of Percentage Number of Percentage Full Time of Total Full Time of Total
Company Employees Rank Employment Employees Rank Employment
Walt Disney World Company 58,000 1 5.55% 53,000 1 6.13%
Orange County Public Schools 21,733 2 2.08% 25,000 2 2.89%
Walmart 18,199 3 1.74% 11,600 7 1.34%
Publix Super Markets 17,521 4 1.68% 12,600 4 1.46%
Florida Hospital 16,700 5 1.60% 12,808 3 1.48%
Orlando Regional Healthcare 14,310 6 1.37% 12,000 5 1.39%
Universal Studios 13,000 7 1.24% 12,000 6 1.39%
University of Central Florida 10,567 8 1.01% N/A N/A N/A
Seminole County Public School 7,442 9 0.71% 8,824 9 1.02%
Sea World Parks and Entertainment 7,000 10 0.67% N/A N/A N/A
Orange County Government N/A N/A N/A 9,546 8 1.11%
Winn Dixie Supermarkets N/A N/A N/A 8,025 10 0.93%
Other Employers 861,018 82.35% 698,691 80.86%
Region Total 1,045,490 100.00% 864,094 100.00%
Notes: N/A = Not Applicable Source: Orlando Business Journal Metro Orlando Economic Development Commission University of Central Florida Office of Institutional ResearchOrlando HealthSeminal County Public SchoolsOrange County Government, Florida
2012 2003
(Unaudited)
CENTRAL FLORIDA REGIONAL TRANSPORTATION AUTHORITY d/b/a
Top Ten EmployersService Area Employers
Current Year and Nine Years Ago
LYNX

53
Year Manufacturing Construction Transportation Finance Government Retail Trade Service Total
2003 4.5% 6.6% 5.1% 6.2% 11.2% 23.8% 42.6% 100.0%
2004 4.4% 7.0% 4.9% 6.0% 11.0% 24.3% 42.4% 100.0%
2005 4.3% 7.6% 4.3% 6.0% 10.8% 22.8% 44.2% 100.0%
2006 4.1% 8.0% 4.9% 6.2% 10.6% 20.3% 45.9% 100.0%
2007 4.0% 7.8% 4.9% 5.9% 11.0% 20.6% 45.8% 100.0%
2008 3.8% 6.6% 3.9% 6.2% 11.0% 15.3% 53.2% 100.0%
2009 3.9% 6.0% 3.1% 6.4% 11.7% 11.1% 57.8% 100.0%
2010 3.7% 4.8% 3.0% 6.0% 11.7% 11.4% 59.4% 100.0%
2011 3.6% 4.6% 3.1% 6.1% 11.5% 11.8% 59.3% 100.0%
2012 3.6% 4.2% 3.0% 6.2% 11.3% 12.3% 59.4% 100.0%
Source: Metro Orlando Economic Development Commission
CENTRAL FLORIDA REGIONAL TRANSPORTATION AUTHORITY d/b/aLYNX
(Unaudited)
Employment Percentage by IndustryService RegionLast Ten Years

54
Year Orange County Seminole County Osceola County Region Total
2003 983,165 394,900 210,438 1,588,503
2004 1,013,937 403,361 225,816 1,643,114
2005 1,043,437 411,744 235,156 1,690,337
2006 1,079,524 420,667 255,903 1,756,094
2007 1,105,603 425,698 266,123 1,797,424
2008 1,114,979 426,413 273,709 1,815,101
2009 1,108,882 423,759 272,788 1,805,429
2010 1,087,971 412,660 278,153 1,778,784
2011 1,183,903 429,169 275,010 1,888,082
2012 1,166,730 430,738 281,294 1,878,762
Source: Metro Orlando Economic Development Commission
CENTRAL FLORIDA REGIONAL TRANSPORTATION AUTHORITY d/b/a
The population of the tri-county area, as a whole, drecreased approximately .49 % from 2011. There was an increase every year exceptfor 2009, 2010 and 2012. The greatest growth was in Osceola County, where the population grew approximately 2.28% compared tothe previous year.
Population by Service CountyLast Ten Years
(Unaudited)
LYNX
100,000
300,000
500,000
700,000
900,000
1,100,000
2003 2004 2005 2006 2007 2008 2009 2010 2011 2012
Pop
ula
tion
Year
Population by Service County
Orange County Seminole County Osceola County

55
Year Orange County Seminole County Osceola County2003 40,241 50,960 30,6992004 44,456 52,881 41,2502005 45,330 53,675 41,8722006 46,963 56,072 43,3362007 51,188 59,354 46,8902008 52,062 61,378 47,2282009 52,130 61,374 47,2442010 52,232 58,703 48,9422011 52,624 60,210 48,3672012 51,338 59,609 47,386
Source: Metro Orlando Economic Development Commission
Median household income is useful in public transportation planning because it is one determinant of the need for, and probability of use, ofpublic transportation. The lower the median income the greater, in most cases, will be the need for, and use of, public transportation.Overall the tri-county area median income decreased from 2011.
CENTRAL FLORIDA REGIONAL TRANSPORTATION AUTHORITY d/b/a
Median Household Income by Service CountyLast Ten Years
(Unaudited)
LYNX
15,000
25,000
35,000
45,000
55,000
65,000
2003 2004 2005 2006 2007 2008 2009 2010 2011 2012
Med
ian
In
com
e
Year
Median Income by Service County
Orange County Seminole County Osceola County

56
Year Orange County Seminole County Osceola County Region Average2003 4.5% 4.8% 5.4% 4.5%2004 4.2% 3.8% 5.7% 4.2%2005 2.9% 2.5% 3.1% 3.0%2006 3.0% 2.8% 3.2% 3.1%2007 3.9% 3.6% 4.6% 3.3%2008 4.8% 4.7% 5.5% 5.0%2009 9.9% 7.0% 13.7% 10.2%2010 11.8% 10.9% 12.8% 11.8%2011 10.2% 9.5% 11.3% 10.3%2012 8.4% 7.7% 9.4% 8.4%
Source: Metro Orlando Economic Development Commission
Employment and Unemployment trends are useful in the analysis of the economic vitality of a localeconomy. The availability of public transportation removes transportation barriers to employment, afactor which contributes to the continued need for public transportation. The yearly percentages bycounty are annual averages, non-seasonal based. The tri-county average for fiscal year 2012 was 8.4%,with Osceola at 9.4% having the highest unemployment. On the favorable side, each service countyposted a decline in unemployment compared to 2011.
CENTRAL FLORIDA REGIONAL TRANSPORTATION AUTHORITY d/b/a
Unemployment by Service CountyLast Ten Years
(Unaudited)
LYNX
2%4%6%8%
10%12%14%16%
2003 2004 2005 2006 2007 2008 2009 2010 2011 2012
Une
mpl
oym
ent P
erce
ntag
e
Year
Unemployment by Service County
Orange County Seminole County Osceola County
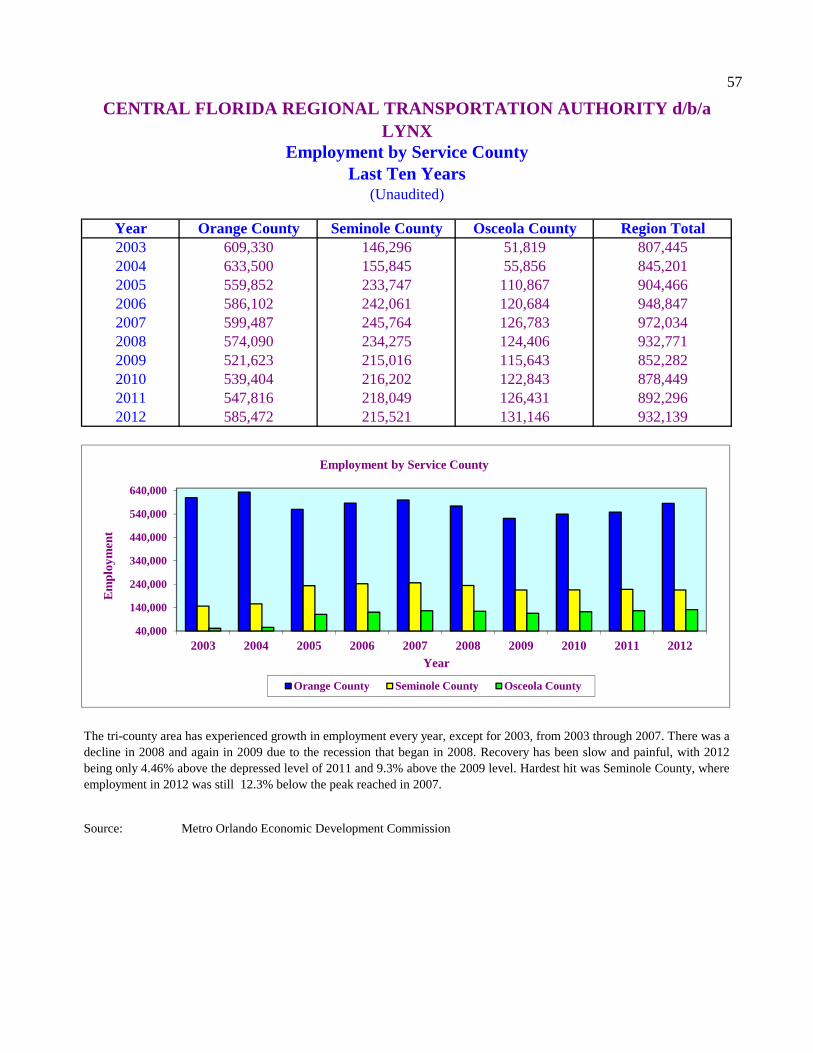
57
Year Orange County Seminole County Osceola County Region Total2003 609,330 146,296 51,819 807,4452004 633,500 155,845 55,856 845,2012005 559,852 233,747 110,867 904,4662006 586,102 242,061 120,684 948,8472007 599,487 245,764 126,783 972,0342008 574,090 234,275 124,406 932,7712009 521,623 215,016 115,643 852,2822010 539,404 216,202 122,843 878,4492011 547,816 218,049 126,431 892,2962012 585,472 215,521 131,146 932,139
Source: Metro Orlando Economic Development Commission
The tri-county area has experienced growth in employment every year, except for 2003, from 2003 through 2007. There was adecline in 2008 and again in 2009 due to the recession that began in 2008. Recovery has been slow and painful, with 2012being only 4.46% above the depressed level of 2011 and 9.3% above the 2009 level. Hardest hit was Seminole County, whereemployment in 2012 was still 12.3% below the peak reached in 2007.
CENTRAL FLORIDA REGIONAL TRANSPORTATION AUTHORITY d/b/a
Employment by Service CountyLast Ten Years
(Unaudited)
LYNX
40,000
140,000
240,000
340,000
440,000
540,000
640,000
2003 2004 2005 2006 2007 2008 2009 2010 2011 2012
Em
ploy
men
t
Year
Employment by Service County
Orange County Seminole County Osceola County

58
2003 21,894,985 236 14,083,287 985,669
2004 22,677,846 230 14,081,562 987,450
2005 24,030,234 237 14,478,451 1,013,865
2006 24,570,957 240 14,726,834 1,033,796
2007 26,078,255 240 15,475,289 1,058,929
2008 26,427,067 238 16,739,475 1,162,852
2009 23,747,795 234 16,225,409 1,108,783
2010 24,780,704 223 16,570,711 1,111,073
2011 26,996,158 225 16,503,043 1,108,489
2012 28,184,740 225 17,258,824 1,125,323
SOURCES: NTD report (MotorBus)
Number of vehicles exclude vehicles not in service at the end of the fiscal year.
CENTRAL FLORIDA REGIONAL TRANSPORTATION AUTHORITY d/b/a
(Unaudited)
LYNX
ACTUAL VEHICLE
HOURS
FISCAL YEAR
RIDERSHIPNUMBER OF PEAK
VEHICLES
ACTUAL VEHICLE
MILES
Last TenYearsGeneral Statistical Trends

59
Fiscal Year
Salaries Wages and
Benefits
Purchased Transportation
Services
Materials and
SuppliesProfessional
ServicesLeases and
Miscellaneous
Casualty Liability
Insurance
Utilities, Taxes & Licenses Depreciation
Total Operating Expenses
2003 45.7 16.5 7.6 8.8 1.5 1.2 1.0 9.0 91.3
2004 46.8 13.6 8.0 6.6 1.7 1.2 0.9 7.7 86.5
2005 49.8 13.8 11.4 7.0 1.9 1.0 1.2 8.7 94.8
2006 51.5 12.5 14.2 6.1 1.7 1.5 1.6 9.2 98.3
2007 55.5 15.8 15.0 6.4 1.7 2.1 1.4 10.0 107.9
2008 59.7 17.2 21.9 6.5 1.3 2.5 1.6 15.3 126.0
2009 61.0 18.2 16.5 6.1 0.7 2.5 1.6 16.7 123.3
2010 59.4 20.1 16.5 6.4 0.7 1.8 1.8 17.0 123.7
2011 57.9 21.2 21.1 5.7 0.7 2.1 1.9 18.2 128.8
2012 59.0 20.8 22.7 5.4 0.7 1.6 1.8 19.1 131.1
Source: Financial Statements
The table and graph show the annual amount for each of the 8 primary object classifications of operating expenses during the last tenyears. Total operating expenses for 2012 was 43.59 % above the 2003 level and 1.78% above the previous peak reached in 2011. At 45% of total operating expenses in 2012, the Salaries, Wages and Benefits object is the largest object and, due to higher ridership,increased 1.89% in 2012.
CENTRAL FLORIDA REGIONAL TRANSPORTATION AUTHORITY d/b/a
Last Ten YearsDollars in Millions
(Unaudited)
Operating Expenses by ObjectLYNX
$0
$10
$20
$30
$40
$50
$60
$70
2003 2004 2005 2006 2007 2008 2009 2010 2011 2012
Dol
lars
in M
illio
ns
Year
Total Operating Expenses by Object
Salaries Wages and Benefits Purchased Transportation Services Materials and Supplies Professional Services
Leases and Miscellaneous Casualty Liability Insurance Utilities, Taxes & Licenses Depreciation
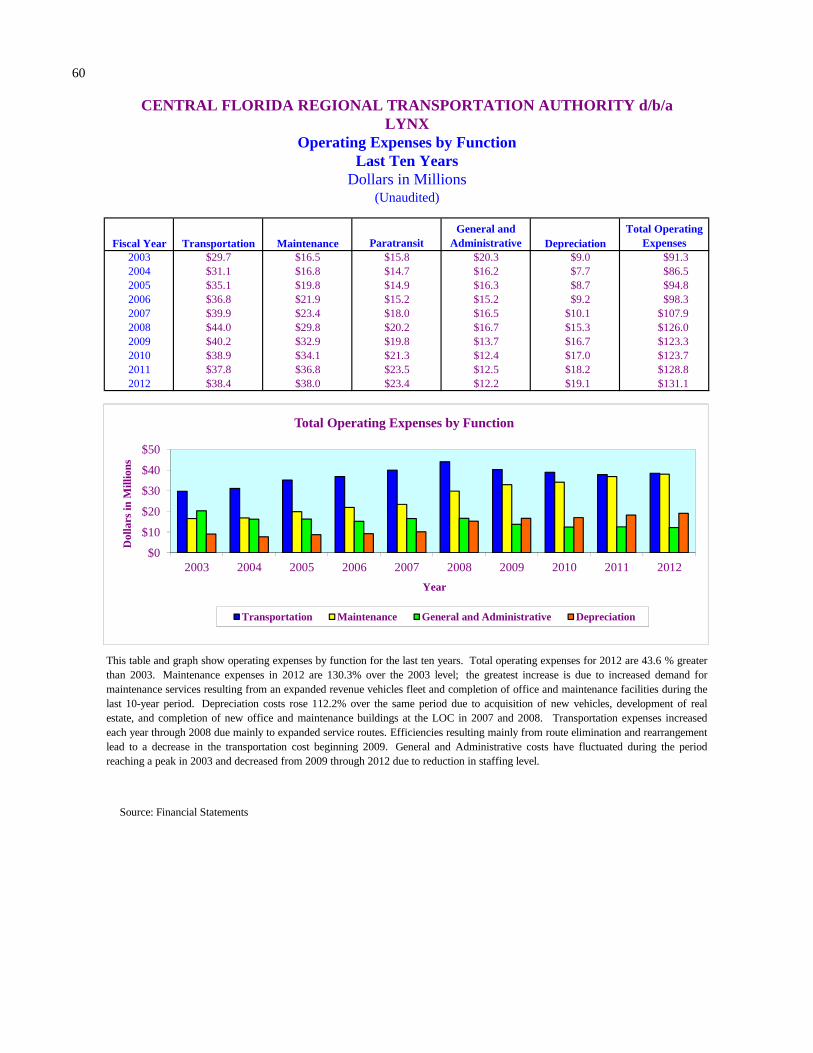
60
Fiscal Year Transportation Maintenance ParatransitGeneral and
Administrative DepreciationTotal Operating
Expenses2003 $29.7 $16.5 $15.8 $20.3 $9.0 $91.32004 $31.1 $16.8 $14.7 $16.2 $7.7 $86.52005 $35.1 $19.8 $14.9 $16.3 $8.7 $94.82006 $36.8 $21.9 $15.2 $15.2 $9.2 $98.32007 $39.9 $23.4 $18.0 $16.5 $10.1 $107.92008 $44.0 $29.8 $20.2 $16.7 $15.3 $126.02009 $40.2 $32.9 $19.8 $13.7 $16.7 $123.32010 $38.9 $34.1 $21.3 $12.4 $17.0 $123.72011 $37.8 $36.8 $23.5 $12.5 $18.2 $128.82012 $38.4 $38.0 $23.4 $12.2 $19.1 $131.1
CENTRAL FLORIDA REGIONAL TRANSPORTATION AUTHORITY d/b/a
Operating Expenses by FunctionLast Ten Years
Dollars in Millions
LYNX
Source: Financial Statements
This table and graph show operating expenses by function for the last ten years. Total operating expenses for 2012 are 43.6 % greaterthan 2003. Maintenance expenses in 2012 are 130.3% over the 2003 level; the greatest increase is due to increased demand formaintenance services resulting from an expanded revenue vehicles fleet and completion of office and maintenance facilities during thelast 10-year period. Depreciation costs rose 112.2% over the same period due to acquisition of new vehicles, development of realestate, and completion of new office and maintenance buildings at the LOC in 2007 and 2008. Transportation expenses increasedeach year through 2008 due mainly to expanded service routes. Efficiencies resulting mainly from route elimination and rearrangementlead to a decrease in the transportation cost beginning 2009. General and Administrative costs have fluctuated during the periodreaching a peak in 2003 and decreased from 2009 through 2012 due to reduction in staffing level.
(Unaudited)
$0
$10
$20
$30
$40
$50
2003 2004 2005 2006 2007 2008 2009 2010 2011 2012
Dol
lars
in M
illio
ns
Year
Total Operating Expenses by Function
Transportation Maintenance General and Administrative Depreciation

61
Fiscal Vehicle Revenue Operating Expense Operating Expense Year Miles Miles Per Vehicle Mile Per Revenue Mile
2003 14,083,287 12,986,576 5.84 6.34
2004 14,081,298 13,006,713 5.60 6.06
2005 14,488,566 13,398,280 5.94 6.43
2006 14,726,834 13,593,266 6.05 6.55
2007 15,475,289 14,072,186 6.32 6.95
2008 16,739,475 14,985,672 6.61 7.39
2009 16,215,911 14,230,128 6.57 7.49
2010 16,570,711 14,612,279 6.44 7.30
2011 16,503,043 14,714,555 6.70 7.52
2012 17,258,824 15,487,372 6.49 7.23
Source: Financial Statements National Transportation Database report
The table and graph show total miles and operating expenses per mile by year for the past ten years. These provide, directlyand indirectly, some key operational indicators such as efficiency in use of operating assistance funding and the quality ofthe maintenance program. There was a steady increase in Revenue Miles and Vehicles Miles until 2009 when service wasreduced due to budgetary constraints. The increase in Operating Expense Per Revenue Mile is reflective of increase in costfor material and services without a corresponding increase in miles and ridership. In 2012 the decrease in OperatingExpense Per Vehicle Mile and Revenue Mile is due mainly to decreases in fuel prices. The ratio of Revenue Miles versusVehicle Miles represents the level of service miles delivered to patrons versus the total level of miles required to service allroutes.
Operating Expenses Per Mile
CENTRAL FLORIDA REGIONAL TRANSPORTATION AUTHORITY d/b/a
Last Ten Years(Unaudited)
LYNX
$4.00 $4.50 $5.00 $5.50 $6.00 $6.50 $7.00 $7.50 $8.00
2003 2004 2005 2006 2007 2008 2009 2010 2011 2012
Dol
lars
Per
Mil
e
Year
Operating Expenses Per Mile
Operating Expense Per Vehicle Mile Operating Expense Per Revenue Mile

62
(Unaudited)
Insurance Company Policy Premium Limits Deductible/SIR Commission/Fee
Westchester/Landmark
Property* $73,015
$70,912,301 $10,000, except $5,000 Contractor's Equipment/EDP2% Named Windstorm,$25,000 All Other Wind/Flood
0%
Named Windstorm Included $15,000,000Flood Included $10,000,000Ordinance & Law Included $10,000,000Debris Removal Included $5,000,000
Hartford Steam Boiler Boiler & Machinery* $2,115 $50,000,000 $10,000 / 24 HoursSub-total $75,130
PGIT (Preferred Governmental Crime $1,063 0%Insurance Trust) Forgery & Alteration Included $100,000 $1,000
TDD Included $50,000 $1,000Employee Dishonesty Included $250,000 $1,000Computer Fraud Included $250,000 $1,000
Sub-total $1,063
General Liability 0%General Liability $28,717 $1,000,000/$2,000,000 $200,000EBL Included $1,000,000 $200,000
Sub-total $28,717
Public Officials/EPLI 0%Public Officials $16,833 $2,000,000 $100,000EPLI $10,321 $2,000,000 $100,000
Sub-total $27,157
Automobile 0%Auto Liability/UM/MedPay Rejected N/A N/AAuto Physical Damage $127,227 Symbol 10 $1,000 / $10,000
Sub-total $127,227
Total Premium This Page $259,294* Property and Boiler Costs shown were for a 6 month period
CENTRAL FLORIDA REGIONAL TRANSPORTATION d/b/aLYNX
Risk ManagementInsurance Policies - Fiscal Year 2012

63
CENTRAL FLORIDA REGIONAL TRANSPORTATION d/b/aLYNX
Risk ManagementInsurance Policies - Fiscal Year 2012
(Unaudited)
Insurance Company Policy Premium Limits Deductible/SIR Commission/Fee
Lynx Self-Insured N/A N/A
PGIT (Preferred Governmental Automobile (Road Rangers) 0%Insurance Trust) Auto Liability $29,973 $300,000 $0
PIP Included Statutory $0UM/UIM Included $50,000Auto Physical Damage $10,294 Symbol 10Garage/Garagekeepers $0
Sub-total $40,267
St. Paul Fire & Marine Travelers Automobile 0%Auto Liability $60,248 $3,000,000 $200,000UM/UIM RejectedAuto Physical Damage Not Covered
Sub-total $60,248
U.S. Specialty Fiduciary $4,547 $2,000,000 $5,000 0%
Great American E&S Insurance Environmental $22,841 $1,000,000/$3,000,000 $25,000 / $50,000 0%
Arthur J. Gallagher Brokerage Fee $50,000 $50,000
Total Premium This Page $177,903
Grand Total Premiums $437,197
Workers Compensation

This page intentionally left blank

Single Audit Section
CENTRAL FLORIDA REGIONAL TRANSPORTATION AUTHORITY

This page intentionally left blank
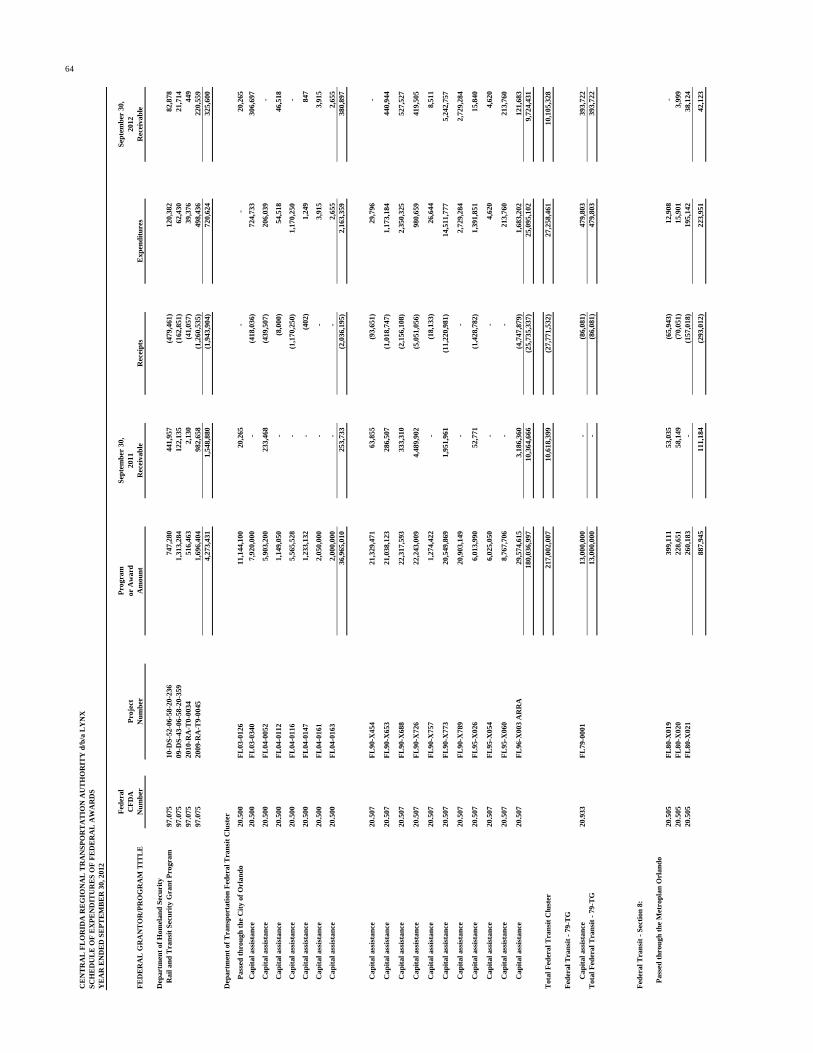
Fed
eral
Pro
gram
Sep
tem
ber
30,
Sep
tem
ber
30,
CF
DA
Pro
ject
or A
war
d20
1120
12F
ED
ER
AL
GR
AN
TO
R/P
RO
GR
AM
TIT
LE
Nu
mb
erN
um
ber
Am
oun
tR
ecei
vab
leR
ecei
pts
Exp
end
itu
res
Rec
eiva
ble
Dep
artm
ent
of H
omel
and
Sec
uri
ty
Rai
l an
d T
ran
sit
Sec
uri
ty G
ran
t P
rogr
am97
.075
10-D
S-5
2-06
-58-
20-2
3674
7,28
0
44
1,95
7
(4
79,4
61)
12
0,38
2
82
,878
97
.075
09-D
S-4
3-06
-58-
20-3
591,
313,
284
12
2,13
5
(1
62,8
51)
62
,430
21
,714
97
.075
2010
-RA
-T0-
0034
516,
463
2,13
0
(4
1,05
7)
39
,376
44
9
97.0
7520
09-R
A-T
9-00
451,
696,
404
98
2,65
8
(1
,260
,535
)
49
8,43
6
22
0,55
9
4,
273,
431
1,
548,
880
(1
,943
,904
)
72
0,62
4
32
5,60
0
D
epar
tmen
t of
Tra
nsp
orta
tion
Fed
eral
Tra
nsi
t C
lust
er
P
asse
d t
hro
ugh
th
e C
ity
of O
rlan
do
20.5
00F
L03
-012
611
,144
,100
20,2
65-
-
20,2
65
C
apit
al a
ssis
tan
ce20
.500
FL
03-0
340
7,92
0,00
0-
(4
18,0
36)
72
4,73
3
30
6,69
7
C
apit
al a
ssis
tan
ce20
.500
FL
04-0
052
5,90
3,20
023
3,46
8
(4
39,5
07)
20
6,03
9
-
C
apit
al a
ssis
tan
ce20
.500
FL
04-0
112
1,14
9,05
0-
(8
,000
)
54,5
18
46,5
18
C
apit
al a
ssis
tan
ce20
.500
FL
04-0
116
5,56
5,52
8-
(1
,170
,250
)
1,
170,
250
-
C
apit
al a
ssis
tan
ce20
.500
FL
04-0
147
1,23
3,13
2-
(4
02)
1,24
9
847
C
apit
al a
ssis
tan
ce20
.500
FL
04-0
161
2,05
0,00
0-
-
3,91
5
3,91
5
C
apit
al a
ssis
tan
ce20
.500
FL
04-0
163
2,00
0,00
0-
-
2,65
5
2,65
5
36
,965
,010
253,
733
(2,0
36,1
95)
2,16
3,35
9
380,
897
C
apit
al a
ssis
tan
ce
20.5
07F
L90
-X45
421
,329
,471
63,8
55
(93,
651)
29,7
96
-
C
apit
al a
ssis
tan
ce
20.5
07F
L90
-X65
321
,038
,123
286,
507
(1,0
18,7
47)
1,17
3,18
4
440,
944
C
apit
al a
ssis
tan
ce
20.5
07F
L90
-X68
822
,317
,593
333,
310
(2,1
56,1
08)
2,35
0,32
5
527,
527
C
apit
al a
ssis
tan
ce
20.5
07F
L90
-X72
622
,243
,009
4,48
9,90
2
(5,0
51,0
56)
980,
659
419,
505
C
apit
al a
ssis
tan
ce
20.5
07F
L90
-X75
71,
274,
422
-
(18,
133)
26,6
44
8,51
1
C
apit
al a
ssis
tan
ce
20.5
07F
L90
-X77
320
,549
,869
1,95
1,96
1
(11,
220,
981)
14,5
11,7
77
5,
242,
757
C
apit
al a
ssis
tan
ce
20.5
07F
L90
-X78
920
,903
,149
-
-
2,
729,
284
2,
729,
284
C
apit
al a
ssis
tan
ce
20.5
07F
L95
-X02
66,
013,
990
52,7
71
(1,4
28,7
82)
1,39
1,85
1
15,8
40
C
apit
al a
ssis
tan
ce
20.5
07F
L95
-X05
46,
025,
050
-
-
4,
620
4,
620
C
apit
al a
ssis
tan
ce
20.5
07F
L95
-X06
08,
767,
706
-
-
21
3,76
0
21
3,76
0
C
apit
al a
ssis
tan
ce
20.5
07F
L96
-X00
3 A
RR
A29
,574
,615
3,18
6,36
0
(4,7
47,8
79)
1,68
3,20
2
121,
683
180,
036,
997
10,3
64,6
66(2
5,73
5,33
7)
25
,095
,102
9,72
4,43
1
Tot
al F
eder
al T
ran
sit
Clu
ster
217,
002,
007
10,6
18,3
99(2
7,77
1,53
2)27
,258
,461
10,1
05,3
28
Fed
eral
Tra
nsi
t -
79-T
G
C
apit
al a
ssis
tan
ce
20.9
33F
L79
-000
113
,000
,000
-
(86,
081)
479,
803
393,
722
Tot
al F
eder
al T
ran
sit
- 79
-TG
13,0
00,0
00-
(8
6,08
1)47
9,80
339
3,72
2
Fed
eral
Tra
nsi
t -
Sec
tion
8:
P
asse
d t
hro
ugh
th
e M
etro
pla
n O
rlan
do
20.5
05F
L80
-X01
939
9,11
1
53
,035
(6
5,94
3)
12
,908
-
20
.505
FL
80-X
020
228,
651
58,1
49
(70,
051)
15,9
01
3,99
9
20
.505
FL
80-X
021
260,
183
-
(157
,018
)
195,
142
38,1
24
887,
945
111,
184
(293
,012
)
223,
951
42,1
23
64
CE
NT
RA
L F
LO
RID
A R
EG
ION
AL
TR
AN
SP
OR
TA
TIO
N A
UT
HO
RIT
Y d
/b/a
LY
NX
SC
HE
DU
LE
OF
EX
PE
ND
ITU
RE
S O
F F
ED
ER
AL
AW
AR
DS
YE
AR
EN
DE
D S
EP
TE
MB
ER
30,
201
2

(C
onti
nu
ed)
Fed
eral
Pro
gram
Sep
tem
ber
30,
Sep
tem
ber
30,
CF
DA
Pro
ject
or A
war
d20
1120
12F
ED
ER
AL
GR
AN
TO
R/P
RO
GR
AM
TIT
LE
Nu
mb
erN
um
ber
Am
oun
tR
ecei
vab
leR
ecei
pts
Exp
end
itu
res
Rec
eiva
ble
Fed
eral
Tra
nsi
t: S
ecti
on 1
8:
Pas
sed
th
rou
gh F
lori
da
Dep
artm
ent
of T
ran
spor
tati
on
C
apit
al A
ssis
tan
ce20
.509
AO
V68
484,
816
484,
500
(484
,500
)
484,
816
484,
816
484,
816
484,
500
(484
,500
)
484,
816
484,
816
Fed
eral
Tra
nsi
t: S
ecti
on 2
6
Pla
nn
ing
assi
stan
ce
20.5
14F
L26
-001
01,
247,
913
-
-
93
,157
93
,157
20.5
14F
L26
-710
750
0,00
0
2,
192
-
88
,969
91
,161
1,74
7,91
32,
192
-
18
2,12
6
18
4,31
8
Tra
nsi
t S
ervi
ces
Pro
gram
Clu
ster
20.5
16A
PF
8487
3,57
6(2
6,22
1)
(25,
990)
171,
864
119,
653
20.5
16A
QN
9258
7,77
5-
-
55,7
57
55,7
57
20.5
16F
L37
-X02
91,
206,
442
13
,579
(1
3,57
9)
-
-
20
.516
FL
37-X
062
1,44
0,37
7
19,7
86
(547
,213
)
556,
006
28,5
79
4,10
8,17
07,
144
(586
,782
)
783,
627
203,
989
20.5
21A
PF
8573
2,84
121
,909
(2
5,25
8)
3,
349
-
20
.521
FL
57-X
012
730,
803
91,3
84
(188
,510
)
97,1
26
-
20.5
21F
L57
-X03
486
6,75
9
53
,707
(2
60,7
73)
38
3,44
7
17
6,38
1
2,33
0,40
316
7,00
0(4
74,5
41)
48
3,92
2
17
6,38
1
Tot
al T
ran
sit
Ser
vice
s P
rogr
am C
lust
er6,
438,
573
174,
144
(1,0
61,3
23)
1,26
7,54
9
380,
370
Fed
eral
Tra
nsi
t -
Sec
tion
39
Pla
nn
ing
Ass
ista
nce
20.5
22F
L39
-000
592
6,00
0
62
,355
(1
25,2
44)
64
,083
1,
194
20.5
22F
L39
-001
180
0,00
0
-
(3
77,9
91)
45
4,44
0
76
,449
20
.522
FL
39-0
013
1,20
0,00
0
-
-
2,
893
2,
893
2,92
6,00
062
,355
(503
,235
)52
1,41
680
,536
TO
TA
L E
XP
EN
DIT
UR
ES
OF
FE
DE
RA
L A
WA
RD
S$
246,
760,
685
13,0
01,6
54$
(32,
143,
587)
31,1
38,7
46$
11,9
96,8
13
Du
e to
FD
OT
144,
914
110,
386
Tot
al R
ecei
vab
le$
13,1
46,5
68$
12,1
07,1
99
NO
NO
PE
RA
TIN
G R
EV
EN
UE
PO
RT
ION
19,6
78,4
15
CO
NT
RIB
UT
ED
CA
PIT
AL
$11
,460
,331
See
Not
es t
o S
ched
ule
s of
Exp
end
itu
res
of F
eder
al A
war
ds
and
Loc
al a
nd
Sta
te F
inan
cial
Ass
ista
nce
65
CE
NT
RA
L F
LO
RID
A R
EG
ION
AL
TR
AN
SP
OR
TA
TIO
N A
UT
HO
RIT
Y d
/b/a
LY
NX
SC
HE
DU
LE
OF
EX
PE
ND
ITU
RE
S O
F F
ED
ER
AL
AW
AR
DS
YE
AR
EN
DE
D S
EP
TE
MB
ER
30,
201
2

66
September 30, September 30,Program 2011 2012or Award Deferral Transfers/ Deferral
GRANT NUMBER/ SOURCE Amount (Receivable) Receipts Expenditures (Receivable)
LOCAL MATCHING GRANTS: N/A, AQB29 $ 2,706,301 - $ 217,925 $ 217,925 $ - N/A, AQP30 2,930,040 - 79,297 79,297 N/A, AQJ05 73,033 - 7,303 7,303 - Orange County (LYNX Operating Center) - 984 * - - 984 *
Orange County (Bus Lease) - 90,292 * 1,247,458 1,247,458 90,292 *
Private Partners (Shelters and Vans) - 471,433 741 350,350 121,824 City of Altamonte Springs (FlexBus Project) - 445,474 * - - 445,474 *
City of Orlando (LYNX-Orlando Trail Project) 1,541,415 - 308,283 - 308,283 City of Orlando (LYMMO East-West Project) 9,920,000 - 2,000,000 181,183 1,818,817 Other Local Capital - 86,115 - - 86,115
Total matching grants $ 17,170,789 $ 1,094,298 $ 3,861,007 2,083,516 $ 2,871,789
Customer fares and operating assistance 6,847
Contributed capital portion $ 2,076,669
LOCAL GRANTS AND CONTRACT SERVICES: Operating assistance: Orange County operating $ - $ 31,251,519 $ 31,251,519 $ - City of Orlando - 3,506,673 3,506,673 - Seminole County - 1,568,273 1,568,273 - Osceola County - 1,692,581 1,692,581 -
Total nonoperating revenue portion $ - $ 38,019,046 $ 38,019,046 $ -
Contract services: Seminole County $ - $ 2,515,675 $ 2,515,675 $ - Osceola County - 2,586,613 2,586,613 - City of Orlando (LYMMO) (214,011) 1,373,826 1,259,887 (100,072) City of Altamonte Springs - 120,900 120,900 - City of St. Cloud - 161,999 161,999 - City of Sanford - 85,250 93,000 (7,750) Disney - 250,000 250,000 - University of Central Florida (UCF) (33,476) 104,592 71,116 - Shingle Creek (39,071) 154,933 174,703 (58,841) Polk County (33,935) 145,672 134,275 (22,538) Votran (38,339) 137,681 123,281 (23,939) State Farm 240,750 324,500 323,000 242,250 Other Agencies (38,509) 38,509 - - Lake County - 225,425 225,425 -
Total Local Financial Assistance (156,591) 8,225,575 8,039,874 29,110
Other Contractual ServicesLocal - Shuttles - 156,020 156,020 - State - Transportation Disadvantage (1,226,693) 3,188,021 2,674,998 (713,670)
State - Medicaid (1,419,602) 6,012,396 5,593,747 (1,000,953) Total Other Contractual Services (2,646,295) 9,356,437 8,424,765 (1,714,623)
Total contract services $ (2,802,886) $ 17,582,012 $ 16,464,639 $ (1,685,513)
*These amounts are not receivables or deferrals, but are included as restricted net assets, as they relate to receipts that are restricted for matching.See notes to Schedules of Expenditures of Federal Awards and Local and State Financial Assistance.
CENTRAL FLORIDA REGIONAL TRANSPORTATION AUTHORITY d/b/a LYNXSCHEDULE OF LOCAL FINANCIAL ASSISTANCEYEAR ENDED SEPTEMBER 30, 2012
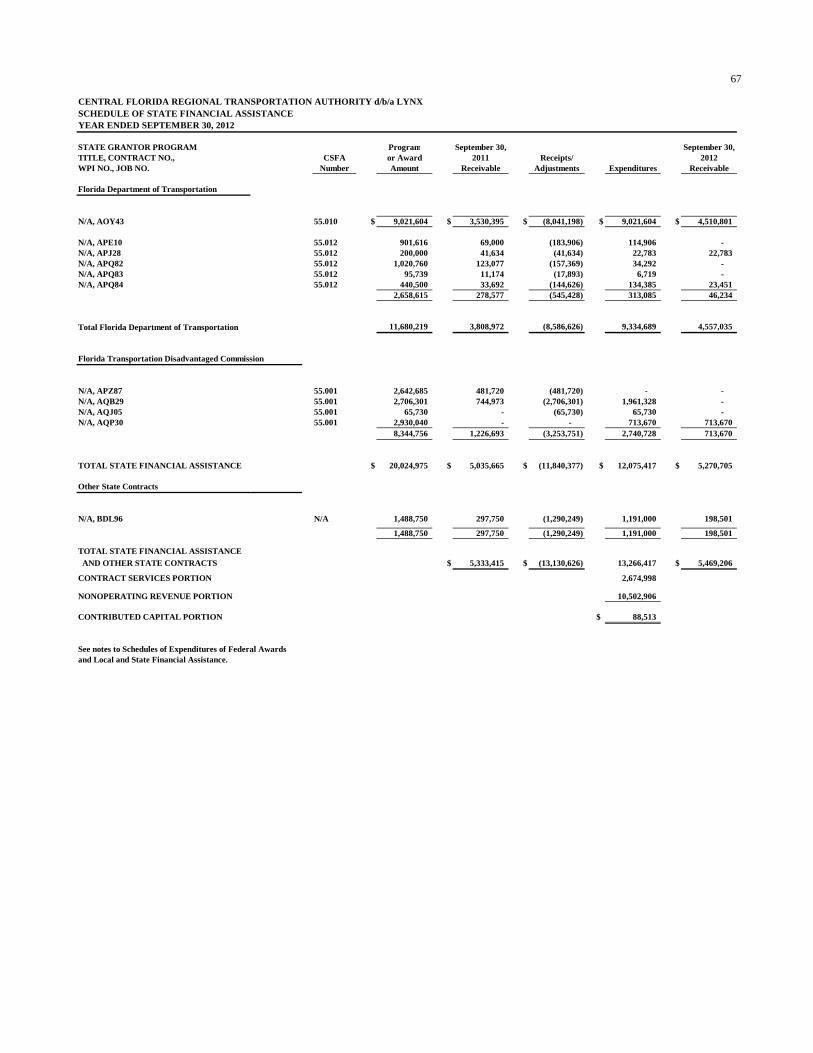
67
STATE GRANTOR PROGRAM Program September 30, September 30,TITLE, CONTRACT NO., CSFA or Award 2011 Receipts/ 2012WPI NO., JOB NO. Number Amount Receivable Adjustments Expenditures Receivable
Florida Department of Transportation
N/A, AOY43 55.010 $ 9,021,604 $ 3,530,395 $ (8,041,198) $ 9,021,604 $ 4,510,801
N/A, APE10 55.012 901,616 69,000 (183,906) 114,906 - N/A, APJ28 55.012 200,000 41,634 (41,634) 22,783 22,783 N/A, APQ82 55.012 1,020,760 123,077 (157,369) 34,292 - N/A, APQ83 55.012 95,739 11,174 (17,893) 6,719 - N/A, APQ84 55.012 440,500 33,692 (144,626) 134,385 23,451
2,658,615 278,577 (545,428) 313,085 46,234
Total Florida Department of Transportation 11,680,219 3,808,972 (8,586,626) 9,334,689 4,557,035
Florida Transportation Disadvantaged Commission
N/A, APZ87 55.001 2,642,685 481,720 (481,720) - - N/A, AQB29 55.001 2,706,301 744,973 (2,706,301) 1,961,328 - N/A, AQJ05 55.001 65,730 - (65,730) 65,730 - N/A, AQP30 55.001 2,930,040 - - 713,670 713,670
8,344,756 1,226,693 (3,253,751) 2,740,728 713,670
TOTAL STATE FINANCIAL ASSISTANCE $ 20,024,975 $ 5,035,665 $ (11,840,377) $ 12,075,417 $ 5,270,705
Other State Contracts
N/A, BDL96 N/A 1,488,750 297,750 (1,290,249) 1,191,000 198,501 1,488,750 297,750 (1,290,249) 1,191,000 198,501
TOTAL STATE FINANCIAL ASSISTANCE
AND OTHER STATE CONTRACTS $ 5,333,415 $ (13,130,626) 13,266,417 $ 5,469,206
CONTRACT SERVICES PORTION 2,674,998
NONOPERATING REVENUE PORTION 10,502,906
CONTRIBUTED CAPITAL PORTION $ 88,513
See notes to Schedules of Expenditures of Federal Awards and Local and State Financial Assistance.
CENTRAL FLORIDA REGIONAL TRANSPORTATION AUTHORITY d/b/a LYNXSCHEDULE OF STATE FINANCIAL ASSISTANCEYEAR ENDED SEPTEMBER 30, 2012

68
CENTRAL FLORIDA REGIONAL TRANSPORTATION AUTHORITY
NOTES TO SCHEDULES OF EXPENDITURES OF FEDERAL AWARDS ANDLOCAL AND STATE FINANCIAL ASSISTANCEYEAR ENDED SEPTEMBER 30, 2012
1. The Schedules of Expenditures of Federal Awards and Local and State Financial Assistance areprepared on the accrual basis of accounting.
2. All grants subject to the Florida Single Audit Act are included in the Schedule of State Financial Assistance.
3. The Authority utilized state toll revenue credits received from the Florida Department of Transportationunder the following awards to satisfy federal and state matching requirements:
Toll RevenueAward Credits Applied
Grant Amount during Fiscal 2012FL-04-0052 $ 5,903,200 $ 51,510
FL-04-0112 1,149,050 13,630
FL-04-0116 5,565,528 292,563
FL-04-0161 2,050,000 979
FL-15-X005 2,071,000 -
FL-90-X454 21,329,471 7,449
FL-90-X653 21,038,123 293,296
FL-90-X688 22,317,593 587,581
FL-90-X726 22,243,009 245,165
FL-90-X773 20,549,869 3,440,444
FL-90-X789 20,903,149 567,571
FL-95-X026 6,013,990 347,963
FL-95-X054 6,025,050 1,155
FL-95-X060 8,767,706 53,440
Total $ 165,926,738 $ 5,902,746
4. Contract services presented on the Schedule of Local Financial Assistance include only those servicesprovided to local governmental units.