comprehensive annual financial report - mississippi · it is my pleasure to transmit to you the...
TRANSCRIPT

Mississippi
Comprehensive Annual Financial Report
For the Fiscal Year Ended June 30, 2015

Mississippi
Fiscal Year Ended June 30, 2015
Department of Finance and Administration Post Office Box 267 Jackson, MS 39205
Kevin J. Upchurch Executive Director
This book has been printed on recycled materials.
Comprehensive Annual Financial Report 2015

(This page left blank intentionally)

PHIL BRYANT GOVERNOR
STATE OF MISSISSIPPI OFFICE OF THE GOVERNOR
POST OFFICE BOX 139 ·JACKSON, MISSISSIPPI 39205 ·TELEPHONE: (601) 359-3150 ·FAX (601) 359-3741
www.governorbryant.com
April 22, 2016
To the Members of the Legislature and my Fellow Mississippians:
As Governor of the State of Mississippi, I present the Comprehensive Annual Financial Report (CAFR) for the fiscal year ending June 30, 2015. This report details Mississippi’s financial statements and accounting controls.
As the national economy is slowly gaining momentum, Mississippi continues to show economic gains and employment growth. The focus continues on creating new jobs, education reform, creating a skilled workforce and improved government efficiency. We still have work to do, but our hard work is producing results. I hope that continued economic growth and fiscal discipline will serve to further bolster the state’s financial stability.
Sincerely,
Phil Bryant

(This page left blank intentionally)
Mississippi
1
INTRODUCTION
Letter of Transmittal ..................................................................................................................................................................... 5 Officials of State Government ...................................................................................................................................................... 8 Organization Chart ...................................................................................................................................................................... 9 Certificate of Achievement for Excellence in Financial Reporting ............................................................................................. 10
FINANCIAL SECTION
Auditor’s Report ......................................................................................................................................................................... 12 Management’s Discussion and Analysis ................................................................................................................................... 16
Basic Financial Statements
Government-wide Financial Statements Statement of Net Position ........................................................................................................................................... 26 Statement of Activities ................................................................................................................................................. 30
Governmental Funds Financial Statements Balance Sheet ............................................................................................................................................................. 32 Reconciliation of the Governmental Funds Balance Sheet to the Statement of Net Position ..................................... 33 Statement of Revenues, Expenditures, and Changes in Fund Balances .................................................................... 34 Reconciliation of the Governmental Funds Statement of Revenues, Expenditures, and Changes in Fund Balances to the Statement of Activities .................................................................................................................... 35
Proprietary Funds Financial Statements Statement of Net Position ........................................................................................................................................... 36 Statement of Revenues, Expenses, and Changes in Fund Net Position .................................................................... 40 Statement of Cash Flows ............................................................................................................................................ 42
Fiduciary Funds Financial Statements Statement of Fiduciary Net Position ............................................................................................................................ 46 Statement of Changes in Fiduciary Net Position ......................................................................................................... 47
Component Units Financial Statements Statement of Net Position ........................................................................................................................................... 48 Statement of Activities ................................................................................................................................................. 50
Notes to the Financial Statements Note 1 - Significant Accounting Policies .................................................................................................................... 51 Note 2 - Other Accounting Disclosures ..................................................................................................................... 57 Note 3 - Interfund Transactions ................................................................................................................................. 58 Note 4 - Deposits and Investments ........................................................................................................................... 59 Note 5 - Receivables ................................................................................................................................................. 69 Note 6 - Due From Other Governments .................................................................................................................... 70 Note 7 - Loans and Notes Receivable....................................................................................................................... 70 Note 8 - Capital Assets ............................................................................................................................................. 71Note 9 - Long-term General Obligation Bonds .......................................................................................................... 74 Note 10 - Bonds Authorized But Unissued .................................................................................................................. 78 Note 11 - Revenue Bonds and Notes .......................................................................................................................... 78 Note 12 - Other Long-term Liabilities .......................................................................................................................... 79 Note 13 - Changes in Long-term Liabilities ................................................................................................................. 81 Note 14 - Short-term Financing………………………………………….…………………………...………………………...81 Note 15 - Retirement Plans ......................................................................................................................................... 82 Note 16 - Other Postemployment Benefits………………………………. ...................................................................... 87 Note 17 - Commitments .............................................................................................................................................. 88 Note 18 - Risk Management ........................................................................................................................................ 90 Note 19 - Contingencies .............................................................................................................................................. 91 Note 20 - Subsequent Events ..................................................................................................................................... 91
Table of Contents

Mississippi
2
Required Supplementary Information
Budgetary Comparison Schedule - Budget and Actual (Non-GAAP Basis) - All Budgetary Funds and Notes .................. 94 Schedule of Employer Contributions – Mississippi Highway Safety Patrol Retirement System..........................................97
Schedule of Employer Contributions – Supplemental Legislative Retirement Plan…………………………………………...98 Schedule of Employer Contributions – Public Employees’ Retirement System..................................................................99 Schedule of Changes in the Net Pension Liability – Mississippi Highway Safety Patrol Retirement System...…………..100 Schedule of Changes in the Net Pension Liability – Supplemental Legislative Retirement Plan…………………………..101 Schedule of Proportionate Share of the Net Pension Liability – Public Employees’ Retirement System………………….102
Schedule of Funding Progress - Other Postemployment Benefits…………………………………………………………..…103
Supplementary Information - Combining and Individual Fund Financial Statements and Supporting Schedules
Proprietary Funds Nonmajor Enterprise Funds
Descriptions ....................................................................................................................................................... 107 Combining Statement of Net Position ................................................................................................................ 108 Combining Statement of Revenues, Expenses, and Changes in Fund Net Position ......................................... 110 Combining Statement of Cash Flows ................................................................................................................. 112
Internal Service Funds Descriptions ....................................................................................................................................................... 117 Combining Statement of Net Position ................................................................................................................ 118 Combining Statement of Revenues, Expenses, and Changes in Fund Net Position ......................................... 119 Combining Statement of Cash Flows ................................................................................................................. 120
Fiduciary Funds Descriptions .............................................................................................................................................................. 123 Pension Trust Funds
Combining Statement of Fiduciary Net Position ................................................................................................. 124 Combining Statement of Changes in Fiduciary Net Position ............................................................................. 126
Agency Funds Combining Statement of Fiduciary Net Position ................................................................................................. 128 Combining Statement of Changes in Assets and Liabilities ............................................................................... 129
Nonmajor Component Units Descriptions .............................................................................................................................................................. 131 Combining Statement of Net Position ....................................................................................................................... 132 Combining Statement of Activities ............................................................................................................................ 134
STATISTICAL SECTION
Statistical Section .................................................................................................................................................................... 137 Table 1 - Net Position by Component............................................................................................................................. 138 Table 2 - Changes in Net Position .................................................................................................................................. 140 Table 3 - Fund Balances of Governmental Funds .......................................................................................................... 144 Table 4 - Changes in Fund Balances of Governmental Funds....................................................................................... 146 Table 5 - Taxable Sales by Industry ............................................................................................................................... 150 Table 6 - Sales Tax Revenue Payers by Industry .......................................................................................................... 152 Table 7 - Ratios of Outstanding Debt by Type ............................................................................................................... 154 Table 8 - Legal Debt Margin ........................................................................................................................................... 156 Table 9 - Demographic and Economic Statistics ............................................................................................................ 157 Table 10 - Employment by Industry .................................................................................................................................. 157 Table 11 - Public School Enrollment ................................................................................................................................ 158 Table 12 - Community and Junior College Enrollment ..................................................................................................... 158 Table 13 - University Enrollment ...................................................................................................................................... 158 Table 14 - Capital Asset Statistics by Function ................................................................................................................ 160 Table 15 - State Government Employees by Function ..................................................................................................... 162 Table 16 - Operating Indicators by Function .................................................................................................................... 164

Mississippi
3
Introduction

(This page left blank intentionally)
4

5
STATE OF MISSISSIPPI DEPARTMENT OF FINANCE AND ADMINISTRATION
KEVIN J. UPCHURCH EXECUTIVE DIRECTOR
April 22, 2016
To Governor Bryant, Members of the Legislature, and Citizens of the State of Mississippi:
It is my pleasure to transmit to you the Comprehensive Annual Financial Report (CAFR) of the State of Mississippi for the year ended June 30, 2015 as provided in Section 27-104-4, Mississippi Code Annotated (1972). Responsibility for both the accuracy of the data presented and the completeness and fairness of the presentations in the financial statements, including all disclosures, rests with the State’s management. This report was prepared in conformity with accounting principles generally accepted in the United States of America (GAAP).
State managers are responsible for establishing and maintaining internal controls to ensure that adequate accounting data is compiled to allow preparation of financial statements in conformity with GAAP. Because the cost of a control should not exceed the benefits likely to be derived, internal controls have been implemented to provide reasonable, but not absolute, assurance regarding the reliability of the financial statements. I believe the information as presented is complete and accurate in all material respects.
Pursuant to Section 7-7-211(d), Mississippi Code Annotated (1972), the Office of the State Auditor has performed an audit, in accordance with auditing standards generally accepted in the United States of America and the standards applicable to financial audits contained in Government Auditing Standards, issued by the Comptroller General of the United States, of the State's basic financial statements. An unmodified opinion is presented as the first page of the financial section of this report. Also, as required by federal law, the State Auditor has undertaken a single audit of the State as a whole, which will include a report on compliance and internal control over compliance on major federal program funds expended by state government. This report, along with the report on internal control over financial reporting and on compliance and other matters, will be published separately.
GAAP requires that management provide a narrative introduction, overview, and analysis to accompany the Basic Financial Statements in the form of Management’s Discussion and Analysis (MD&A). This letter of transmittal is designed to complement the MD&A and should be read in conjunction with it. The State’s MD&A can be found immediately following the Auditor’s report.

6
Profile of the Government Mississippi is named for the Mississippi River, which forms its western boundary and empties into the Gulf of Mexico. The name translated from Native American folklore means “Father of Waters.” Mississippi was organized as a territory in 1798 and was admitted as the 20th State to the Union on December 10, 1817. The state’s constitution separates the legal powers of state government into three distinct branches - the legislative, the executive, and the judicial. The financial statements present information on the financial position and operations of state government as a single comprehensive reporting entity. The state’s various agencies, commissions, departments and boards that comprise the state’s reporting entity are included in this report in accordance with criteria established by the Governmental Accounting Standards Board (GASB). The state's reporting entity is also comprised of its discretely presented component units for which the State is financially accountable. The criteria used in defining the State’s reporting entity are fully discussed in Note 1 to the financial statements. The state provides a full range of services to enhance and protect the lives of its citizenry. These services include among others: education; health and social services; public safety and justice; recreation and resource development and protection; business regulation; and highway construction and maintenance. Mississippi state law requires both the Governor and the Legislative Budget Committee to submit an overall balanced budget at the beginning of each annual session for the ensuing fiscal year. The Legislature legally enacts an annual state budget through passage of specific departmental appropriation bills. The Governor has the power to approve or veto each line item appropriation, however, vetoes are subject to legislative override. For the majority of the appropriations, the legal level of budgetary control is at the agency level by activity or function as well as by major expenditure classification. Unexpended appropriations at June 30 are available for subsequent expenditure if they have been encumbered and are presented for payment during the succeeding two-month lapse period. Factors Affecting Financial Condition After two consecutive years of decline, the Mississippi economy is expected to show a slight gain in 2015. According to the Bureau of Economic Analysis (BEA), real gross domestic product (GDP) in Mississippi declined 0.5 percent in 2013 and was flat in 2014. Like the nation, the state began 2015 at a slow pace before gaining momentum in the middle of the year. However, real GDP growth is expected to have reached 1.0 percent for the year. While positive, this growth is well below the 2.4 percent observed in the nation as a whole. Growth is expected to strengthen in 2016, reaching 1.9 percent in the state while the nation is expected to see another 2.4 percent growth. Employment grew 0.9 percent in 2015 over 2014. This rate is slightly better than the 0.7 percent observed in 2014. Growth in the state has not been above 0.9 percent since 2007. The 0.9 percent growth reflects an increase of 10,075 jobs. The gains were broad-based with most sectors adding jobs, as was the case in 2014. Like 2014, the largest decline occurred in the construction sector as large projects such as the Kemper Power Plant continued to wind down. The mining sector also experienced job losses in response to the falling oil prices. The largest job gains for the year occurred in the leisure and hospitality sector. Inflation adjusted gaming revenue rose in 2015 for the first time since 2007. The state also experienced large gains in transportation and warehousing, temporary business services, health care services, manufacturing, and state and local government. Unemployment claims remain relatively low. The ISM Index of U.S. Manufacturing Activity has weakened in 2015. While this index is a national measure, it is thought to be a relevant indicator for the Mississippi economy. Manufacturing continues to have a significant presence in the state. Despite the weakness nationally, the state’s manufacturing sector has been resilient in 2015 as measured by hours worked and employment. Growth in these measures has softened in 2015, however, and may face continued pressure if the U.S. manufacturing continues to struggle. Building permits are on the rise in Mississippi. For 2015, the number of units rose 21.6 percent. This increase compares to less than 3.2 percent in 2014 and 4.3 percent in 2013 and is similar to the growth observed in 2012 (21.1 percent). Based on the FHFA House Price Index, home prices are also rising, up an average of 3.4 percent in 2015 for the state. This gain is more than twice the pace of growth observed in 2014 and is in fact the strongest growth since 2007. Mississippi’s income growth continues to lag that of the nation. BEA reports nominal total personal income grew 2.8 percent in the state for the first half of 2015 relative to the prior year, which compares to the national average of 4.3 percent. Income is derived from three sources: earnings; transfer payments; dividends, interest, and rent. Mississippi’s weakness is primarily concentrated in the earnings growth. Mississippi earnings were up only 1.5 percent in the first half of 2015 compared to the national average growth of 4.0 percent. Mississippi’s Index of Leading Economic Indicators reached a high point in July but weakened in the latter half. The growth relative to six months ago has slowed but has not been negative. This performance suggests the state’s economy will continue at a slow pace in the coming months but is not expected to contract.
7
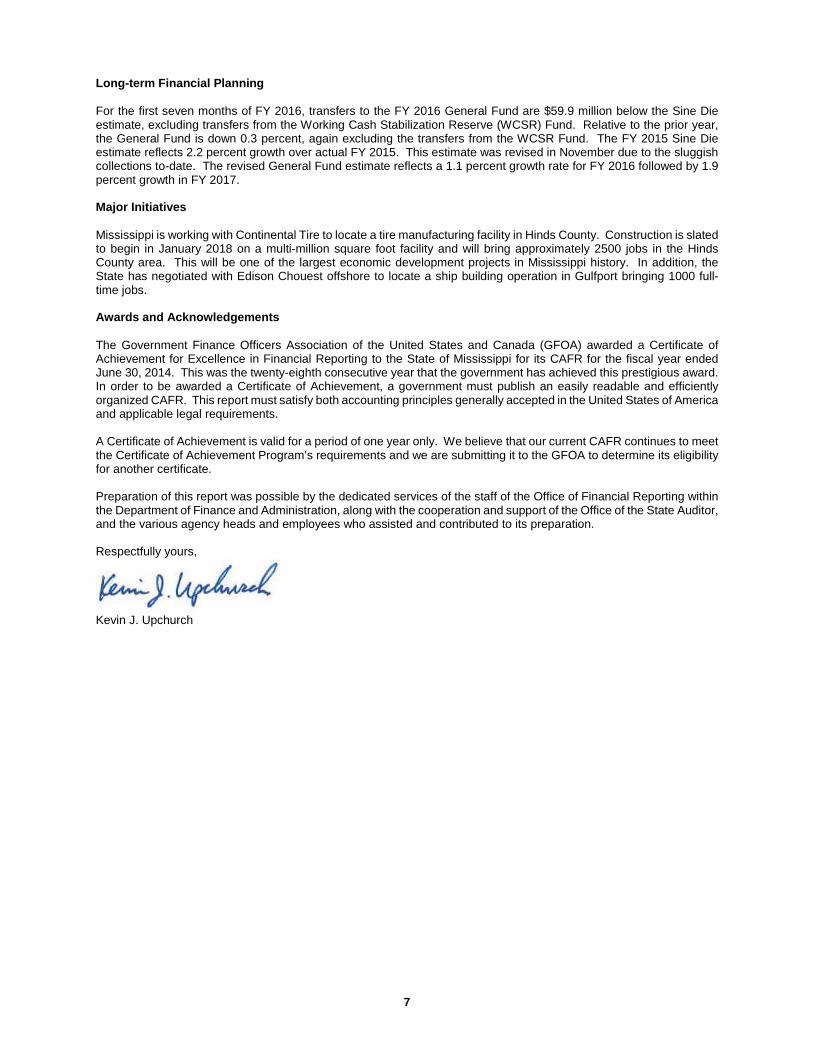
Long-term Financial Planning For the first seven months of FY 2016, transfers to the FY 2016 General Fund are $59.9 million below the Sine Die estimate, excluding transfers from the Working Cash Stabilization Reserve (WCSR) Fund. Relative to the prior year, the General Fund is down 0.3 percent, again excluding the transfers from the WCSR Fund. The FY 2015 Sine Die estimate reflects 2.2 percent growth over actual FY 2015. This estimate was revised in November due to the sluggish collections to-date. The revised General Fund estimate reflects a 1.1 percent growth rate for FY 2016 followed by 1.9 percent growth in FY 2017. Major Initiatives Mississippi is working with Continental Tire to locate a tire manufacturing facility in Hinds County. Construction is slated to begin in January 2018 on a multi-million square foot facility and will bring approximately 2500 jobs in the Hinds County area. This will be one of the largest economic development projects in Mississippi history. In addition, the State has negotiated with Edison Chouest offshore to locate a ship building operation in Gulfport bringing 1000 full-time jobs. Awards and Acknowledgements The Government Finance Officers Association of the United States and Canada (GFOA) awarded a Certificate of Achievement for Excellence in Financial Reporting to the State of Mississippi for its CAFR for the fiscal year ended June 30, 2014. This was the twenty-eighth consecutive year that the government has achieved this prestigious award. In order to be awarded a Certificate of Achievement, a government must publish an easily readable and efficiently organized CAFR. This report must satisfy both accounting principles generally accepted in the United States of America and applicable legal requirements. A Certificate of Achievement is valid for a period of one year only. We believe that our current CAFR continues to meet the Certificate of Achievement Program’s requirements and we are submitting it to the GFOA to determine its eligibility for another certificate. Preparation of this report was possible by the dedicated services of the staff of the Office of Financial Reporting within the Department of Finance and Administration, along with the cooperation and support of the Office of the State Auditor, and the various agency heads and employees who assisted and contributed to its preparation. Respectfully yours,
Kevin J. Upchurch

Mississippi
8
Officials of State Government
Executive Branch Legislative Branch Judicial Branch
Governor Phil Bryant
Speaker of the House of Representatives Philip Gunn
Supreme Court of Mississippi
Chief Justice Lieutenant Governor Tate Reeves
Speaker Pro Tempore of the House of Representatives Greg Snowden
William L. Waller, Jr.
Secretary of State Presiding Justices Delbert Hosemann President Pro Tempore of the Senate
Giles Ward Jess H. Dickinson Michael K. Randolph
State Auditor Stacey Pickering Secretary of Senate
Liz Welch Justices Ann H. Lamar James W. Kitchens David A. Chandler Randy G. Pierce Leslie D. King Josiah D. Coleman
State Treasurer Lynn Fitch Clerk of the House of Representatives
Andrew Ketchings Attorney General Jim Hood Legislative Budget Office
Debbie Rubisoff, DirectorCommissioner of Agriculture and Commerce Cindy Hyde-Smith
Joint Legislative Committee on Performance Evaluation and Expenditure Review James A. Barber, Director
Clerk of the Supreme Court Muriel Ellis
Commissioner of Insurance Mike Chaney
Transportation Commissioners Dick Hall Tom King Mike Tagert
Public Service Commissioners Brandon Presley Lynn Posey R. Stephen Renfroe
State Fiscal Officer Kevin J. Upchurch

Mississippi
9
Organization Chart
Legislative
Executive
Judicial
Senate House of Representatives
Joint Operations Legislative Budget Office
Legislative PEER
State Supreme Court Commission on Judicial
Performance Circuit & Chancery Courts
State Court of Appeals
Independent Agencies and Institutions
Governor
Other Elected Officials
Archives & History
Community & Junior Colleges Education
Educational Television Authority Forestry Commission Gaming Commission
Health Institutions of Higher Learning
Information Technology Services Mental Health
State Personnel Board Public Employees’ Retirement System
Rehabilitation Services Revenue
Workers’ Compensation Commission Regulatory Agencies
Other Boards & Commissions
Banking & Consumer Finance
Corrections MS Development Authority Emergency Management
Employment Security Environmental Quality
Finance & Administration Human Services
Marine Resources Medicaid Military
Public Safety State Aid Road Construction Wildlife, Fisheries & Parks
State Auditor
Secretary of State State Treasurer
Lieutenant Governor Attorney General
Commissioner of Agriculture Public Service Commissioners Transportation Commissioners
Commissioner of Insurance
Citizens of Mississippi

10
Government Finance Officers Association
Certificate of Achievement for Excellence
in Financial Reporting
Presented to
State of Mississippi
For its Comprehensive Annual Financial Report
for the Fiscal Year Ended
June 30, 2014
Executive Director/CEO

Mississippi
11
Financial Section


Mississippi
16
The following discussion and analysis of the State of Mississippi’s financial performance provides an overview of the State’s financial activities for the fiscal year ended June 30, 2015. Readers are encouraged to consider the information presented here in conjunction with the transmittal letter, which is located in the Introduction of this report, and the State’s financial statements, which immediately follow this discussion and analysis.
Financial Highlights Government-wide - The assets and deferred outflows of resources of the State exceeded its liabilities and deferred inflows of resources at the close of the fiscal year by $12,986,054,000 (reported as “net position”). Of this amount, a negative $5,824,331,000 was reported as “unrestricted net position”, which means that it would be necessary to convert a portion of the restricted component of net position to unrestricted if the government’s ongoing obligations to citizens and creditors were immediately due and payable. The State had $4,516,667,000 in restricted net position. Net position of governmental activities and business-type activities increased by $276,058,000 and $126,974,000, respectively. Fund Level - At the end of the fiscal year, the State’s governmental funds reported combined ending fund balances of $4,203,829,000, which is $80,545,000 less than the previous year. Federal government revenues continued their downward trend with many programs ending and others not being renewed. Revenues from taxes grew once again as the economy continued to improve. As overall revenues increased, expenditures followed suit. Long-term Debt - The total outstanding net long-term bonds and notes were $5,507,991,000 at June 30, 2015. During the year, the State issued $882,447,000 in bonds and notes, net of premiums. These bonds and notes were issued primarily for refunding and capital improvements.
Overview of the Financial Statements This discussion and analysis serves as an introduction to the State’s basic financial statements, which include government-wide financial statements, fund financial statements, and the notes to the financial statements. This report also contains required supplementary information and other supplementary information. Government-wide Financial Statements The government-wide financial statements are designed to provide the reader with a broad overview of the State’s finances. These statements consist of the statement of net position and the statement of activities, which are prepared using the flow of economic resources measurement focus and the accrual basis of accounting. The current year’s revenues and expenses are taken into account regardless of when cash is received or paid. The statement of net position presents all of the State’s nonfiduciary assets, deferred outflows of resources, liabilities, and deferred inflows of resources, with the difference reported as net position. Over time, increases or decreases in the State’s net position may serve as a useful indicator of whether its financial position is improving or deteriorating. The statement of activities presents information showing how the government’s net position changed during the most recent fiscal year. All changes in net position are reported as soon as the underlying event giving rise to the change occurs, regardless of the timing of related cash flows. Thus, revenues and expenses are reported in this statement for some items that will only result in cash flows in future fiscal periods (e.g., uncollected taxes and earned but unused vacation leave). The government-wide financial statements for the primary government report two types of activities:
Governmental Activities - The State’s basic services are reported here, including general government; education; health and social services; law, justice and public safety; recreation and resource development; regulation of business and professions; and transportation. Taxes and federal grants finance most of these activities. Business-type Activities - The cost of providing goods or services to the general public, which is financed or recovered primarily through user charges, is reported here. State fair and coliseum operations; home mortgage loans to veterans; port facilities; and unemployment compensation services are examples of these activities.
Fund Financial Statements A fund is a grouping of related accounts that is used to maintain control over resources that have been segregated for specific activities or objectives. The State, like other state and local governments, uses fund accounting to ensure and demonstrate compliance with finance-related legal requirements. The State’s funds are divided into three categories: governmental funds, proprietary funds, and fiduciary funds. These categories use different accounting approaches and should be interpreted differently. Governmental Funds - Most of the State’s general activities are reported in governmental funds. Governmental funds are used to account for essentially the same functions reported as governmental activities in the government-wide financial statements.
Management’s Discussion and Analysis

Mississippi
17
However, governmental funds are accounted for using the modified accrual basis of accounting and the flow of current financial resources measurement focus. This approach focuses on near-term inflows and outflows of spendable resources, as well as balances of spendable resources available at year end. The governmental fund statements provide a detailed view of the State’s near-term financing requirements. Governmental funds are comprised of the General Fund, which is presented separately as a major fund, and permanent funds.
Because the focus of governmental funds is narrower than that of the government-wide financial statements, it may be useful to compare the information presented for governmental funds with similar information presented for governmental activities in the government-wide financial statements. By doing so, the reader may gain a better understanding of the long-term impact of the State’s near-term financing decisions. Both the governmental fund balance sheet and statement of revenues, expenditures and changes in fund balances provide a reconciliation to facilitate this comparison between governmental funds and governmental activities.
Proprietary Funds - The State maintains two types of proprietary funds: enterprise and internal service. Enterprise funds charge fees for services to outside customers. They are accounted for using the flow of economic resources measurement focus and the accrual basis of accounting, and are used to report the same functions presented as business-type activities in the government-wide financial statements. Internal service funds provide personnel, insurance, and information technology services to other state agencies, as well as other governmental entities, on a cost reimbursement basis. Because these services primarily benefit governmental rather than business-type functions, they have been included in governmental activities on the government-wide financial statements.
Proprietary funds provide the same type of information as the government-wide financial statements, only in more detail. The Unemployment Compensation Fund, the Port Authority at Gulfport Fund, and the Prepaid Affordable College Tuition Fund are presented separately as major funds, with the nonmajor enterprise funds combined into a single column. The internal service funds are presented in a single column on the proprietary fund statements as well. The eight nonmajor enterprise funds and the three internal service funds are presented in detail in the combining financial statements.
Fiduciary Funds - Fiduciary funds are used to account for resources held for the benefit of parties outside the state government. Because these resources are not available to support the State’s own programs, fiduciary funds are not reported in the government-wide financial statements. The State’s fiduciary activities are presented in a statement of fiduciary net position and a statement of changes in fiduciary net position, with related combining financial statements. These funds, which include pension trust funds, private-purpose trust funds, and agency funds, are reported using the accrual basis of accounting.
Reconciliation of Government-wide and Fund Financial Statements
The financial statements include two schedules that reconcile the amounts reported on the governmental fund financial statements (modified accrual basis of accounting) with government-wide financial statements (accrual basis of accounting). The following summarizes the major differences between the two statements:
Capital assets used in governmental activities are not reported on governmental funds financial statements. Capital outlay spending results in capital assets on government-wide financial statements, but is reported as expenditures on the governmental funds financial statements.
Bond and note proceeds result in liabilities on the government-wide financial statements, but are recorded as other financing sources on the governmental funds financial statements. Certain other outflows represent either increases or decreases in liabilities on the government-wide financial statements, but are reported as expenditures on the governmental funds financial statements.
Notes to the Financial Statements
The notes provide additional information that is essential to a full understanding of the data provided in the government-wide and fund financial statements. The notes to the financial statements can be found immediately following the component unit financial statements.
Other Information
This report also contains the following required supplementary information (RSI): the Budgetary Comparison Schedule - Budget and Actual (Non-GAAP Basis) - All Budgetary Funds, the Schedule of Employer Contributions, the Schedules of the Proportionate Share of the Net Pension Liability, and the Schedules of Funding Progress for other post-employment benefits, along with the accompanying notes. The combining financial statements are presented as supplementary information immediately following the RSI.

Mississippi
18
Government-wide Financial Analysis
Net Position
The State’s combined net position for governmental and business-type activities decreased $2,155,516,000 in fiscal year 2015. Current year net position is $12,986,054,000 in contrast to the prior year balance of $15,141,570,000. The decrease is due primarily to the implementation of GASB Statement No. 68, Accounting and Financial Reporting for Pensions – an amendment of GASB Statement No. 27 and GASB Statement No. 71, Pension Transition for Contributions Made Subsequent to the Measurement Date – an amendment of GASB Statement No. 68 . Beginning net position, as restated, decreased by $2,558,548,000 as a result of the implementation. Business-type activities reported positive balances in all three components of net position, while governmental activities and the State as a whole continued to reflect a negative balance in the unrestricted component of net position.
Net position consisted primarily of investment in capital assets such as land, buildings, machinery and equipment, and infrastructure, less any outstanding debt used to acquire those assets. The State uses these capital assets to provide services to citizens; consequently, these assets are not available for future spending. Although the State’s investment in capital assets is reported net of related debt, it should be noted that the resources needed to repay this debt must be provided from other sources since the capital assets themselves cannot be used to liquidate these liabilities.
Net investment in capital assets increased $565,491,000 from the previous year. The governmental activities’ increase of $469,814,000 was primarily due to additions to construction in progress related to building projects, as well as additions to infrastructure for roads, highways, and bridges. The business-type activities’ increase of $95,677,000 can be attributed to ongoing construction projects at the Port Authority at Gulfport.
Restricted net position represents resources that are subject to externally imposed restrictions. Restricted net position increased by 6.6 percent, or $280,031,000, during fiscal year 2015.
The remaining net position is classified as unrestricted. As of June 30, 2015, the State had a deficit unrestricted net position of $5,824,331,000. The deficit is due, in part, to the State issuing debt on behalf of component units and other entities for construction, repair and renovation of non-state capital assets. The positive unrestricted balance of $181,529,000 in business-type activities may be used to meet ongoing obligations to citizens and creditors; however, internally imposed designations of certain resources further limit the purposes for which those resources may be used.
2015 2014* 2015 2014* 2015 2014*
Current and other assets $ 6,371,968 $ 6,278,663 $ 1,362,028 $ 1,311,263 $ 7,733,996 $ 7,589,926Capital assets 15,375,583 14,945,218 412,657 320,967 15,788,240 15,266,185
Total Assets 21,747,551 21,223,881 1,774,685 1,632,230 23,522,236 22,856,111
Deferred outflowsof resources 375,115 122,121 2,958 378,073 122,121
Noncurrent liabilities 7,879,320 5,428,491 498,805 481,882 8,378,125 5,910,373Other liabilities 2,114,440 1,889,064 54,333 37,225 2,168,773 1,926,289
Total Liabilities 9,993,760 7,317,555 553,138 519,107 10,546,898 7,836,662
Deferred inflowsof resources 364,756 2,601 367,357
Net position:Net investment in
capital assets 13,900,211 13,430,397 393,507 297,830 14,293,718 13,728,227Restricted 3,869,799 3,633,805 646,868 602,831 4,516,667 4,236,636Unrestricted (6,005,860) (3,035,755) 181,529 212,462 (5,824,331) (2,823,293)
Total Net Position $ 11,764,150 $ 14,028,447 $ 1,221,904 $ 1,113,123 $ 12,986,054 $ 15,141,570
Net Position(amounts expressed in thousands)
Business-typeActivities Total
GovernmentalActivities

19
Changes in Net Position
2015 2014* 2015 2014* 2015 2014*Revenues:
Program Revenues:Charges for services $ 2,325,299 $ 2,216,861 $ 192,836 $ 209,277 $ 2,518,135 $ 2,426,138Operating grants
and contributions 7,059,002 6,796,079 3,065 57,162 7,062,067 6,853,241Capital grants
and contributions 487,083 548,283 33 487,083 548,316General Revenues:
Taxes 6,935,999 6,862,681 6,935,999 6,862,681Investment income 53,689 82,307 28,585 70,196 82,274 152,503
Total Revenues 16,861,072 16,506,211 224,486 336,668 17,085,558 16,842,879Expenses:
General government 2,951,973 2,069,107 2,951,973 2,069,107Education 3,383,767 3,996,554 3,383,767 3,996,554Health and social services 7,679,895 7,394,045 7,679,895 7,394,045Law, justice and public safety 967,422 923,952 967,422 923,952Recreation and resource
development 556,790 637,850 556,790 637,850Regulation of business and
professions 40,760 39,174 40,760 39,174Transportation 675,713 647,532 675,713 647,532Interest on long-term debt 225,512 243,099 225,512 243,099Unemployment compensation 109,468 204,206 109,468 204,206Port Authority at Gulfport 26,202 25,688 26,202 25,688Prepaid affordable college tuition 27,122 103,134 27,122 103,134Other business-type 37,902 37,379 37,902 37,379
Total Expenses 16,481,832 15,951,313 200,694 370,407 16,682,526 16,321,720Excess/(Deficit) before Transfers 379,240 554,898 23,792 (33,739) 403,032 521,159
Transfers (103,182) (48,583) 103,182 48,583Change in Net Position 276,058 506,315 126,974 14,844 403,032 521,159
Net Position - Beginning, as restated 11,488,092 13,522,132 1,094,930 1,098,279 12,583,022 14,620,411Net Position - Ending $ 11,764,150 $ 14,028,447 $ 1,221,904 $ 1,113,123 $ 12,986,054 $ 15,141,570
* The 2014 amounts presented here have not been restated for the implementation of GASB Statement 68.
Total
Mississippi
Changes in Net Position(amounts expressed in thousands)
GovernmentalActivities
Business-typeActivities
Operating grants and contributions of $7,062,067,000 and taxes of $6,935,999,000 were the State’s major revenue sources.Together, they accounted for 81.9 percent of total revenues. Revenue from taxes increased $73,318,000 and operating grants andcontributions increased by $208,826,000 over the prior year, improving net position. As in the prior year, the majority of the State’stotal expenses were related to the health and social services function at $7,679,895,000 or 46.0 percent. Expenses within thisfunction rose over the prior year by $285,850,000 as medical expenses continued their upswing. Unemployment compensationexpenses were down by $94,738,000 as fewer claims were filed driven by an improving economy.

20
Governmental Activities
Mississippi
Governmental Activities - Revenues by Source
Governmental activities increased the State’s net position by $276,058,000 for fiscal year 2015. Operating grants andcontributions and taxes, the largest sources of revenue, increased by $262,923,000 and $73,318,000, respectively, incomparison to the prior year. The majority of both expenses and program revenues were in the health and social servicesfunction at $7,679,895,000 and $6,359,147,000, respectively. Education expenses of $3,383,767,000 exceeded programrevenues of $721,237,000 resulting in a negative $2,662,530,000 to be funded from general revenues.
Governmental Activities - Expenses and Program Revenues(amounts expressed in thousands)
0500,000
1,000,0001,500,0002,000,0002,500,0003,000,0003,500,0004,000,0004,500,0005,000,0005,500,0006,000,0006,500,0007,000,0007,500,0008,000,000
Generalgovernment
Education Health & socialservices
Law, justice &public safety
Recreation &resource
development
Regulation ofbusiness &professions
Transportation Interest on long-term debt
Expenses Program Revenues
Charges for services
13.8%
Operating grants and
contributions41.9%
Capital grants and
contributions2.9%
Taxes41.1%
Investment income
0.3%
Note: Amounts are less than $50,000

Mississippi
22
Financial Analysis of the State’s Individual Funds
As noted earlier, the State uses fund accounting to ensure and demonstrate compliance with finance-related legal requirements.
Governmental Funds
At June 30, 2015, the governmental funds reported combined fund balances of $4,203,829,000, indicating a decrease of $80,545,000 from the prior year. Within fund balances, $110,078,000 or 2.6 percent was classified as nonspendable. The majority of the fund balance, $3,759,721,000 or 89.4 percent was restricted. Committed fund balance equaled $88,919,000 or 2.1 percent of the total. Assigned fund balance comprised 0.3 percent or $12,121,000. The remaining 5.6 percent, or $232,990,000, of fund balance was unassigned.
The General Fund is the chief operating fund of the State. The General Fund decreased $81,606,000 from the prior year to an ending fund balance of $4,141,155,000. Taxes increased by $139,412,000 or 2.0 percent, with increases in all major categories. Federal government revenues rebounded in fiscal year 2015, increasing by $156,793,000 after a decrease of $151,516,000 in fiscal year 2014.
Health and social services expenditures related to Medicaid continue to increase as more of the Medicaid eligible population enrolled to comply with the Affordable Care Act mandate for health insurance. Expenditures also increased as children moved from the fee-for-service program to the managed care program. Under the fee-for-service program, providers have up to a year to submit claims for allowable cost reimbursement, while under the managed care program, payments are made to the vendors at the beginning of every month.
Proprietary Funds
The Unemployment Compensation Fund experienced an increase in net position of $44,037,000 as compared to the prior year. Operating expenses decreased by $94,738,000 from the prior year as a result of a reduction in claims and benefits expense as the economy continued to gradually improve. As a result of the end of the Emergency Unemployment Compensation program, federal revenue declined by $54,140,000.
The Port Authority at Gulfport Fund increased net position by $84,855,000 as compared to a $32,531,000 increase reported in the prior year. Operating revenues were flat while operating expenses increased slightly. The increase in net position is attributable to the $91,316,000 received in federal pass through grants from other state agencies which enabled the Port to continue the implementation of its facility restoration plan.
The Prepaid Affordable College Tuition Fund’s net position decreased by $5,872,000. After being deferred in August 2012, the program was opened to new contracts in fiscal year 2015. As a result tuition receipts increased by $6,859,000 over the prior year. The $76,257,000 decrease in claims and benefits expense was directly related to changes in the program’s actuarial assumptions.
General Fund Budgetary Highlights
The original estimated growth rate for fiscal year 2015 General Fund revenues was 2.7 percent. This estimate was revised to sine die, which reflected a 1.1 percent growth, and revised in March 2015 to reflect a growth of 3.0 percent. Actual fiscal year 2015 General Fund revenue collections were $134,120,000 or 2.5 percent higher than the prior year. These revenues were $75,827,000 above estimated amounts. Each of these revenue components grew: $79,206,000 or 4.1 percent in sales tax, $76,636,000 or 4.6 percent in individual income tax, and $37,040,000 or 5.5 percent in corporate income and franchise tax.
The final expenditure budget was $7,271,000 less than the original budget and actual expenditures were $15,521,000 less than the final budget.

23
Capital Assets
Major capital asset events during fiscal year 2015 included the following:
Land $ 2,281,727 $ 2,234,358 $ 130,416 $ 130,416 $ 2,412,143 $Software 104,036 56,631 104,036Buildings 1,503,879 1,501,715 54,144 55,667 1,558,023Land improvements 136,755 119,225 23,323 18,467 160,078Machinery and equipment 249,267 255,836 7,769 8,224 257,036Infrastructure 6,842,347 6,674,282 99,877 72,106 6,942,224Construction in progress 4,257,572 4,103,171 97,128 36,087 4,354,700 Total $ 15,375,583 $ 14,945,218 $ 412,657 $ 320,967 $ 15,788,240 $
Mississippi
Additional information about the State’s capital assets is presented in Note 8 to the financial statements. Note 16 addresses theState’s outstanding long-term contracts related to the construction of state and county roads, highways, and bridges, as well asbuilding projects for various state agencies.
The State’s investment in capital assets for governmental and business-type activities as of June 30, 2015 were$20,544,653,000, less accumulated depreciation of $4,756,413,000, resulting in a net book value of $15,788,240,000. For thecurrent fiscal year, governmental activities and business-type activities increased by $430,365,000 and $91,690,000,respectively. These changes amount to 2.8 and 28.0 percent increases, respectively, over the prior year.
Capital Assets and Debt Administration
Construction in progress for governmental activities had the largest increases and decreases of any asset class with$740,927,000 and $586,526,000, respectively. Mississippi Department of Transportation accounts for the majority of theincrease with $714,140,000. The Department of Finance and Administration added $16,205,000 which included buildingprojects for the Department of Public Safety Central Mississippi Crime Lab, the Mississippi Museum's Civil Rights andHistory Museum, and East Mississippi State Hospital's Receiving Units. Decreases to construction in progress areprimarily for completed Mississippi Department of Transportation projects moved to infrastructure.
Governmental activities added $552,179,000 to infrastructure for roads, highways and bridges. These additions includedpavement rehabilitation projects in Pearl River, Harrison, Lincoln, and Marshall counties. Bridges were constructed andrehabilitatied in Hancock, Jefferson, Pearl River, Desoto, and Jefferson-Davis counties. The Surface TransportationProgram (Urban street projects) were brought to a close in Kemper, Hancock, and Prentiss counties. Phase II and III ofthe Four Lane Highway Program were finalized in Oktibbeha, Convington, and Wayne counties, and interstate projectswere completed in Hancock and Lauderdale counties.
15,266,185
During fiscal year 2015, net capital assets for business-type activities increased by $91,690,000. The Port Authority atGulfport added $92,603,000 to construction in progress, which includes the West Pier warehouse and a tenantmaintenance and repair shop. Construction of a three rail mounted gantry crane was also started. Projects completedand moved to infrastructure and land improvements included a Small Craft Harbor breakwater, wharf enhancements onthe West Pier, and rail improvements on the East Pier. The completed projects were valued at $31,850,000.
Capital Assets, Net of Depreciation(amounts expressed in thousands)
2,364,7742015 2014 2015 2014
264,060
1,557,382137,692
6,746,3884,139,258
56,631
2015 2014
GovernmentalActivities
Business-typeActivities Total

Mississippi
24
Debt Administration
As of June 30, 2015, outstanding general obligation debt for the State was $4,393,997,000, including premiums. General Obligation Refunding bonds of $1,902,346,000, Capital Improvements bonds of $994,146,000, and Industry Incentive Financing bonds of $354,475,000 comprise 74.0 percent of this outstanding debt. During the current fiscal year, the State issued $712,750,000 in general obligation bonds which are reported in governmental activities. Refunding bonds account for $429,115,000 of the bonds issued, with the remainder being issued primarily for capital improvements. Within business-type activities, general obligation bonds decreased by $2,833,000 as the Port Authority at Gulfport continued to repay its long-term debt.
Mississippi has a rating of AA from Standard and Poor’s, AA+ from Fitch, and Aa2 from Moody’s. These ratings are based upon the State’s conservative fiscal management practices, manageable debt levels, favorable effects of various budgetary reforms and the potential for future economic diversification.
The State’s constitutional debt limit is established at one and one-half times the sum of all revenues collected by the State during any one of the four preceding fiscal years, whichever may be higher. Current practice restricts revenues included in the computation of this debt limitation to the following: taxes; licenses, fees and permits; investment income; rental income; service charges including net income from the Alcoholic Beverage Control Division; and fines, forfeitures and penalties. As of June 30, 2015, the State had established a constitutional legal debt limit of $13,312,194,000, which significantly exceeds the amount of debt applicable to the debt limit. Additional information about the State’s long-term debt can be found in Notes 9 through 13 to the financial statements.
Outstanding Long-term Debt Bonds and Notes
(amounts expressed in thousands)
2015 2014 2015 2014 2015 2014General obligation
bonds and notes $ 4,381,327 $ 4,297,643 $ 12,670 $ 15,503 $ 4,393,997 $ 4,313,146Notes payable 1,113,994 1,078,967 1,113,994 1,078,967 Total $ 5,495,321 $ 5,376,610 $ 12,670 $ 15,503 $ 5,507,991 $ 5,392,113
GovernmentalActivities
Business-typeActivities Total
Economic Factors and Next Year’s Budget
The State’s average unemployment rate for the calendar year 2015 was 6.5 percent. The national average was more favorable at 5.3 percent for the same period. After rising toward the end of 2015, the unemployment rate has fallen in the first quarter of 2016. Current inflationary trends in the region compare favorably to national indexes.
The State’s economy appears to be experiencing an improvement in fiscal year 2016 relative to fiscal year 2015. However, General Fund transfers are not performing as well as expected. The fiscal year 2016 sine die estimate reflected a 2.2 percent growth rate over actual fiscal year 2015. Because collections in fiscal year 2015 were below the estimate and collections during the first quarter of fiscal year 2016 were sluggish, the estimate was lowered in November 2015 by $64,900,000 to reflect 1.1 percent growth rate over actual fiscal year 2015. Collections in key revenue sources such as sales tax and corporate tax continued to perform below the revised expectations. However, the fiscal year 2016 General Fund also received additional funds which were not reflected in the November estimate, including: a $66,200,000 transfer from Attorney General settlements; a $35,200,000 transfer from the Working Cash Stabilization Fund; and a $7,100,000 transfer from Special Funds. These transfers of $108,500,000 were not anticipated in the November revised estimate. Taking into account the sluggish tax collections and the unanticipated influx of revenue, the fiscal year 2016 estimate was revised in April 2016 to 1.6 percent growth rate over the fiscal year 2015 General Fund. Without the unanticipated funds, the April revised estimate would reflect a 0.4 percent reduction in the fiscal year 2016 General Fund relative to fiscal year 2015.
The April revised estimate for fiscal year 2016 reflects an expected gain in sales tax collections of 0.8 percent, a gain in personal income tax of 4.0 percent, and a decline in corporate income and franchise tax of 11.8 percent. Transfers from insurance premium tax are expected to grow 22.2 percent above the fiscal year 2015 figure.
Request for Information
This financial report is designed to provide our citizens, taxpayers, customers, investors, and creditors with a general overview of the State of Mississippi’s finances and to demonstrate the State’s accountability for the money it receives. If you have any questions about this report or need additional financial information, contact: Department of Finance and Administration, Office of Financial Reporting, P. O. Box 1060, Jackson, MS 39215.

Mississippi
25
Basic Financial Statements
26
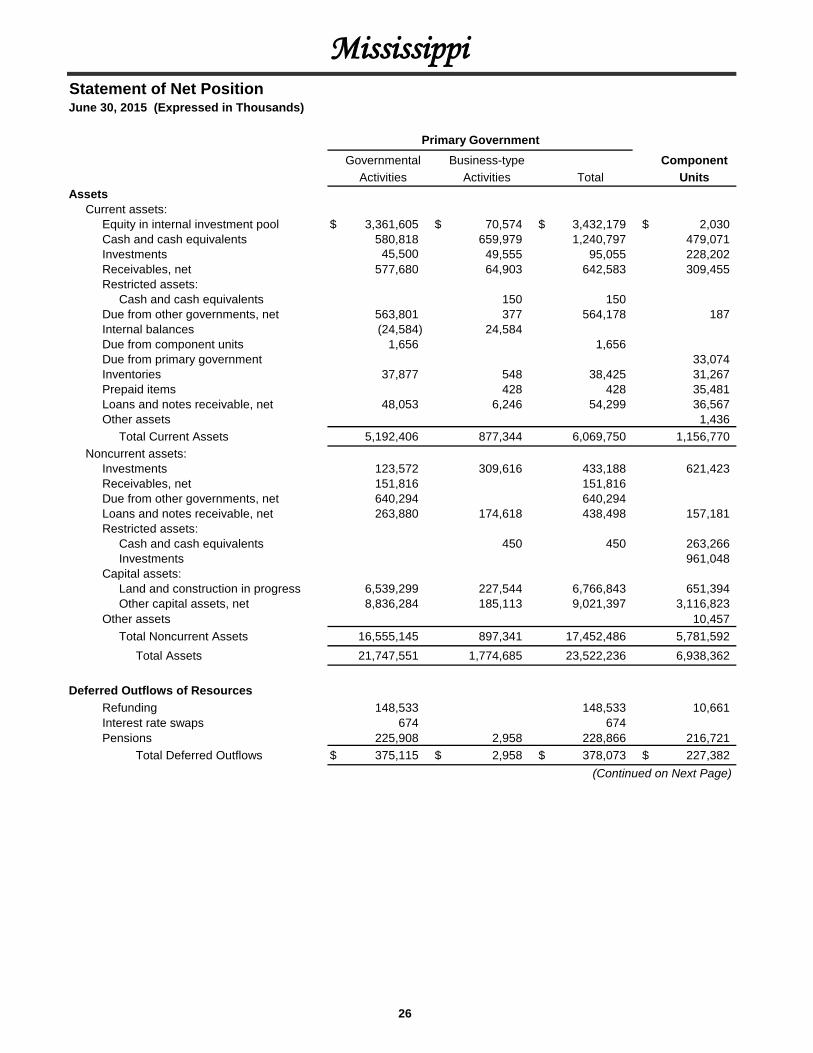
Statement of Net PositionJune 30, 2015 (Expressed in Thousands)
Governmental Business-type ComponentActivities Activities Total Units
Assets Current assets: Equity in internal investment pool $ 3,361,605 $ 70,574 $ 3,432,179 $ 2,030 Cash and cash equivalents 580,818 659,979 1,240,797 479,071 Investments 45,500 49,555 95,055 228,202 Receivables, net 577,680 64,903 642,583 309,455 Restricted assets:
Cash and cash equivalents 150 150 Due from other governments, net 563,801 377 564,178 187 Internal balances (24,584) 24,584 Due from component units 1,656 1,656 Due from primary government 33,074 Inventories 37,877 548 38,425 31,267 Prepaid items 428 428 35,481 Loans and notes receivable, net 48,053 6,246 54,299 36,567 Other assets 1,436
Total Current Assets 5,192,406 877,344 6,069,750 1,156,770 Noncurrent assets: Investments 123,572 309,616 433,188 621,423 Receivables, net 151,816 151,816 Due from other governments, net 640,294 640,294 Loans and notes receivable, net 263,880 174,618 438,498 157,181 Restricted assets:
Cash and cash equivalents 450 450 263,266Investments 961,048
Capital assets:Land and construction in progress 6,539,299 227,544 6,766,843 651,394Other capital assets, net 8,836,284 185,113 9,021,397 3,116,823
Other assets 10,457Total Noncurrent Assets 16,555,145 897,341 17,452,486 5,781,592
Total Assets 21,747,551 1,774,685 23,522,236 6,938,362
Deferred Outflows of Resources Refunding 148,533 148,533 10,661 Interest rate swaps 674 674 Pensions 225,908 2,958 228,866 216,721
Total Deferred Outflows $ 375,115 $ 2,958 $ 378,073 $ 227,382
Mississippi
Primary Government
(Continued on Next Page)

27
Statement of Net PositionJune 30, 2015 (Expressed in Thousands)
Mississippi
(Continued from Previous Page)
Governmental Business-type ComponentActivities Activities Total Units
Liabilities Current liabilities: Warrants payable $ 116,028 $ 1,692 $ 117,720 $ Accounts payable and other liabilities 715,201 26,169 741,370 219,491 Contracts payable 75,536 3,992 79,528 Income tax refunds payable 213,517 213,517 Due to other governments 357,336 11,375 368,711 Due to component units 33,074 33,074 Due to primary government 1,656 Claims and benefits payable 140,314 5,772 146,086 Deposits 1,908 1,908 534 Unearned revenues 71,394 377 71,771 114,966 Pollution remediation obligation 8,017 8,017 Bonds and notes payable, net 376,848 2,974 379,822 34,243 Lease obligations payable 7,175 74 7,249 2,864 Other liabilities 71,058 Total Current Liabilities 2,114,440 54,333 2,168,773 444,812 Noncurrent liabilities: Due to other governments 85 11,920 12,005 Claims and benefits payable 35,479 457,274 492,753 Derivative instruments 40,440 40,440 Other postemployment benefits payable 157,474 157,474 Pollution remediation obligation 35,072 35,072 Bonds and notes payable, net 5,118,473 9,696 5,128,169 1,053,983 Lease obligations payable 13,034 197 13,231 68,379 Liabilities payable from restricted assets:
Deposits 150 150 Net pension liability 2,370,353 18,943 2,389,296 1,868,224 Other liabilities 108,910 625 109,535 265,847 Total Noncurrent Liabilities 7,879,320 498,805 8,378,125 3,256,433 Total Liabilities 9,993,760 553,138 10,546,898 3,701,245
Deferred Inflows of Resources Pensions 364,756 2,601 367,357 270,712
Primary Government
(Continued on Next Page)

. 28
Statement of Net PositionJune 30, 2015 (Expressed in Thousands)
Mississippi
(Continued from Previous Page)
Governmental Business-type ComponentActivities Activities Total Units
Net Position Net investment in capital assets 13,900,211 393,507 14,293,718 2,724,986 Restricted for:
Expendable: General government 289,527 289,527 Education 217,979 217,979 Health and social services 429,636 429,636 Law, justice and public safety 151,393 151,393 Recreation and resources development 1,360,540 1,360,540 Regulation of business and professions 63,533 63,533 Transportation 576,836 576,836 Capital projects 367,639 367,639 Debt service 340,515 340,515 2,070 Unemployment compensation benefits 646,418 646,418 Other purposes 450 450 599,747
Nonexpendable: Education 58,815 58,815 750,938 Health and social services 2,025 2,025 Recreation and resources development 11,361 11,361 Unrestricted (deficit) (6,005,860) 181,529 (5,824,331) (883,954) Total Net Position $ 11,764,150 $ 1,221,904 $ 12,986,054 $ 3,193,787
The accompanying notes to the financial statement are an intergral part of this statement.
Primary Government

(This page left blank intentionally)
29

The accompanying notes to the financial statements are an integral part of this statement.
30
Charges Operating Capitalfor Grants and Grants and
Functions/Programs Expenses Services Contributions ContributionsPrimary government:Governmental activities: General government $ 2,951,973 $ 1,292,467 $ 25,805 $ 841 Education 3,383,767 15,082 706,145 10 Health and social services 7,679,895 705,199 5,653,326 622 Law, justice and public safety 967,422 125,231 330,954 3,326 Recreation and resource development 556,790 73,478 325,908 516 Regulation of business and professions 40,760 44,456 568 Transportation 675,713 69,386 16,296 481,768 Interest on long-term debt 225,512 Total Governmental Activities 16,481,832 2,325,299 7,059,002 487,083
Business-type activities: Unemployment compensation 109,468 137,525 3,022 Port Authority at Gulfport 26,202 15,045 Prepaid affordable college tuition 27,122 13,220 Other business-type 37,902 27,046 43 Total Business-type Activities 200,694 192,836 3,065 Total Primary Government $ 16,682,526 $ 2,518,135 $ 7,062,067 $ 487,083
Component units: Universities $ 3,305,455 $ 1,994,437 $ 471,135 $ 62,016 Nonmajor 38,798 29,777 2,276 2,256 Total Component Units $ 3,344,253 $ 2,024,214 $ 473,411 $ 64,272
Net Position - Beginning, as restatedNet Position - Ending
Payment from State of MississippiContributions to permanent endowmentsTransfers Total General Revenues, Contributions and Transfers Change in Net Position
Investment income Other
Insurance Other
MississippiStatement of Activities
Program Revenues
For the Year Ended June 30, 2015 (Expressed in Thousands)
Corporate income and franchise
Gasoline and other motor fuel Individual income
General revenues: Taxes: Sales and use

31
Governmental Business-type ComponentActivities Activities Total Units
$ (1,632,860) $ $ (1,632,860)(2,662,530) (2,662,530)(1,320,748) (1,320,748)
(507,911) (507,911)(156,888) (156,888)
4,264 4,264(108,263) (108,263)(225,512) (225,512)
(6,610,448) (6,610,448)
31,079 31,079(11,157) (11,157)(13,902) (13,902)(10,813) (10,813)
(4,793) (4,793)(6,610,448) (4,793) (6,615,241)
$ (777,867)(4,489)
(782,356)
3,300,516 3,300,516414,779 414,779
1,744,620 1,744,620689,171 689,171273,710 273,710513,203 513,203
53,689 28,585 82,274 20,208204,782809,208
23,107(103,182) 103,182
6,886,506 131,767 7,018,273 1,057,305276,058 126,974 403,032 274,949
11,488,092 1,094,930 12,583,022 2,918,838$ 11,764,150 $ 1,221,904 $ 12,986,054 $ 3,193,787
Primary GovernmentNet (Expense) Revenue and Changes in Net Position

The accompanying notes to the financial statements are an integral part of this statement.
32
Balance SheetJune 30, 2015 (Expressed in Thousands)
General Permanent TotalsAssets Equity in internal investment pool $ 3,070,586 $ 2,569 $ 3,073,155 Cash and cash equivalents 450,772 1,342 452,114 Investments 75,085 57,904 132,989 Receivables, net 728,731 359 729,090 Due from other governments, net 1,203,228 1,203,228 Due from other funds 4,123 531 4,654 Due from component units 469 469 Inventories 37,877 37,877 Loans receivable, net 311,933 311,933
Total Assets $ 5,882,804 $ 62,705 $ 5,945,509Liabilities, Deferred Inflows and Fund BalancesLiabilities: Warrants payable $ 113,972 $ $ 113,972 Accounts payable and accruals 639,886 31 639,917 Contracts payable 75,536 75,536 Income tax refunds payable 213,517 213,517 Due to other governments 357,053 357,053 Due to other funds 48,809 48,809 Due to component units 33,051 33,051 Claims payable 42,276 42,276 Unearned revenues 60,705 60,705
Total Liabilities 1,584,805 31 1,584,836Deferred inflows of resources: Deferred revenues 156,844 156,844Fund balances: Nonspendable Inventories 37,877 37,877 Principal 15,000 57,201 72,201 Restricted General government 288,448 288,448 Education 213,992 3,987 217,979 Health and social services 414,038 305 414,343 Law, justice and public safety 144,785 144,785 Recreation and resources development 1,359,296 1,181 1,360,477 Regulation of business and professions 63,533 63,533 Transportation 562,002 562,002 Capital projects 367,639 367,639 Debt service 340,515 340,515 Committed General government 50,127 50,127 Education 16,949 16,949 Health and social services 3,900 3,900 Recreation and resources development 5,929 5,929 Transportation 12,014 12,014 Assigned General government 7,474 7,474 Education 7 7 Health and social services 2,541 2,541 Recreation and resources development 2,099 2,099 Unassigned 232,990 232,990
Total Fund Balances 4,141,155 62,674 4,203,829Total Liabilities, Deferred Inflows and Fund Balances $ 5,882,804 $ 62,705 $ 5,945,509
Governmental Funds
Mississippi

The accompanying notes to the financial statements are an integral part of this statement.
33
Reconciliation of the Governmental Funds Balance Sheetto the Statement of Net PositionJune 30, 2015 (Expressed in Thousands)
Total fund balances for governmental funds $ 4,203,829
Amounts reported for governmental activities in the statement of net position are different because:
Capital assets used in governmental activities are not financial resources and therefore are not reported in the governmental funds:
Land $ 2,281,727 Construction in progress 4,255,817 Software 116,340 Buildings 2,099,001 Land improvements 270,671 Machinery and equipment 700,025 Infrastructure 10,232,451 Accumulated depreciation (4,613,927) 15,342,105
Deferred outflows of resources reported in governmental activities are not financial resources and therefore are not reported in the governmental funds: Refunding of debt 148,533 Interest rate swaps 674 Pensions 222,987 372,194
Deferred inflows of resources for pensions reported in governmental activities are (361,413) not financial resources and therefore are not reported in the governmental funds
Some of the State's revenues will be collected after year-end but are not available soon enough to pay for the current period's expenditures and therefore are deferred in the funds as deferred inflows of resources. 156,844
Long-term liabilities and related accrued interest are not due and payable in the current period and therefore are not reported in the governmental funds:
General obligation bonds and notes (4,172,435) Notes payable (1,037,310) Unamortized premiums (285,576) Derivative instruments (40,440) Capital lease obligations (17,431) Accrued compensated absences (117,236) Pollution remediation obligation (43,089) Net pension liability (2,347,290) Other postemployment benefits payable (157,474) Claims payable (3,669) Accrued interest payable (59,411) (8,281,361)
Internal service funds are used by management to charge the costs of certain activities, such as insurance and telecommunications, to individual funds. The assets and liabilities of the internal service funds are included in governmental activities in the statement of net position. 331,952
Net position of governmental activities $ 11,764,150
Governmental Funds
Mississippi

The accompanying notes to the financial statements are an integral part of this statement.
34
Statement of Revenues, Expenditures, and Changes in Fund BalancesFor the Year Ended June 30, 2015 (Expressed in Thousands)
General Permanent TotalsRevenues Taxes: Sales and use $ 3,324,776 $ $ 3,324,776 Gasoline and other motor fuel 419,622 419,622 Individual income 1,747,961 1,747,961 Corporate income and franchise 691,769 691,769 Insurance 273,710 273,710 Other 515,596 515,596 Licenses, fees and permits 563,901 801 564,702 Federal government 7,500,282 7,500,282 Investment income 55,873 1,129 57,002 Charges for sales and services 361,793 361,793 Rentals 15,553 236 15,789 Court assessments and settlements 163,915 163,915 Other 653,595 13 653,608 Total Revenues 16,288,346 2,179 16,290,525Expenditures Current: General government 2,475,434 2,475,434 Education 3,381,828 118 3,381,946 Health and social services 7,685,805 7,685,805 Law, justice and public safety 959,927 959,927 Recreation and resources development 555,793 555,793 Regulation of business and professions 41,284 41,284 Transportation 1,047,355 1,047,355 Debt service: Principal 319,916 319,916 Interest and other fiscal charges 224,400 224,400 Total Expenditures 16,691,742 118 16,691,860 Excess of Revenues over (under) Expenditures (403,396) 2,061 (401,335)Other Financing Sources (Uses) Bonds and notes issued 366,575 366,575 Capital leases issued 2,322 2,322 Discounts on bonds issued (353) (353) Insurance recovery 22,732 22,732 Payments to bond escrow agent (483,163) (483,163) Premiums on bonds and notes issued 86,758 86,758 Refunding bonds issued 429,115 429,115 Transfers in 3,513 3,513 Transfers out (105,709) (1,000) (106,709) Net Other Financing Sources (Uses) 321,790 (1,000) 320,790 Net Change in Fund Balances (81,606) 1,061 (80,545)Fund Balances - Beginning 4,222,761 61,613 4,284,374Fund Balances - Ending $ 4,141,155 $ 62,674 $ 4,203,829
Governmental Funds
Mississippi

The accompanying notes to the financial statements are an integral part of this statement.
35
Governmental FundsReconciliation of the Governmental Funds Statement of Revenues, Expenditures, andChanges in Fund Balances to the Statement of Activities For the Year Ended June 30, 2015 (Expressed in Thousands)
Net change in fund balances - total governmental funds $ (80,545)
Amounts reported for governmental activities in the statement of activities are different because:
Governmental funds report capital outlay as expenditures. However, in the statement of activities, the cost of capital assets is allocated over their estimated useful lives as depreciation expense. In the current period, these amounts are:
Capital outlay $ 846,466Depreciation expense (414,319) 432,147
Various capital asset related transactions affect the statement of activities but have no impact on governmental funds. These transactions include disposition of capital assets by sale, trade, or scrap. (4,784)
Internal service funds are used by management to charge the costs of certain activities, such as insurance and telecommunications, to individual funds. The net income of the internal service funds is reported with governmental activities. 39,831
The issuance of long-term debt provides current financial resources to governmental funds, while the repayment of the principal of long-term debt consumes the current financial resources of governmental funds. Neither transaction, however, has any effect on net position. Also, governmental funds report the effect of premiums, discounts and the difference between the carrying value of refunded debt and the acquisition cost of refunded debt when debt is first issued. These amounts are deferred and amortized in the statement of activities.
Premiums on notes and refunding bonds and notes issued (86,758)Discounts on bonds issued 353Bonds and notes issued (366,575)Refunding bonds issued (429,115)Capital leases issued (2,322)Payments of debt principal 319,916Payments to bond escrow agent 483,163Accrued interest (8,928) (90,266)
Some items reported in the statement of activities do not provide or require the use of current financial resources and therefore are not reported as revenues/expenditures in governmental funds. These activities include:
Donations of equipment 2,708Change in claims payable (801)Change in compensated absences 709Change in deferred revenues (34,851)Change in other postemployment benefits payable (17,531)Change in pollution remediation obligation (1,232)Change in fair value of investment derivative (7,510)Change in fair value of borrowing derivative 6,763Change in net pension liability 360,505Change in deferred inflow pension (361,413)Change in deferred outflow pension 31,966Amortization of premiums 23,687Amortization of deferred amount on refunding (23,325) (20,325)
Change in net position of governmental activities $ 276,058
Mississippi

36
Statement of Net PositionJune 30, 2015 (Expressed in Thousands)
Business-type Activities - Department ofEmployment State
Security TreasurerUnemployment Port Authority Prepaid AffordableCompensation at Gulfport College Tuition
Assets Current assets: Equity in internal investment pool $ $ 743 $ 533 Cash and cash equivalents 607,286 18,183 11,838 Investments 49,555 Receivables, net 57,478 1,589 755
Restricted assets: Cash and cash equivalents 150 Due from other governments, net 276 19 Due from other funds 576 22,865 Due from component units Inventories Prepaid items 105 Loans and notes receivable 630 Total Current Assets 665,616 93,839 13,126 Noncurrent assets: Investments 309,616 Loans and notes receivable 21,164 Restricted assets:
Cash and cash equivalents 450 Capital assets:
Land and construction in progress 221,869 Other capital assets, net 154,123
Total Noncurrent Assets 397,606 309,616
Total Assets $ 665,616 $ 491,445 $ 322,742
Deferred Outflows of Resources Pension 413 371
Proprietary Funds
Mississippi

37
Enterprise FundsGovernmental
Activities -Internal
Nonmajor ServiceFunds Totals Funds
$ 69,298 $ 70,574 $ 288,45022,672 659,979 128,703
49,555 3,8865,081 64,903 392
15082 377 867
7,847 31,288 22,4311,187
548 548323 428
5,616 6,246111,467 884,048 445,916
309,616 32,196153,454 174,618
450
5,675 227,544 1,75530,990 185,113 31,723
190,119 897,341 65,674
$ 301,586 $ 1,781,389 $ 511,590
2,174 2,958 2,921(Continued on Next Page)

The accompanying notes to the financial statements are an integral part of this statement.
38
Statement of Net PositionJune 30, 2015 (Expressed in Thousands)
Proprietary Funds
Mississippi
(Continued from Previous Page)
Business-type Activities - Department ofEmployment State
Security TreasurerUnemployment Port Authority Prepaid Affordable
Liabilities Compensation at Gulfport College Tuition Current liabilities: Warrants payable $ $ $ 342 Accounts payable and other liabilities 61 20,868 692 Contracts payable 3,992 Due to other governments 11,197 Due to other funds 1,964 1 Due to component units Claims and benefits payable 5,772 Deposits Bonds payable 2,974 Unearned revenues 204 112 Lease obligations payable
Total Current Liabilities 19,198 27,946 1,035 Noncurrent liabilities: Due to other governments Claims and benefits payable 457,274 Bonds payable 9,696 Lease obligations payable Liabilities payable from restricted assets:
Deposits 150 Net pension liability 4,430 728 Other liabilities 233 41
Total Noncurrent Liabilities 14,509 458,043
Total Liabilities 19,198 42,455 459,078
Deferred Inflows of Resources Pension 514 106
Net Position Net investment in capital assets 364,405 Restricted for:
ExpendableUnemployment compensation benefits 646,418Other purposes 450
Unrestricted (deficit) 84,034 (136,071)
Total Net Position $ 646,418 $ 448,889 $ (136,071)

39
Enterprise FundsGovernmental
Activities -Internal
Nonmajor ServiceFunds Totals Funds
$ 1,350 $ 1,692 $ 2,0564,548 26,169 6,361
3,992178 11,375 368
4,739 6,704 2,84623
5,772 94,3691,908 1,908
2,97461 377 10,68974 74 759
12,858 61,037 117,471
11,920 11,920457,274 35,477
9,696197 197 2,019
15013,785 18,943 23,063
351 625 1,18626,253 498,805 61,745
39,111 559,842 179,216
1,981 2,601 3,343
29,102 393,507 30,700
646,418450
233,566 181,529 301,252
$ 262,668 $ 1,221,904 $ 331,952

The accompanying notes to the financial statements are an integral part of this statement.
40
Statement of Revenues, Expenses, and Changes in Fund Net PositionFor the Year Ended June 30, 2015 (Expressed in Thousands)
Business-type Activities -
Department ofEmployment State
Security TreasurerUnemployment Port Authority Prepaid AffordableCompensation at Gulfport College Tuition
Operating Revenues Charges for sales and services/premiums $ $ 14,101 $ Assessments 137,525 Investment income Federal agencies 3,022 Rentals Fees 799 Tuition receipts 12,421 Other Total Operating Revenues 140,547 14,101 13,220Operating Expenses Cost of sales and services General and administrative 3,228 563 Contractual services 15,482 1,099 Commodities 588 8 Depreciation 6,317 Claims and benefits 109,468 25,452 Other Total Operating Expenses 109,468 25,615 27,122
Operating Income (Loss) 31,079 (11,514) (13,902)Nonoperating Revenues Revenue from counties 937 Insurance recovery 6 Gain on disposal of capital assets 1 Investment income 12,958 414 8,030 Other Total Nonoperating Revenues 12,958 1,358 8,030Nonoperating Expenses Loss on disposal of capital assets Interest and other fiscal charges 587 Total Nonoperating Expenses 587 Income (Loss) before Capital Contributions and Transfers 44,037 (10,743) (5,872)Capital ContributionsTransfers In 95,598Transfers Out Change in Net Position 44,037 84,855 (5,872)
Total Net Position - Beginning, as restated 602,381 364,034 (130,199)
Total Net Position - Ending $ 646,418 $ 448,889 $ (136,071)
Proprietary Funds
Mississippi

41
Enterprise Funds
GovernmentalActivities -
InternalNonmajor Service
Funds Totals Funds
$ 24,538 $ 38,639 $ 802,950137,525
6,431 6,4313,022
1,318 1,318183 982
12,4211,049 1,049 28
33,519 201,387 802,978
14,282 14,28212,125 15,916 16,173
7,504 24,085 63,0132,112 2,708 6011,569 7,886 2,971
134,920 685,108216 216
37,808 200,013 767,866
(4,289) 1,374 35,112
93761
752 22,154 4,1961 1
753 23,099 4,196
82 82 112 599 5294 681 53
(3,630) 23,792 39,255562
8,907 104,505 1,204(1,323) (1,323) (1,190)3,954 126,974 39,831
258,714 1,094,930 292,121
$ 262,668 $ 1,221,904 $ 331,952

Statement of Cash FlowsFor the Year Ended June 30, 2015 (Expressed in Thousands)
Business-type Activities -
Department of
Employment State
Security Treasurer
Unemployment Port Authority Prepaid Affordable
Compensation at Gulfport College Tuition
Cash Flows from Operating Activities
Cash receipts from federal agencies $ 3,060 $ $
Cash receipts/premiums from interfund services provided
Cash receipts/premiums from customers (7,744) 13,220
Cash receipts from assessments 141,562
Cash payments to suppliers for goods and services (9,673) (1,107)
Cash payments to employees for services (3,006) (450)
Cash payments for claims and benefits (108,662) (25,484)
Other operating cash receipts
Other operating cash payments
Principal and interest received on program loans
Issuance of program loans
Net Cash Provided by (Used for) Operating Activities 35,960 (20,423) (13,821)
Cash Flows from Noncapital Financing Activities
Transfers in 79,835
Transfers out
Revenues from counties 937
Proceeds from other governments
Net Cash Provided by
Noncapital Financing Activities 80,772
Cash Flows from Capital and Related Financing Activities
Acquisition and construction of capital assets (86,775)
Proceeds from sales of capital assets 1
Principal paid on bonds and capital assets contracts (2,796)
Interest paid on bonds and capital assets contracts (633)
Proceeds from insurance recovery 6
Net Cash Provided by (Used for) Capital and Related
Financing Activities (90,197)
Cash Flows From Investing Activities
Proceeds from sales of investments 31,250 115,469
Purchases of investments (152) (102,935)
Investment income 12,958 433 5,698
Net Cash Provided by Investing Activities 12,958 31,531 18,232
Net Change in Cash and Cash Equivalents 48,918 1,683 4,411
Cash and Cash Equivalents - Beginning 558,368 17,843 7,960
Cash and Cash Equivalents - Ending $ 607,286 $ 19,526 $ 12,371
Proprietary Funds
Mississippi
42

Enterprise Funds
Governmental
Activities -
Internal
Nonmajor Service
Funds Totals Funds
$ $ 3,060 $
232,673
30,073 35,549 567,018
141,562
(20,901) (31,681) (60,208)
(12,040) (15,496) (16,134)
(134,146) (704,414)
356 356 15
2 2
28,315 28,315
(24,792) (24,792)
1,013 2,729 18,950
8,870 88,705 1,204
(1,322) (1,322) (1,190)
937
688 688
8,236 89,008 14
(976) (87,751) (38)
1
(72) (2,868) (828)
(12) (645) (51)
6
(1,060) (91,257) (917)
146,719 18,440
(103,087) (17,733)
754 19,843 4,332
754 63,475 5,039
8,943 63,955 23,086
83,027 667,198 394,067
$ 91,970 $ 731,153 $ 417,153
(Continued on Next Page)
43

Statement of Cash FlowsFor the Year Ended June 30, 2015 (Expressed in Thousands)
Proprietary Funds
Mississippi
(Continued from Previous Page)
Business-type Activities -
Department of
Employment State
Security Treasurer
Unemployment Port Authority Prepaid Affordable
Compensation at Gulfport College Tuition
Reconciliation of Operating Income (Loss) to Net Cash
Provided by (Used for) Operating Activities
Operating income (loss) $ 31,079 $ (11,514) $ (13,902)
Adjustments to reconcile operating income (loss) to net
cash provided by (used for) operating activities:
Depreciation 6,317
Change in assets and liabilities:
(Increase) decrease in assets:
Receivables, net 3,506 (21,848)
Due from other governments 278
Due from other funds 11
Due from component units 243
Inventories
Prepaid items 100
Loans and notes receivable
Increase (decrease) in liabilities:
Warrants payable 92
Accounts payable and other liabilities (86) 6,327 (499)
Due to other governments 879
Due to other funds 829 1
Due to component units
Claims and benefits payable (816) 385
Unearned revenues 37 4
Pension cost 191 102
Total adjustments 4,881 (8,909) 81
Net Cash Provided by (Used for) Operating Activities $ 35,960 $ (20,423) $ (13,821)
Noncash Capital and Related Financing
and Investing Activities
Capital contributions
Loss on disposal of capital assets
Change in market value of investments 3 (16,267)
The accompanying notes to the financial statements are an integral part of this statement.
44

Enterprise Funds
Governmental
Activities -
Internal
Nonmajor Service
Funds Totals Funds
$ (4,289) $ 1,374 $ 35,112
1,569 7,886 2,971
(263) (18,605) (155)
(82) 196 (234)
3,758 3,769 1,669
9 252 (313)
233 233
7 107
(3,124) (3,124)
335 427 1,723
876 6,618 588
3 882 15
1,963 2,793 1,082
(34)
(431) (19,138)
(79) (38) (4,238)
97 390 (98)
5,302 1,355 (16,162)
$ 1,013 $ 2,729 $ 18,950
562
82 82 1
(16,264) (1,042)
45
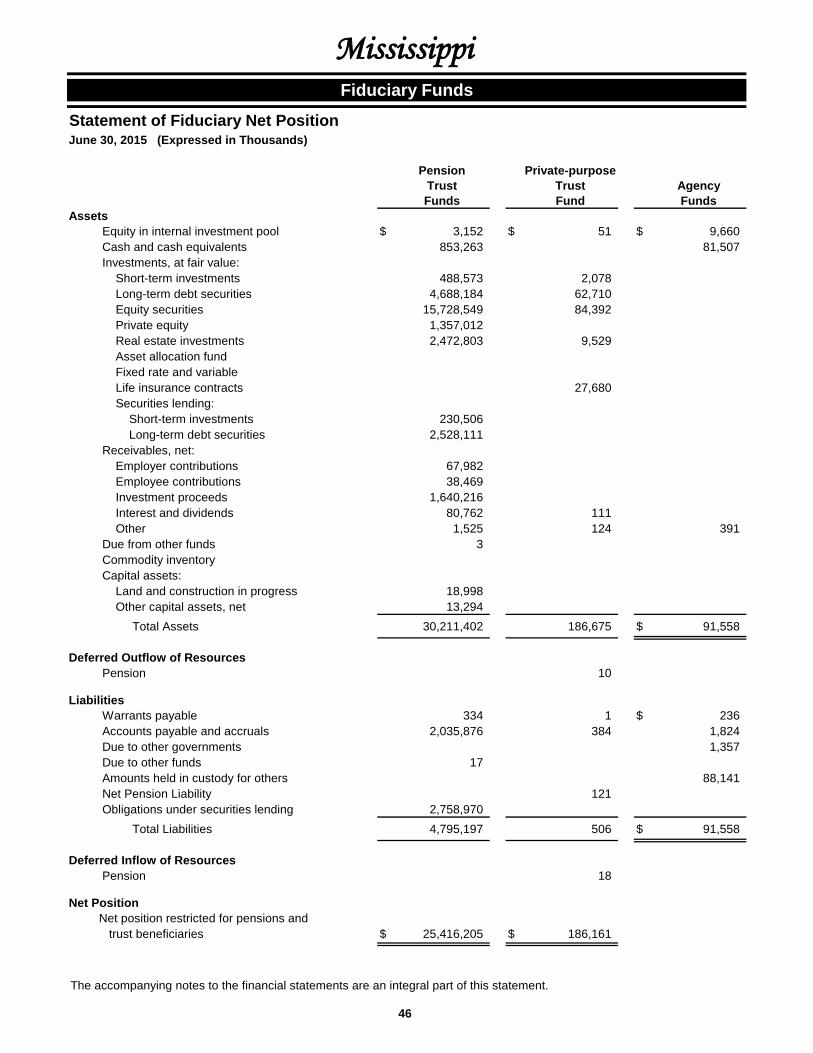
The accompanying notes to the financial statements are an integral part of this statement.
46
Statement of Fiduciary Net PositionJune 30, 2015 (Expressed in Thousands)
Pension Private-purposeTrust Trust AgencyFunds Fund Funds
Assets Equity in internal investment pool $ 3,152 $ 51 $ 9,660 Cash and cash equivalents 853,263 81,507 Investments, at fair value: Short-term investments 488,573 2,078 Long-term debt securities 4,688,184 62,710 Equity securities 15,728,549 84,392 Private equity 1,357,012 Real estate investments 2,472,803 9,529 Asset allocation fund Fixed rate and variable Life insurance contracts 27,680 Securities lending:
Short-term investments 230,506 Long-term debt securities 2,528,111
Receivables, net: Employer contributions 67,982 Employee contributions 38,469 Investment proceeds 1,640,216 Interest and dividends 80,762 111 Other 1,525 124 391 Due from other funds 3 Commodity inventory Capital assets: Land and construction in progress 18,998 Other capital assets, net 13,294
Total Assets 30,211,402 186,675 $ 91,558
Deferred Outflow of Resources Pension 10
Liabilities Warrants payable 334 1 $ 236 Accounts payable and accruals 2,035,876 384 1,824 Due to other governments 1,357 Due to other funds 17 Amounts held in custody for others 88,141 Net Pension Liability 121 Obligations under securities lending 2,758,970
Total Liabilities 4,795,197 506 $ 91,558
Deferred Inflow of Resources Pension 18
Net Position Net position restricted for pensions and trust beneficiaries $ 25,416,205 $ 186,161
Fiduciary Funds
Mississippi
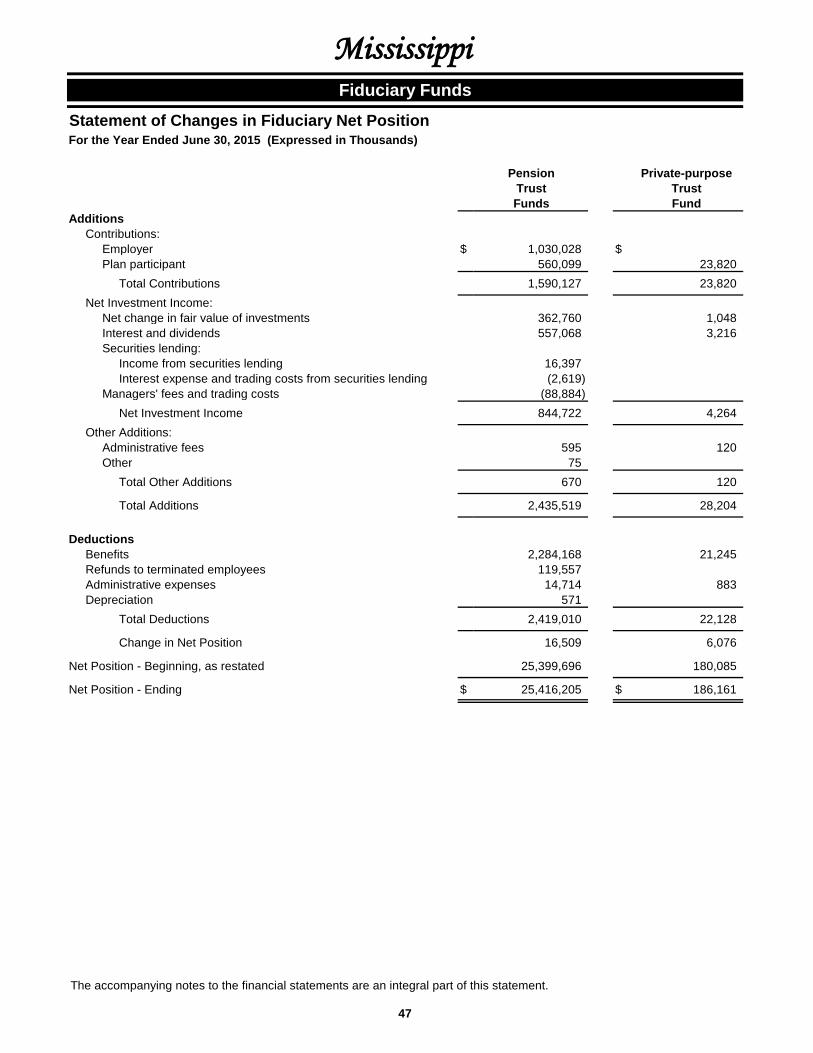
The accompanying notes to the financial statements are an integral part of this statement.
47
Statement of Changes in Fiduciary Net PositionFor the Year Ended June 30, 2015 (Expressed in Thousands)
Pension Private-purposeTrust TrustFunds Fund
Additions Contributions: Employer $ 1,030,028 $ Plan participant 560,099 23,820 Total Contributions 1,590,127 23,820 Net Investment Income: Net change in fair value of investments 362,760 1,048 Interest and dividends 557,068 3,216 Securities lending: Income from securities lending 16,397 Interest expense and trading costs from securities lending (2,619) Managers' fees and trading costs (88,884) Net Investment Income 844,722 4,264 Other Additions: Administrative fees 595 120 Other 75 Total Other Additions 670 120
Total Additions 2,435,519 28,204
Deductions Benefits 2,284,168 21,245 Refunds to terminated employees 119,557 Administrative expenses 14,714 883 Depreciation 571 Total Deductions 2,419,010 22,128
Change in Net Position 16,509 6,076
Net Position - Beginning, as restated 25,399,696 180,085
Net Position - Ending $ 25,416,205 $ 186,161
Fiduciary Funds
Mississippi

The accompanying notes to the financial statements are an integral part of this statement.
48
Statement of Net PositionJune 30, 2015 (Expressed in Thousands)
Universities Nonmajor TotalsAssets
Current assets:Equity in internal investment pool $ $ 2,030 $ 2,030Cash and cash equivalents 458,867 20,204 479,071Investments 196,883 31,319 228,202Receivables, net 305,956 3,499 309,455Due from other governments 187 187Due from primary government 32,834 240 33,074Inventories 30,070 1,197 31,267Prepaid items 35,262 219 35,481Notes receivable, net 36,567 36,567Other assets 1,421 15 1,436
Total Current Assets 1,097,860 58,910 1,156,770Noncurrent assets:
Investments 621,423 621,423Notes receivable, net 157,181 157,181Restricted assets:
Cash and cash equivalents 261,276 1,990 263,266Investments 954,048 7,000 961,048
Capital assets:Land and construction in progress 634,067 17,327 651,394Other capital assets, net 2,961,448 155,375 3,116,823
Other assets 10,457 10,457Total Noncurrent Assets 5,599,900 181,692 5,781,592
Total Assets 6,697,760 240,602 6,938,362Deferred Outflows of Resources
Refunding 10,661 10,661Pension 215,304 1,417 216,721
Total Deferred Outflows 225,965 1,417 227,382
(Continued on Next Page)
Component Units
Mississippi

49
Statement of Net PositionJune 30, 2015 (Expressed in Thousands)
Component Units
Mississippi
(Continued from Previous Page)Universities Nonmajor Totals
LiabilitiesCurrent liabilities:
Accounts payable and other liabilities 215,705 3,786 219,491Due to primary government 625 1,031 1,656Deposits 534 534Unearned revenues 114,420 546 114,966Bonds and notes payable 34,243 34,243Lease obligations payable 2,820 44 2,864Other liabilities 71,058 71,058
Total Current Liabilities 438,871 5,941 444,812Noncurrent liabilities:
Bonds and notes payable 1,053,983 1,053,983Lease obligations payable 68,238 141 68,379Net pension liability 1,850,037 18,187 1,868,224Other liabilities 264,890 957 265,847
Total Noncurrent Liabilities 3,237,148 19,285 3,256,433Total Liabilities 3,676,019 25,226 3,701,245
Deferred Inflows of ResourcesPension 268,176 2,536 270,712
Net PositionNet investment in capital assets 2,552,469 172,517 2,724,986Restricted for: Debt service 2,070 2,070
Other purposes 595,350 4,397 599,747Permanent endowments:
Nonexpendable 743,938 7,000 750,938Unrestricted (912,227) 28,273 (883,954)
Total Net Position $ 2,979,530 $ 214,257 $ 3,193,787

The accompanying notes to the financial statements are an integral part of this statement.
50
Charges Operating CapitalFunctions/ for Grants and Grants andPrograms Expenses Services Contributions Contributions Nonmajor Total
Universities $ 3,305,455 $ 1,994,437 $ 471,135 $ 62,016 $ (777,867) $ $ (777,867)Nonmajor 38,798 29,777 2,276 2,256 (4,489) (4,489) Total $ 3,344,253 $ 2,024,214 $ 473,411 $ 64,272 (777,867) (4,489) (782,356)
General revenues: Investment income 19,593 615 20,208 Other 202,115 2,667 204,782 Payment from State of Mississippi 809,208 809,208Contributions to permanent endowments 23,107 23,107 Total General Revenues and Contributions 1,054,023 3,282 1,057,305
276,156 (1,207) 274,949
Net Position - Beginning, as restated 2,703,374 215,464 2,918,838
Net Position - Ending $ 2,979,530 $ 214,257 $ 3,193,787
For the Year Ended June 30, 2015 (Expressed in Thousands)Statement of Activities
Net (Expense) Revenueand Changes in Net Position
Mississippi
Change in Net Position
Universities
Component Units
Program Revenues
Mississippi
51
June 30, 2015
Note 1 - Significant Accounting Policies
The significant accounting policies applicable to the State of Mississippi are described below.
A. Basis of Presentation - The accompanying financial statements of the State have been prepared in conformity with accounting principles generally accepted in the United States of America (GAAP) as prescribed by the Governmental Accounting Standards Board (GASB). GASB is the accepted standard-setting body for governmental accounting and financial reporting principles.
B. Financial Reporting Entity - For GAAP financial reporting purposes, the State’s reporting entity includes all funds of the State's various commissions, departments, boards, elected officials, universities, and other organizational units (hereinafter referred to collectively as “agencies”). Management has considered all potential component units for which it is financially accountable, and other organizations for which the nature and significance of their relationship with the State are such that exclusion would cause the State's financial statements to be misleading or incomplete.
GASB has set forth criteria to be considered in determining financial accountability. These criteria include the following considerations: 1) appointment of a voting majority of an organization's governing authority and the ability of the primary government to either impose its will on that organization or the potential for the organization to provide specific financial benefits to, or impose specific financial burdens on, the primary government, or 2) an organization is fiscally dependent on the primary government and there is a potential for the organization to provide specific financial benefits or impose specific financial burdens on the primary government regardless of whether the organization has a separately elected governing board.
As required by GAAP, these financial statements present the primary government and its component units. Blended component units, although legally separate entities, are in substance part of the government's operations and so data from these units are combined with that of the primary government. The blended component unit is:
Public Employees' Retirement System of Mississippi (PERS) - The System was created having all the powers and privileges of a public corporation for the purpose of providing pension benefits for public employees of the State and its political subdivisions. The Board of Trustees is composed of the State Treasurer, one member appointed by the Governor and eight members elected by its members. The administrative expenses are subject to legislative budget controls. Its four pension trust funds and one agency fund are reported as part of the State using the blended component method. The funds were audited by independent auditors for the period ended June 30, 2015, and their report has been issued under separate cover. The Comprehensive Annual Financial Report may be obtained by writing to Public Employees' Retirement System, Accounting Department, 429 Mississippi Street, Jackson, MS 39201-1005 or by calling 1-800-444-PERS.
In 2014, the System contracted with a third-party administrator for the Government Employees’ Deferred Compensation Plan. Because of the change in administration, the plan is no longer considered part of the System’s financial reporting entity.
Discretely presented component units, which are legally separate from the State, are reported in a separate column of the government-wide financial statements. The State reports the following major discretely presented component unit:
Universities - The Board of Trustees of State Institutions of Higher Learning (IHL), appointed by the primary government, consists of Alcorn State University, Delta State University, Jackson State University, Mississippi State University, Mississippi University for Women, Mississippi Valley State University, the University of Southern Mississippi, and the University of Mississippi. IHL is a body corporate and politic. The State provides financial support to IHL through state appropriations, tuition, federal grants, and private donations and grants. Also included in the Universities are the financial data of their significant fund-raising foundations. Because the restricted resources held by the foundations can only be used by, or for the benefit of, the specific universities, the foundations are considered component units of the Universities.
The State reports the following nonmajor discretely presented component units:
Mississippi Business Finance Corporation – This is a legally separate entity created and established as a body corporate and politic. The State appoints the voting majority of the board and a financial benefit/burden relationship exists. The Corporation and the State work together, providing support, one to the other, in the State’s economic development.
Notes to the Financial Statements

Mississippi
52
Mississippi Coast Coliseum Commission – This is a legally separate entity created and established as a body corporate and politic. This is a political subdivision of the State. Expenditures are subject to legislative approval. The Commission is fiscally dependent on the primary government and a financial benefit/burden relationship exists. The Commission establishes, promotes, develops, locates, constructs, maintains and operates a multi-purpose coliseum and related facilities within Harrison County, Mississippi.
Mississippi Development Bank – This is a legally separate entity created and established as a body corporate and politic. The State appoints the voting majority of the board and a financial benefit/burden relationship exists. The Bank and the State work together, providing support, one to the other, in the State’s economic development.
Mississippi Prison Industries Corporation – This is a legally separate entity created and established as a body corporate and politic. The State appoints the voting majority of the board and may impose its will on the corporation. A financial benefit/burden relationship exists. The Corporation leases and manages the prison industry programs of the Mississippi Correctional Industries.
Pat Harrison Waterway District – This is a legally separate entity created and established as a body corporate and politic. The State does not appoint the voting majority of the board. The district is fiscally dependent and a financial benefit/burden relationship exists. Expenditures are subject to legislative budget approval. The District provides flood relief along the Pascagoula River and its tributaries and preserves and protects these waters for future generations and for economic enhancement of the area and its industrial growth.
Pearl River Basin Development District – This is a legally separate entity created and established as a body corporate and politic. The State does not appoint the voting majority of the board but the district is fiscally dependent and a financial benefit/burden relationship exists. Expenditures are subject to legislative budget approval. The District handles the preservation, conservation, storage and regulation of the waters of the Pearl River and its tributaries and their overflow waters for domestic, commercial, municipal, industrial, agricultural and manufacturing purposes, for recreational uses, flood control, timber development, irrigation, navigation, and pollution abatement.
Pearl River Valley Water Supply District – This is a legally separate entity created and established as a body corporate and politic. The State appoints the voting majority of the board and may impose its will. A financial benefit/burden relationship exists. Expenditures are subject to legislative budget approval. The District operates and maintains the Ross Barnett Reservoir and surrounding district lands to provide water supply, flood reduction and recreational opportunities.
Tombigbee River Valley Water Management District – This is a legally separate entity created and established as a body corporate and politic. The State appoints the voting majority of the board and may impose its will. A financial benefit/burden relationship exists. Expenditures are subject to legislative budget approval. The District provides for a plan of conservation, recreation, water control and utilization, agricultural development and economic advancement within the district.
The discretely presented component units are audited by independent auditors, and their financial statements are issued under separate covers. The audited financial statements are available from each discretely presented component unit.
State officials are also responsible for appointing the members of the boards of other related organizations, but the primary government's financial accountability for these related organizations does not extend beyond making the appointments. These related organizations are Mississippi Hospital Equipment and Facilities Authority, Mississippi Home Corporation and Mississippi Industries for the Blind.
C. Government-wide and Fund Financial Statements
Government-wide Financial Statements - The Statement of Net Position and the Statement of Activities report information on all nonfiduciary activities of the primary government and its component units. The primary government is further subdivided between governmental and business-type activities. Governmental activities generally are financed through taxes, intergovernmental revenues and other non-exchange revenues. Business-type activities are financed in whole or in part by fees charged to external parties for goods or services.
The Statement of Net Position presents all of the State’s nonfiduciary assets, deferred outflows of resources, liabilities, and deferred inflows of resources, with the difference reported as net position. GAAP requires that net position be subdivided into three categories:
Net investment in capital assets - capital assets net of accumulated depreciation and related deferred outflows of resources reduced by outstanding balances for bonds, notes and other debt net of unspent debt proceeds and related deferred inflows of resources that are attributable to the acquisition, construction, or improvement of those assets.
Restricted net position - assets and deferred outflows of resources less any related liabilities and deferred inflows of resources that are restricted externally by creditors, grantors, contributors, or imposed by law through constitutional provisions or enabling legislation.
Mississippi
53
Unrestricted net position - assets that are not classified as net investment in capital assets or restricted net position.
The Statement of Activities demonstrates the degree to which direct expenses of a given function are offset by program revenues. Direct expenses are those that are specifically associated with a service, program, or department and, thus, are clearly identifiable to a particular function. Certain indirect costs have been included as part of the program expenses reported for the various functions and activities. Program revenues include 1) charges to customers or applicants who purchase, use, or directly benefit from goods, services, or privileges provided by a given function and 2) grants and contributions that are restricted to meeting the operational or capital requirements of a particular function. General revenues include taxes and any sources of revenue that are not reported as program revenues.
Fund Financial Statements - Separate financial statements are provided for governmental funds, proprietary funds, fiduciary funds, and component units. Major individual enterprise funds are reported as separate columns in the fund financial statements.
D. Measurement Focus, Basis of Accounting, and Financial Statement Presentation
The government-wide financial statements and the financial statements of the proprietary funds and fiduciary funds (excluding agency funds) are reported using the economic resources measurement focus and the accrual basis of accounting. Revenues are recorded when earned and expenses are recorded when a liability is incurred, regardless of the timing of related cash flows. Taxes are recognized as revenues in the year for which they are levied. Grants and similar items are recognized as revenue as soon as all eligibility requirements imposed by the provider have been met. Agency funds have no measurement focus, but use the accrual basis of accounting.
The revenues and expenses of proprietary funds are classified as operating or nonoperating. Operating revenues and expenses generally result from providing services and producing and delivering goods in connection with a proprietary fund’s primary operations. All other revenues and expenses are reported as nonoperating.
Governmental fund financial statements are reported using a current financial resources measurement focus and the modified accrual basis of accounting. Current assets, deferred outflows of resources, current liabilities and deferred inflows of resources are included on the balance sheet. Revenues are recognized when measurable and available to finance operations of the current fiscal year. Available means collectible within the current year or soon enough after fiscal year end to liquidate liabilities existing at the end of the fiscal year. The State considers revenues received within 60 days after fiscal year end as available. Significant revenue sources that are susceptible to accrual include sales taxes, individual income taxes, corporate income taxes and federal grants. Licenses, fees, permits and other miscellaneous revenues are recognized when received since they normally are measurable only at that time. Expenditures are recognized upon receipt of goods and services.
The State reports the following major governmental fund:
The General Fund accounts for all activities of the State not specifically required to be accounted for in other Funds. Transactions are related to general government, education, health and social services, law, justice and public safety, recreation and resource development, regulation of business and professions, transportation, capital projects, and debt service.
The State reports the following major enterprise funds:
The Unemployment Compensation Fund accounts for the collection of unemployment insurance assessments from employers and the payment of unemployment benefits to eligible claimants. Funds are also provided by the federal government and investment income.
The Port Authority at Gulfport Fund accounts for operations of a public port providing facilities for foreign and domestic trade. Funding is provided by gross receipts from port operations, proceeds from bond issues and investment income. Expenses include port operation, construction and the payment of maturing bond interest and principal.
The Prepaid Affordable College Tuition Fund accounts for operations of a prepaid college tuition program. Funding is provided by the purchasers’ specified actuarially determined payments and investment income.
Additionally, the State reports the following funds:
Governmental funds:
Permanent Funds account for transactions related to resources that are legally restricted to the extent that only earnings, and not principal, may be used for purposes that benefit the government or its citizenry.

Mississippi
54
Proprietary Funds:
Enterprise Funds account for operations where the intent of the State is that the cost of providing goods or services to the general public on a continuing basis be financed or recovered primarily through user charges, or where periodic measurement of the results of operations is appropriate for capital maintenance, public policy, management control, accountability or other purposes.
Internal Service Funds account for the operations of state agencies that render services and provide goods to other state agencies or governmental units on a cost-reimbursement basis. These activities include personnel services, information technology and risk management. In the government-wide financial statements, Internal Service Funds are included with governmental activities.
Fiduciary Funds:
Pension Trust Funds account for transactions, assets, liabilities and net position available for plan benefits of the State’s Public Employee Retirement System.
Private-purpose Trust Fund accounts for operations of a college savings program under Section 529 of the Internal Revenue Code. Funding is provided by participants’ contributions and investment earnings.
Agency Funds account for funds distributed to the various counties and municipalities of the State; for receipt of various taxes, refundable deposits, inventories, and other monies collected or recovered to be held until the State has the right or obligation to distribute them to state funds or to various entities or individuals; and for deposits to various institutional accounts and other receipts held by the State until there is proper authorization to disburse them directly to others.
E. Equity in Internal Investment Pool and Cash and Cash Equivalents - Equity in internal investment pool is cash equity with the Treasurer and consists of pooled demand deposits and investments recorded at fair value. Cash and cash equivalents include bank accounts, petty cash, money market demand accounts, money market mutual funds and certificates of deposit with a maturity date within 90 days of the date acquired by the State.
In accordance with IHL policy, all highly liquid investments with an original maturity date of three months or less are included as cash and cash equivalents for the Universities, a major component unit.
F. Investments - Investments, including any land or other real estate held as investments by endowments, are recorded at fair value with all investment income, including changes in the fair value of investments, reported as revenue in the financial statements. Income from short-term interest bearing securities is recognized as earned. Changes in the fair value of investment derivative instruments, including derivative instruments that are determined to be ineffective as hedges, are reported as investment income in the government-wide Statement of Activities.
Investments of the pension trust funds are reported at fair value. Securities traded on a national or international exchange are valued at the last reported sales price at current exchange rates. Corporate bonds are valued based on yields currently available on comparable securities from issuers of similar credit ratings. Mortgage securities are valued on the basis of future principal and interest payments and are discounted at prevailing interest rates for similar instruments. Short-term investments are reported at fair value when published prices are available, or at cost plus accrued interest, which approximates fair value. The fair value of commingled real estate investment funds is based on independent appraisals, while Real Estate Investment Trusts (REIT) traded on a national or international exchange are valued at the last reported sales price at current exchange rates. For individual investments where no readily ascertainable fair value exists, the Public Employees' Retirement System, in consultation with its investment advisors and custodial bank, has determined the fair values.
G. Receivables - Receivables represent amounts due to the State for revenues earned that will be collected sometime in the future. Amounts expected to be collected in the next fiscal year are classified as “current” and amounts expected to be collected beyond the next fiscal year are classified as “noncurrent.” Receivables are reported net of allowances for uncollectible accounts where applicable.
H. Interfund Activity - In general, eliminations have been made to minimize the double-counting of internal activity, including internal service fund type activity on the government-wide financial statements. Excess revenues or expenses from the internal service funds have been allocated to the appropriate function originally charged for the internal sale as part of this process. However, interfund services, provided and used between different functional categories, have not been eliminated in order to avoid distorting the direct costs and program revenues of the applicable functions. Transfers between governmental and business-type activities are reported at the net amount on the government-wide financial statements.

Mississippi
55
In the fund financial statements, transactions for services rendered by one fund to another are treated as revenues of the recipient fund and expenditures/expenses of the disbursing fund. Reimbursements of expenditures/expenses made by one fund for another are recorded as expenditures/expenses in the reimbursing fund and as a reduction of expenditures/ expenses in the reimbursed fund. Transfers represent flows of assets between funds of the primary government without equivalent flows of assets in return and without a requirement for payment.
I. Interfund Balances - Interfund receivables and payables have been eliminated from the government-wide Statement of Net Position, except for the residual amounts due between governmental and business-type activities. Fiduciary funds’ receivables and payables have been reclassed to accounts receivable and accounts payable, respectively, on the government-wide Statement of Net Position.
J. Inventories and Prepaid Items - Inventories of supplies and materials are stated at cost, generally using the first-in, first-out method. Cost of inventories held for use by the Department of Transportation is determined by the weighted average method. Inventories of supplies and materials of governmental funds are recorded as expenditures when consumed rather than when purchased.
Certain payments to vendors reflect costs applicable to future accounting periods and are recorded as prepaid items in both government-wide and fund financial statements.
K. Restricted Assets - Proprietary fund and component unit assets required to be held and/or used as specified in bond indentures, bond resolutions, trustee agreements, board resolutions and donor specifications have been reported as restricted assets.
L. Capital Assets - Capital assets are reported, net of depreciation, in the applicable governmental or business-type activities columns in the government-wide financial statements. Purchased or constructed capital assets are reported at cost. Donated capital assets are recorded at their fair market value on the date of donation. Classes of capital assets and their related capitalization thresholds are: land - cost or fair market value on the date of donation, software - $1,000,000, buildings - $50,000, land improvements - $25,000, machinery and equipment - $5,000, infrastructure - $100,000, and construction in progress - based on the project’s class. Infrastructure acquired prior to July 1, 1980 is not reported in the basic financial statements. The costs of normal maintenance and repairs that do not add to the value of capital assets or materially extend their respective lives are not capitalized. Interest expenditures are not capitalized on capital assets.
Capital assets, excluding land and construction in progress, are depreciated using the straight-line method over the estimated service lives of the respective assets. Estimated service lives include 5 to 15 years for software, 40 years for buildings, 20 years for land improvements, 5 to 15 years for machinery and equipment, 3 years for computer equipment, 5 to 15 years for heavy and outdoor equipment, and 3 to 10 years for vehicles. The estimated service life varies from 12 to 50 years for infrastructure, based on the individual asset.
The State owns various collections, works of art and historical treasures that have not been capitalized because they are held for public exhibition, education or research, and are protected and preserved. The proceeds from sales of such items are used to acquire other items for the collections. These collections include paintings, photographs, various objects of art, historical and scientific artifacts, antique furniture, clothing, books, and relics.
M. Claims and Benefits Payable - In the government-wide and proprietary fund financial statements, a liability for an insurance claim is established if information indicates that it is probable that a liability has been incurred at the date of the financial statements and the amount of the loss is reasonably estimable.
In the Prepaid Affordable College Tuition Fund (a major proprietary fund), claims and benefits payable represents the actuarially determined present value of future tuition obligations. In the Unemployment Compensation Fund (a major proprietary fund), claims and benefits payable represents amounts incurred prior to the reporting date.
N. Accumulated Unpaid Personal Leave and Major Medical Leave - State law authorizes payment for a maximum of 30 days accrued personal leave in a lump sum upon termination of employment. No payment is authorized for accrued major medical leave unless employees present medical evidence that their physical condition is such that they can no longer work in a capacity of state government.
The State's obligation for accumulated unpaid personal leave, up to the maximum of 30 days per employee, is reported as “Other Liabilities” in the government-wide financial statements, as well as proprietary and fiduciary fund financial statements. In the governmental funds, only the amounts that normally would be liquidated with expendable available financial resources are accrued as current year expenditures. The State uses the last-in, first-out method of recognizing use of compensated absences. The reported liability applicable to all funds includes the related fringe benefits that the State as employer is required to pay when the accrued compensated absences are liquidated.
Accumulated unpaid major medical leave is not accrued, except in the Universities, because it is not probable that the compensation will be paid in a lump sum other than in the event of severe illness. However, state law authorizes the Universities to make payment for a maximum of 30 days in a lump sum upon termination of employment for nine-month faculty members eligible to receive retirement benefits.

Mississippi
56
O. Unearned Revenues and Deferred Inflows of Resources - Unearned revenues are recognized when assets are received prior to being earned in an exchange transaction. Deferred revenues are reported in the governmental fund financial statements as deferred inflows of resources until such time as the revenues become available.
P. Pensions – Net pension liability, deferred outflows of resources related to pensions, deferred inflows of resources related to pensions, and pension expense have been measured using the same basis as the PERS fiduciary net positon. For the purpose of determining the PERS fiduciary net position, benefit payments (including refunds of employee contributions) are recognized when due and payable in accordance with the benefit terms. The pension system reports investments at fair value.
Q. Net Position/Fund Balance - Net Position is the difference between assets, deferred outflows of resources, liabilities, and deferred inflows of resources on government-wide, proprietary and fiduciary funds financial statements and Fund Balance on governmental funds financial statements. Fund Balances of governmental funds are classified as:
Nonspendable - amounts that cannot be spent because they are not in a spendable form (not expected to be converted to cash) or are legally required to be maintained intact. Examples include inventories and permanent fund principal.
Restricted - amounts where legally enforceable constraints are imposed by an external party such as a grantor, or by the constitution, or by the State Legislature at the same time the revenue is created.
Committed - amounts where constraints are imposed by bills which become law after passage by the State Legislature, the highest decision-making authority in the State. These constraints are imposed separately from the creation of the revenue. The revenue cannot be used for any other purpose unless the State Legislature removes or changes the specified use by taking the same formal action that originally imposed the constraint.
Assigned - amounts where constraints are imposed on the use of resources through the intent of the State Legislature or by its delegation to each agency director.
Unassigned - the residual amount of the General Fund, which is the only fund that reports a positive unassigned fund balance.
When an expenditure is incurred for purposes in which all classifications of spendable fund balance are available, it is the State’s general policy to use the fund balances in the following order: restricted, committed, assigned, and unassigned.
R. Federal Grants - Federal grants and assistance awards made on the basis of entitlement periods are recorded as receivables and revenues when entitlement occurs. Federal reimbursement type grants are recorded as revenues when the related expenditures are recognized. Use of grant resources is conditioned upon compliance with terms of the grant agreements and applicable federal regulations, which include subjecting grants to financial and compliance audits.
S. Bonds and Notes - Bond and note proceeds, premiums and discounts are reported as other financing sources or uses in the governmental fund financial statements. In the government-wide and proprietary fund financial statements, bond and note premiums and discounts, as well as refunding charges (the difference between the carrying amount of redeemed/defeased debt and its reacquisition price), are deferred and amortized over the life of the bonds and notes using the straight-line method. Bonds and notes payable are reported net of the applicable unamortized bond and note premium and discount while refunding charges are reported as deferred outflows or deferred inflows of resources. Issuance costs are recognized as debt service expenditures/expenses in the period incurred.
T. Changes in Accounting Standards - The State implemented the following standards issued by GASB in the current fiscal year as required: GASB Statement No. 68, Accounting and Financial Reporting for Pensions – an amendment of GASB Statement No. 27 and GASB Statement No. 71, Pension Transition for Contributions Made Subsequent to the Measurement Date – an amendment of GASB Statement No. 68. The provisions of these standards have been incorporated into the financial statements and the notes.
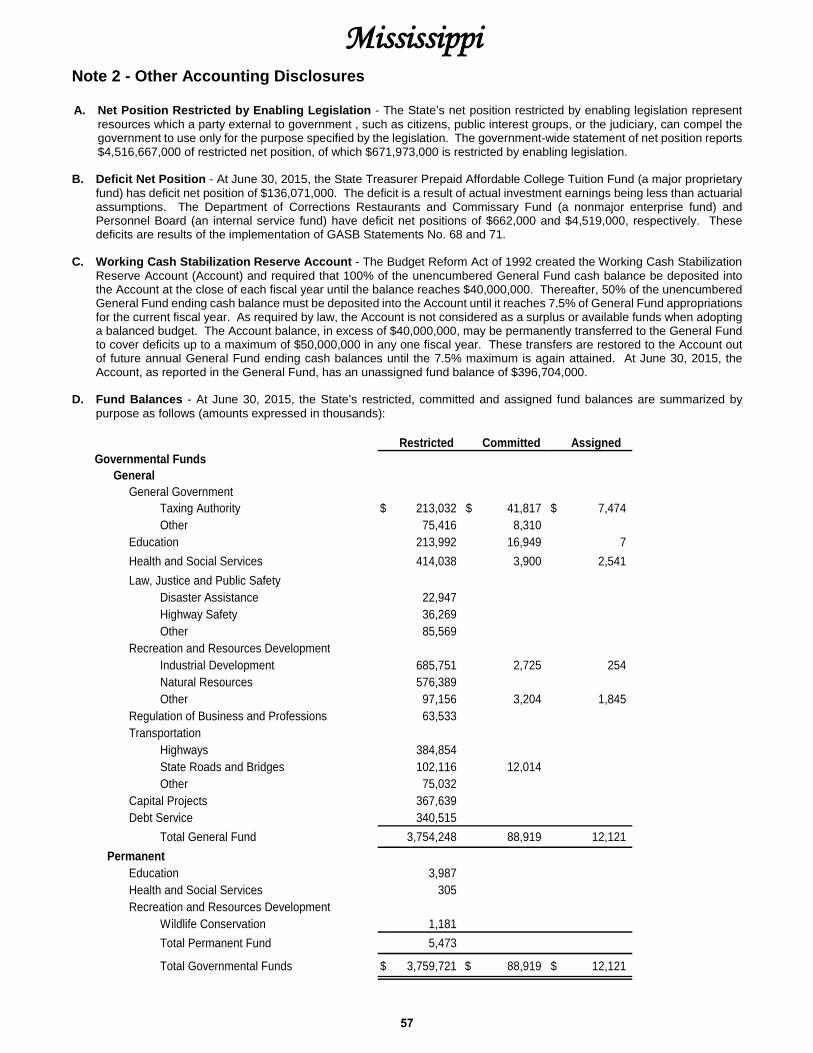
Mississippi
57
Note 2 - Other Accounting Disclosures
A. Net Position Restricted by Enabling Legislation - The State’s net position restricted by enabling legislation represent resources which a party external to government , such as citizens, public interest groups, or the judiciary, can compel the government to use only for the purpose specified by the legislation. The government-wide statement of net position reports $4,516,667,000 of restricted net position, of which $671,973,000 is restricted by enabling legislation.
B. Deficit Net Position - At June 30, 2015, the State Treasurer Prepaid Affordable College Tuition Fund (a major proprietary fund) has deficit net position of $136,071,000. The deficit is a result of actual investment earnings being less than actuarial assumptions. The Department of Corrections Restaurants and Commissary Fund (a nonmajor enterprise fund) and Personnel Board (an internal service fund) have deficit net positions of $662,000 and $4,519,000, respectively. These deficits are results of the implementation of GASB Statements No. 68 and 71.
C. Working Cash Stabilization Reserve Account - The Budget Reform Act of 1992 created the Working Cash Stabilization Reserve Account (Account) and required that 100% of the unencumbered General Fund cash balance be deposited into the Account at the close of each fiscal year until the balance reaches $40,000,000. Thereafter, 50% of the unencumbered General Fund ending cash balance must be deposited into the Account until it reaches 7.5% of General Fund appropriations for the current fiscal year. As required by law, the Account is not considered as a surplus or available funds when adopting a balanced budget. The Account balance, in excess of $40,000,000, may be permanently transferred to the General Fund to cover deficits up to a maximum of $50,000,000 in any one fiscal year. These transfers are restored to the Account out of future annual General Fund ending cash balances until the 7.5% maximum is again attained. At June 30, 2015, the Account, as reported in the General Fund, has an unassigned fund balance of $396,704,000.
D. Fund Balances - At June 30, 2015, the State’s restricted, committed and assigned fund balances are summarized by purpose as follows (amounts expressed in thousands):
Restricted Committed AssignedGovernmental Funds General
General GovernmentTaxing Authority $ 213,032 $ 41,817 $ 7,474Other 75,416 8,310
Education 213,992 16,949 7 Health and Social Services 414,038 3,900 2,541 Law, Justice and Public Safety
Disaster Assistance 22,947Highway Safety 36,269Other 85,569
Recreation and Resources DevelopmentIndustrial Development 685,751 2,725 254Natural Resources 576,389Other 97,156 3,204 1,845
Regulation of Business and Professions 63,533 Transportation
Highways 384,854State Roads and Bridges 102,116 12,014Other 75,032
Capital Projects 367,639 Debt Service 340,515
Total General Fund 3,754,248 88,919 12,121 Permanent Education 3,987 Health and Social Services 305 Recreation and Resources Development
Wildlife Conservation 1,181Total Permanent Fund 5,473
Total Governmental Funds $ 3,759,721 $ 88,919 $ 12,121

Mississippi
58
E. Restatement of Net Position – During fiscal year 2015, the State implemented GASB Statement No. 68, Accounting and Financial Reporting for Pensions – an amendment of GASB Statement No. 27 and GASB Statement No. 71, Pension Transition for Contributions Made Subsequent to the Measurement Date – an amendment of GASB Statement No. 68. The provisions of these statements establish standards for measuring and recognizing liabilities, deferred outflows of resources, deferred inflows of resources and expenses related to pensions. As a result of these implementations, net position was reduced. The restatement of net position is summarized as follows (amounts expressed in thousands):
Net Position
June 30, 2014, as previously reported
Implementation of GASB Statements
No. 68 and 71
June 30, 2014, as restated
Governmental Activities: Net investment in capital assets $ 13,430,397 $ $ 13,430,397 Restricted 3,633,805 3,633,805 Unrestricted (3,035,755) (2,540,355) (5,576,110)
Total Governmental Activities 14,028,447 (2,540,355) 11,488,092
Business-type Activities: Net investment in capital assets $ 297,830 $ $ 297,830 Restricted 602,831 602,831 Unrestricted 212,462 (18,193) 194,269
Total Business-type Activities 1,113,123 (18,193) 1,094,930
Total Primary Government 15,141,570 (2,558,548) 12,583,022
Component Units: Net investment in capital assets $ 2,593,372 $ $ 2,593,372 Restricted 1,320,546 1,320,546 Unrestricted 942,610 (1,937,690) (995,080)
Total Component Units 4,856,528 (1,937,690) 2,918,838
Note 3 - Interfund Transactions
At June 30, 2015, interfund receivables and interfund payables consisted of (amounts expressed in thousands):
Internal Unemployment Port Authority Nonmajor FiduciaryDue From General Permanent Service Compensation at Gulfport Enterprise Funds Total
Governmental:General $ $ 531 $ 17,678 $ $ 22,865 $ 7,735 $ $ 48,809
Internal Service 2,158 576 112 2,846Proprietary:
Unemployment Compensation 1,964 1,964Prepaid Affordable College Tuition 1 1Nonmajor Enterprise 4,739 4,739
Fiduciary 14 3 17 Total $ 4,123 $ 531 22,431 $ 576 $ 22,865 $ 7,847 $ 3 $ 58,376
Due To
Interfund receivables and payables are the results of 1) timing differences between the date expenses/expenditures occur and the date payments are made and 2) the accrual of tax distributions for taxes collected in the following fiscal year.
At June 30, 2015, amounts due from/to primary government and component units consisted of (amounts expressed in thousands):

Mississippi
59
InternalDue From General Service Universities Nonmajor Total
Primary Government: General $ $ $ 32,832 $ 219 $ 33,051 Internal Service 2 21 23Component Units: Universities 438 187 625 Nonmajor 31 1,000 1,031 Total $ 469 $ 1,187 $ 32,834 $ 240 $ 34,730
Component UnitsDue To
Primary Government
Amounts due to and due from the primary government and component units are the results of timing differences between the date expenses/expenditures occur and the date payments are made.
At June 30, 2015, interfund transfers consisted of (amounts expressed in thousands):
Internal Port Authority NonmajorTransfer From General Service at Gulfport Enterprise Total
Governmental: General $ $ 1,204 $ 95,598 $ 8,907 $ 105,709 Permanent 1,000 1,000Internal Service 1,190 1,190Proprietary: Nonmajor Enterprise 1,323 1,323 Total $ 3,513 $ 1,204 $ 95,598 $ 8,907 $ 109,222
Transfer To
Interfund transfers are primarily used to 1) move revenues from funds required to collect them to funds required to expend them, 2) use revenues collected in the General Fund to finance various programs accounted for in other funds in accordance with budgetary authorizations, and 3) transfer capital facility construction and debt service expenditures to the funds making the payments.
Note 4 - Deposits and Investments
The State Treasurer maintains a cash and short-term investment pool for all state treasury funds and for investments of certain other state agencies. In addition, the Public Employees' Retirement System (the System), and a small number of other agencies carry out investment activities separate from the State Treasurer. A discussion of statutory authority for these investments follows.
The State Treasurer is authorized to invest all excess treasury funds of the state under Section 27-105-33, Mississippi Code Ann. (1972). Funds in the Working Cash-Stabilization Reserve Account and the Education Improvement Trust Account are invested by the State Treasurer as authorized by Sections 27-103-203 and 7-9-103, respectively, Mississippi Code Ann. (1972).
As a result of the settlement of the State’s lawsuit against tobacco companies in 1999, Section 43-13-409, Mississippi Code Ann. (1972) created the Health Care Trust Fund Board (the Board). This code designates the State Treasurer as chairman and gives the Board investment authority.
The System is authorized to invest funds under Section 25-11-121, Mississippi Code Ann. (1972). All investments are governed by the Board of Trustee’s policy of the prudent person rule. The prudent person rule establishes a standard for all fiduciaries, to act as a prudent person would be expected to act, with discretion and intelligence, while investing for income and preservation of principal.
Primary Government Deposits (except for the System)
Section 27-105-5, Mississippi Code Ann. (1972) authorizes the State Treasurer to implement a statewide collateral pool program which secures all state and local public funds deposits through a centralized system of pledging securities to the State Treasurer. The program requires the State Treasurer as pledgee of all public funds to monitor the security portfolios of approved financial institutions and ensure public funds are adequately secured.

Mississippi
60
Section 27-105-5, Mississippi Code Ann. (1972) establishes the requirements for a financial institution to be approved as a qualified public funds depository. Generally, financial institutions make annual application to the State Treasurer for state funds by signing a contract and supplying the financial report as provided to its regulatory authority to assure the statutory required 5.5 percent primary capital to total assets ratio. When so approved by the State Treasurer, the financial institution is required to place on deposit with the State Treasurer collateral equal to at least 105 percent of the amount of public funds on deposit in excess of the amount insured by the Federal Deposit Insurance Corporation (FDIC). Collateral may be held by a third party custodian, with approval of the State Treasurer, if conditions are met which protect the State’s interests.
Sections 27-105-5 and 27-105-6, Mississippi Code Ann. (1972) establish a public funds guaranty pool administered by the Guaranty Pool Board and the State Treasurer. The Guaranty Pool Board is composed of the State Treasurer, Commissioner of Banking and Consumer Finance, five members nominated by the Mississippi Bankers Association, one member nominated by the Mississippi Supervisors Association, and one member nominated by the Mississippi Municipal League. The Guaranty Pool Board is responsible for reviewing and recommending criteria to be used by the State Treasurer in order to protect public deposits and the depositories in the guaranty pool program.
Sections 27-105-5 and 27-105-6, Mississippi Code Ann. (1972) establish criteria for a financial institution that has been in existence for three years or more to be approved as a qualified public funds depository and a public funds guaranty pool member. Potential guaranty pool members must submit an application and supply financial information to the State Treasurer as provided to its regulatory authority to verify the institution meets certain financial criteria established in the law. In addition to the requirements in the law, the Guaranty Pool Board has established additional membership requirements pursuant to its statutory authority. Once approved as a member of the public funds guaranty pool, the members must submit quarterly financial information to the State Treasurer. The Guaranty Pool Board uses this information to monitor the financial status of each member and the fiscal soundness of the guaranty pool.
Under the criteria established by the Guaranty Pool Board, an approved guaranty pool member must meet the 90 percent security requirement by depositing eligible collateral with the State Treasurer (or an approved custodian). The agreement provides that if a loss to a public depositor in the guaranty pool is not covered by deposit insurance and the proceeds from the sale of securities pledged by the defaulting depository, the difference will be provided by an assessment against other guaranty pool members on a pro rata basis.
Custodial credit risk for deposits is the risk that in the event of the failure of a financial institution, the government will not be able to recover deposits or collateral securities that are in the possession of an outside party. As of June 30, 2015, of the statewide collateral pool cash deposits reported by the financial institutions, $133,058,000 was uninsured and uncollateralized. Of the cash deposits not included in the statewide collateral pool, $779,000 was uninsured and uncollateralized, and $117,034,000 was uninsured and collateral held by the pledging financial institution’s trust department or agent was not in the government’s name.
Primary Government Investment Policies (except for the System)
The State Treasurer is authorized to invest all funds in the state pool in the following:
Certificates of deposit or term repurchase agreements with approved financial institutions, banks and savings associations domiciled in Mississippi;
Repurchase agreements and securities lending transactions (with at least 80 percent of the total dollar amount with qualified state depositories);
Direct U.S. Treasury obligations fully guaranteed by the U.S Government;
U.S. Government agency, U.S. Government instrumentality, or U.S. Government sponsored enterprise obligations, the principal and interest of which are fully guaranteed by U.S. Government, U.S. Government agency, U.S. Government instrumentality, or U.S. Government sponsored enterprise, not to exceed 50 percent of total investments with maturities of 30 days or longer. During the year, these investments exceeded the limit imposed by the statute. On September 7, 2008, Federal Home Loan Mortgage Corporation (FHLMC) and Federal National Mortgage Association (FNMA) were placed into conservatorship by the U.S. government, lending an additional level of security to these investments. The Agency bonds purchased over and above the statutory limitation were purchased in lieu of Treasury bonds that were offered at substantially lower yields. As Congress debates possible reforms to FHLMC and FNMA, the risk position of the portfolio will continue to be monitored to ensure that funds are invested in a manner consistent with the risk limitations intended by the statute. Whatever identity FHLMC and FNMA assume post-conservatorship will be evaluated in light of the statute and the appropriate limitations to the asset allocation will be imposed; and
Any open-end or closed-end management type investment company or investment trust registered under the provisions of 15 U.S.C. Section 80(a)-1 et seq., provided that the portfolio is limited to direct obligations issued by the U.S. (or its agencies, instrumentalities or sponsored enterprises) and to repurchase agreements fully collateralized by direct obligations of the U.S. (or its agencies, instrumentalities or sponsored enterprises). The total dollar amount of funds invested in all open-end and closed-end management type companies and investment trust cannot exceed 20 percent of total investments. Not more than $500,000 may be invested with foreign financial institutions.

Mississippi
61
The State Treasurer, for the Working Cash-Stabilization Reserve Account and the Education Improvement Trust Account; and the Board are authorized to invest in the following:
Bonds, notes, certificates and other valid general obligations of the State, or of any county, city, or supervisor's district of any county of the State;
School district bonds of the State;
Notes or certificates of indebtedness issued by the Veterans' Home Purchase Board, not to exceed five percent of total investments;
Highway bonds of the State;
Corporate bonds of Grade A or better as rated by Standard & Poor’s Corporation (S&P) or by Moody’s Investors Service. The Board may invest up to 5 percent of the book value of the total fixed income investment in corporate bonds of Grade BBB/Baa or better as rated by S&P or by Moody’s Investors Service;
Short-term obligations of corporations, or of wholly-owned subsidiaries of corporations, whose short-term obligations are rated A-3 or better by S&P or rated P-3 or better by Moody's Investors Service;
Bonds of the Tennessee Valley Authority;
Bonds, notes, certificates and other valid obligations of the U.S. or any federal instrumentality that issues securities under authority of an act of Congress and are exempt from registration with the U.S. Securities and Exchange Commission (SEC);
Bonds, notes, debentures and other securities issued by any federal instrumentality and fully guaranteed by the U.S.; and
Interest-bearing bonds or notes which are general obligations of any other state in the U.S. or any city or county therein, provided such city or county had a population as shown by the federal census next preceding such investment of not less than 25,000 inhabitants, and provided that such state, city, or county has not defaulted for a period longer than 30 days in the payment of principal or interest on any of its general obligation indebtedness during a period of ten calendar years immediately preceding such investment.
In addition, the Board is authorized to invest in the following:
Bonds rated A or better, stocks and convertible securities of established non-U.S. companies which are listed on primary national stock exchanges of foreign nations and foreign government securities rated A or better by a recognized rating agency. The Board is authorized to hedge such transactions through foreign banks and generally deal in foreign exchange through the use of foreign currency, interbank forward contracts, futures contracts, options contracts, swaps and other related derivative instruments;
Shares of stock, common and/or preferred, of corporations created by or existing under the laws of the U.S. or any state, district or territory thereof;
Covered call and put options on securities traded on one or more of the regulated exchanges;
Pooled or commingled funds managed by a corporate trustee or by a SEC registered investment advisory firm and shares of investment companies and unit investment trusts registered under the Investment Company Act of 1940, where such pooled or commingled funds or shares are comprised of common or preferred stocks, bonds, money market instruments or other authorized investments; and
Pooled or commingled real estate funds or real estate securities managed by a corporate trustee or by a SEC registered investment advisory firm retained as an investment manager by the Board.

Mississippi
62
Primary Government Investments (except for the System)
A. Credit Risk - Credit risk is the risk that an issuer or other counterparty to an investment will not fulfill its obligations. The primary government follows the statutes as previously discussed as its policy for limiting exposure to credit risk. The Moody’s or S&P credit ratings for the primary government’s investments as of June 30, 2015 are as follows (amounts expressed in thousands):
Investment Type AAA AA A BBB Not Rated
Asset backed securities $ 3,429 $ 1,289 $ 2,420 $ 1,889 $Collateralized mortgage obligations 1,345 2,247 763 188,013 Corporate bonds 240 3,766 20,421 4,365 Mortgage pass-throughs 88,815 Municipal bonds 251 Mutual funds 49,021U.S. Government agency obligations 1,681,761 Total $ 54,035 $ 1,689,314 $ 23,604 $ 6,254 $ 276,828
Quality Ratings
B. Interest Rate Risk - Interest rate risk is the risk that changes in interest rates will adversely affect the fair value of an investment. The primary government has no formal policy on limiting exposure to interest rate risk. As of June 30, 2015, the primary government had the following investments and maturities (amounts expressed in thousands):
Fair Value
Investment Type (in thousands) Less than 1 1 - 5 6 - 10 More than 10
Asset backed securities $ 9,026 $ $ 3,309 $ 3,891 $ 1,826 Collateralized mortgage obligations 297,204 4,022 5,979 287,203 Corporate bonds 33,549 1,965 20,022 3,850 7,712 Mortgage pass-throughs 95,736 535 4,701 32,029 58,471 Municipal bonds 252 252 Mutual funds 49,021 49,021 Other Pass Through 127,377 18 37,613 12,712 77,034 U.S. Government agency obligations 1,687,064 57,224 1,467,875 160,404 1,561 U.S. Treasury Obligations 582,211 132,942 435,859 10,642 2,768 Zero coupon bonds 1,757 1,710 47 Total Primary Government $ 2,883,197 $ 241,705 $ 1,975,363 $ 229,554 $ 436,575
Investment Maturities (in Years)
Collateralized mortgage obligations (CMOs) are bonds that are collateralized by whole loan mortgages, mortgage pass-through securities or stripped mortgage-backed securities. Income is derived from payments and prepayments of principal and interest generated from collateral mortgages. Cash flows are distributed to different investment classes or tranches in accordance with that CMO’s established payment order. Some CMO tranches have more stable cash flows relative to changes in interest rates while others are significantly sensitive to interest rate fluctuations.
Asset backed securities (ABS) are bonds or notes backed by loan paper or accounts receivable originated by banks, credit card companies, or other credit providers. The originator of the loan or accounts receivable paper sells it to a specially created trust, which repackages it as securities. Similar to CMOs, ABS have been structured as pass-throughs and as structures with multiple bond classes.
Mortgage pass-through securities are issued by the FNMA, FHLMC, and Government National Mortgage Association (GNMA). These investments are backed by mortgage loans in which the borrowers have the option of prepaying.

Mississippi
63
C. Foreign Currency Risk - Foreign currency risk is the risk that changes in exchange rates will adversely affect the fair value of an investment or deposit. The Board limits non-U.S. investments to 20 percent of total investments. The primary government’s exposure to foreign currency risk at June 30, 2015, is as follows (amounts expressed in thousands):
CurrencyCash and
Equivalents EquitiesTotal Fair
Value
Australian dollar $ $ 3,865 $ 3,865British pound sterling 5,605 5,605Euro 1 8,717 8,718Hong Kong dollar 2,719 2,719Israeli shekel 595 595Japanese yen 3,457 3,457Malaysian ringgit 3 3New Taiwan dollar 1,114 1,114Norwegian krone 738 738Singapore dollar 1,749 1,749Swedish krona 1,352 1,352Swiss franc 5,025 5,025 Total $ 1,118 $ 33,822 $ 34,940
D. Concentration of Credit Risk - Concentration of credit risk is the risk of loss attributed to the magnitude of a government’s investment in a single issuer. The primary government limits investment in the Veteran’s Home Purchase Board notes or certificates to not more than five percent of total investment holdings. By statute, the Board’s investments in stocks of any one corporation are limited to not more than three percent of the book value of their assets. The primary government has the following investments that represent more than five percent of net investments (amounts expressed in thousands):
Federal Home Loan Bank $ 456,569 10.99% Federal Home Loan Mortgage Corporation 755,041 18.18 Federal National Mortgage Association 459,403 11.06 Federal Farm Credit Bank 237,239 5.71
E. Investment Derivatives – In a prior year, the State entered into interest rate swap agreements in connection with variable rate bonds with final maturity dates ranging from fiscal year 2026 to 2028 in order to hedge changes in cash flows. The 2012C and 2012D bonds have been refunded with new final maturities of November 1, 2017 and September 1, 2017, respectively. As a result of the refunding, the portions of the swap agreements attributable to payment dates beyond the maturity dates have no hedgeable item and therefore, are being accounted for as investment derivatives. Details of the June 30, 2015 fair values, changes in fair values, and risk disclosures of the investment derivatives are included in the derivative disclosures presented in Note 9 – Long-term General Obligation Bonds.
System Deposits
Section 25-11-121, Mississippi Code Ann. (1972), requires the System’s Board of Trustees to determine the degree of collateralization necessary for both foreign and domestic demand deposits in addition to that which is guaranteed by federal insurance programs. These statutes also require that, when possible, the types of collateral securing deposits be limited to securities in which the System itself may invest. The Board of Trustees has established a policy to require collateral equal to at least 100 percent of the amount on deposit in excess of that which is guaranteed by federal insurance programs to the credit of the System for domestic demand deposit accounts. No collateral is required for foreign demand deposit accounts, and at June 30, 2015, the System had no deposits in foreign demand deposit accounts.
For deposits, custodial credit risk is the risk that in the event of a bank failure, the government’s deposits may not be returned to it. Section 25-11-121, Mississippi Code Ann. (1972), provides that the deposits of the System in any U.S. bank shall, where possible, be safeguarded and guaranteed by the posting of bonds, notes, and other securities as security by the depository. The System’s Board of Trustees has formally adopted a short-term investment policy that requires that the market value of securities guaranteeing the deposits shall at all times be equal to 100 percent of the amount of funds on deposit.
System Investment Policies
The System is authorized to invest in the following:
Bonds, notes, certificates and other valid general obligations of the State, or of any county, city, or supervisor's district of any county of the State;

Mississippi
64
School district bonds of the State;
Notes or certificates of indebtedness issued by the Veterans' Home Purchase Board, not to exceed five percent of total investments;
Highway bonds of the State;
Corporate bonds rated by S&P or by Moody’s Investors Service;
Short-term obligations of corporations, or of wholly-owned subsidiaries of corporations, whose short-term obligations are rated A-3 or better by S&P or rated P-3 or better by Moody's Investors Service;
Bonds of the Tennessee Valley Authority;
Bonds, notes, certificates and other valid obligations of the U.S. or any federal instrumentality that issues securities under authority of an act of Congress and are exempt from registration with the SEC;
Bonds, notes, debentures and other securities issued by any federal instrumentality and fully guaranteed by the U.S.;
Bonds, stocks, and convertible securities of established foreign companies that are listed on primary national stock exchanges of foreign nations and in foreign government securities. The System is authorized to hedge such transactions through foreign banks and generally deal in foreign exchange through the use of foreign currency, interbank forward contracts, futures contracts, options contracts, swaps and other related derivative instruments;
Interest-bearing bonds or notes that are general obligations of any other state in the U.S. or any city or county therein, provided such city or county had a population as shown by the most recent federal census of not less than 25,000 inhabitants, and provided that such state, city, or county has not defaulted for a period longer than 30 days in the payment of principal or interest on any of its general obligation indebtedness during a period of ten calendar years immediately preceding such investment;
Shares of common and/or preferred stock of corporations created by or existing under the laws of the U.S. or any state, district or territory thereof;
Covered call and put options on securities traded on one or more of the regulated exchanges;
Pooled or commingled funds managed by a corporate trustee or by a SEC registered investment advisory firm and shares of investment companies and unit investment trusts registered under the Investment Company Act of 1940, where such pooled or commingled funds or shares are comprised of common or preferred stocks, bonds, money market instruments or other authorized investments;
Pooled or commingled real estate funds or real estate securities managed by a corporate trustee or by a SEC registered investment advisory firm retained as an investment manager by the System. Section 25-11-121, Mississippi Code Ann. (1972), allows the System to invest up to ten percent of the total portfolio in real estate only via real estate securities and commingled funds. Direct ownership of real estate assets is prohibited. The portfolio is divided between core commingled and value added real estate fund investments, which directly invest in properties, and in managed portfolios of Real Estate Investment Trusts (REITs). REITs are exchange traded securities that provide indirect exposure to real estate properties and real estate management companies. Fair values of commingled fund properties are based on the most recent independent appraisal values. Independent appraisal firms which are Members of Appraisal Institute (MAI) are required to conduct valuations at least annually; and
Up to ten percent of the total book value of investments can be types of investments not specifically authorized by this section, if the investments are in the form of a separate account managed by a SEC registered investment advisory firm retained as an investment manager by the Board of Trustees, or a limited partnership, or commingled fund.
System Investments
A. Credit Risk - Credit risk is the risk that an issuer or other counterparty to an investment will not fulfill its obligations. The System follows the statutes as previously discussed as its policy for limiting exposure to credit risk. The Board of Trustees has adopted a short-term investment policy which further restricts commercial paper to be of corporations with long-term debt to be rated A or better by S&P or Moody’s, and whose short-term obligations are of A-2 or P-2 or better ratings by S&P and Moody’s, respectively. This applies to all short-term investments. In addition to the short-term investment policy, a policy adopted for the internally-managed short-term account requires that for any amount above the established core of $30 million, no more than 25 percent may be invested in any issue having a rating lower than AA or A1/P1. Credit risk for derivatives results from the same considerations as other counterparty risk assumed by the System. Policy requires that the credit quality of the underlying asset must be rated A or better by Moody’s or S&P. The lending agent is permitted to purchase asset-backed securities for the cash collateral fund that are only AAA rated.

Mississippi
65
The Moody’s or S&P credit ratings for the System’s investments as of June 30, 2015 are as follows (amounts expressed in thousands):
Investment Type Aaa/AAA Aa/AA A/A Baa/BBB Ba/BB B/B
Asset backed securities $ 1,157,453 $ 22,309 $ 46,893 $ 18,382 $ 10,650 $ 2,661Collateralized mortgage obligations 170,927 178,744 45,378 64,725 20,706 21,484Corporate bonds 78,564 739,614 989,536 826,787 353,266 174,975Mortgage pass-throughs 320,285Repurchase agreements 178,500 29,262Sovereign governments debt 99,023 92,195 228,363 261,343 163,518 69,358State and local obligations 579 14,612 19,027 2,568U.S. Government agency obligations 2,167 126,121Yankee/Global bonds 27,287 895 883 13,223 Total $ 1,714,500 $ 1,524,037 $ 1,330,080 $ 1,187,028 $ 548,140 $ 268,478
Quality Ratings
Investment Type Caa/CCC Ca/CC C/C D/D PRating
WithdrawnNot
Rated
Asset backed securities $ 11,274 $ 4 $ 18 $ $ $ $ 9,887Collateralized mortgage obligations 8,519 985 14,493 171 35,125Corporate bonds 16,457 257 13,192 964Repurchase agreements 75,600 201,014Sovereign governments debt 9,044 3,047 65,310 26,989Yankee/Global bonds 2,164
Total $ 45,294 $ 4,293 $ 18 $ 14,493 $ 75,600 $ 78,673 $ 276,143
Quality Ratings
B. Custodial Credit Risk - For an investment, custodial credit risk is the risk that, in the event of the failure of the counterparty, the government will not be able to recover the value of its investments or collateral securities that are in the possession of an outside party. Section 25-11-121, Mississippi Code Ann. (1972), requires that all investments be clearly marked as to ownership, and to the extent possible, shall be registered in the name of the System. Of the System’s $27,493,738,000 in investments at June 30, 2015, $3,800,000,000 was exposed to custodial credit risk. These are cash collateral reinvestment securities held in the name of the custodian who acquired them as the lending agent/counterparty and the securities on loan for securities collateral that is held in the name of the lending agent. This is consistent with the securities lending agreement in place with the custodian.
The fair value of the System’s cash collateral securities and the underlying securities on non-cash loans as of June 30, 2015, consisted of (amounts expressed in thousands):
Investment Type Fair Value
Cash collateral securities Asset backed securities $ 1,116,367 Corporate bonds 1,411,744 Repurchase aggreements 230,506 Total cash collateral securities 2,758,617Underlying securities on non-cash loans Debt securities 223,977 Equities 729,653 Real Estates Investment Trusts 38,882 Total underlying securities on non-cash loans 992,512 Total $ 3,751,129

Mississippi
66
C. Interest Rate Risk - Interest rate risk is the risk that changes in interest rates will adversely affect the fair value of an investment. The System has no formal policy on limiting exposure to interest rate risk. As of June 30, 2015, the System had the following investments and maturities (amounts expressed in thousands):
Investment Type Fair Value Less than 1 1 - 5 6 - 10 More than 10
Asset backed securities $ 1,279,531 $ 1,200,249 $ 21,181 $ 22,325 $ 35,776 Collateralized mortgage obligations 561,257 125,919 11,146 15,880 408,312 Corporate bonds 3,193,612 903,782 1,303,706 568,559 417,565 Mortgage pass-throughs 424,745 1,708 4,961 418,076 Repurchase agreements 484,376 484,376 Sovereign governments debt 1,018,190 92,369 265,173 332,314 328,334 State and local obligations 36,786 272 8,984 27,530 U.S. Government agency obligations 128,288 86,694 28,295 275 13,024 U.S. Treasury obligations 709,268 115,815 232,628 167,134 193,691 Yankee/Global bonds 44,452 5,349 20,308 6,545 12,250 Total $ 7,880,505 $ 3,014,553 $ 1,884,417 $ 1,126,977 $ 1,854,558
Investment Maturities (in Years)
During fiscal year 2015, the investments in derivatives were exclusively in asset/liability based derivatives such as interest-only (IO) strips, CMOs and ABS. The System reviews fair values of all securities on a monthly basis and prices are obtained from recognized pricing sources. Derivative securities are held, in part, to maximize yields. IO and principal-only (PO) strips are transactions which involve the separation of the interest and principal components of a security. They are highly sensitive to prepayments by mortgagors which may result from a decline in interest rates. The System held IO strips valued at $22,600,000 at fiscal year-end. The derivatives policy limits IO and PO strips to three percent of the investment portfolio.
CMOs are bonds that are collateralized by whole loan mortgages, mortgage pass-through securities or stripped mortgage-backed securities. Income is derived from payments and prepayments of principal and interest generated from collateral mortgages. Cash flows are distributed to different investment classes or tranches in accordance with that CMO’s established payment order. Some CMO tranches have more stable cash flows relative to changes in interest rates while others are significantly more sensitive to interest rate fluctuations. In a declining interest rate environment, some CMOs may be subject to a reduction in interest payments as a result of prepayments of mortgages which make up the collateral pool. A reduction in interest payments causes a decline in cash flows and, thus a decline in the fair value of the CMO security. Rising interest rates may cause an increase in interest payments, thus an increase in the value of the security. The System held $561,300,000 in CMOs at June 30, 2015. Of this amount, $201,100,000 were tranches that are highly sensitive to future changes in interest rates. CMO residuals are prohibited under the derivatives policy.
ABS are bonds or notes backed by loan paper or accounts receivable originated by banks, credit card companies, or other credit providers. The originator of the loan or accounts receivable paper sells it to a specially created trust, which repackages it as securities. Similar to CMOs, ABS have been structured as pass-throughs and as structures with multiple bond classes. Of the $1,300,000,000 in ABS held at June 30, 2015, $43,900,000 are highly sensitive to changes in interest rates. ABS which are leveraged structures or residual interests are prohibited by the derivatives policy.
At June 30, 2015, the System has invested in $424,700,000 in mortgage pass-through securities issued by the FNMA, FHLMC, and GNMA. These investments are moderately sensitive to changes in interest rates because they are backed by mortgage loans in which the borrowers have the option of prepaying.

Mississippi
67
D. Foreign Currency Risk - Foreign currency risk is the risk that changes in exchange rates will adversely affect the fair value of an investment or deposit. The investment asset allocation policy does not limit foreign currency-denominated investments of the System. The Investment Committee of the Board of Trustees evaluates the actual investment asset allocation quarterly, in accordance with the adopted phase-in policy. Based on current market conditions, the Board adjusts the allocation as necessary. The System’s exposure to foreign currency risk at June 30, 2015, is as follows (amounts expressed in thousands):
Currency Cash and
Equivalents Equities
and REITs Debt
Securities Total Fair
Value
Australian dollar $ (118,875) $ 239,398 $ 25,215 $ 145,738 Brazilian real (36,303) 132,110 58,661 154,468 British pound sterling (340,412) 768,163 88,301 516,052 Canadian dollar (27,850) 124,815 18,713 115,678 Chilean peso 1 6,937 6,938 Danish krone (42,726) 82,038 22,373 61,685 Euro (658,804) 1,392,260 284,495 1,017,951 Hong Kong dollar (39,193) 354,268 315,075 Hungarian forint 12,985 12,985 Indian Rupee 173 129,402 129,575 Indonesian rupiah 3,838 58,651 2,551 65,040 Israeli shekel (8,136) 13,609 5,473 Japanese yen (371,099) 951,365 90,390 670,656 Kenyan shilling 1,965 1,965 Malaysian ringgit 183 16,631 16,814 Mexican peso (26,166) 39,040 54,532 67,406 New Taiwan dollar (3,158) 119,223 116,065 New Turkish lira 58,470 58,470 New Zealand dollar (21,818) 11,631 11,892 1,705 Norwegian krone (7,705) 29,991 1,310 23,596 Pakistani rupee 34 22,376 22,410 Peruvian nuevo sol (1,560) 571 2,815 1,826 Philippines peso 3 4,446 6,815 11,264 Polish zloty (1,243) 6,739 1,289 6,785 Qatari riyal 2,234 2,234 Russian ruble 1,894 1,894 Singapore dollar (16,813) 92,609 75,796 South African rand (18,818) 135,436 21,236 137,854 South Korean won (12,554) 213,069 200,515 Swedish krona (57,573) 136,610 22,233 101,270 Swiss franc (116,499) 332,768 216,269 Thailand baht 33,405 33.405 UAE dirham 2,698 2,698 Total $ (1,923,073) $ 5,527,807 $ 712,821 $ 4,317,555

Mississippi
68
E. Investment Derivatives - The System’s derivatives policy limits foreign currency forwards to no more than 100 percent of the aggregate value of the portfolio securities denominated in the hedged currency. At June 30, 2015, the counterparties of the foreign currency forwards primarily had short term credit ratings of A as rated by the nationally recognized statistical rating organizations. The System’s general policy requires that the counterparty has a long term credit rating of A or better and a short term credit rating of A1/P1 at a minimum. More specifically, the System’s policy requires that all over-the-counter derivatives be rated AA or better by the nationally recognized statistical rating organizations. The counterparties of the to-be-announced securities were primarily rated A by the nationally recognized statistical rating organizations. The foreign currency forwards are presented in the foreign currency risk table, and the to-be-announced securities are disclosed in the interest rate risk table by years to maturity. The investment derivative instruments outstanding as of June 30, 2015 are as follows (amounts expressed in thousands):
Investment Type Notional Amount
Changes in Fair Value Fair Value at June 30, 2015 Classification Amount Classification Amount
Foreign currency forwards $ (28,633,437) Investment income $ 1,926 Investment $ 1,926 To-be-announced securities 197,565 Investment income 556 Debt securities 204,183
F. Securities Lending Transactions - The Board of Trustees has authorized the System to lend its securities to broker-dealers with a simultaneous agreement to return the collateral for the same securities in the future. The System’s custodian, pursuant to a written agreement, is permitted to lend all long-term securities to authorized broker-dealers subject to the receipt of acceptable collateral. The System lends securities for collateral in the form of either cash or other securities. The types of securities on loan at June 30, 2015, by the System are long-term U.S. Government and agency obligations, corporate bonds, REITs, and domestic and international equities. The contractual agreement with the custodian provides indemnification in the event the borrower fails to return the securities lent or fails to pay the System income distributions by the securities’ issuers while the securities are on loan. There have been no significant violations of the provisions of the agreement during the period of this statement.
At the initiation of a cash loan, borrowers are required to provide collateral amounts of 102 percent on U.S. securities and international securities denominated in the same currency of the loaned security. For international securities that are denominated in a currency other than the currency of the loaned security, 105 percent collateral is required at the initiation of the loan. In the event the collateral fair value on U.S. securities and sovereign debt falls to less than 100 percent of the respective fair value of the securities lent, the borrower is required to provide additional collateral by the end of the next business day. In the event the collateral fair value falls below 102 percent for international same-currency transactions or 105 percent for cross-currency transactions, the borrower is required to provide additional collateral.
For non-cash loans, 110 percent collateral is required from the borrowers. The System cannot pledge, lend, or sell securities received as collateral unless the borrower defaults. Authorized securities’ collateral includes U.S. and non-U.S. government debt obligations and securities, supranational debt obligations, U.S. and non-U.S. equity securities listed on specified indices, U.S. and non-U.S. corporate bonds, and convertible securities. Equities were held as collateral on the non-cash loans as of June 30 2015.
The maturities of the investments made with cash collateral generally do not match the maturities of the securities loans. All securities loans can be terminated on demand by either the System or the borrower, although the average term of these loans was one day at June 30, 2015. Cash collateral was invested in repurchase agreements, corporate bonds and ABS. The weighted average effective duration and the weighted average maturity of all collateral investments at June 30, 2015, were 33 days.
Securities lent at year end for cash and non-cash collateral are presented by type. Securities lent for securities collateral are classified according to the custodial credit risk category for the collateral. There were $992,512,000 securities lent for securities collateral as of June 30, 2015. The investments purchased with the cash collateral are presented in the discussion of custodial credit risk, since the custodian, as agent, is the counterparty in acquiring these securities in a separate account for the System.
At year end, the System had no credit risk exposure to borrowers because the amount the System owed the borrowers exceeded the amount the borrowers owed the System. At June 30, 2015, the aggregate fair value of securities lending holdings, including accrued interest was $2,760,233,000 and the aggregate fair value, including accrued interest, of the underlying securities lent was $3,679,058,000. The value of the collateral pledged by borrowers at year end was $3,865,228,000.

Mississippi
69
Note 5 - Receivables
At June 30, 2015, receivables consisted of (amounts expressed in thousands):
General PermanentInternal Service
Receivables Reclass
Total Governmental
Activities
Accounts $ 187,754 $ 98 $ 197 $ 14 $ 188,063 Taxes: Sales 309,171 309,171 Income 292,477 292,477 Gasoline 41,901 41,901 Other 71,180 71,180 Interest and dividends 10,428 261 195 10,884 Other 1 1 Gross receivables 912,912 359 392 14 913,677 Allowance for uncollectibles (184,181) (184,181)
Receivables, net $ 728,731 $ 359 $ 392 $ 14 $ 729,496
Amounts not scheduled for collection in subsequent year $ 151,816 $ 151,816
Governmental Funds
Unemployment Compensation
Port Authority at Gulfport
Prepaid Affordable
College Tuition Nonmajor Total
Accounts $ 77,842 $ 1,521 $ 90 $ 4,550 $ 84,003Assessments 48,235 48,235Interest and dividends 68 665 540 1,273 Gross receivables 126,077 1,589 755 5,090 133,511Allowance for uncollectibles (68,599) (9) (68,608)
Receivables, net $ 57,478 $ 1,589 $ 755 $ 5,081 $ 64,903
Business-type Activities
Universities Nonmajor Total
Accounts $ 2,812,320 $ 3,382 $ 2,815,702Interest 2,707 117 2,824 Gross receivables 2,815,027 3,499 2,818,526Allowance for uncollectibles (2,509,071) (2,509,071)
Receivables, net $ 305,956 $ 3,499 $ 309,455
Component Units

Mississippi
70
Note 6 - Due From Other Governments
At June 30, 2015, due from other governments consisted of (amounts expressed in thousands):
GeneralInternal Service
Total Governmental
Activities
Due from other governments $ 1,203,348 $ 867 $ 1,204,215 Allowance for uncollectibles (120) (120)
Due from other governments, net $ 1,203,228 $ 867 $ 1,204,095
Amounts not scheduled for collection in subsequent year $ 640,294 $ 640,294
Governmental Funds
Unemployment Compensation
Port Authority at Gulfport Nonmajor Total
Due from other governments $ 1,694 $ 19 $ 82 $ 1,795 Allowance for uncollectibles (1,418) (1,418)
Due from other governments, net $ 276 $ 19 82 $ 377
Business-type Activities
Note 7 - Loans and Notes Receivable
At June 30, 2015, loans and notes receivables consisted of (amounts expressed in thousands):
Loans and notes receivable $ 392,548 $ 222,999 Allowance for uncollectibles (80,615) (29,251) Loans and notes receivable, net $ 311,933 $ 193,748
Amounts not scheduled for collection in subsequent year $ 263,880 $ 157,181
Component Units
Universities
Primary GovernmentGovernmental Activities
Governmental FundsGeneral
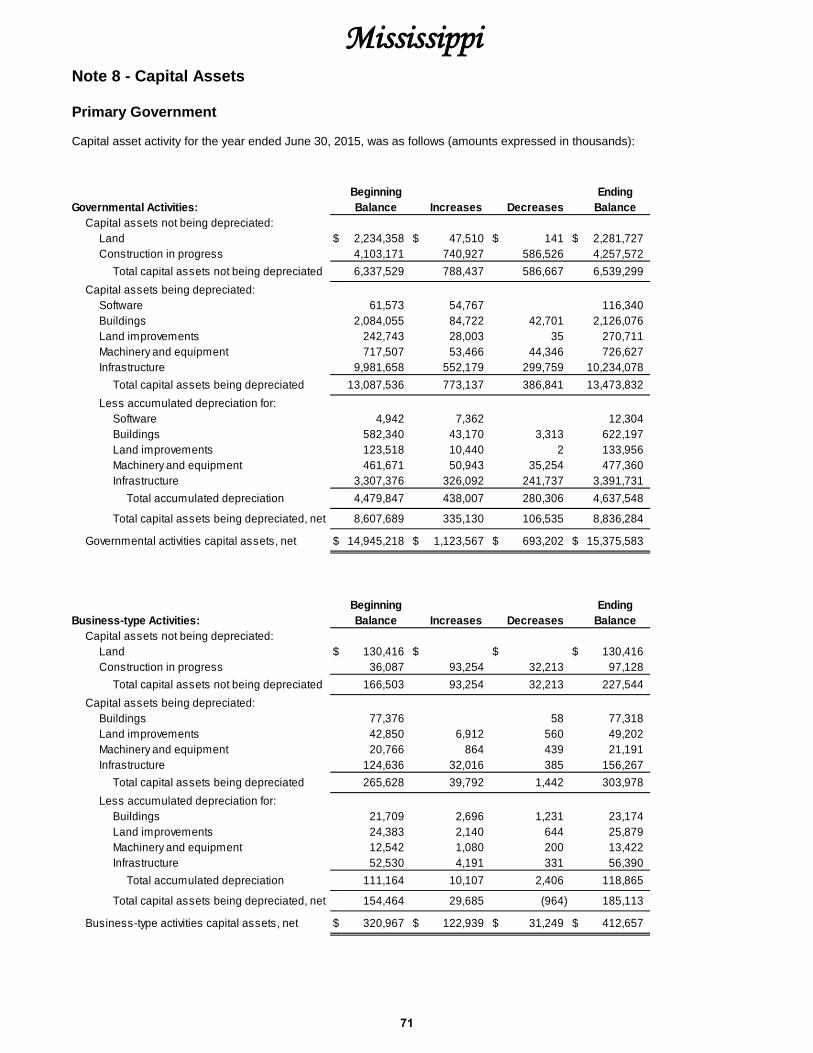
Mississippi
71
Note 8 - Capital Assets
Primary Government
Capital asset activity for the year ended June 30, 2015, was as follows (amounts expressed in thousands):
Beginning EndingGovernmental Activities: Balance Increases Decreases Balance Capital assets not being depreciated: Land $ 2,234,358 $ 47,510 $ 141 $ 2,281,727 Construction in progress 4,103,171 740,927 586,526 4,257,572 Total capital assets not being depreciated 6,337,529 788,437 586,667 6,539,299 Capital assets being depreciated: Software 61,573 54,767 116,340 Buildings 2,084,055 84,722 42,701 2,126,076 Land improvements 242,743 28,003 35 270,711 Machinery and equipment 717,507 53,466 44,346 726,627 Infrastructure 9,981,658 552,179 299,759 10,234,078 Total capital assets being depreciated 13,087,536 773,137 386,841 13,473,832 Less accumulated depreciation for: Software 4,942 7,362 12,304 Buildings 582,340 43,170 3,313 622,197 Land improvements 123,518 10,440 2 133,956 Machinery and equipment 461,671 50,943 35,254 477,360 Infrastructure 3,307,376 326,092 241,737 3,391,731
Total accumulated depreciation 4,479,847 438,007 280,306 4,637,548
Total capital assets being depreciated, net 8,607,689 335,130 106,535 8,836,284
Governmental activities capital assets, net $ 14,945,218 $ 1,123,567 $ 693,202 $ 15,375,583
Beginning EndingBusiness-type Activities: Balance Increases Decreases Balance Capital assets not being depreciated: Land $ 130,416 $ $ $ 130,416 Construction in progress 36,087 93,254 32,213 97,128 Total capital assets not being depreciated 166,503 93,254 32,213 227,544 Capital assets being depreciated: Buildings 77,376 58 77,318 Land improvements 42,850 6,912 560 49,202 Machinery and equipment 20,766 864 439 21,191 Infrastructure 124,636 32,016 385 156,267 Total capital assets being depreciated 265,628 39,792 1,442 303,978 Less accumulated depreciation for: Buildings 21,709 2,696 1,231 23,174 Land improvements 24,383 2,140 644 25,879 Machinery and equipment 12,542 1,080 200 13,422 Infrastructure 52,530 4,191 331 56,390
Total accumulated depreciation 111,164 10,107 2,406 118,865
Total capital assets being depreciated, net 154,464 29,685 (964) 185,113
Business-type activities capital assets, net $ 320,967 $ 122,939 $ 31,249 $ 412,657

Mississippi
72
Depreciation expense was charged to functions/programs as follows (amounts expressed in thousands):
Governmental Activities: General government $ 19,212 Education 3,604 Health and social services 17,018 Law, justice and public safety 27,844 Recreation and resources development 11,096 Regulation of business and profession 213 Transportation 335,332 Depreciation on capital assets held by the government's internal service funds is charged to the various functions based on their usage of the assets 2,971 Total depreciation expense - governmental activities $ 417,290
Business-type Activities: Port Authority at Gulfport $ 6,317 Other business-type 1,569 Total depreciation expense - business-type activities $ 7,886
Construction in progress is composed of (amounts expressed in thousands):
Project Expended OutstandingAuthorization To Date Commitment
Governmental Activities: Department of Transportation $ 4,711,317 $ 3,974,670 $ 739,268 Department of Finance and Administration 104,428 126,228 37,904 Information Technology Services 14,110 12,312 660 Wireless Communication Commission 23,050 15,363 7,687 Department of Public Safety 43,391 36,538 4,651 Department of Health 42,301 37,679 4,975 Department of Rehabilitation Services 13,578 13,527 12 East MS State Hospital 34,141 17,001 8,256 Military Department 14,607 6,598 8,009 Other projects less than $10 million 26,700 17,656 8,407 Total governmental activities 5,027,623 4,257,572 819,829Business-type Activities: Port Authority at Gulfport 279,407 96,477 182,930 Yellow Creek Port Authority 770 651 119 Total business-type activities 280,177 97,128 183,049
Total construction in progress $ 5,307,800 $ 4,354,700 $ 1,002,878

Mississippi
73
Component Units
At June 30, 2015, capital assets consisted of (expressed in thousands):
Universities Nonmajor TotalCapital assets not being depreciated: Land $ 91,673 $ 17,301 $ 108,974 Construction in progress 542,394 26 542,420 Total capital assets not being depreciated 634,067 17,327 651,394Capital assets being depreciated: Buildings 3,308,692 161,989 3,470,681 Land improvements 337,478 52,652 390,130 Machinery and equipment 1,199,815 28,036 1,227,851 Infrastructure 44,620 44,620 Total capital assets being depreciated 4,845,985 287,297 5,133,282 Less accumulated depreciation 1,884,537 131,922 2,016,459 Total capital assets being depreciated, net 2,961,448 155,375 3,116,823
Component units capital assets, net $ 3,595,515 $ 172,702 $ 3,768,217

Mississippi
74
Note 9 - Long-term General Obligation Bonds
Bond indebtedness incurred by the State must be authorized by legislation governing the specific programs or projects to be financed. Such legislation provides the state bond commission authority to approve and authorize the sale and issuance of bonds. The state bond commission is comprised of the Governor as chairman, the State Attorney General as secretary, and the State Treasurer.
General obligation bonds are issued to provide funds for capital improvements which include repairing, renovating, or constructing state owned facilities, to provide loans and grants to local governments and other entities for economic development and capital improvements, and to provide grants to community colleges and universities for capital improvements. General obligation refunding bonds are issued to currently refund or advance refund certain outstanding bonds for both capital and non-capital related purposes, the majority of which are non-capital related. Certain general obligation refunding bonds issued by the State as of June 30, 2015 pay interest at variable rates. The remaining general obligation debt has fixed rates of interest.
The Tax Reform Act of 1986 requires governmental entities issuing tax-exempt bonds to refund to the U. S. Treasury interest earnings on bond proceeds in excess of the yield on those bonds. The State must comply with arbitrage rebate requirements in order for their bonds to maintain tax-exempt status. As of June 30, 2015, no arbitrage rebate liability existed.
General obligation bonds are backed by the full faith, credit and taxing power of the state. Although certain general obligation debt is being retired from the resources of the business-type activities and is, therefore, recorded in those funds, the State remains contingently liable for its payment.
Refunding and Defeased Bonds
During fiscal year 2015, the State issued the following general obligation refunding bonds, which are reported in governmental activities:
Tax-exempt General Obligation Refunding Bonds, Series 2015C totaling $249,980,000 dated February 3, 2015. The Series 2015C Bonds were issued for the purpose of advance refunding and defeasing the following Tax-Exempt Refunded Bonds: $167,315,000 (original principal amount) General Obligation Bonds (Community Heritage Preservation Grant Program, Local Governments and Rural Water Revolving Loan Fund, Water Pollution Control Revolving Fund, Department of Marine Resources Equipment and Facilities Fund, Mississippi Museum of Art, Local System Bridge Replacement and Rehabilitation Fund, Hillcrest Cemetery Repair Fund, Chalmers Institute Repair Fund, B. B. King Museum, Capital Improvements and GO Captens Series A (Tax-Exempt) Project), Series 2006D, dated as of November 1, 2006; $299,020,000 (original principal amount) General Obligation Bonds (Capital Improvements Issue), Series 2007B, dated as of December 1, 2007; $133,545,000 (original principal amount) General Obligation Bonds, Series 2008A (Community Heritage Preservation Grant Program, Local Governments and Rural Water Systems Program, Water Pollution Control Revolving Fund, Local System Bridge Replacement Program, Mississippi Public Health Laboratory Project, Rural Fire Truck Acquisition Assistance Program, Bureau of Buildings Projects and Soil and Water Conservation Program), dated as October 1, 2008. These bonds mature serially beginning in year 2018 through 2028 with interest rates ranging from 4% to 5%. The advance refunding and defeasing was undertaken to reduce debt service payments by $28,826,000 and to obtain an economic gain (the difference between the present value of the debt service payments of the refunded and refunding bonds) of $24,317,000.
Taxable General Obligation Refunding Bonds, Series 2015D totaling $179,135,000 dated February 3, 2015. The Series 2015D Bonds were issued for the purpose of advance refunding and defeasing the following Taxable Refunded Bonds: $96,600,000 (original principal amount) Taxable General Obligation Bonds, Series 2008B (Economic Development Highway Fund, 2006 Shipyard Improvements, Ace Fund, Small Municipalities and Limited Population Counties Fund, Minority Business Enterprise Program, Children’s Museum Program and Statewide Wireless Communications System Project), dated as of October 1, 2008; $120,000,000 (original principal amount) Taxable General Obligation Bonds, Series 2009E, dated October 29, 2009. These bonds mature serially beginning in year 2015 through 2032 with interest rates ranging from 0.31% to 3.729%. The advance refunding and defeasing was undertaken to reduce debt service payments by $15,910,000 and to obtain an economic gain (the difference between the present value of the debt service payments of the refunded and refunding bonds) of $12,064,000.
In prior years, the State defeased certain outstanding general obligation bonds of the primary government by depositing the proceeds in irrevocable trusts to be used solely for satisfying all future scheduled principal and interest payments on the refunded debt. Accordingly, for financial reporting purposes, the defeased bonds and related trust accounts are not included in the financial statements. At June 30, 2015, $652,640,000 of outstanding general obligation bonds are considered defeased.
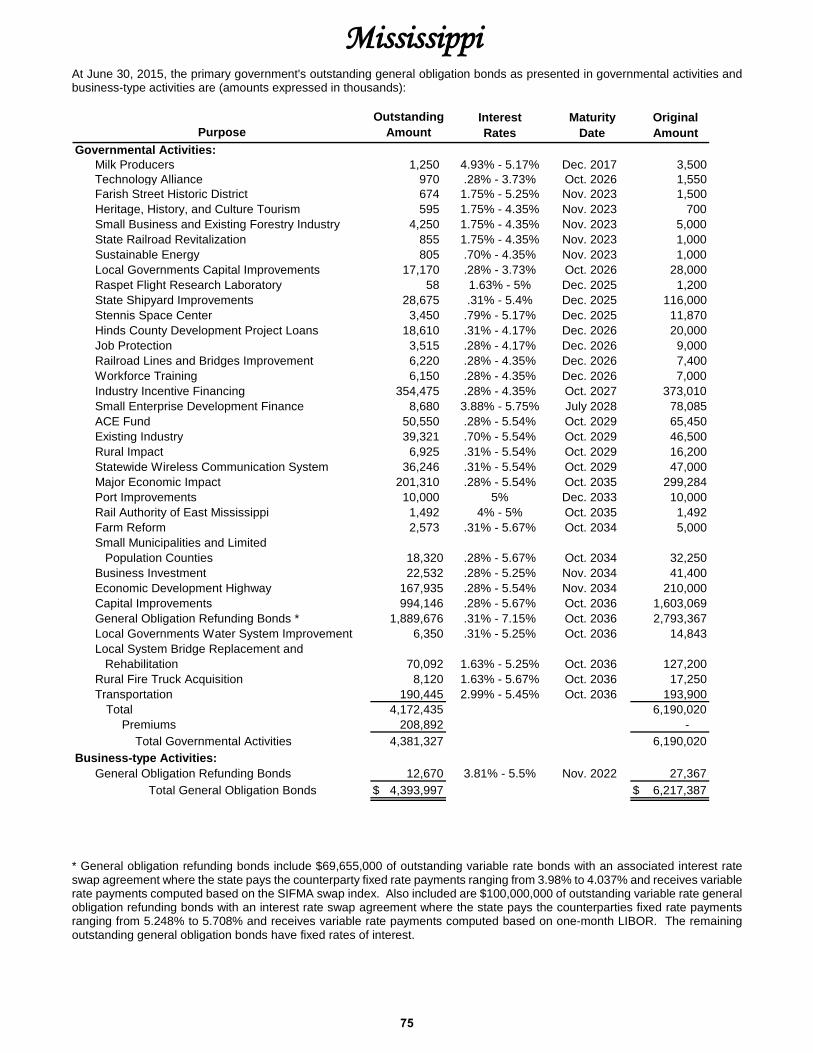
Mississippi
75
At June 30, 2015, the primary government's outstanding general obligation bonds as presented in governmental activities and business-type activities are (amounts expressed in thousands):
Interest Maturity OriginalPurpose Rates Date Amount
Governmental Activities: Milk Producers 1,250 4.93% - 5.17% Dec. 2017 3,500 Technology Alliance 970 .28% - 3.73% Oct. 2026 1,550 Farish Street Historic District 674 1.75% - 5.25% Nov. 2023 1,500 Heritage, History, and Culture Tourism 595 1.75% - 4.35% Nov. 2023 700 Small Business and Existing Forestry Industry 4,250 1.75% - 4.35% Nov. 2023 5,000 State Railroad Revitalization 855 1.75% - 4.35% Nov. 2023 1,000 Sustainable Energy 805 .70% - 4.35% Nov. 2023 1,000 Local Governments Capital Improvements 17,170 .28% - 3.73% Oct. 2026 28,000 Raspet Flight Research Laboratory 58 1.63% - 5% Dec. 2025 1,200 State Shipyard Improvements 28,675 .31% - 5.4% Dec. 2025 116,000 Stennis Space Center 3,450 .79% - 5.17% Dec. 2025 11,870 Hinds County Development Project Loans 18,610 .31% - 4.17% Dec. 2026 20,000 Job Protection 3,515 .28% - 4.17% Dec. 2026 9,000 Railroad Lines and Bridges Improvement 6,220 .28% - 4.35% Dec. 2026 7,400 Workforce Training 6,150 .28% - 4.35% Dec. 2026 7,000 Industry Incentive Financing 354,475 .28% - 4.35% Oct. 2027 373,010 Small Enterprise Development Finance 8,680 3.88% - 5.75% July 2028 78,085 ACE Fund 50,550 .28% - 5.54% Oct. 2029 65,450 Existing Industry 39,321 .70% - 5.54% Oct. 2029 46,500 Rural Impact 6,925 .31% - 5.54% Oct. 2029 16,200 Statewide Wireless Communication System 36,246 .31% - 5.54% Oct. 2029 47,000 Major Economic Impact 201,310 .28% - 5.54% Oct. 2035 299,284 Port Improvements 10,000 5% Dec. 2033 10,000 Rail Authority of East Mississippi 1,492 4% - 5% Oct. 2035 1,492 Farm Reform 2,573 .31% - 5.67% Oct. 2034 5,000 Small Municipalities and Limited Population Counties 18,320 .28% - 5.67% Oct. 2034 32,250 Business Investment 22,532 .28% - 5.25% Nov. 2034 41,400 Economic Development Highway 167,935 .28% - 5.54% Nov. 2034 210,000 Capital Improvements 994,146 .28% - 5.67% Oct. 2036 1,603,069 General Obligation Refunding Bonds * 1,889,676 .31% - 7.15% Oct. 2036 2,793,367 Local Governments Water System Improvement 6,350 .31% - 5.25% Oct. 2036 14,843 Local System Bridge Replacement and Rehabilitation 70,092 1.63% - 5.25% Oct. 2036 127,200 Rural Fire Truck Acquisition 8,120 1.63% - 5.67% Oct. 2036 17,250 Transportation 190,445 2.99% - 5.45% Oct. 2036 193,900
Total 4,172,435 6,190,020 Premiums 208,892 -
Total Governmental Activities 4,381,327 6,190,020Business-type Activities: General Obligation Refunding Bonds 12,670 3.81% - 5.5% Nov. 2022 27,367
Total General Obligation Bonds $ 4,393,997 $ 6,217,387
OutstandingAmount
* General obligation refunding bonds include $69,655,000 of outstanding variable rate bonds with an associated interest rateswap agreement where the state pays the counterparty fixed rate payments ranging from 3.98% to 4.037% and receives variable rate payments computed based on the SIFMA swap index. Also included are $100,000,000 of outstanding variable rate general obligation refunding bonds with an interest rate swap agreement where the state pays the counterparties fixed rate payments ranging from 5.248% to 5.708% and receives variable rate payments computed based on one-month LIBOR. The remaining outstanding general obligation bonds have fixed rates of interest.

Mississippi
76
At June 30, 2015, future general obligation debt service requirements for the primary government are (amounts expressed in thousands):
Principal Interest Principal Interest2016 292,956 178,490 2,974 5052017 302,828 166,250 3,022 3792018 415,618 148,820 3,127 2412019 244,512 136,595 3,238 922020 219,276 127,493 129 132021 - 2025 959,005 514,421 180 122026 - 2030 808,715 317,9752031 - 2035 782,770 132,8112036 - 2037 146,755 5,877
Total 4,172,435 1,728,732 12,670 1,242 Premiums 208,892
Total Debt Service, Net $ 4,381,327 $ 1,728,732 $ 12,670 $ 1,242
Year Ending June 30 Business-type ActivitiesGovernmental Activities
Derivative Instruments
The State entered into interest rate swap agreements in connection with $169,655,000 of outstanding variable rate debt in order to hedge changes in cash flows. At June 30, 2015, the State had the following pay-fixed interest rate swap derivative instruments reported in governmental activities, all of which had the objective of hedging the interest rate risk of the variable rate bonds.
Associated Bonds
Notional Amount
Effective Date
Final Maturity
Date Terms
Counterparty Credit Rating
2012C $ 50,000,000 Aug. 2012 Nov. 2017 Pay 5.708%; receive one-month LIBOR A/A2/A 2012C 50,000,000 Aug. 2012 Nov. 2017 Pay 5.248%; receive one-month LIBOR A+/A1/AA- 2012D 32,635,000 Aug. 2012 Sept. 2017 Pay 4.037%; receive SIFMA swap index A-/A3/A 2012D 37,020,000 Aug. 2012 Sept. 2017 Pay 3.980%; receive SIFMA swap index A-/A3/A
The swaps associated with the 2012C and 2012D variable rate bonds had an effectiveness determined using regression analysis on variable interest rate bonds. The variability of the cash flows of the bond coupons is affected by more than changes in the benchmark interest rate. For example, changes in the credit quality of the State's bonds would affect its interest rates. The State's specific objective, however, is to offset changes in the cash flows of the bond coupons attributable to changes in the benchmark interest rate (a cash flow hedge). The relevant benchmark interest rate indexes for the 2012C and 2012D variable rate bonds are LIBOR and SIFMA, respectively. For the 2012C and 2012D bonds, the swaps that the State entered into do not meet the criteria for the consistent critical terms method. Because the swaps are a hedge of interest rate risk as opposed to the risk of changes in overall cash flows associated with the bond coupons, the State is precluded from using the synthetic instrument method to evaluate effectiveness. Unable to apply either the consistent critical terms method or the synthetic instrument method, the State has chosen to apply the regression analysis method for financial reporting purposes as well as tax compliance purposes.
The regression analysis method evaluates effectiveness by considering the statistical relationship between the cash flows or fair values of the potential hedging derivative instrument and the hedgeable items. The changes in cash flows or fair values of the potential hedging derivative instrument substantially offset the changes in cash flows or fair values of the hedgeable item if all of the following criteria are met;
The R-squared of the regression analysis is at least 0.80
The F-statistic calculated for the regression model demonstrates that the model is significant using a 95 percent confidence interval.
The regression coefficient for the slope is between -1.25 and -.80.
Data was used from November and December 2012 through June 30, 2015, to determine if the potential hedging derivative instruments were effective as of June 30, 2015. The use of the regression analysis method requires appropriate interpretation and understanding of the statistical inferences.
The resulting calculation shows that using over 30 observations, the resulting adjusted R-square is .99, the F-statistic is zero and the regression coefficients for the slopes are between -1.010 and -1.005. Based on these parameters required to apply hedge accounting, the 2012C and 2012D hedges are deemed highly effective.

Mississippi
77
The hedging derivative instruments are considered hybrid instruments since the derivatives were “off-market” at the time of association with the 2012C and 2012D bonds. Additionally, as a result of the refunding, the resulting maturity date was revised to November 1, 2017 and September 1, 2017, for the 2012C and 2012D bonds, respectively. Therefore, the portion of each hedging derivative instruments value attributable to payment dates beyond the maturity date will be accounted for as an investment derivative, since there is no hedgeable item beyond that date.
Fair Value - Fair values for the swap transactions were estimated using the zero-coupon method. This method calculates the future net settlement payments required by the swap, assuming that the current forward rates implied by the yield curve correctly anticipate future spot interest rtes. These payments are then discounted using the spot rates implied by the current yield curve for hypothetical zero – coupon bonds due on the date of each future net settlement on the swap.
The fair value balances at June 30, 2015 and the changes in fair value of pay fixed receive-variable interest rate swaps reported in governmental activities are (amounts expressed in thousands):
Associated Notional
Bonds Amount Classification Amount Classification Amount 2012C $ 50,000 Interest expense $ 2,414 Borrowing $ (5,635)
Deferred outflows of resources (291) At-market derivative 33Investment revenue (3,231) Investment derivative (11,984)
2012C 50,000 Interest expense 1,982 Borrowing (4,624)Deferred outflows of resources (78) At-market derivative (412)Investment revenue (2,264) Investment derivative (7,842)
2012D 32,635 Interest expense 1,122 Borrowing (2,156)Deferred outflows of resources (131) At-market derivative (135)Investment revenue (820) Investment derivative (2,181)
2012D 37,020 Interest expense 1,245 Borrowing (2,451)Deferred outflows of resources (154) At-market derivative (160)Investment revenue (1,195) Investment derivative (2,893)
$ 169,655 $ (1,401) $ (40,440)
Changes in Fair Value Fair Value at June 30, 2015
Hedged Debt and Derivative Instrument Payments - The interest and net swap payments shown assume that interest rates at year end will remain unchanged for the term of the bonds and the hedges. As interest rates vary, interest payments on the variable rate bonds and the net swap payments will change. The future minimum debt service on long-term general obligation debt reported for the primary government is presented at the end of this note. At June 30, 2015, future debt service requirements on the hedged variable rate bonds and net payments on associated hedging derivative instruments are (amounts expressed in thousands):
Net SwapYear Ending June 30 Principal Interest Payment Total
2016 4,550 1,284 7,885 13,7192017 4,755 1,255 7,700 13,7102018 161,255 360 2,187 163,802
$ 170,560 $ 2,899 $ 17,772 $ 191,231
Interest Rate Risk - Although the interest rates on the bonds are synthetically fixed under the swap agreements, interest payments on the variable rate bonds and the net payments under the swap agreements will vary as interest rates change.
Credit Risk - The swap agreements and Section 31-18-11, Mississippi Code Ann. (1972), require that the counterparties have credit ratings by at least one nationally recognized statistical rating agency that are within the two highest investment grade categories, and credit ratings by all other nationally recognized statistical rating agencies that are within the three highest grade categories, otherwise the payment obligations of the counterparty shall be unconditionally guaranteed by an entity with such credit ratings. Section 31-18-11, Mississippi Code Ann. (1972), also requires that should the credit rating of the counterparty or of the entity unconditionally guaranteeing the counterparty's obligations fall below the required rating, that the obligations of such counterparty shall be fully and continuously collateralized by direct obligations of, or obligations the principal and interest on which are guaranteed by the United States of America, with a net market value of at least 102% of the net market value of the swap agreements and shall be deposited as directed by the State. Additionally, Section 31-18-11, Mississippi Code Ann. (1972), requires that the counterparty, or the entity guaranteeing the counterparty's obligations, have a net worth of at least $100,000,000. The State is not exposed to credit risk at June 30, 2015, as all hedging and investment derivative instruments are in a liability position.

Mississippi
78
Basis Risk - The swap agreements expose the State to basis risk because the applicable interest rates under the swap agreements are based on LIBOR and SIFMA swap indexes, which may differ from the interest rates for the State’s variable rate bonds. As of June 30, 2015, the weighted average variable interest rate paid on the bonds was .76852%, while the SIFMA swap index was .07% and one-month LIBOR was .18590%.
Termination Risk - The swap agreements are documented by using the International Swap Dealers Association Master Agreement which includes standard termination events, such as failure to pay and bankruptcy. The schedule to the Master Agreement includes additional termination events providing that the swap agreements may be terminated if either the State’s or the counterparty’s credit rating falls below certain levels. The State or the counterparties may terminate the swap agreements if the other party fails to perform under the terms of the contract. If one or more of the swap agreements are terminated, the State would no longer have a synthetic fixed rate with respect to the previously hedged bonds and would be exposed to these bonds’ variable interest rates. Also, if at the time of termination the swap agreements have a negative fair value, the State would incur a loss and would be required to pay the swap agreements’ fair value to the counterparty. If the swap agreements have a positive fair value at the time of termination, the State would realize a gain and would receive the swap agreements’ fair value from the counterparty.
Note 10 - Bonds Authorized But Unissued
At June 30, 2015, authorized but unissued bond indebtedness existed to be used for various purposes as summarized below (amounts expressed in thousands):
Note 11 - Revenue Bonds and Notes
Revenue bonds and notes are backed by a pledge of resources derived from users of the related facilities and are not supported by the full faith and credit of the State.
At June 30, 2015, outstanding revenue bonds and notes are (amounts expressed in thousands): Final
Outstanding Interest Maturity OriginalPurpose Amount Rates Date Amount
Component Units Universities: Bonds $ 1,072,023 .29% - 6.84% Aug. 2045 $ 1,328,028 Notes 16,203 1.29% - 5.13% Sept. 2039 20,902 Total Component Units $ 1,088,226 $ 1,348,930
Authorized ButPurpose Unissued
General Obligation Bonds: ACE Fund $ 87,450 $ 22,000 Business Investment Act 346,500 49,823 Capital Improvements 744,000 110,696 Deer Island Project 10,000 1,200 Economic Development Highway 374,500 70,600 Energy Infrastructure Revolving Loan 5,000 5,000 Farm Reform 128,000 20,000 Industry Incentive Financing 468,000 94,990 Major Economic Impact 1,142,800 25,126 North Central Mississippi Regional Railroad Grant 45,000 45,000 Railroad Authority of East Mississippi 1,500 8 Railroad Revitalization and Stimulus 3,000 2,000 Rural Fire Truck Acquisition 17,850 600 Small Business and Existing Forestry Industry Revolving Loan 30,000 25,000 Small Enterprise Development Finance 140,000 131,320 Sustainable Energy Research 2,000 1,000 Technology Alliance 4,000 1,450 Transportation - Access Roads 4,000 4,000 Workforce Training 8,000 1,000
$ 3,561,600 $ 610,813
Authorized

Mississippi
79
At June 30, 2015, future revenue bond and note debt service requirements are (amounts expressed in thousands):
Year Ending June 30 Principal Interest2016 $ 34,243 $ 48,332 2017 36,376 47,188 2018 34,398 45,987 2019 35,974 44,761 2020 36,487 43,454 2021 - 2025 190,995 193,117 2026 - 2030 215,094 146,581 2031 - 2035 224,124 93,343 2036 - 2040 190,946 42,290 2041 - 2045 89,589 6,853
$ 1,088,226 $ 711,906
Component Units
Note 12 - Other Long-term Liabilities
A. Compensated Absences - The State’s liability for compensated absences at June 30, 2015 is $118,498,000 for governmental activities and $685,000 for business-type activities. Internal service compensated absences of $1,262,000 are included in governmental activities. For governmental activities, accrued compensated absences are generally paid out of the general fund. The component units’ liability for compensated absences is $122,327,000 of which $121,444,000 is for the Universities. The reported liability includes related fringe benefits and excludes any obligations related to leave accumulations in excess of 30 days per employee (see Note 1-N).
B. Pollution Remediation Obligation - As of June 30, 2015, six Superfund sites in the State are in various stages of cleanup ranging from initial assessment of contamination to cleanup of chemical spills. Numerous leaking underground storage tank sites exist where motor fuels contaminate soil and groundwater, and present inhalation and explosive hazards. Under federal and state law, the State is legally obligated to remedy the detrimental effects of existing pollution through site investigation and assessment, restoration and replacement, cleanup, and monitoring.
At June 30, 2015, the primary government’s pollution remediation obligation is $43,089,000. This estimate is based on professional judgment, experience, historical cost data, and the use of the expected cash flow technique. Recoveries from other responsible parties, which would reduce the State’s remediation liability, are not anticipated. Costs of pollution remediation are paid out of the general fund. Remediation obligation estimates may change over time. Estimated costs will vary due to changes in technology, fluctuation in prices, changes in potential responsible parties, and changes in regulations.
C. Notes Payable - At June 30, 2015, the primary government’s outstanding notes payable as presented in governmental activities are (amounts expressed in thousands):
FinalInterest Maturity
Purpose Rates DateUtility restoration $ 92,330 5% - 5.45% Jul. 2019 $ 188,415Energy efficiency 12,334 3.10% - 4.50% Apr. 2026 14,698Buildings 216,414 2% - 5.37% Jul. 2031 220,910Roads and bridges 716,232 2% - 6.59% Jan. 2040 793,701
Total 1,037,310 1,217,724Premiums 76,684
Total Notes Payable, Net $ 1,113,994 $ 1,217,724
OutstandingAmount
OriginalAmount
Defeased Notes – In prior years, the State defeased certain outstanding notes of the primary government by depositing the proceeds in irrevocable trusts to be used solely for satisfying all future scheduled principal and interest payments on the refunded debt. Accordingly, for financial reporting purposes, the defeased notes and related trust accounts are not included in the financial statements. At June 30, 2015, $190,070,000 of outstanding notes are considered defeased.
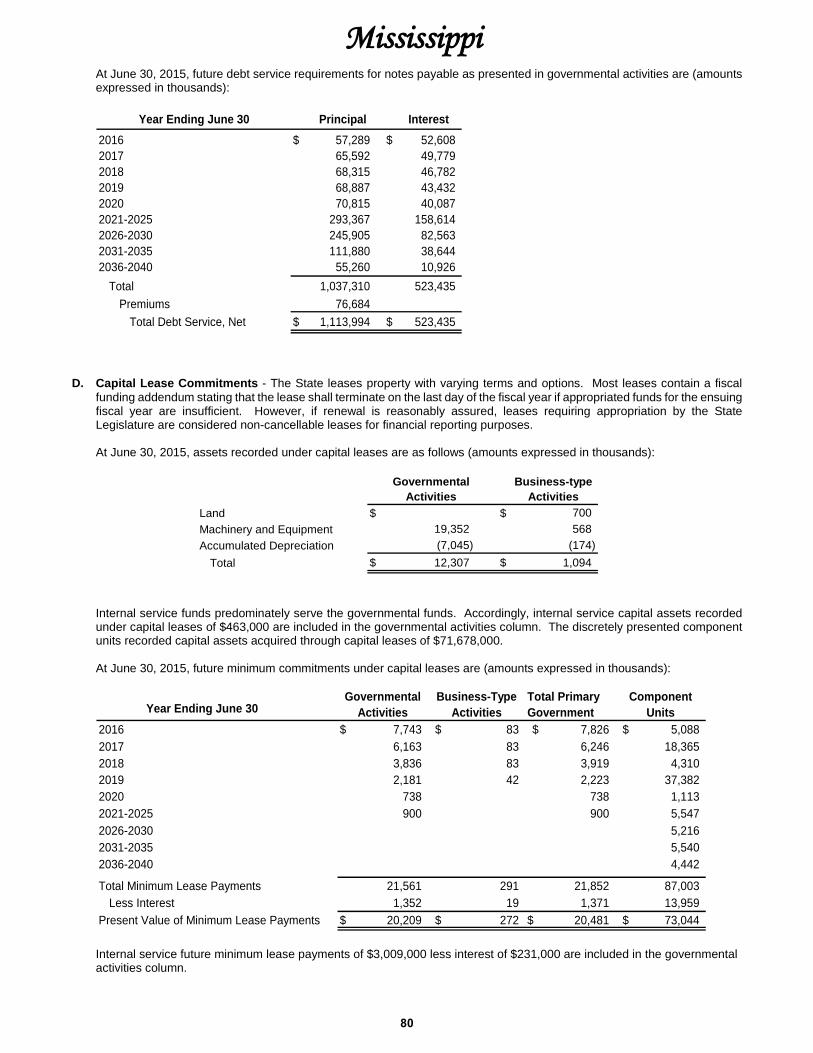
Mississippi
80
At June 30, 2015, future debt service requirements for notes payable as presented in governmental activities are (amounts expressed in thousands):
Year Ending June 30 Principal Interest2016 $ 57,289 $ 52,6082017 65,592 49,7792018 68,315 46,7822019 68,887 43,4322020 70,815 40,0872021-2025 293,367 158,6142026-2030 245,905 82,5632031-2035 111,880 38,6442036-2040 55,260 10,926
Total 1,037,310 523,435Premiums 76,684
Total Debt Service, Net $ 1,113,994 $ 523,435
D. Capital Lease Commitments - The State leases property with varying terms and options. Most leases contain a fiscal funding addendum stating that the lease shall terminate on the last day of the fiscal year if appropriated funds for the ensuing fiscal year are insufficient. However, if renewal is reasonably assured, leases requiring appropriation by the State Legislature are considered non-cancellable leases for financial reporting purposes.
At June 30, 2015, assets recorded under capital leases are as follows (amounts expressed in thousands):
Governmental Activities
Business-type Activities
Land $ $ 700Machinery and Equipment 19,352 568Accumulated Depreciation (7,045) (174)
Total $ 12,307 $ 1,094
Internal service funds predominately serve the governmental funds. Accordingly, internal service capital assets recorded under capital leases of $463,000 are included in the governmental activities column. The discretely presented component units recorded capital assets acquired through capital leases of $71,678,000.
At June 30, 2015, future minimum commitments under capital leases are (amounts expressed in thousands):
Year Ending June 302016 $ 7,743 $ 83 $ 7,826 $ 5,0882017 6,163 83 6,246 18,3652018 3,836 83 3,919 4,3102019 2,181 42 2,223 37,3822020 738 738 1,1132021-2025 900 900 5,5472026-2030 5,2162031-2035 5,5402036-2040 4,442
Total Minimum Lease Payments 21,561 291 21,852 87,003Less Interest 1,352 19 1,371 13,959
Present Value of Minimum Lease Payments $ 20,209 $ 272 $ 20,481 $ 73,044
Total Primary Government
Component Units
Business-Type Activities
Governmental Activities
Internal service future minimum lease payments of $3,009,000 less interest of $231,000 are included in the governmental activities column.

Mississippi
81
Note 13 - Changes in Long-term Liabilities
Changes in the primary government’s long-term liabilities for the year ended June 30, 2015 are summarized below (amounts expressed in thousands):
Beginning EndingBalance Balance
Governmental Activities:General Obligation Bonds (Note 9) $ 4,135,272 $ 712,750 $ 675,587 $ 4,172,435 $ 292,956
Premiums/Discounts (Note 9) 162,371 75,342 28,821 208,892 19,544Notes Payable (Note 12) 1,006,639 82,940 52,269 1,037,310 57,289
Premiums (Note 12) 72,328 11,415 7,059 76,684 7,059Total Bonds and Notes 5,376,610 882,447 763,736 5,495,321 376,848
Derivative Instruments (Note 9) 39,039 1,401 40,440Capital Lease Obligations (Note 12) 22,775 4,697 7,263 20,209 7,175Accrued Compensated Absences (Note 12) 119,229 62,843 63,574 118,498 9,589Pollution Remediation Obligation (Note 12) 41,857 11,449 10,217 43,089 8,017
$ 5,599,510 $ 962,837 $ 844,790 $ 5,717,557 $ 401,629Business-type Activities:General Obligation Bonds (Note 9) $ 15,503 $ $ 2,833 $ 12,670 $ 2,974Capital Lease Obligations (Note 12) 344 72 272 74Accrued Compensated Absences (Note 12) 713 185 213 685 60
$ 16,560 $ 185 $ 3,118 $ 13,627 $ 3,108
One YearDue Within
Additions Reductions
Internal service funds predominantly serve the governmental funds. Therefore, long-term liabilities for internal service funds are included in the governmental activities totals. The beginning and ending balances of governmental activities capital lease obligations include $941,000 and $2,778,000, respectively, of internal service funds. The beginning and ending balances of governmental activities accrued compensated absences include $1,284,000 and $1,262,000, respectively, of internal service funds.
The current portion of accrued compensated absences is reported in accounts payable and other liabilities and the long-term portion is included in noncurrent other liabilities.
Note 14 – Short-term Financing
Credit Agreements - The Division of Medicaid, which is reported within the General Fund, is authorized to obtain a line of credit up to $150,000,000 from any special source funds in the state treasury or commercial lenders to cover temporary cash flow shortfalls in providing health care services. This line of credit is secured by the first available funds received by the Division of Medicaid and is to be repaid by the end of the quarter following the loan origination. Changes in the line of credit activity during fiscal year 2015 are as follows (amounts expressed in thousands):
Beginning EndingBalance Additions Reductions Balance
Medicaid Line of Credit $ 30,000 $ 53,000 $ 30,000 $ 53,000

Mississippi
82
Note 15 - Retirement Plans
Plan Description
In accordance with state statutes, Public Employees’ Retirement System (PERS) Board of Trustees (System) administers four defined benefit plans. The defined benefit plans are the PERS, a cost-sharing multiple-employer public employee retirement system established in 1952, Mississippi Highway Safety Patrol Retirement System (MHSPRS), a single-employer public employee retirement system established in 1958, the Municipal Retirement Systems (MRS), which are agent multiple-employer defined benefit public employee retirement systems composed of 19 separate municipal retirement and fire and police disability and relief systems, and Supplemental Legislative Retirement Plan (SLRP), a single-employer public employee retirement system established in fiscal year 1990.
PERS, MHSPRS, MRS and SLRP are considered part of the State of Mississippi's financial reporting entity and are included in the accompanying financial statements as pension trust funds. The purpose of these plans is to provide pension benefits for all state employees, sworn officers of the state highway patrol, other public employees whose employers have elected to participate, and elected members of the State Legislature and the president of the Senate. The System issues a Comprehensive Annual Financial Report, which includes PERS, MHSPRS, MRS and SLRP, that is available from Public Employees’ Retirement System of Mississippi.
Membership and Benefit Provisions
Public Employees' Retirement System: Membership in PERS is a condition of employment granted upon hiring for qualifying employees and officials of the State, state universities, community and junior colleges, and teachers and employees of the public school districts. For those persons employed by the political subdivisions and instrumentalities of the State, membership is contingent upon approval of the entity's participation in PERS by the System's Board of Trustees. If approved, membership for these employees is a condition of employment and eligibility is granted to those who qualify upon hiring. A member who terminates employment from all covered employers and who is not eligible to receive monthly retirement benefits may request a refund of his or her accumulated member contributions plus interest. Upon withdrawal of contributions, a member forfeits service credit represented by those contributions.
Participating members who are vested and retire at or after age 60 or those who retire regardless of age with at least 30 years of creditable service (25 years of creditable service for employees who became members of PERS before July 1, 2011) are entitled, upon application, to an annual retirement allowance payable monthly for life in an amount equal to 2 percent of their average compensation for each year of credited service up to and including 30 years (25 years for those who became members before July 1, 2011) plus 2.5 percent for each additional year of credited service with an actuarial reduction in the benefit for each year of creditable service below 30 years or the number of years in age that the member is below 65, whichever is less. Average compensation is the average of the employee's earnings during the four highest compensated years of credited service. A member may elect a reduced retirement allowance payable for life with the provision that, after death, a beneficiary receives benefits for life or for a specified number of years. Benefits vest upon completion of eight years of membership service (four years of membership service for those who became members of PERS before July 1, 2007). PERS also provides certain death and disability benefits. Benefit provisions are established by Section 25-11-1 et seq., Mississippi Code Ann. (1972) and may be amended only by the State Legislature.
A Cost-of-Living Adjustment (COLA) is made to eligible retirees and beneficiaries. The COLA is equal to 3 percent of the annual retirement allowance for each full fiscal year of retirement up to the year in which the retired member reaches age 60 (55 for those who became members of PERS before July 1, 2011), with 3 percent compounded for each fiscal year thereafter. For the year ended June 30, 2015, the total annual COLA payments for PERS were $517,283,000.
Mississippi Highway Safety Patrol Retirement System: Membership in MHSPRS is a condition of employment granted upon hiring for all officers of the Mississippi Highway Safety Patrol who have completed a course of instruction in an authorized highway patrol training school on general law enforcement and who serve as sworn officers of the highway patrol in the enforcement of the laws of the State. Participating members who withdraw from service at or after age 55 with at least five years of membership service, or after reaching age 45 with at least 20 years of credited service, or with 25 years of service at any age, are entitled, upon application, to an annual retirement allowance payable monthly for life in an amount equal to 2.5 percent of average compensation during the four highest consecutive years of earnings, reduced 3 percent for each year below age 55 or 3 percent for each year under 25 years of service, whichever is less. MHSPRS also provides certain death and disability benefits. A member who terminates employment from the highway patrol and who is not eligible to receive monthly retirement benefits may request a refund of his or her accumulated employee contributions plus interest. Upon withdrawal of contributions, a member forfeits service credit represented by those contributions. Benefit provisions for MHSPRS are established by Section 25-13-1 et seq., Mississippi Code Ann. (1972) and may be amended only by the State Legislature.
A COLA payment is made to eligible retirees and beneficiaries. The COLA is equal to 3 percent of the annual retirement allowance for each full fiscal year of retirement up to the year in which the retired member reaches age 60, with 3 percent compounded for each fiscal year thereafter. For the year ended June 30, 2015, the total annual COLA payments for MHSPRS were $8,553,000.

Mississippi
83
Municipal Retirement Systems: Membership in the two general Municipal Retirement Systems and the 17 Fire and Police Disability and Relief Systems was granted to all municipal employees, fire fighters, and police officers who were not already members of PERS and who were hired prior to July 1, 1976. Two fire and police plans elected to extend the eligibility period for membership to July 1, 1987. Eligible employees hired after these periods automatically become members of PERS. The Municipal Retirement Systems were all closed to new members by July 1, 1987.
Regardless of age, participating employees who retire with at least 20 years of membership service are entitled to an annual retirement allowance payable monthly for life in an amount equal to 50 percent of their average monthly compensation and an additional 1.7 percent for each year of credited service beyond 20 years, not to exceed 66.67 percent of average monthly compensation, except as may otherwise be provided through local and private legislation. Average monthly compensation for the two Municipal Retirement Systems and the 17 Fire and Police Disability and Relief Systems is the monthly average for the last six months of service. Certain participating employers provide a minimum monthly retirement allowance. Benefits vest upon reaching 20 years of credited service. MRS plans also provide certain death and disability benefits. Members who terminate employment from all covered employers and are not eligible to receive monthly retirement benefits may request a full refund of employee contributions. Members covered by MRS do not received interest on their accumulated contributions. Upon withdrawal of contributions, a member forfeits service credit represented by those contributions. Benefit provisions are established by Sections 21-29-1 et seq., Articles 1, 3, 5 and 7, Mississippi Code Ann. (1972) and annual local and private legislation. Statutes may be amended only by the State Legislature.
The retirees and beneficiaries of MRS plans with provisions for COLAs, who are receiving a retirement allowance on July 1 of each fiscal year, may be entitled to a COLA. This payment is equal to the annual percentage change of the Consumer Price Index (CPI) but not to exceed 2.5 percent of the annual retirement allowance for each full fiscal year of retirement. Certain MRS plans may adopt a COLA other than one linked to the change in the CPI. These additional payments will be made only when funded by the employers. For the year ended June 30, 2015, the total COLAs for MRS plans were $5,487,000.
Supplemental Legislative Retirement Plan: Membership in SLRP is composed of all elected members of the State Legislature and the president of the Senate. This plan is designed to supplement the provisions of PERS. Those serving when SLRP became effective July 1, 1989, had 30 days to waive membership. Those elected after July 1, 1989, automatically become members. Members and employers are statutorily required to contribute certain percentages of salaries and wages as specified by the Board of Trustees.
The retirement allowance is 50 percent of an amount equal to the retirement allowance payable by PERS, determined by credited service as an elected senator or representative in the State Legislature or as president of the Senate. Benefits vest upon completion of the requisite number of membership service years in PERS. SLRP also provides certain death and disability benefits. A member who terminates legislative employment and who is not eligible to receive monthly retirement benefits may request a refund of his or her accumulated employee contributions plus interest. Upon withdrawal of contributions, a member forfeits service credit represented by those contributions. Benefit provisions for SLRP are established by Section 25-11-301 et seq., Mississippi Code Ann. (1972) and may be amended only by the State Legislature.
Retirees and beneficiaries of SLRP may receive COLAs calculated identically to PERS retirees and beneficiaries. For the year ended June 30, 2015, the total COLAs for SLRP were $266,000.
Contribution Requirements
Contribution provisions for PERS, MHSPRS and SLRP are established by state statute. The adequacy of these rates is assessed annually by actuarial valuation. Contribution provisions for MRS are established by state statute and annual local and private legislation. State statutes may be amended only by the State Legislature.
The following table provides information concerning funding policies (amounts expressed in thousands):
PERS MHSPRS MRS SLRP Contribution rates as a percent of covered payroll: State 15.75% * 37% * N/A 7.4% * Other employers N/A N/A 1.24 – 7.79 mills****
N/A
Plan members 9% 7.25% 7% - 10% 3% ** Employer contributions made $ 996,478 $ 13,695 *** $ 19,344 $ 511
* In October 2012, the Board adopted a revised funding policy aimed at stabilizing the employer contribution rate andreducing the unfunded actuarial accrued liability. The revised policy established a goal to be 80% funded by 2042 and set the PERS employer rate at 15.75%, MHSPRS rate at 37%, and SLRP rate at 7.4%.
** In addition to 9% required by PERS. *** Includes fees authorized by the State Legislature, which are reported as other additions in the pension trust funds.
Due to Senate Bill No. 2659 enacted in 2004, an estimated additional contribution of $4,600,000 (18 percent of payroll) was used to calculate total required contributions for MHSPRS. The actual amount received in 2015 was $3,788,000.
**** Based on assessed property values.

Mississippi
84
Pension Liabilities, Pension Expense, and Deferred Outflows of Resources and Deferred Inflows of Resources Related to Pensions
At June 30, 2015, the State reported a liability of $2,265,840,000 for its proportionate share of the net pension liability in PERS. The net pension liability was measured as of June 30, 2014, and the total pension liability used to calculate the net pension liability was determined by an actuarial valuation as of that date. The State’s proportion of the net pension liability was based on a projection of the long-term share of contributions to the pension plan relative to the projected contributions of all participating employers, actuarially determined. At the measurement date, the State’s proportion was 18.67%.
At June 30, 2015, the State reported a net pension liability of $119,790,000 and $3,787,000 for MHSPRS and SLRP, respectively. The net pension liability was measured as of June 30, 2014, and the total pension liability used to calculate the net pension liability was determined by an actuarial valuation as of that date.
Changes in the Net Pension Liability
The following table details the changes in the net pension liability from the beginning to the end of the measurement year for the single-employer plans, MHSPRS and SLRP (amounts expressed in thousands):
MHSPRSTotal Pension
LiabilityPlan Fiduciary
Net PositonNet Pension
Liability(a) (b) (a) - (b)
Balances at June 30, 2014 $ 431,575 $ 287,456 $ 144,119Changes for the Year: Service Cost 6,461 6,461 Interest 33,396 33,396 Difference between expected and actual experience 2,652 2,652 Contributions - employer 13,500 (13,500) Contributions - employee 1,963 (1,963) Net investment income 51,575 (51,575) Benefit payment, including refunds of employee contributions (28,262) (28,262) 0 Administrative expense (200) 200 Net Changes 14,247 38,576 (24,329)Balances at June 30, 2015 $ 445,822 $ 326,032 $ 119,790
SLRPTotal Pension
LiabilityPlan Fiduciary
Net PositonNet Pension
Liability(a) (b) (a) - (b)
Balances at June 30, 2014 $ 19,978 $ 14,374 $ 5,604Changes for the Year: Service Cost 404 404 Interest 1,549 1,549 Difference between expected and actual experience (453) (453) Contributions - employer 514 (514) Contributions - employee 208 (208) Net investment income 2,605 (2,605) Benefit payment, including refunds of employee contributions (1,238) (1,238) 0 Administrative expense (10) 10 Net Changes 262 2,079 (1,817)Balances at June 30, 2015 $ 20,240 $ 16,453 $ 3,787
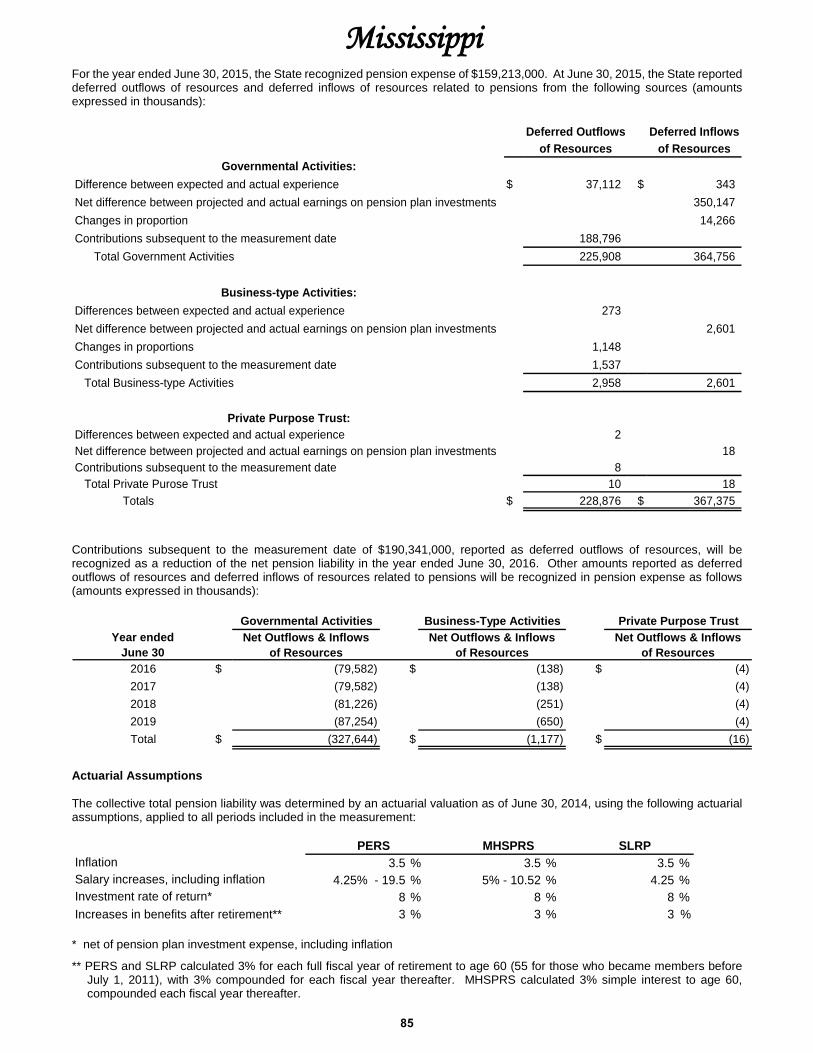
Mississippi
85
For the year ended June 30, 2015, the State recognized pension expense of $159,213,000. At June 30, 2015, the State reported deferred outflows of resources and deferred inflows of resources related to pensions from the following sources (amounts expressed in thousands):
Deferred Outflows Deferred Inflowsof Resources of Resources
Governmental Activities:Difference between expected and actual experience $ 37,112 $ 343Net difference between projected and actual earnings on pension plan investments 350,147Changes in proportion 14,266Contributions subsequent to the measurement date 188,796 Total Government Activities 225,908 364,756
Business-type Activities:Differences between expected and actual experience 273Net difference between projected and actual earnings on pension plan investments 2,601Changes in proportions 1,148Contributions subsequent to the measurement date 1,537 Total Business-type Activities 2,958 2,601
Private Purpose Trust:Differences between expected and actual experience 2Net difference between projected and actual earnings on pension plan investments 18Contributions subsequent to the measurement date 8 Total Private Purose Trust 10 18
Totals $ 228,876 $ 367,375
Contributions subsequent to the measurement date of $190,341,000, reported as deferred outflows of resources, will be recognized as a reduction of the net pension liability in the year ended June 30, 2016. Other amounts reported as deferred outflows of resources and deferred inflows of resources related to pensions will be recognized in pension expense as follows (amounts expressed in thousands):
Governmental Activities Business-Type Activities Private Purpose TrustYear ended
June 30Net Outflows & Inflows
of ResourcesNet Outflows & Inflows
of ResourcesNet Outflows & Inflows
of Resources2016 $ (79,582) $ (138) $ (4)2017 (79,582) (138) (4)2018 (81,226) (251) (4)2019 (87,254) (650) (4)Total $ (327,644) $ (1,177) $ (16)
Actuarial Assumptions
The collective total pension liability was determined by an actuarial valuation as of June 30, 2014, using the following actuarial assumptions, applied to all periods included in the measurement:
Inflation 3.5 % 3.5 % 3.5 %Salary increases, including inflation 4.25% - 19.5 % 5% - 10.52 % 4.25 %Investment rate of return* 8 % 8 % 8 %Increases in benefits after retirement** 3 % 3 % 3 %
PERS MHSPRS SLRP
* net of pension plan investment expense, including inflation
** PERS and SLRP calculated 3% for each full fiscal year of retirement to age 60 (55 for those who became members before July 1, 2011), with 3% compounded for each fiscal year thereafter. MHSPRS calculated 3% simple interest to age 60, compounded each fiscal year thereafter.

Mississippi
86
Mortality rates for PERS, MHSPRS and SLRP were based on the RP-2000 Combined Mortality Table Projected with Scale AA to 2025, set forward two years for males.
The actuarial assumptions for PERS, MHSPRS and SLRP used in the June 30, 2014, valuation were based on the results of an actuarial experience study for the period July 1, 2008, to June 30, 2012. The experience report is dated June 12, 2013.
The long-term expected rate of return on pension plan investments for PERS, MHSPRS and SLRP was determined using a log-normal distribution analysis in which best-estimate ranges of expected future real rates of return (expected nominal returns, net of pension plan investment expense and the assumed rate of inflation) are developed for each major asset class. These ranges are combined to produce the long-term expected rate of return by weighing the expected future real rates of return by the target asset allocation percentage and by adding expected inflation. The target asset allocation and best estimates of arithmetic real rates of return for each major asset class as of June 30, 2014, are summarized in the following table:
Asset Class
Target Asset
Allocation
Long-term Expected Real Rate of Return
U.S. Broad 34 % 5.20 %International equity 19 5.00Emerging markets equity 8 5.45Fixed income 20 0.25Real assets 10 4.00Private equity 8 6.15Cash 1 (0.50) Totals 100 %
Single-Employer Benefit Plan Employees
The following employees were covered by the benefit terms of MHSPRS and SLRP at June 30, 2015:
MHSPRS SLRPInactive employees or beneficiaries currently receiving benefits 720 187Inactive employees entitled to but not yet receiving benefits 58 56Active employees 495 175 Totals 1,273 418
Discount Rate
The discount rate used to measure the total pension liability was 8%. The projection of cash flows used to determine the discount rate assumed that the plan member contributions will be made at the current contribution rate of 9%, 7.25% and 3% for PERS, MHSPRS and SLRP, respectively, and that employer contributions will be made at the current employer contribution rate 15.75%, 37% and 7.4% for PERS, MHSPRS and SLRP, respectively. Based on those assumptions, the pension plans’ fiduciary net position was projected to be available to make all projected future benefit payments of current plans members. Therefore, the long-term expected rate of return on pension plan investments was applied to all periods of projected benefit payments to determine the total pension liability.
Sensitivity of the State’s Proportionate Share of the Net Pension Liability to Changes in the Discount Rate
The following table presents the State’s proportionate share of the net pension liability using the discount rate of 8%, as well as what the plan’s net pension liability would be if it were calculated using a discount rate that is 1-percentage-point lower (7%) or 1-percentage-point higher (9%) than the current rate (amounts expressed in thousands):
1% DecreaseCurrent
Discount Rate 1% IncreaseNet Pension Liability 7% 8% 9%
PERS $ 3,089,091 $ 2,265,840 $ 1,579,226 MHSPRS 172,521 119,790 75,853 SLRP 5,893 3,787 1,983 Total $ 3,267,505 $ 2,389,417 $ 1,657,062
Detailed information about the PERS, MHSPRS and SLRP pension plans is available on the PERS of Mississippi website at www.pers.ms.gov.

Mississippi
87
Note 16 - Other Postemployment Benefits
Plan Description
The State and School Employees’ Health Insurance Management Board (the Board) administers the State's self-insured medical plan and life insurance program established by Section 25-15-3 et seq., Mississippi Code Ann. (1972), which may be amended only by the State Legislature. State law mandates that all state, public education, library, junior and community college and retiring employees be offered health and life benefit coverage through the State and School Employees’ Life and Health Insurance Plan (the Plan). Since retirees may obtain health insurance by participating in a group with active employees and consequently receive a health insurance premium rate differential, the State has a postemployment healthcare benefit reportable under GASB Statement 45 as a single employer defined benefit healthcare plan. Effective July 1, 2007, the State implemented GASB Statement 45 prospectively, which requires reporting on an accrual basis the liability associated with other postemployment benefits. The State does not issue a publicly available financial report for the Plan.
Funding Policy
Employees' premiums are funded by the state and local school districts with additional funding provided by retired employees and by active employees for spouse and dependent medical coverage. The Plan is financed on a pay-as-you-go basis. The Board has the sole authority for setting health insurance premiums for the State and School Employees’ Life and Health Insurance Plan. For governmental activities, the general fund is typically used to retire the OPEB obligation.
Per Section 25-15-15 (10), Mississippi Code Ann. (1972), any retired employee electing to purchase retiree life and health insurance will have the full cost of such insurance premium deducted monthly from his State retirement plan check or direct billed for the cost of the premium if the retirement check is insufficient to pay for the premium. If the board determines actuarially that the premium paid by the participating retirees adversely affects the overall cost of the Plan to the state, then the board may impose a premium surcharge, not to exceed fifteen percent, upon such participating retired employees who are under the age for Medicare eligibility and who were initially employed before January 1, 2006. For participating retired employees who are under the age for Medicare eligibility and who were initially employed on or after January 1, 2006, the Board may impose a premium surcharge in an amount the Board determines actuarially to cover the full cost of insurance. For the year ended June 30, 2015, retiree premiums range from $190 to $1,472 depending on plan election, dependent coverage, Medicare eligibility, and date of hire.
Actuarial Valuation
The State and School Employees’ Life and Health Insurance Plan’s Report of the Actuary on the Other Postemployment Benefits Valuation was prepared as of June 30, 2015. The Plan presently has an actuarial valuation performed annually in order to be in compliance with GASB Statement 45.
Annual OPEB Cost and Net OPEB Obligation
The State’s annual OPEB cost is calculated based on the annual required contribution of the employer (ARC), an amount actuarially determined in accordance with the parameters of GASB Statement 45. The ARC was determined assuming the Plan would fund the OPEB liability on a pay-as-you-go basis. The ARC represents a level of funding that, if paid on an ongoing basis, is projected to cover normal cost each year and amortize any unfunded actuarial liabilities (or funding excess) over a period not to exceed thirty years. The current ARC of $48,308,000 is 1.05 percent of annual covered payroll.
The following table presents the OPEB cost for the year, the amount contributed and changes in the OPEB Plan for fiscal year 2015 (amounts expressed in thousands):
Annual required contribution $ 48,308 Interest on prior year net OPEB obligation 6,297 Adjustment to annual required contribution (4,829) Annual OPEB cost 49,776 Contributions made (32,245) Increase in net OPEB obligation 17,531 Net OPEB obligation – Beginning of year 139,943 Net OPEB obligation – End of year $ 157,474

Mississippi
88
The following table provides the State’s annual OPEB cost, the percentage of annual OPEB cost contributed to the Plan, and the net OPEB obligation for the last three fiscal years as restated (amounts expressed in thousands):
Annual OPEB Cost
Percentage of Annual OPEB Cost Contributed Net OPEB Obligation
2013 $ 46,047 64.0% $ 125,193 2014 45,253 67.4 139,943 2015 49,776 64.8 157,474
Funded Status and Funding Progress
The following table provides funding information for the most recent actuarial valuation date (amounts expressed in thousands):
Actuarial Valuation Date June 30, 2015 Actuarial Value of Assets $ 0 Actuarial Accrued Liability (AAL) Entry Age Normal $ 732,127 Unfunded AAL (UAAL) $ 732,127 Funded Ratio 0.0% Annual Covered Payroll $ 4,617,302 UAAL as a Percentage of Annual Covered Payroll 15.9%
Actuarial valuations of an ongoing plan involve estimates of the value of reported amounts and assumptions about the probability of occurrence of events far into the future. Examples include assumptions about future employment, mortality, and the healthcare cost trend. Amounts determined regarding the funded status of the Plan and the annual required contributions of the employer are subject to continual revision as actual results are compared with past expectations and new estimates are made about the future. The schedule of funding progress, presented as RSI following the notes to the financial statements, is designed to present multiyear trend information about whether the actuarial value of plan assets is increasing or decreasing over time relative to the actuarial accrued liability for benefits.
Actuarial Methods and Assumptions
Projections of benefits for financial reporting purposes are based on the substantive plan (the plan as understood by the employer and plan members) and include the types of benefits provided at the time of each valuation and the historical pattern of sharing of benefit costs between the employer and plan members to that point. The actuarial methods and assumptions used include techniques that are designed to reduce the effects of short-term volatility in actuarial accrued liabilities and the actuarial value of assets, consistent with the long-term perspective of the calculations. Additional information as of the latest actuarial valuation follows:
Actuarial valuation date June 30, 2015 Actuarial cost method Entry age normal Amortization method Level percent of pay, open Remaining amortization period 30 years Asset valuation method Market value of assets Actuarial assumptions: Investment rate of return* 4.5% Projected salary increases** 4.5% - 15.0% Healthcare cost trend rate* 7.75% Ultimate trend rate 5.0% Year of ultimate trend rate 2019
* Includes price inflation at 3.0% ** Includes wage inflation at 3.75%
Note 17 - Commitments
A. Operating Leases
The State has entered into numerous agreements to lease land and buildings which are classified as operating leases. These agreements generally contain the provision that, at the expiration date of the lease, the State may renew the operating lease on a month-to-month basis. It is expected that in the normal course of business most of these leases will be renewed or replaced by similar leases. Although the lease terms vary, most leases are subject to annual appropriation by the State Legislature to continue the lease obligation. If an appropriation is reasonably assured, leases are considered non-cancellable for financial reporting purposes. Any escalation clauses, sublease rentals, and contingent rents are considered immaterial to the future minimum lease payments and current rental expenditures.

Mississippi
89
Operating lease payments are recorded as expenditures or expenses when paid or incurred. Future minimum commitments due under non-cancellable operating leases for land and buildings as of June 30, 2015 are as follows (amounts expressed in thousands):
Expenditures for rental of land and buildings under operating leases for the year ended June 30, 2015 amounted to $24,973,000.
B. Contracts
At June 30, 2015, the Department of Transportation had contracts outstanding of approximately $757,849,000 with performance continuing during fiscal year 2016. Of this amount $56,602,000 is related to local public agencies, such as planning and development districts, counties and municipalities. These contracts were primarily for construction, repair and maintenance and will be paid through the General Fund. Approximately 64 percent of future expenditures related to these commitments are expected to be reimbursed from proceeds of federal grants when the actual costs are incurred. The remaining portion will be funded by specific gasoline taxes.
The State Aid Road Division had contracts of $50,353,000 outstanding at June 30, 2015 for construction, repair and maintenance of state and county roads. These contracts will be paid through the General Fund. Approximately 36 percent of future expenditures related to these commitments are expected to be reimbursed from proceeds of federal grants when the actual costs are incurred. The remaining portion will be funded by specific tax levies.
The Office of Building, Grounds and Real Property Management had outstanding construction, repair and maintenance contracts of $319,805,000 at June 30, 2015. These contracts will be paid from the General fund.
The Military Department had contracts outstanding of approximately $8,009,000 at June 30, 2015. Approximately 90 percent of future expenditures related to these commitments are expected to be reimbursed from proceeds of federal grants when the actual costs are incurred. The remaining portion will be paid through the general fund.
The Port Authority at Gulfport (a major enterprise fund) had contracts outstanding of approximately $182,930,000 at June 30, 2015. These contracts were primarily for construction costs related to the port. These contracts will be paid from Port Authority at Gulfport’s revenues and federal grants.
The Department of Information Technology Services had contracts outstanding of approximately $30,510,000 at June 30, 2015. These contracts were primarily for the construction of the Mississippi Wireless Information Network state-wide digital trunked land mobile radio system including enhancements which add broadband data capabilities. Approximately 95 percent of future expenditures related to these commitments are expected to be reimbursed from proceeds of federal grants when the actual costs are incurred. The remaining portion will be paid through the General Fund.
C. Encumbrances
Encumbrances represent executed but unperformed purchase orders that are reported within governmental funds as restricted, committed, or assigned fund balance. At June 30, 2015, the encumbrance amounts in the General Fund were $52,500,000.
Year Ending June 30 Amount2016 21,2292017 17,4632018 12,7572019 8,8542020 6,4312021 - 2025 21,1012026 - 2030 14,5392031 - 2035 11,3122036 - 2040 2162041 - 2045 1662046 - 2050 30Total Minimum Commitments $ 114,098

Mississippi
90
Note 18 - Risk Management
The State has elected to finance most exposures to risk through the retention of risk. The exposures to risk retained by the State are health and life benefits, tort liability, unemployment benefits and workers' compensation benefits. The State utilizes the internal service Risk Management Fund to account for these activities with the noted exception in workers' compensation benefits. Estimates of liabilities for incurred but unpaid claims include both reported and unreported insured events. Nonincremental claims adjustment expenses have not been included as part of the liability for claims and judgments due to immateriality. Changes in claim liabilities recorded in governmental activities for fiscal years 2014 and 2015 are as follows (amounts expressed in thousands):
Beginning Changes Claims EndingBalance in Estimates Payments Balance
2014 $ 147,675 $ 771,904 $ 727,718 $ 191,861
2015 191,861 697,167 713,235 175,793
Health and Life Benefits: The State has elected to manage the health benefit through the retention of all exposure. The life benefit is purchased from a commercial insurance company for death benefit distribution under tax law but management of the risk is accomplished by self insuring within an insured shell. State law mandates that all state, public education, library, junior and community college and retiring employees be offered health and life benefit coverage through this plan.
Estimates of the liability for unpaid claims are actuarially determined using the development method. This method uses past observed patterns of time between claim incurral and payment to estimate incurred claims from available claims data. Liabilities are based on the estimated ultimate cost of settling the claims, including inflation and other factors, and provisions for estimated claims adjustment expenses.
Tort Liability: The State manages tort claims through the retention of all liability exposure. The State Legislature created the Tort Claims Board to administer these claims beginning in fiscal year 1994. Statutory regulations provide some protection, as well as a limitation of liability, for claims filed against state agencies and state employees. There is some limited purchase of commercial insurance by state agencies for excess auto liability and other lines of coverage to fulfill some contractual requirements on out of state operations. There is purchase of insurance for protection of some fleet vehicles, some specified watercraft and specific fixed wing aircraft. In the last three years, settled claims have not exceeded commercial coverage.
Claims payments are financed through an annual assessment to all state agencies based on amount of payroll and past loss history. Estimates of the liability for unpaid claims are actuarially determined based on observed patterns of claims payments, as well as the experience of similar programs in other states.
Unemployment Benefits: Unemployment benefits are established in statute and administered by the Mississippi Department of Employment Security. The State elects to manage the financial risk for state agencies through retention of all liability exposure. Benefits are financed through collection of premiums from agencies, which provides a stable cash flow for payment of claims.
Estimates of the liability for unpaid claims are actuarially determined based on observed patterns of claims payments, adjusted for changes in covered payrolls.
Workers' Compensation Benefits: Workers' compensation benefits are established in statute and the rules and regulations are established by the Mississippi Workers' Compensation Commission and the Mississippi State Agencies Self-Insured Workers’ Compensation Trust Board of Trustees. Four major state agencies have been granted exemption from participation in the Risk Management Fund.
The exposure of risk in the Risk Management Fund is financed mostly through retention of all exposure, with limited purchase of commercial excess insurance. The benefits are financed through collection of premiums, based on an actuarial estimate, from agencies which provides a stable cash flow for claims payments. In the last three years, settled claims have not exceeded commercial coverage. Estimates of the liability for unpaid claims are actuarially determined based on observed patterns of claims payments and case reserves development. Liabilities are based on the ultimate costs of settling claims, including inflation and other factors, and include provisions for estimated claims adjustment expenses.
Exempted state agencies cover all claim settlements and judgments with the resources of the General Fund. Claim expenditures and estimates of the related liability are reported when it is probable that a loss has occurred and the amount of that loss can be reasonably estimated.

Mississippi
91
Note 19 - Contingencies
A. Federal Grants - The State has received federal grants for specific purposes that are subject to audit by the grantor agencies. Entitlements to these resources are generally conditional upon compliance with the terms and conditions of grant agreements and applicable federal regulations, including the expenditure of resources for allowable purposes. Any disallowance resulting from an audit may become a liability of the State. The State estimates that the ultimate disallowance pertaining to these grants, if any, will be immaterial to its overall financial condition.
B. Litigation - The State is party to various legal proceedings that arise in the normal course of governmental operations. The State’s legal counsel believes that they will be successful in defending the State and its agencies in a majority of these cases. In the event that they are not successful in defending such cases, they do not believe that the total liability will exceed $43,685,000. In the opinion of the State, the ultimate disposition of these matters will not have a material adverse effect on the financial position of the State.
C. Loan Guarantees - The Mississippi Development Authority (MDA), a state agency, is authorized by state law to provide loan guarantees through the Small Business Loan Guarantee Program, funded through the Federal State Small Business Credit Initiative, in order to increase the amount of capital made available by private lenders to small businesses. The length of the loan guarantees range from one to fifteen years. In the case of default by the borrower, following the private lender’s normal collection procedures to seek reimbursement from the loan recipient, the State pays the private lender a percentage of the outstanding loan amount. At June 30, 2015, outstanding MDA loan guarantees totaled $43,090,000.
The State has co-signed promissory notes issued by the Federal Emergency Management Agency under the Federal Community Disaster Loan Program (CDL) on behalf of local governments as authorized by state law. The program provides operational funding for local governments or political subdivisions of the State that incurred a significant loss in revenue due to a presidentially declared disaster that adversely affected their ability to provide essential governmental services. At June 30, 2015, the remaining outstanding CDL loan guarantees totaled $2,862,000. The loan guarantees expire September 30, 2035.
D. Conduit Debt - The Mississippi Development Bank (a nonmajor component unit) issues special obligation bonds in order to provide funds for making loans to governmental units. Although the special obligation bonds bear the name of the Bank, the Bank is not responsible for the payment of the bonds but rather the bonds are secured only by the payments agreed to be paid by the governmental units under the terms of the loan agreements. The outstanding balance of special obligation bonds issued by the Bank was approximately $2,083,328,000 at June 30, 2015. The faith, credit and taxing power of the State and the Bank are not pledged to the payment of such bonds.
Note 20 - Subsequent Events
The Working Cash Stabilization Reserve Account and budgetary special funds may be used to meet cash flow needs throughout the year when the General Fund experiences projected cash flow deficiencies. As a result, the General Fund has accumulated borrowings outstanding of $311,776,000 from the Working Cash Stabilization Reserve Account and $485,209,000 from budgetary special funds as of April 22, 2016. In order to comply with State law, all borrowings must be repaid by the end of the fiscal year.
The State entered into a financing agreement on September 15, 2015 to advance refund a portion of a 2007 highway project note payable. The agreement resulted in notes payable totaling $63,720,000 payable beginning in year 2016 through year 2035 with interest rates ranging from 3% to 5%.
Subsequent to year end, the State issued the following bonds and notes:
Taxable General Obligation Note, Series 2015A totaling $30,000,000 dated July 08, 2015. This note was a private placement agreement between the State and a local lending institution to provide short-term financing for the North Central Mississippi Municipal Rail Authority. The 2015A note was scheduled to mature on December 31, 2016, with an interest rate of 0.9%. This note was redeemed with the proceeds of Taxable General Obligation Bonds, Series 2015G dated November 1, 2015.
Gaming Tax Revenue Bonds, Series 2015E, totaling $200,000,000 dated October 15, 2015. These bonds were issued to provide funding for road and bridge projects. These bonds mature serially beginning in year 2016 through 2035 with interest rates ranging from 2% to 5%.
General Obligation Bonds, Series 2015F totaling $182,595,000 dated November 1, 2015. These bonds were issued to provide funding for the Marine Resources Equipment and Facilities Act, IHL Capital Improvements, Mississippi Community Heritage Preservation Grant Act, Community and Junior Colleges Capital Improvements, Center for Manufacturing Technology Excellence Act, Mississippi Civil Rights Museum and Museum of Mississippi History Construction Act, City of Bolton Facilities Improvements Act, Mississippi State Fairground Improvements Act, Mississippi Arts and Entertainment Act, City of Taylorsville Water Supply and Georgia Pacific Chip Mill Access Road Improvements Act, City of Columbus – Columbus Air Force Base Improvements Act, Bureau of Buildings State-

Mississippi
92
Owned Buildings Discretionary Act, Department of Mental Health East Mississippi State Hospital Psychiatric Receiving Unit Act, Elvis Presley Birthplace – Museum and Chapel Improvements Act, Ridgeland Corridor Act, Jackson Zoo Improvements Act, City of Wesson Water Tank Rehabilitation Act, New Capitol Repair, Renovation, and Rehabilitation Act, City of Baldwyn – U.S. Highway 45 Frontage Road Project Act, Marty Stuart Center for Country Music Act, Hattiesburg Longleaf Trace Improvements Act, Lake Hazle Dam Improvements Act, Mississippi Maritime Museum Improvements Act, City of New Albany Recreation Improvements Act, Lowndes County Equine Center Construction Act, Calhoun County Mulitpurpose Building Repair, Renovation and Rehabilitation Act, City of Utica Community Center Act, City of Bolton Community Center and Parks Act, Chickasaw County Heritage Museum Act, City of Gulfport Aquarium Construction Act, City of Clinton Marker and Northside Drive Park Act, Grammy Museum Mississippi Interpretive Center Act, and the Rail Authority of East Mississippi Act. These bonds mature serially beginning in year 2026 through 2035 with interest rates ranging 3% to 5%.
Taxable General Obligation Bonds, Series 2015G, totaling $116,300,000 dated November 1, 2015. The Series 2015G bonds were issued for the purpose of providing funding for the Toyota Act, Economic Development Highway Act, Development Infrastructure Grant Act, Mississippi Industry Incentive Financing Act, ACE Act, Workforce Training Act, Small Municipalities and Limited Population Counties Act, Railroad Improvements Act, State Shipyard Improvements Act, IHL Capital Improvements Act, and the North Central Mississippi Regional Rail Authority Loan Act/Temporary Borrowing Act. These bonds mature serially beginning in year 2016 through 2025 with interest rates ranging from .997% to 3.5%.

Mississippi
93
Required Supplementary Information

94
(Non-GAAP Basis) - All Budgetary FundsFor the Year Ended June 30, 2015 (Expressed in Thousands)
General FundActual Variance with
Original Final (Budgetary Final BudgetBudget Budget Basis) Over (Under)
Revenues Sales tax $ 2,045,000 $ 2,045,000 $ 2,034,319 $ (10,681) Individual income tax 1,736,000 1,736,000 1,743,427 7,427 Corporate income and franchise taxes 666,200 666,200 714,086 47,886 Use and wholesale compensating taxes 252,100 252,100 226,522 (25,578) Tobacco, beer and wine taxes 176,600 176,600 177,786 1,186 Insurance tax 212,300 212,300 240,413 28,113 Oil and gas severance taxes 84,700 84,700 54,761 (29,939) Alcoholic Beverage Control excise and privilege taxes and net profit on sale of alcoholic beverages 70,700 70,700 73,854 3,154 Other taxes 10,800 10,800 15,256 4,456 Interest 15,400 15,400 13,336 (2,064) Auto privilege, tag and title fees 10,900 10,900 9,443 (1,457) Gaming fees 130,500 130,500 131,270 770 Highway Safety Patrol fees 21,100 21,100 23,595 2,495 Other fees and services 11,500 11,500 12,534 1,034 Miscellaneous 4,300 4,300 3,314 (986) Court assessments and settlements 50,011 50,011 Special Fund revenues Total Revenues 5,448,100 5,448,100 5,523,927 75,827Expenditures by Major Budgetary Function Legislative 29,536 27,309 26,454 (855) Judiciary and justice 71,402 71,402 71,260 (142) Executive and administrative 3,198 3,198 3,171 (27) Fiscal affairs 63,520 63,520 63,396 (124) Public education 2,171,777 2,171,777 2,162,141 (9,636) Higher education 790,798 790,798 789,825 (973) Public health 36,065 36,065 35,442 (623) Hospitals and hospital schools 219,479 219,479 219,418 (61) Agriculture, commerce and economic development 116,155 116,155 116,204 49 Conservation and recreation 52,036 51,992 51,867 (125) Insurance and banking Corrections 346,063 346,063 345,280 (783) Interdepartmental service Social welfare 991,630 991,630 990,961 (669) Public protection and veterans assistance 105,460 105,460 104,006 (1,454) Local assistance 84,455 84,455 84,455 Motor vehicle and other regulatory agencies 40 40 40 Miscellaneous 1,380 1,380 1,378 (2) Public works 32,000 32,000 32,000 Debt service 385,628 380,628 380,532 (96) Total Expenditures 5,500,622 5,493,351 5,477,830 (15,521) Excess of Revenues over (under) Expenditures (52,522) (45,251) 46,097 91,348Other Financing Sources (Uses) Transfers in 11,700 11,700 12,184 484 Transfers out (50,761) (50,761) Other sources of cash (343) (343) Excess of Revenues and Other Sources over (under) Expenditures and Other Uses (40,822) (33,551) 7,177 40,728Budgetary Fund Balances - Beginning 109,659 103,615 41,325 (62,290)Budgetary Fund Balances - Ending $ 68,837 $ 70,064 $ 48,502 $ (21,562)
The accompanying notes to the Required Supplementary Information are an integral part of this statement.
Required Supplementary InformationBudgetary Comparison Schedule - Budget and Actual
Mississippi
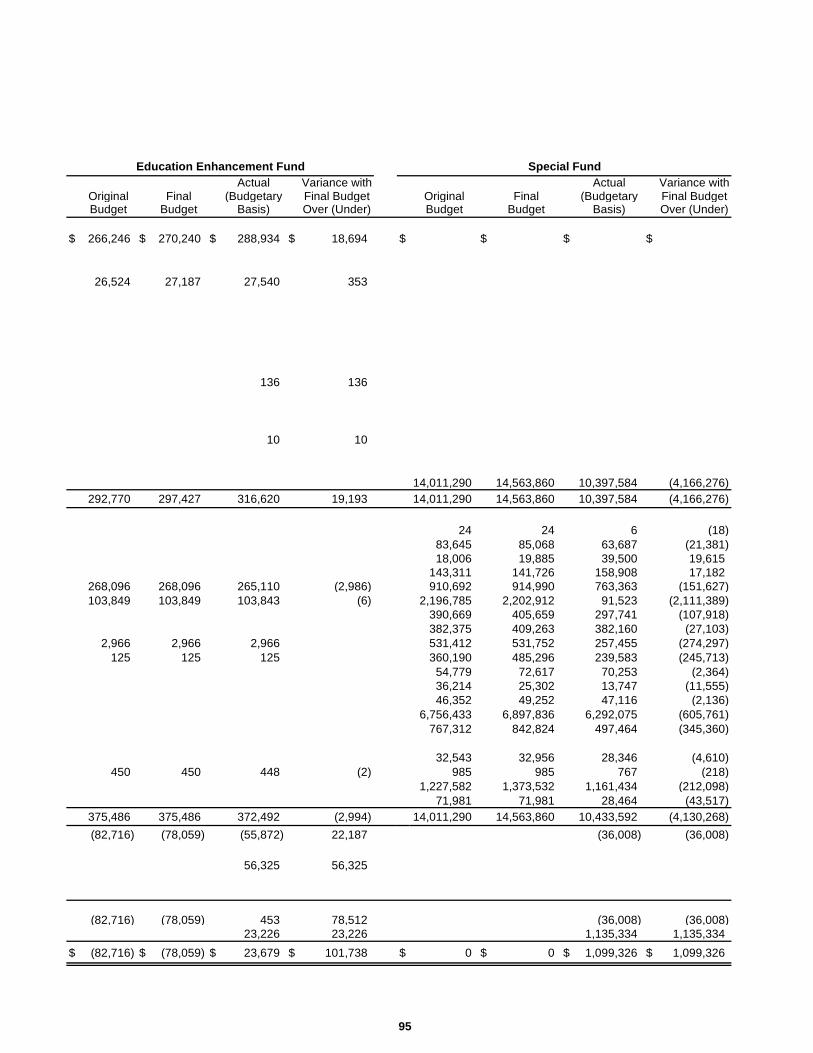
95
Actual Variance with Actual Variance withOriginal Final (Budgetary Final Budget Original Final (Budgetary Final BudgetBudget Budget Basis) Over (Under) Budget Budget Basis) Over (Under)
$ 266,246 $ 270,240 $ 288,934 $ 18,694 $ $ $ $
26,524 27,187 27,540 353
136 136
10 10
14,011,290 14,563,860 10,397,584 (4,166,276)292,770 297,427 316,620 19,193 14,011,290 14,563,860 10,397,584 (4,166,276)
24 24 6 (18)83,645 85,068 63,687 (21,381)18,006 19,885 39,500 19,615
143,311 141,726 158,908 17,182268,096 268,096 265,110 (2,986) 910,692 914,990 763,363 (151,627)103,849 103,849 103,843 (6) 2,196,785 2,202,912 91,523 (2,111,389)
390,669 405,659 297,741 (107,918)382,375 409,263 382,160 (27,103)
2,966 2,966 2,966 531,412 531,752 257,455 (274,297)125 125 125 360,190 485,296 239,583 (245,713)
54,779 72,617 70,253 (2,364)36,214 25,302 13,747 (11,555)46,352 49,252 47,116 (2,136)
6,756,433 6,897,836 6,292,075 (605,761)767,312 842,824 497,464 (345,360)
32,543 32,956 28,346 (4,610)450 450 448 (2) 985 985 767 (218)
1,227,582 1,373,532 1,161,434 (212,098)71,981 71,981 28,464 (43,517)
375,486 375,486 372,492 (2,994) 14,011,290 14,563,860 10,433,592 (4,130,268)(82,716) (78,059) (55,872) 22,187 (36,008) (36,008)
56,325 56,325
(82,716) (78,059) 453 78,512 (36,008) (36,008)23,226 23,226 1,135,334 1,135,334
$ (82,716) $ (78,059) $ 23,679 $ 101,738 $ 0 $ 0 $ 1,099,326 $ 1,099,326
Education Enhancement Fund Special Fund

96
For the Year Ended June 30, 2015
Budgetary Funds General Special
Financial Statement Major Fund General
Net Change in Budgetary Fund Balances $ 7,177 $ 453 $ (36,008)Reclassifications: Budgetary fund excesses are reclassified to the General Fund for GAAP reporting (33,377) (453) 33,830 The State reports amounts in the budgetary funds that are reported in other major and nonmajor funds 2,178Adjustments: The financial reporting fund structure includes funds that are not part of the budgetary fund structure 184,275 The State's basis of budgeting is the cash basis plus encumbrances, rather than the modified accrual basis (250,829) Lapse period revenues and expenditures are not treated as assets and liabilities in the financial reporting period 11,148Net Change in GAAP Fund Balances $ (81,606) $ 0 $ 0
Mississippi
EducationEnhancement
General Fund and Education Enhancement Fund original budget revenues represent the General Fund and EducationEnhancement Fund revenue estimates adopted by the Legislative Budget Office at the date of sine die adjournment.Special Fund revenue estimates include anticipated revenues during the year and the amount of beginning cash balanceson hand at the beginning of the year that are anticipated to be expended for special fund purposes.
Required Supplementary Information
The Budgetary Comparison Schedule - Budget and Actual (Non-GAAP Basis) - All Budgetary Funds presents the originallegally adopted budget, as well as comparisons of the final legally adopted budget with actual data on a budgetary basis.The State’s basis of budgeting is the cash basis plus encumbrances. The State has established three budgetary fundgroups to account for its budgetary activities and functions. The General Fund group is established to receive anddistribute general tax revenues and other general fund revenues and interest generated thereon. The EducationEnhancement Fund group is established to receive specific tax revenues to support various educational programs. TheSpecial Fund group is established to receive federal grants, fees, proceeds from the sale of goods and services, taxeslevied for specific purposes and interest generated thereon, and to support the functional activities of the agencies thatgenerate such revenues.
Due to the complexity of the State's budget, a separate Annual Report of Budgetary Basis Expenditures has beenprepared to present final budget to actual comparisons at the legal level of control. This budgetary report is available atthe Department of Finance and Administration.
Since accounting principles applied for purposes of developing data on a budgetary basis differ significantly from thoseused to present financial statements in conformity with GAAP, a reconciliation of differences between budgetary andGAAP presentations for the year ended June 30, 2015 is presented below (amounts expressed in thousands):
Notes to Budgetary Comparison Schedule - Budget and Actual(Non-GAAP Basis) - All Budgetary Funds

97
Last 10 Fiscal Years (Amounts Expressed in Thousands)*
2015
Actuarially required employer contribution $ 13,695
Contributions in relation to actuarially required contribution 13,695
Contribution deficiency (excess) $ 0
Covered-employee payroll $ 25,505
Actual contributions as a percentage of covered-employee payroll 53.7%
Actuarial cost method Amortization method Remaining amortization period Asset valuation method Price Inflation Salary increase Investment rate of return
MississippiRequired Supplementary Information
Schedule of Employer ContributionsMississippi Highway Safety Patrol Retirement System
Notes to Schedule of Employer Contributions:Method and assumptions used in calculations of actuarially determined contributions. The actuarially determined contribution rates in schedule of employee contributions are calculated as of June 30, 2013, two years prior to the end of the fiscal year in which contributions are reported. The following actuarial methods and assumptions were used to determine the most recent contribution rate reported in that schedule:
Entry AgeLevel percentage of payroll, open33 years5-year smoothed market3.5%4.75% to 9.84%, including infaction8%, net of pension plan investment expense, including inflation
*Only the current fiscal year is presented because 10-year data is not yet available.

98
Last 10 Fiscal Years (Amounts Expressed in Thousands)*
2015
Actuarially required employer contribution $ 511
Contributions in relation to actuarially required contribution 511
Contribution deficiency (excess) $ 0
Covered-employee payroll $ 6,861
Actual contributions as a percentage of covered-employee payroll 7.45%
Actuarial cost method Amortization method Remaining amortization period Asset valuation method Price Inflation Salary increase Investment rate of return 8%, net of pension plan investment expense,
including inflation
*Only the current fiscal year is presented because 10-year data is not yet available.
Supplemental Legislative Retirement Plan
Entry AgeLevel percentage of payroll, open39.6 years5-year smoothed market3.5%4.25%, including infaction
MississippiRequired Supplementary Information
Schedule of Employer Contributions
Notes to Schedule of Employer Contributions:Method and assumptions used in calculations of actuarially determined contributions. The actuarially determined contribution rates in schedule of employee contributions are calculated as of June 30th, two years prior to the end of the fiscal year in which contributions are reported. The following actuarial methods and assumptions were used to determine the most recent contribution rate reported in that schedule:
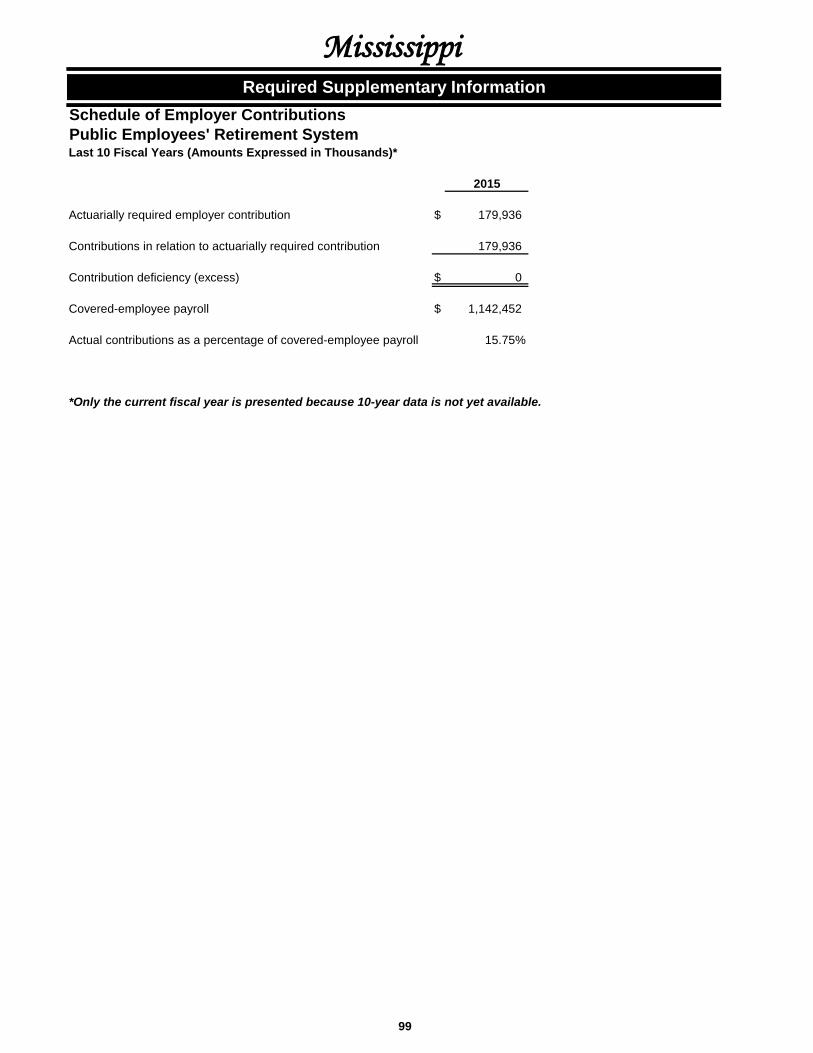
99
Last 10 Fiscal Years (Amounts Expressed in Thousands)*
2015
Actuarially required employer contribution $ 179,936
Contributions in relation to actuarially required contribution 179,936
Contribution deficiency (excess) $ 0
Covered-employee payroll $ 1,142,452
Actual contributions as a percentage of covered-employee payroll 15.75%
*Only the current fiscal year is presented because 10-year data is not yet available.
MississippiRequired Supplementary Information
Schedule of Employer ContributionsPublic Employees' Retirement System

100
Last 10 Fiscal Years (Amounts Expressed in Thousands)*
2015**Total pension liabililty Service Cost $ 6,461 Interest 33,396 Differences between expected and actual experience 2,652 Benefit payments (28,220) Refund of contributions (42) Net change in total pension liability 14,247 Total pension liability - beginning 431,575 Total pension liabililty - ending $ 445,822
Plan fiduciary net position Contributions - employer $ 13,500 Contributuion - employee 1,963 Net investment income 51,575 Benefit payments (28,220) Refund of contributions (42) Administrative expense (200) Net Change in plan fiduciary net position 38,576 Plan fiduciary net position - beginninig 287,456 Plan fiduciary net position - ending 326,032 Net pension liability - ending $ 119,790
Total pension liability 445,822 Total plan fiduciary net position 326,032 Net Pension liability $ 119,790
Plan fiduciary net position as a percentage of the pension liability 73.13% Covered-employee payroll $ 25,554 Net pension liability as a percentage of covered-employee payroll 468.77%
Mississippi Highway Safety Patrol Retirement System
* Only the current fiscal year is presented because 10-year data is not yet available.** Based on the measurement date of June 30, 2014
MississippiRequired Supplementary Information
Schedule of Changes in the Net Pension Liability

101
Last 10 Fiscal Years (Amounts Expressed in Thousands)*
2015**Total pension liabililty Service Cost $ 404 Interest 1,549 Differences between expected and actual experience (453) Benefit payments (1,216) Refund of contribution (22) Net change in total pension liability 262 Total pension liability - beginning 19,978 Total pension liabililty - ending $ 20,240
Plan fiduciary net position Contributions - employer $ 514 Contributuion - employee 208 Net investment income 2,605 Benefit payments (1,216) Refund of contributions (22) Administrative expense (10) Net Change in plan fiduciary net position 2,079 Plan fiduciary net position - beginninig 14,374 Plan fiduciary net position - ending 16,453 Net pension liability - ending $ 3,787
Total pension liability 20,240 Total plan fiduciary net position 16,453 Net Pension liability $ 3,787
Plan fiduciary net position as a percentage of the pension liability 81.29% Covered-employee payroll $ 6,918 Net pension liability as a percentage of covered-employee payroll 54.74%
MississippiRequired Supplementary Information
Schedule of Changes in the Net Pension LiabilitySupplemental Legislative Retirement Plan
** Based on the measurement date of June 30, 2014* Only the current fiscal year is presented because 10-year data is not yet available.

102
Last 10 Fiscal Years (Amounts Expressed in Thousands)*
2015**State's proportion of the net pension liability 18.67%
State's proportionate share of the net pension liability $ 2,265,840
State's covered-employee payroll $ 1,139,512
State's proportionate share of the net pension liability as a percentage of its covered-employee payroll 198.84%
Plan fiduciary net position as a percentage of the total pension liability 67.21%
MississippiRequired Supplementary Information
Schedule of the Proportionate Share of the Net Pension LiabilityPublic Employees' Retirement Plan
** Based on the measurement date of June 30, 2014* Only the current fiscal year is presented because 10-year data is not yet available.

103
Schedule of Funding Progress - Other Postemployment BenefitsJune 30, 2015 (Expressed in Thousands)
UnfundedAAL as a
Actuarial Actuarial Accrued Annual Percentage ofActuarial Value of Liability (AAL) Unfunded Percent Covered AnnualValuation Assets Entry Age AAL Funded Payroll Covered Payroll
Date (a) (b) (b – a) (a / b) (c) ( (b – a) / c)June 30, 2013 0 690,339 690,339 0.0% 4,425,943 15.6%June 30, 2014 0 762,358 762,358 0.0 4,406,047 17.3 June 30, 2015 0 732,127 732,127 0.0 4,617,302 15.9
Required Supplementary Information
Mississippi

(This page left blank intentionally)
104

Mississippi
105
Required Supplementary Information Supplementary Information

(This page left blank intentionally)
106

Mississippi
107
Enterprise funds account for the operations of the state that provide goods or services to the general public on a user charge basis.
Nonmajor Enterprise Funds Descriptions
Fair Commission - The Fair Commission Fund accounts for expenses of the Fair Commission’s operation of the coliseum, Dixie National Livestock Show and Industrial Showcase Building. Funding sources include gross receipts from the state fair, livestock show, Industrial Building and other events conducted at the coliseum and fairgrounds, as well as transfers from the General Fund.
Veterans’ Home Purchase Board - The Veterans’ Home Purchase Board Fund provides home mortgage loans to qualified Mississippi veterans and accounts for administrative expenses of the Veterans’ Home Purchase Board. Revenue is derived from interest earned on loans.
Department of Finance and Administration - The Office of Surplus Property Fund receives and maintains an inventory of surplus federal property and redistributes it to state agencies and departments, counties, municipalities and other eligible donees within the state. Fees are collected from the donees to offset operating costs.
Yellow Creek Inland Port Authority - The Yellow Creek Inland Port Authority Fund accounts for operations of a public port facility at the conjunction of the Tennessee River and Yellow Creek in Tishomingo County, Mississippi. All costs of operating this port are accounted for in this fund. Funding is provided by gross receipts from port operations, proceeds from other governments and investment income.
Department of Rehabilitation Services - The AbilityWorks Fund accounts for a statewide system of sheltered workshop facilities through which handicapped citizens receive work experience to prepare them for employment outside the AbilityWorks setting. Revenue is generated from the sale of goods and services and transfers from the rehabilitation services fund.
Department of Agriculture and Commerce - The Agriculture and Forestry Museum Fund accounts for operations of the museum. Revenue is generated from the sale of goods, ticket sales and rental income.
Department of Corrections - The Restaurants and Commissary Fund accounts for operations of two restaurants and a commissary at the state penitentiary. The restaurants are maintained for the convenience of Department of Corrections penitentiary employees. Profits from the commissary are used for the special benefit of the penitentiary’s residents. The
Prison Agricultural Enterprises Fund accounts for a farming operation. Revenue sources include proceeds from the sale of row crops and rental income from leased land.
Nonmajor Enterprise Funds

108
Combining Statement of Net PositionJune 30, 2015 (Expressed in Thousands)
AdministrationVeterans'
Home Office of Yellow CreekFair Purchase Surplus Inland Port
Commission Board Property AuthorityAssets Current assets: Equity in internal investment pool $ 1,054 $ 65,563 $ 856 $ Cash and cash equivalents 168 336 7,224 Receivables, net 117 544 123 Due from other funds 13 43 112 Due from other governments 82 Inventories Prepaid items 25 22 Loans and notes receivable 5,616 Total Current Assets 1,352 72,209 856 7,481 Noncurrent assets: Loans and notes receivable 152,847 607 Capital assets:
Land and construction in progress 840 226 100 2,819 Other capital assets, net 13,420 1,146 291 11,546
Total Noncurrent Assets 14,260 154,219 391 14,972 Total Assets 15,612 226,428 1,247 22,453
Deferred Outflow of Resources Pension 150 307 35 70
Liabilities Current liabilities: Warrants payable 50 1,166 51 Accounts payable and other liabilities 180 15 14 236 Due to other governments 4 174 Due to other funds 211 7 14 Deposits 1,908 Unearned revenues 53 8 Lease obligations payable Total Current Liabilities 494 3,104 83 410 Noncurrent liabilities: Due to other governments 11,920 Lease obligations payable Net pension liability 1,214 1,378 364 827 Other liabilities 73 62 28 23 Total Noncurrent Liabilities 1,287 1,440 392 12,770 Total Liabilities 1,781 4,544 475 13,180
Deferred Inflow of Resources 176 200 53 102 Pension
Net Position Net investment in capital assets 14,260 1,372 391 7,074 Unrestricted (455) 220,619 363 2,167 Total Net Position $ 13,805 $ 221,991 $ 754 $ 9,241
Nonmajor Enterprise Funds
Mississippi
Finance andDepartment of

109
Department of Department ofRehabilitation Agriculture
Services and Commerce
Agriculture Restaurants Prisonand Forestry and Agricultural
AbilityWorks Museum Commissary Enterprises Totals
$ $ 79 $ $ 1,746 $ 69,29814,237 4 703 22,672
3,689 608 5,0817,492 1 186 7,847
82195 44 309 548276 323
5,61625,889 127 1,312 2,241 111,467
153,454
1,690 5,6751,856 31 2,700 30,9903,546 31 2,700 190,119
25,889 3,673 1,343 4,941 301,586
1,490 61 61 2,174
1 82 1,3503,406 9 499 189 4,548
1783,717 1 789 4,739
1,90861
74 747,123 11 1,288 345 12,858
11,920197 197
8,642 680 680 13,78536 129 351
8,642 36 680 1,006 26,25315,765 47 1,968 1,351 39,111
1,253 98 99 1,981
3,546 31 2,428 29,10210,361 80 (693) 1,124 233,566
$ 10,361 $ 3,626 $ (662) $ 3,552 $ 262,668
Department of Corrections

110
Combining Statement of Revenues, Expenses, and Changes in Fund Net PositionFor the Year Ended June 30, 2015 (Expressed in Thousands)
Department ofFinance and
AdministrationVeterans'
Home Office of Yellow CreekFair Purchase Surplus Inland Port
Commission Board Property AuthorityOperating Revenues Charges for sales and services $ 4,247 $ $ 681 $ 943 Investment income 6,431 Rentals 47 838 Fees 183 Other 691 2 40 8 Total Operating Revenues 4,938 6,663 721 1,789
Operating Expenses Cost of sales and services 67 General and administrative 1,201 1,051 480 608 Contractual services 3,161 302 164 961 Commodities 299 41 17 97 Depreciation 453 42 60 670 Other 3 213 Total Operating Expenses 5,184 1,649 721 2,336
Operating Income (Loss) (246) 5,014 0 (547)
Nonoperating Revenues Investment income 715 6 21 Other 1 Total Nonoperating Revenues 0 715 6 22
Nonoperating Expenses Loss on disposal of capital assets 35 Interest Total Nonoperating Expenses 0 0 35 0 Income (Loss) before Capital Contributions and Transfers (246) 5,729 (29) (525)Transfers In 24Transfers Out (30) Change in Net Position (222) 5,699 (29) (525)Total Net Position - Beginning, as restated 14,027 216,292 783 9,766Total Net Position - Ending $ 13,805 $ 221,991 $ 754 $ 9,241
MississippiNonmajor Enterprise Funds

111
Department of Department ofRehabilitation Agriculture
Services and Commerce
Agriculture Restaurants Prisonand Forestry and Agricultural
AbilityWorks Museum Commissary Enterprises Totals
$ 9,047 $ 256 $ 7,620 $ 1,744 $ 24,5386,431
333 100 1,318183
308 1,0499,355 589 7,620 1,844 33,519
8,500 76 5,615 24 14,2827,537 489 385 374 12,1251,944 456 245 271 7,504
14 117 121 1,406 2,112138 206 1,569
21617,995 1,276 6,366 2,281 37,808
(8,640) (687) 1,254 (437) (4,289)
10 7521
10 0 0 0 753
28 3 16 821 11 12
0 29 3 27 94
(8,630) (716) 1,251 (464) (3,630)7,777 557 6 543 8,907
(1,222) (71) (1,323)(853) (159) 35 8 3,954
11,214 3,785 (697) 3,544 258,714$ 10,361 $ 3,626 $ (662) $ 3,552 $ 262,668
Department of Corrections

112
Combining Statement of Cash FlowsFor the Year Ended June 30, 2015 (Expressed in Thousands)
Department ofFinance and
AdministrationVeterans'
Home Office of Yellow CreekFair Purchase Surplus Inland Port
Commission Board Property AuthorityCash Flows from Operating Activities Cash receipts from customers $ 4,774 $ 195 $ 682 $ 1,740 Cash payments to suppliers for goods and services (3,341) (195) (136) (870) Cash payments to employees for services (1,234) (975) (487) (628) Other operating cash receipts 40 8 Other operating cash payments 2 Principal and interest received on program loans 28,315 Issuance of program loans (24,792) Net Cash Provided by (Used for) Operating Activities 199 2,550 99 250
Cash Flows from Noncapital Financing Activities Transfers in 23 Transfers out (30) Proceeds from other governments 688 Net Cash Provided by (Used for) Noncapital Financing Activities 23 (30) 0 688
Cash Flows from Capital and Related Financing Activities Acquisition and construction of capital assets (169) (19) (54) (675) Principal paid on bonds and capital assets Interest paid on bonds and capital assets Net Cash Used for Capital and Related Financing Activities (169) (19) (54) (675)
Cash Flows from Investing Activities Investment income 717 6 21 Net Cash Provided by Investing Activities 717 6 21
Net Change in Cash and Cash Equivalents 53 3,218 51 284
Cash and Cash Equivalents - Beginning 1,169 62,681 805 6,940
Cash and Cash Equivalents - Ending $ 1,222 $ 65,899 $ 856 $ 7,224
MississippiNonmajor Enterprise Funds

113
Department of Department ofRehabilitation Agriculture
Services and Commerce
Agriculture Restaurants Prisonand Forestry and Agricultural
AbilityWorks Museum Commissary Enterprises Totals
$ 12,748 $ 590 $ 7,588 $ 1,756 $ 30,073(8,690) (680) (5,717) (1,272) (20,901)(7,392) (479) (385) (460) (12,040)
308 3562
28,315(24,792)
(3,026) (569) 1,486 24 1,013
7,777 557 6 507 8,870(1,221) (71) (1,322)
688
7,777 557 (1,215) 436 8,236
(12) (47) (976)(72) (72)
(1) (11) (12)
(13) (130) (1,060)
10 75410 754
4,761 (25) 271 330 8,943
9,476 108 432 1,416 83,027
$ 14,237 $ 83 $ 703 $ 1,746 $ 91,970
(Continued on Next Page)
Department of Corrections

114
Combining Statement of Cash FlowsFor the Year Ended June 30, 2015 (Expressed in Thousands)
Department ofFinance and
AdministrationVeterans'
Home Office of Yellow CreekFair Purchase Surplus Inland Port
Commission Board Property AuthorityReconciliation of Operating Income (Loss) to Net Cash Provided by (Used for) Operating Activities Operating income (loss) $ (246) $ 5,014 $ $ (547)
Adjustments to reconcile operating income (loss) to net cash provided by (used for) operating activities: Depreciation 453 42 60 670 Change in assets and liabilities:
(Increase) decrease in assets:Receivables, net (96) 47 31Due from other governments (82)Due from other funds 17 (1) (73)Due from component unitsInventories 15Prepaid items 3 (2)Loans and notes receivable (3,124)
Increase (decrease) in liabilities:Warrants payable 27 260 25Accounts payable and other liabilities 67 348 (13) 200Due to other governments 4Due to other funds 113 (4) 13 (7)Unearned revenues (87) 8Pension cost (49) 39 (5) (22)
Total adjustments 445 (2,464) 99 797
Net Cash Provided by (Used for) Operating Activities $ 199 $ 2,550 $ 99 $ 250
Noncash Capital and Related Financing Activities Loss on disposal of capital assets 35
(Continued from Previous Page)
MississippiNonmajor Enterprise Funds

115
Department of Department ofRehabilitation Agriculture
Services and Commerce
Agriculture Restaurants Prisonand Forestry and Agricultural
AbilityWorks Museum Commissary Enterprises Totals
$ (8,640) $ (687) $ 1,254 $ (437) $ (4,289)
138 206 1,569
(213) (32) (263)(82)
3,905 (90) 3,7589 9
(22) (13) 253 2336 7
(3,124)
(2) 25 335313 (5) (106) 72 876
(1) 31,472 1 375 1,963
(79)144 (5) (5) 97
5,614 118 232 461 5,302
$ (3,026) $ (569) $ 1,486 $ 24 $ 1,013
28 3 16 82
Department of Corrections

(This page left blank intentionally)
116

Mississippi
117
Internal service funds account for the operations of state agencies that provide services or goods to other state agencies or governmental units on a cost reimbursement basis.
Internal Service Funds Descriptions
Personnel Board - The Personnel Board Fund accounts for the expenses of establishing personnel policies, regulating the pay of state employees, and validating new hires. Revenues consist of assessments charged to state agencies based on the number of authorized positions.
Information Technology Services - The Information Technology Services Fund accounts for the centralized data processing and information devices, expenses related to planning and policies for the development of data processing capabilities and for the State's central telephone system, the Universities' central telephone systems and other governmental units' telephone systems. Revenues consist of charges to user agencies, universities, and governmental units for services and equipment. Other revenue consists of commissions from the usage of public utility companies' pay telephones located on state properties.
Department of Finance and Administration - The Risk Management Fund accounts for resources and transactions pertaining to the State's self-insured medical plan and life insurance program as mandated by state law to be offered to state and public education employees. Funding is provided by premiums collected from active and retired employees, local school districts, and the State’s operating fund. This fund also accounts for unemployment benefits paid to eligible former state employees and for resources and transactions pertaining to the State's self-insured workers' compensation program. Funding is provided by premiums collected from the State's operating fund and participating state agencies. In addition, the fund accounts for resources and transactions pertaining to the State's self-insured tort claims program. Funding is provided by assessments of state agencies. Tort claims filed against state agencies and state employees are paid from this fund, as well as administrative expenses.
Internal Service Funds
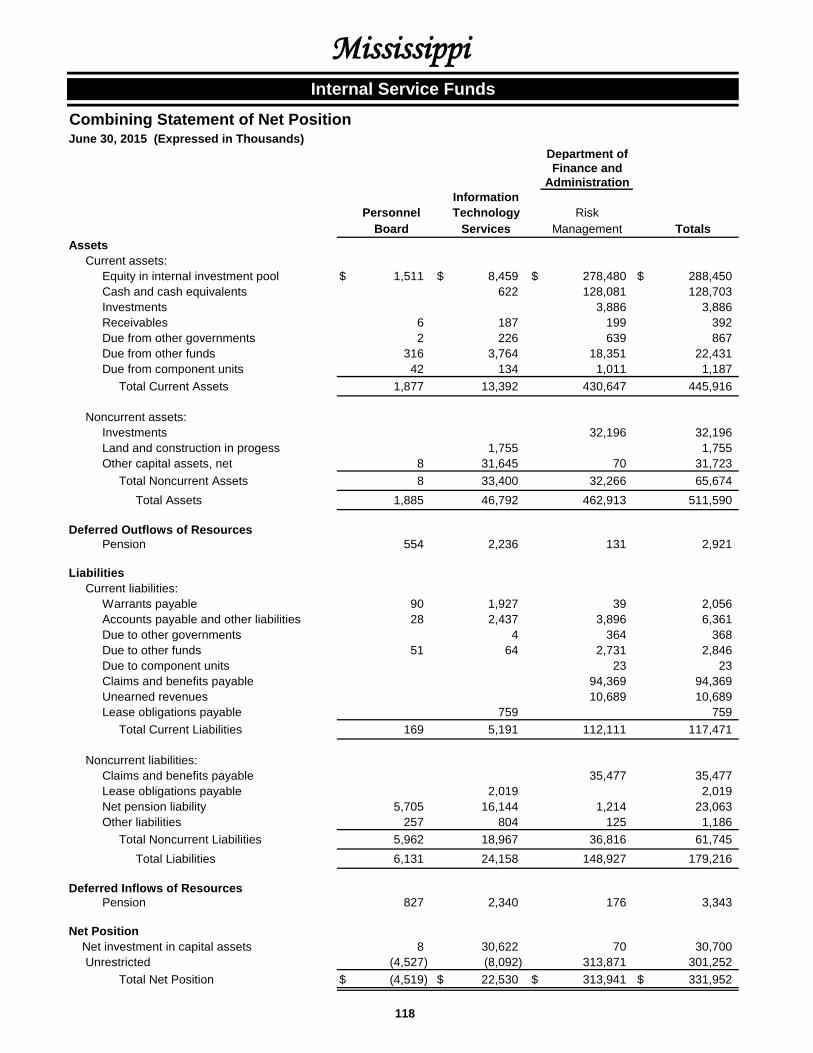
118
Combining Statement of Net PositionJune 30, 2015 (Expressed in Thousands)
Department ofFinance and
AdministrationInformation
Personnel Technology RiskBoard Services Management Totals
Assets Current assets: Equity in internal investment pool $ 1,511 $ 8,459 $ 278,480 $ 288,450 Cash and cash equivalents 622 128,081 128,703 Investments 3,886 3,886 Receivables 6 187 199 392 Due from other governments 2 226 639 867 Due from other funds 316 3,764 18,351 22,431 Due from component units 42 134 1,011 1,187
Total Current Assets 1,877 13,392 430,647 445,916
Noncurrent assets: Investments 32,196 32,196 Land and construction in progess 1,755 1,755 Other capital assets, net 8 31,645 70 31,723
Total Noncurrent Assets 8 33,400 32,266 65,674Total Assets 1,885 46,792 462,913 511,590
Deferred Outflows of Resources Pension 554 2,236 131 2,921
Liabilities Current liabilities: Warrants payable 90 1,927 39 2,056 Accounts payable and other liabilities 28 2,437 3,896 6,361 Due to other governments 4 364 368 Due to other funds 51 64 2,731 2,846 Due to component units 23 23 Claims and benefits payable 94,369 94,369 Unearned revenues 10,689 10,689 Lease obligations payable 759 759
Total Current Liabilities 169 5,191 112,111 117,471
Noncurrent liabilities: Claims and benefits payable 35,477 35,477 Lease obligations payable 2,019 2,019 Net pension liability 5,705 16,144 1,214 23,063 Other liabilities 257 804 125 1,186
Total Noncurrent Liabilities 5,962 18,967 36,816 61,745Total Liabilities 6,131 24,158 148,927 179,216
Deferred Inflows of Resources Pension 827 2,340 176 3,343
Net Position Net investment in capital assets 8 30,622 70 30,700 Unrestricted (4,527) (8,092) 313,871 301,252
Total Net Position $ (4,519) $ 22,530 $ 313,941 $ 331,952
Internal Service Funds
Mississippi

119
Combining Statement of Revenues, Expenses, and Changes in Fund Net PositionFor the Year Ended June 30, 2015 (Expressed in Thousands)
Department ofFinance and
AdministrationInformation
Personnel Technology RiskBoard Services Management Totals
Operating Revenues Charges for sales and services/premiums $ 5,383 $ 41,933 $ 755,634 $ 802,950 Other 15 13 28
Total Operating Revenues 5,383 41,948 755,647 802,978
Operating Expenses General and administrative 3,879 10,636 1,658 16,173 Contractual services 1,201 28,177 33,635 63,013 Commodities 97 468 36 601 Depreciation 9 2,959 3 2,971 Claims and benefits 685,108 685,108
Total Operating Expenses 5,186 42,240 720,440 767,866Operating Income (loss) 197 (292) 35,207 35,112
Nonoperating Revenues Investment income 4,196 4,196
Total Nonoperating Revenues 4,196 4,196
Nonoperating Expenses Loss on disposal of assets 1 1 Interest 52 52
Total Nonoperating Expenses 53 53Income (loss) before Capital Contributions
and Transfers 197 (345) 39,403 39,255Capital Contributions 562 562Transfers In 18 200 986 1,204Transfers Out (1,190) (1,190)
Change in Net Position 215 417 39,199 39,831Total Net Position - Beginning, as restated (4,734) 22,113 274,742 292,121Total Net Position - Ending $ (4,519) $ 22,530 $ 313,941 $ 331,952
Internal Service Funds
Mississippi

120
Combining Statement of Cash FlowsFor the Year Ended June 30, 2015 (Expressed in Thousands)
Department ofFinance and
AdministrationInformation
Personnel Technology RiskBoard Services Management Totals
Cash Flows from Operating Activities Cash receipts/premiums from interfund services provided $ 5,333 $ 38,148 $ 189,192 $ 232,673 Cash receipts/premiums from customers (160) 4,149 563,029 567,018 Cash payments to suppliers for goods and services (1,282) (26,078) (32,848) (60,208) Cash payments to employees for services (3,904) (10,549) (1,681) (16,134) Cash payments for claims and benefits (704,414) (704,414) Other operating cash receipts 15 15 Net Cash Provided by (Used for) (13) 5,685 13,278 18,950 Operating Activities
Cash Flows from Noncapital Financing Activities Transfers in 18 200 986 1,204 Transfers out (1,190) (1,190) Net Cash Provided by (Used for) Noncapital Financing Activities 18 200 (204) 14
Cash Flows from Capital and Related Financing Activities Acquisition and construction of capital assets (8) (30) (38) Principal paid on capital assets contracts (828) (828) Interest paid on capital assets contracts (51) (51) Net Cash used for Capital and Related Financing Activities (887) (30) (917)
Cash Flows from Investing Activities Proceeds from sales of investments 18,440 18,440 Purchases of investments (17,733) (17,733) Investment income 4,332 4,332
Net Cash Provided by Investing Activities 5,039 5,039
Net Change in Cash and Cash Equivalents 5 4,998 18,083 23,086 Cash and Cash Equivalents - Beginning 1,506 4,083 388,478 394,067 Cash and Cash Equivalents - Ending $ 1,511 $ 9,081 $ 406,561 $ 417,153
MississippiInternal Service Funds
(Continued on Next Page)

121
Combining Statement of Cash FlowsFor the Year Ended June 30, 2015 (Expressed in Thousands)
Department ofFinance and
AdministrationInformation
Personnel Technology RiskBoard Services Management Totals
Reconciliation of Operating Income (Loss) to Net Cash Provided by (Used for) Operating Activities Operating income (loss) $ 197 $ (292) $ 35,207 $ 35,112
Adjustments to reconcile operating income (loss) to net cash provided by (used for) operating activities: Depreciation 9 2,959 3 2,971 Changes in assets and liabilities: (Increase) decrease in assets:
Accounts receivable 1 (153) (3) (155)Due from other governments 54 (288) (234)Due from other funds (175) 419 1,425 1,669Due from component units (38) 45 (320) (313)
Increase (decrease) in liabilities:Warrants payable 28 1,739 (44) 1,723Accounts payable and other liabilities (7) 895 (300) 588Due to other governments 1 14 15Due to other funds 51 7 1,024 1,082Due to component units (34) (34)Claims and benefits payable (19,138) (19,138)Unearned revenues (4,238) (4,238)Pension cost (79) 11 (30) (98)
Total adjustments (210) 5,977 (21,929) (16,162) Net Cash Provided by (Used for) Operating Activities $ (13) $ 5,685 $ 13,278 $ 18,950
Noncash Capital and Related Financing and Investing Activities Capital contributions 562 562 Loss on disposal of capital assets 1 1 Change in market value of investments (1,042) (1,042)
Internal Service Funds
(Continued from Previous Page)
Mississippi

(This page left blank intentionally)
122

Mississippi
123
Fiduciary funds account for assets held in a trustee or agency capacity for others and cannot be used to support government’s own programs.
Fiduciary Funds Descriptions
Pension Trust Funds
Public Employees’ Retirement System - The Public Employees’ Retirement System Fund provides retirement and disability benefits to substantially all employees of the state and its political subdivisions. Benefits are funded by contributions
from the members, the state and political subdivisions and by investment income. The Mississippi Highway Safety Patrol
Retirement System Fund provides retirement and disability benefits to sworn officers of the Department of Public Safety.
Benefits are funded by contributions from the members and the state and by investment income. The Municipal Retirement
Systems Fund provides retirement and disability benefits to employees, firefighters and police officers of participating municipalities. Benefits are funded by contributions from the members and the municipalities and by investment income. The
Supplemental Legislative Retirement Plan Fund provides retirement and disability benefits supplemental to the benefits of the Public Employees’ Retirement System to all elected members of the legislature and the president of the senate. Benefits
are funded by contributions from the members and the state and by investment income. The Deferred Compensation Plan
Fund accounts for deposits of gross compensation deferred by employees of the state and its political subdivisions. Political subdivisions may make contributions on behalf of their employees. Deposits are invested until retirement, severance from public service, death or extreme hardship of the individual participants.
Agency Funds
The Local Government Distributive Fund serves as a clearing mechanism for funds distributed to the various counties and
municipalities of the state. The Program Fund accounts for receipt of various taxes, refundable deposits, inventories, and other monies collected or recovered to be held until the state has the right or obligation to distribute them to state operating
funds or to various entities or individuals. The Institutional Fund accounts for deposits to various institutional accounts and other receipts held by the state until there is proper authorization to disburse them directly to others.
Fiduciary Funds

124
Combining Statement of Fiduciary Net PositionJune 30, 2015 (Expressed in Thousands)
MississippiPublic Highway
Employees' Safety Patrol MunicipalRetirement Retirement Retirement
System System SystemsAssets Equity in internal investment pool $ 3,152 $ $ Cash and cash equivalents 836,095 10,884 5,729 Investments, at fair value: Short-term investments 478,739 6,234 3,282 Long-term debt securities 4,593,816 59,824 31,491 Equity securities 15,411,951 200,706 105,652 Private equity 1,329,697 17,316 9,115 Real estate investments 2,423,028 31,554 16,611 Securities lending:
Short-term investments 225,851 2,951 1,553 Long-term debt securities 2,477,064 32,361 17,035
Receivables: Employer contributions 67,813 169 Employee contributions 38,466 3 Investment proceeds 1,607,200 20,930 11,018 Interest and dividends 79,136 1,031 542 Other 857 647 21 Due from other funds 3 Capital assets: Land and construction in progress 18,998 Other capital assets, net 13,294
Total Assets 29,605,160 384,438 202,221
Liabilities Warrants payable 334 Accounts payable and accruals 1,994,994 25,915 13,642 Due to other funds 14 3 Obligations under securities lending 2,703,262 35,316 18,590
Total Liabilities 4,698,604 61,231 32,235
Net Position Net position restricted for pensions $ 24,906,556 $ 323,207 $ 169,986
Pension Trust Funds
Mississippi
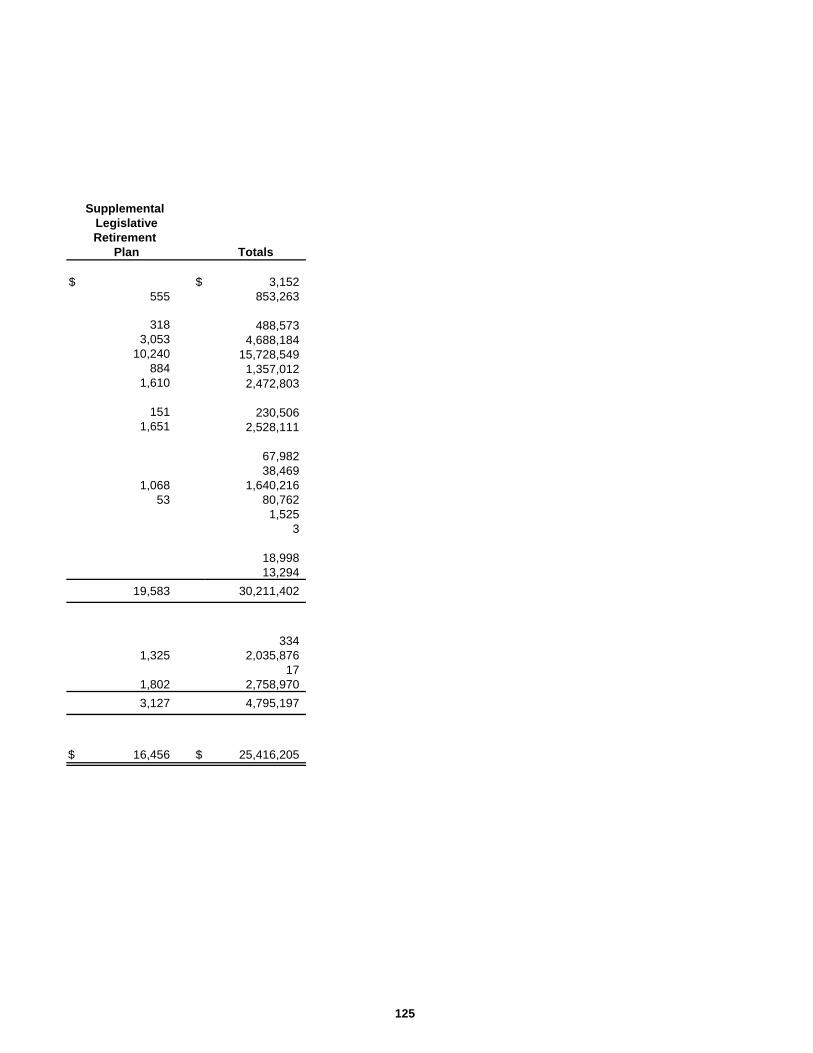
125
Supplemental LegislativeRetirement
Plan Totals
$ $ 3,152555 853,263
318 488,5733,053 4,688,184
10,240 15,728,549884 1,357,012
1,610 2,472,803
151 230,5061,651 2,528,111
67,98238,469
1,068 1,640,21653 80,762
1,5253
18,99813,294
19,583 30,211,402
3341,325 2,035,876
171,802 2,758,9703,127 4,795,197
$ 16,456 $ 25,416,205

126
Combining Statement of Changes in Fiduciary Net PositionFor the Year Ended June 30, 2015 (Expressed in Thousands)
MississippiPublic Highway
Employees' Safety Patrol MunicipalRetirement Retirement Retirement
System System SystemsAdditions Contributions: Employer $ 996,478 $ 13,695 $ 19,344 Employee 557,909 1,938 45
Total Contributions 1,554,387 15,633 19,389 Net Investment Income: Net change in fair value of investments 355,435 4,644 2,444 Interest and dividends 545,819 7,131 3,754 Securities lending:
Income from securities lending 16,066 209 111Interest expense and trading
costs from securities lending (2,565) (34) (18) Managers' fees and trading costs (87,089) (1,138) (599)
Net Investment Income 827,666 10,812 5,692 Other Additions: Administrative fees 595 Other 75
Total Other Additions 670
Total Additions 2,382,723 26,445 25,081
Deductions Retirement annuities 2,219,240 28,909 34,799 Refunds to terminated employees 119,356 163 1 Administrative expenses 14,119 198 387 Depreciation 571
Total Deductions 2,353,286 29,270 35,187
Change in Net Position 29,437 (2,825) (10,106)
Net Position - Beginning 24,877,119 326,032 180,092
Net Position - Ending $ 24,906,556 $ 323,207 $ 169,986
Pension Trust Funds
Mississippi

127
SupplementalLegislativeRetirement
Plan Totals
$ 511 $ 1,030,028207 560,099718 1,590,127
237 362,760364 557,068
11 16,397
(2) (2,619)(58) (88,884)552 844,722
59575
670
1,270 2,435,519
1,220 2,284,16837 119,55710 14,714
5711,267 2,419,010
3 16,509
16,453 25,399,696
$ 16,456 $ 25,416,205

128
Combining Statement of Fiduciary Net PositionJune 30, 2015 (Expressed in Thousands)
LocalGovernmentDistributive Program Institutional Totals
Assets Equity in internal investment pool $ 3,028 $ 6,632 $ $ 9,660 Cash and cash equivalents 413 74,398 6,696 81,507 Receivables, net: Accounts 369 22 391
Total Assets $ 3,810 $ 81,030 $ 6,718 $ 91,558
Liabilities Warrants payable $ 236 $ $ $ 236 Accounts payable and accruals 2 295 1,527 1,824 Due to other governments 1,306 51 1,357 Amounts held in custody for others 2,266 80,684 5,191 88,141
Total Liabilities $ 3,810 $ 81,030 $ 6,718 $ 91,558
Agency Funds
Mississippi

129
Combining Statement of Changes in Assets and LiabilitiesFor the Year Ended June 30, 2015 (Expressed in Thousands)
AssetsEquity inInternal Cash
Investment and Cash Commodity TotalFund Pool Equivalents Receivables Inventory AssetsLocal Government Distributive: Balance - Beginning $ 3,023 $ 187 $ 422 $ $ 3,632 Additions 35,034 226 745 36,005 Deductions 35,029 798 35,827 Balance - Ending 3,028 413 369 3,810
Program: Balance - Beginning 6,467 54,673 1,229 62,369 Additions 4,542 132,296 19,746 156,584 Deductions 4,377 112,571 20,975 137,923 Balance - Ending 6,632 74,398 0 81,030
Institutional: Balance - Beginning 6,702 105 6,807 Additions 19,752 49 19,801 Deductions 19,758 132 19,890 Balance - Ending 6,696 22 6,718
Total - All Agency Funds: Balance - Beginning 9,490 61,562 527 1,229 72,808 Additions 39,665 152,274 794 19,746 212,479 Deductions 39,495 132,329 930 20,975 193,729 Balance - Ending $ 9,660 $ 81,507 $ 391 $ 0 $ 91,558
LiabilitiesAccounts Amounts Held
Warrants Payable Due to Other In Custody Total Payable and Accruals Governments for Others Liabilities
Local Government Distributive: Balance - Beginning $ 168 $ $ 1,137 $ 2,327 $ 3,632 Additions 24,015 261 4,876 6,942 36,094 Deductions 23,947 259 4,707 7,003 35,916 Balance - Ending 236 2 1,306 2,266 3,810
Program: Balance - Beginning 166 67 1 62,135 62,369 Additions 3,735 643 102 152,104 156,584 Deductions 3,901 415 52 133,555 137,923 Balance - Ending 0 295 51 80,684 81,030
Institutional: Balance - Beginning 1,506 5,301 6,807 Additions 658 19,143 19,801 Deductions 637 19,253 19,890 Balance - Ending 1,527 5,191 6,718
Total - All Agency Funds: Balance - Beginning 334 1,573 1,138 69,763 72,808 Additions 27,750 1,562 4,978 178,189 212,479 Deductions 27,848 1,311 4,759 159,811 193,729 Balance - Ending $ 236 $ 1,824 $ 1,357 $ 88,141 $ 91,558
MississippiAgency Funds

(This page left blank intentionally)
130

Mississippi
131
Component Units are organizations which are legally separate from the state for which the State is financially accountable.
Nonmajor Component Units Descriptions
Mississippi Business Finance Corporation - The corporation coordinates and oversees the delivery of services to small business communities of Mississippi.
Mississippi Coast Coliseum Commission - The commission accounts for the promoting, developing, maintenance and operation of a multi-purpose coliseum and related facilities located in Harrison County, Mississippi.
Mississippi Development Bank - The bank fosters and promotes the provision of adequate markets and facilities for the borrowing of funds for public purposes by governmental units.
Mississippi Prison Industries Corporation - The corporation is engaged in the manufacture of cloth related items, printing of forms, periodicals and manuals, and providing service work for manufacturers. Revenue is generated from the charges for goods and services.
Pat Harrison Waterway District - The district accounts for resources used to bring about the full beneficial use of surface and overflow waters of the Pascagoula River Basin.
Pearl River Basin Development District - The district accounts for resources used to preserve, conserve, store and regulate the waters of the Pearl River and its tributaries and their overflows.
Pearl River Valley Water Supply District - The district accounts for the operation and maintenance of the Ross Barnett Reservoir and surrounding lands, to provide water supply, flood reduction and recreational opportunities.
Tombigbee River Valley Water Management District - The district accounts for the development and conservation of the human and natural resources of Mississippi counties in which the Tombigbee River or any of its tributaries lie.
Nonmajor Component Units

132
Combining Statement of Net PositionJune 30, 2015 (Expressed in Thousands)
Mississippi MississippiBusiness Coast MississippiFinance Coliseum Development
Corporation Commission BankAssets Current assets: Equity in internal investment pool $ 2,030 $ $ Cash and cash equivalents 998 1,556 469 Investments 13,511 1,629 2,499 Receivables, net 70 599 9 Due from other governments Due from primary government Inventories Prepaid items 169 Other assets
Total Current Assets 16,609 3,953 2,977 Noncurrent assets: Restricted assets:
Cash and cash equivalents 1,990Investments 7,000
Capital assets:Land and construction in progress 4,947Other capital assets, net 15 109,047 1Total Noncurrent Assets 15 120,994 1,991
Total Assets 16,624 124,947 4,968 Deferred Outflows of Resources Pension 75 233
Liabilities Current liabilities: Accounts payable and other liabilities 60 457 Due to primary government Deposits 534 Unearned revenues 18 Lease obligations payable
Total Current Liabilities 60 1,009 Noncurrent liabilities: Lease obligations payable Net pension liability 850 2,618 Other liabilities 60
Total Noncurrent Liabilities 910 2,618
Total Liabilities 970 3,627 Deferred Inflows of Resources Pension 99 380
Net Position Net investment in capital assets 15 113,994 1 Restricted for: Debt service 1,990 Other purposes Permanent endowments:
Nonexpendable 7,000 Unrestricted 15,615 179 2,977
Total Net Position $ 15,630 $ 121,173 $ 4,968
Nonmajor Component Units
Mississippi
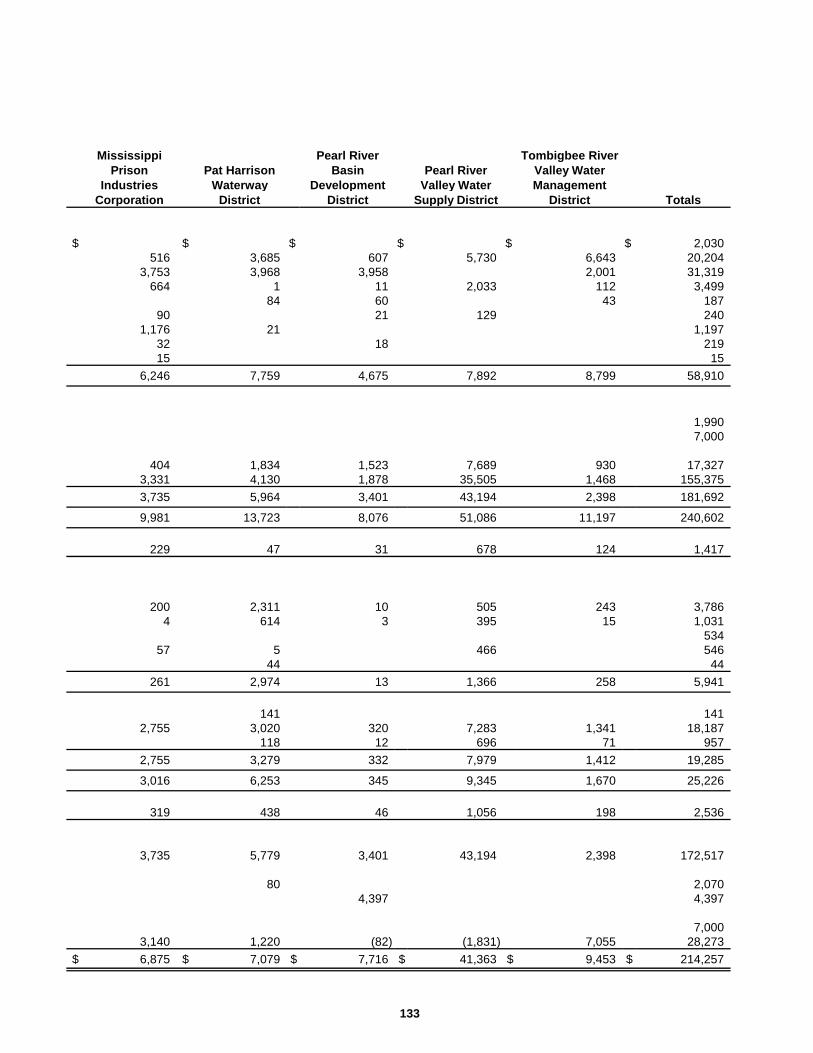
133
Mississippi Pearl River Tombigbee RiverPrison Pat Harrison Basin Pearl River Valley Water
Industries Waterway Development Valley Water ManagementCorporation District District Supply District District Totals
$ $ $ $ $ $ 2,030516 3,685 607 5,730 6,643 20,204
3,753 3,968 3,958 2,001 31,319664 1 11 2,033 112 3,499
84 60 43 18790 21 129 240
1,176 21 1,19732 18 21915 15
6,246 7,759 4,675 7,892 8,799 58,910
1,9907,000
404 1,834 1,523 7,689 930 17,3273,331 4,130 1,878 35,505 1,468 155,3753,735 5,964 3,401 43,194 2,398 181,692
9,981 13,723 8,076 51,086 11,197 240,602
229 47 31 678 124 1,417
200 2,311 10 505 243 3,7864 614 3 395 15 1,031
53457 5 466 546
44 44261 2,974 13 1,366 258 5,941
141 1412,755 3,020 320 7,283 1,341 18,187
118 12 696 71 9572,755 3,279 332 7,979 1,412 19,285
3,016 6,253 345 9,345 1,670 25,226
319 438 46 1,056 198 2,536
3,735 5,779 3,401 43,194 2,398 172,517
80 2,0704,397 4,397
7,0003,140 1,220 (82) (1,831) 7,055 28,273
$ 6,875 $ 7,079 $ 7,716 $ 41,363 $ 9,453 $ 214,257

134
Combining Statement of Activities
Charges Operating Capital Netfor Grants and Grants and (Expense)
Functions/Programs Expenses Services Contributions Contributions Revenue
Mississippi Business Finance Corporation $ 1,110 $ 631 $ $ $ (479)Mississippi Coast Coliseum Commission 9,077 5,830 120 (3,127)Mississippi Development Bank 426 179 (247)Mississippi Prison Industries Corporation 6,653 6,705 52Pat Harrison Waterway District 5,582 3,011 2,156 (415)Pearl River Basin Development District 778 103 (675)Pearl River Valley Water Supply District 13,266 12,971 2,256 1,961Tombigbee River Valley Water Management District 1,906 347 (1,559)
Total $ 38,798 $ 29,777 $ 2,276 $ 2,256 $ (4,489)
Nonmajor Component Units
Program Revenues
Mississippi
For the Year Ended June 30, 2015 (Expressed in Thousands)

135
NetPosition - Net
Investment Change in Beginning, Position -Income Other Net Position as restated Ending
$ 266 $ 300 $ 87 $ 15,543 $ 15,630266 (2,861) 124,034 121,173
48 (199) 5,167 4,9682 4 58 6,817 6,875
10 (405) 7,484 7,07913 773 111 7,605 7,716
1 1,962 39,401 41,363
9 1,590 40 9,413 9,453
$ 615 $ 2,667 $ (1,207) $ 215,464 $ 214,257
General Revenues

(This page left blank intentionally)
136

137
Mississippi
The Statistical Section provides additional historical perspective, context, and detail to assist financial statement users in understanding the State of Mississippi’s overall financial health. Financial Trends These tables contain trend information to help users in understanding how the State’s financial position has changed over time. Table 1 – Net Position by Component ................................................................................................................................ 138 Table 2 – Changes in Net Position ..................................................................................................................................... 140 Table 3 – Fund Balances of Governmental Funds ............................................................................................................. 144 Table 4 – Changes in Fund Balances of Governmental Funds .......................................................................................... 146 Revenue Capacity These tables contain information to help users in understanding and assessing the factors affecting the State’s ability to generate its sales tax revenues. Table 5 – Taxable Sales by Industry .................................................................................................................................. 150 Table 6 – Sales Tax Revenue Payers by Industry .............................................................................................................. 152 Debt Capacity These tables present information to help users assess the affordability of the State’s current levels of outstanding debt and the State’s ability to issue additional debt in the future. Table 7 – Ratios of Outstanding Debt by Type ................................................................................................................... 154 Table 8 – Legal Debt Margin .............................................................................................................................................. 156 Demographic and Economic Information These tables offer demographic and economic indicators to help users understand the environment within which the State’s financial activities take place. Table 9 – Demographic and Economic Statistics ............................................................................................................. 157 Table 10 – Employment by Industry ................................................................................................................................... 157 Table 11 – Public School Enrollment .................................................................................................................................. 158 Table 12 – Community and Junior College Enrollment ....................................................................................................... 158 Table 13 – University Enrollment ........................................................................................................................................ 158 Operating Information These tables contain information about the State’s operations and resources to help users understand how the State’s financial information relates to the services the State provides and the activities it performs. Table 14 – Capital Asset Statistics by Function .................................................................................................................. 160 Table 15 – State Government Employees by Function ...................................................................................................... 162 Table 16 – Operating Indicators by Function ...................................................................................................................... 164
Statistical Section

138
Last Ten Fiscal Years Table 1Accrual Basis of Accounting (Expressed in Thousands)
2015 2014 2013 2012Governmental activitiesNet investment in capital assets $ 13,900,211 $ 13,430,397 $ 13,107,678 $ 12,667,849Restricted 3,869,799 3,633,805 3,602,589 3,615,270Unrestricted (6,005,860) (3,035,755) (3,188,135) (3,132,568)
Total governmental activities net position $ 11,764,150 $ 14,028,447 $ 13,522,132 $ 13,150,551
Business-type activitiesNet investment in capital assets $ 393,507 $ 297,830 $ 265,837 $ 209,497Restricted 646,868 602,831 578,710 540,875Unrestricted 181,529 212,462 253,732 228,423
Total business-type activities net position $ 1,221,904 $ 1,113,123 $ 1,098,279 $ 978,795
Primary GovernmentNet investment in capital assets $ 14,293,718 $ 13,728,227 $ 13,373,515 $ 12,877,346Restricted 4,516,667 4,236,636 4,181,299 4,156,145Unrestricted (5,824,331) (2,823,293) (2,934,403) (2,904,145)
Total primary government net position $ 12,986,054 $ 15,141,570 $ 14,620,411 $ 14,129,346
MississippiNet Position by Component
Note: This table has been restated for prior period adjustments, if practical. Complete information necessary to fully restate fiscal year 2014 for the implementation of GASB Statement 68 was not available.

139
2011 2010 2009 2008 2007 2006
$ 11,845,579 $ 11,408,744 $ 10,980,353 $ 10,642,484 $ 9,770,760 $ 8,883,4103,480,202 655,192 625,174 667,456 477,321 427,128
(2,680,509) (267,768) (336,905) 29,649 575,042 159,530$ 12,645,272 $ 11,796,168 $ 11,268,622 $ 11,339,589 $ 10,823,123 $ 9,470,068
$ 216,682 $ 208,101 $ 195,171 $ 161,144 $ 136,836 $ 112,393433,703 433,216 614,988 778,010 784,367 789,759250,052 202,455 192,005 209,175 243,751 209,745
$ 900,437 $ 843,772 $ 1,002,164 $ 1,148,329 $ 1,164,954 $ 1,111,897
$ 12,062,261 $ 11,616,845 $ 11,175,524 $ 10,803,628 $ 9,907,596 $ 8,995,8033,913,905 1,088,408 1,240,162 1,445,466 1,261,688 1,216,887
(2,430,457) (65,313) (144,900) 238,824 818,793 369,275$ 13,545,709 $ 12,639,940 $ 12,270,786 $ 12,487,918 $ 11,988,077 $ 10,581,965

140
Last Ten Fiscal Years Table 2Accrual Basis of Accounting (Expressed in Thousands)
2015 2014 2013 2012ExpensesGovernmental activities:
General government $ 2,951,973 $ 2,069,107 $ 2,028,155 $ 1,959,116Education 3,383,767 3,996,554 3,912,889 4,126,252Health and social services1 7,679,895 7,394,045 7,372,085 7,074,781Law, justice and public safety 967,422 923,952 983,870 878,668
Recreation and resources development2 556,790 637,850 587,367 722,713Regulation of business and professions 40,760 39,174 39,703 37,578Transportation 675,713 647,532 596,160 555,955Interest on long-term debt 225,512 243,099 247,012 257,304
Total governmental activities expenses 16,481,832 15,951,313 15,767,241 15,612,367Business-type activities:
Unemployment compensation3 109,468 204,206 338,390 408,399Port Authority at Gulfport 26,202 25,688 28,589 51,950Prepaid affordable college tuition 27,122 103,134 41,278 56,568Other business-type 37,902 37,379 35,421 47,009
Total business-type activities expenses 200,694 370,407 443,678 563,926Total primary government expenses $ 16,682,526 $ 16,321,720 $ 16,210,919 $ 16,176,293
Program RevenuesGovernmental activities:
Charges for services:General government $ 1,292,467 $ 1,310,188 $ 1,305,202 $ 1,226,107Education 15,082 23,989 24,539 37,491Health and social services 705,199 583,738 620,930 659,245Law, justice and public safety 125,231 126,054 118,797 102,689Recreation and resources development 73,478 79,287 98,496 90,643Regulation of business and professions 44,456 43,764 44,138 42,229Transportation 69,386 49,841 34,819 32,865
Operating grants and contributions4 7,059,002 6,796,079 6,934,753 7,038,237Capital grants and contributions 487,083 548,283 561,283 612,734
Total governmental activities program revenues 9,871,384 9,561,223 9,742,957 9,842,240Business-type activities:
Charges for services:Unemployment compensation5 137,525 158,741 202,715 274,063Port Authority at Gulfport 15,045 15,603 15,050 15,140Prepaid affordable college tuition 13,220 6,370 12,786 22,458Other business-type 27,046 28,563 28,016 27,738
Operating grants and contributions6 3,065 57,162 161,613 244,325Capital grants and contributions 33 904 246
Total business-type activities program revenues 195,901 266,472 421,084 583,970Total primary government program revenues $ 10,067,285 $ 9,827,695 $ 10,164,041 $ 10,426,210
Net (Expense) RevenueGovernmental activities $ (6,610,448) $ (6,390,090) $ (6,024,284) $ (5,770,127)Business-type activities (4,793) (103,935) (22,594) 20,044
Total primary government net expense $ (6,615,241) $ (6,494,025) $ (6,046,878) $ (5,750,083)
MississippiChanges in Net Position

141
2011 2010 2009 2008 2007 2006
$ 1,881,692 $ 2,011,806 $ 2,052,954 $ 2,000,778 $ 1,803,339 $ 1,826,9954,138,774 4,082,117 4,093,018 4,163,587 3,961,573 3,668,3146,873,932 6,747,426 6,139,808 5,609,247 5,311,270 5,180,1531,013,451 1,095,181 1,052,434 1,173,359 1,152,359 1,384,2381,008,883 1,058,604 1,127,670 1,261,268 1,932,646 364,796
37,457 38,188 37,215 36,318 33,192 30,944600,224 689,802 683,663 643,867 581,446 728,716223,856 146,732 209,516 196,277 167,233 150,556
15,778,269 15,869,856 15,396,278 15,084,701 14,943,058 13,334,712
520,790 669,679 422,764 143,013 143,348 242,13430,276 23,243 15,239 12,614 10,349 17,22145,754 42,183 20,316 40,972 38,391 29,98340,702 38,074 40,392 34,204 37,559 49,737
637,522 773,179 498,711 230,803 229,647 339,075$ 16,415,791 $ 16,643,035 $ 15,894,989 $ 15,315,504 $ 15,172,705 $ 13,673,787
$ 1,183,632 $ 1,214,243 $ 1,149,464 $ 1,135,546 $ 1,059,532 $ 944,74436,151 51,848 29,721 27,838 33,991 29,784
622,266 569,685 563,917 507,876 480,944 446,315101,992 99,098 103,178 100,206 147,360 81,807132,401 145,988 84,984 85,610 69,949 64,182
43,005 41,644 40,727 39,491 36,173 28,22336,335 7,787 51,695 40,243 35,192 26,762
7,896,876 7,795,111 6,847,036 6,462,823 7,125,688 6,058,258603,098 643,843 556,571 795,572 960,369 792,929
10,655,756 10,569,247 9,427,293 9,195,205 9,949,198 8,473,004
209,318 84,916 90,301 100,840 106,256 104,54827,807 14,652 16,865 22,569 30,166 7,60921,764 21,799 19,374 21,121 21,343 21,51339,319 36,811 38,532 33,522 37,083 40,644
310,704 382,141 141,038 10,069 9,745 93,15616 24 954 1,838 3,900 539
608,928 540,343 307,064 189,959 208,493 268,009$ 11,264,684 $ 11,109,590 $ 9,734,357 $ 9,385,164 $ 10,157,691 $ 8,741,013
$ (5,122,513) $ (5,300,609) $ (5,968,985) $ (5,889,496) $ (4,993,860) $ (4,861,708)(28,594) (232,836) (191,647) (40,844) (21,154) (71,066)
$ (5,151,107) $ (5,533,445) $ (6,160,632) $ (5,930,340) $ (5,015,014) $ (4,932,774)
(Continued on Next Page)
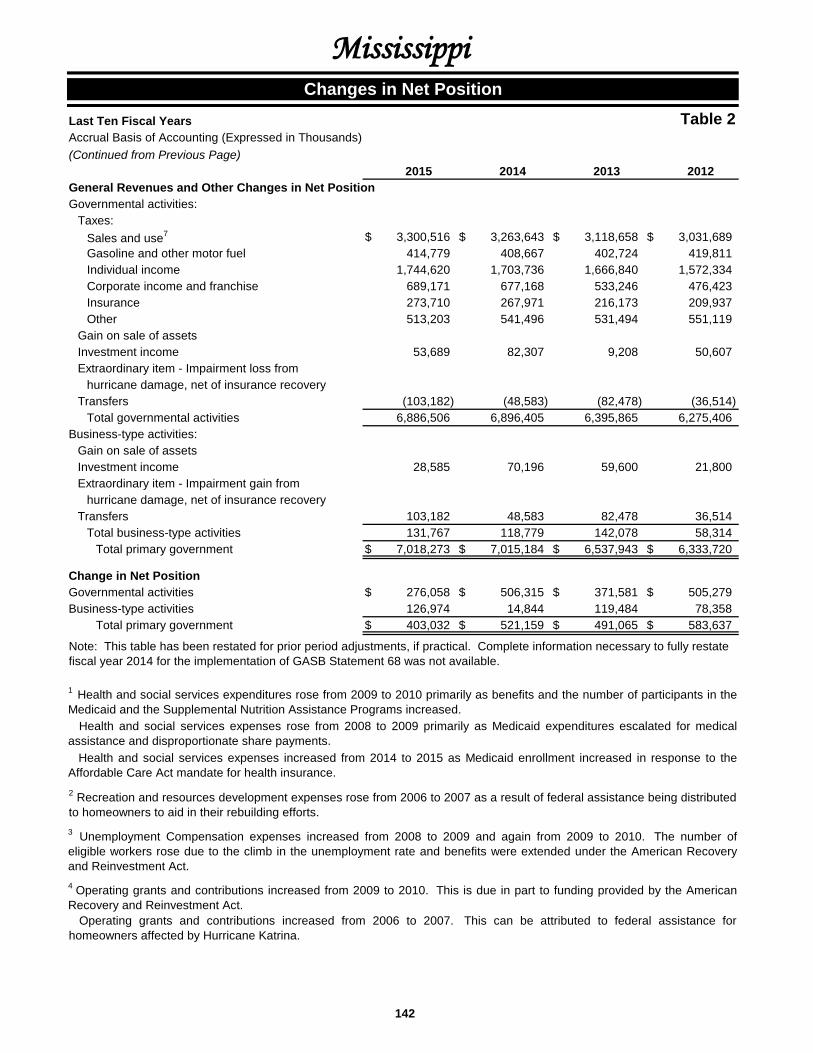
142
Last Ten Fiscal Years Table 2Accrual Basis of Accounting (Expressed in Thousands)
MississippiChanges in Net Position
(Continued from Previous Page)2015 2014 2013 2012
General Revenues and Other Changes in Net PositionGovernmental activities:
Taxes:Sales and use7 $ 3,300,516 $ 3,263,643 $ 3,118,658 $ 3,031,689Gasoline and other motor fuel 414,779 408,667 402,724 419,811Individual income 1,744,620 1,703,736 1,666,840 1,572,334Corporate income and franchise 689,171 677,168 533,246 476,423Insurance 273,710 267,971 216,173 209,937Other 513,203 541,496 531,494 551,119
Gain on sale of assetsInvestment income 53,689 82,307 9,208 50,607Extraordinary item - Impairment loss from
hurricane damage, net of insurance recoveryTransfers (103,182) (48,583) (82,478) (36,514)
Total governmental activities 6,886,506 6,896,405 6,395,865 6,275,406Business-type activities:
Gain on sale of assetsInvestment income 28,585 70,196 59,600 21,800Extraordinary item - Impairment gain from
hurricane damage, net of insurance recoveryTransfers 103,182 48,583 82,478 36,514
Total business-type activities 131,767 118,779 142,078 58,314Total primary government $ 7,018,273 $ 7,015,184 $ 6,537,943 $ 6,333,720
Change in Net PositionGovernmental activities $ 276,058 $ 506,315 $ 371,581 $ 505,279Business-type activities 126,974 14,844 119,484 78,358
Total primary government $ 403,032 $ 521,159 $ 491,065 $ 583,637
Operating grants and contributions increased from 2006 to 2007. This can be attributed to federal assistance forhomeowners affected by Hurricane Katrina.
1 Health and social services expenditures rose from 2009 to 2010 primarily as benefits and the number of participants in theMedicaid and the Supplemental Nutrition Assistance Programs increased.
2 Recreation and resources development expenses rose from 2006 to 2007 as a result of federal assistance being distributedto homeowners to aid in their rebuilding efforts.3 Unemployment Compensation expenses increased from 2008 to 2009 and again from 2009 to 2010. The number ofeligible workers rose due to the climb in the unemployment rate and benefits were extended under the American Recoveryand Reinvestment Act.4 Operating grants and contributions increased from 2009 to 2010. This is due in part to funding provided by the AmericanRecovery and Reinvestment Act.
Health and social services expenses rose from 2008 to 2009 primarily as Medicaid expenditures escalated for medicalassistance and disproportionate share payments.
Note: This table has been restated for prior period adjustments, if practical. Complete information necessary to fully restate fiscal year 2014 for the implementation of GASB Statement 68 was not available.
Health and social services expenses increased from 2014 to 2015 as Medicaid enrollment increased in response to theAffordable Care Act mandate for health insurance.

143
2011 2010 2009 2008 2007 2006
$ 2,935,523 $ 2,885,064 $ 2,961,865 $ 3,166,130 $ 3,161,005 $ 3,075,657420,410 406,279 411,729 438,676 444,489 442,190
1,374,843 1,385,623 1,415,091 1,503,869 1,501,334 1,204,055477,443 416,978 420,739 500,996 469,182 425,091192,146 197,970 187,050 194,129 192,861 169,727520,689 511,351 461,064 459,483 397,515 385,810
58591,185 54,935 83,119 145,465 184,500 122,553
(9,871)(22,871) (29,896) (42,639) (2,786) (3,971) (5,945)
5,989,368 5,828,304 5,898,018 6,405,962 6,346,915 5,809,852
762,388 44,548 2,843 21,433 70,240 55,974
1,33322,871 29,896 42,639 2,786 3,971 5,94585,259 74,444 45,482 24,219 74,211 63,259
$ 6,074,627 $ 5,902,748 $ 5,943,500 $ 6,430,181 $ 6,421,126 $ 5,873,111
$ 5,989,368 $ 527,695 $ (70,967) $ 516,466 $ 1,353,055 $ 948,14485,259 (158,392) (146,165) (16,625) 53,057 (7,807)
$ 6,074,627 $ 369,303 $ (217,132) $ 499,841 $ 1,406,112 $ 940,337
6 Operating grants and contributions increased from 2008 to 2009. This can be attibuted to additional federal funding forunemployment compensation programs under the American Recovery and Reinvestment Act .
7 Sales and use taxes decreased from 2008 to 2009 and again from 2009 to 2010 as consumer spending on cars, lumber andbuilding materials and other taxable goods and services was down in response to a weakening economy.
5 Unemployment Compensation Charges for Services increased from 2010 to 2011. Employer assessments grew because thetaxable wage base doubled.
Operating grants and contributions decreased from 2014 to 2015 as federal funding for unemployment compensationprograms came to an end.

144
Last Ten Fiscal Years Table 3Modified Accrual Basis of Accounting (Expressed in Thousands)
2015 2014 2013 2012General Fund
Nonspendable $ 52,877 $ 52,061 $ 50,480 $ 52,236Restricted 3,754,248 3,448,681 3,491,146 3,528,727Committed 88,919 139,936 112,788 192,939Assigned 12,121 10,503 10,729 45,757Unassigned 232,990 571,580 520,612 452,744
Total General Fund $ 4,141,155 $ 4,222,761 $ 4,185,755 $ 4,272,403
All Other Governmental FundsNonspendable $ 57,201 $ 56,450 $ 55,711 $ 54,918Restricted 5,473 5,163 5,252 7,132Committed
Total All Other Governmental Funds $ 62,674 $ 61,613 $ 60,963 $ 62,050
2010 2009 2008 2007General Fund
Reserved $ 813,291 $ 829,688 $ 833,922 $ 864,522Unreserved 1,895,503 1,359,911 1,822,412 1,625,064
Total General Fund $ 2,708,794 $ 2,189,599 $ 2,656,334 $ 2,489,586
All Other Governmental FundsReserved $ 82,783 $ 316,774 $ 325,180 $ 317,053Unreserved, reported in:
Special revenue funds 596,557 552,911 568,091 769,769Capital project funds 323,080 375,268 383,225 224,942Debt service fundsPermanent funds 6,601 5,119 3,862 2,398
Total All Other Governmental Funds $ 1,009,021 $ 1,250,072 $ 1,280,358 $ 1,314,162
Fund Balances of Governmental Funds
Mississippi
Note: Beginning in fiscal year 2011, fund balance categories were reclassified as a result of implementing GASB Statement 54 but were not restated for prior years. However, this table has been restated for prior period adjustments.
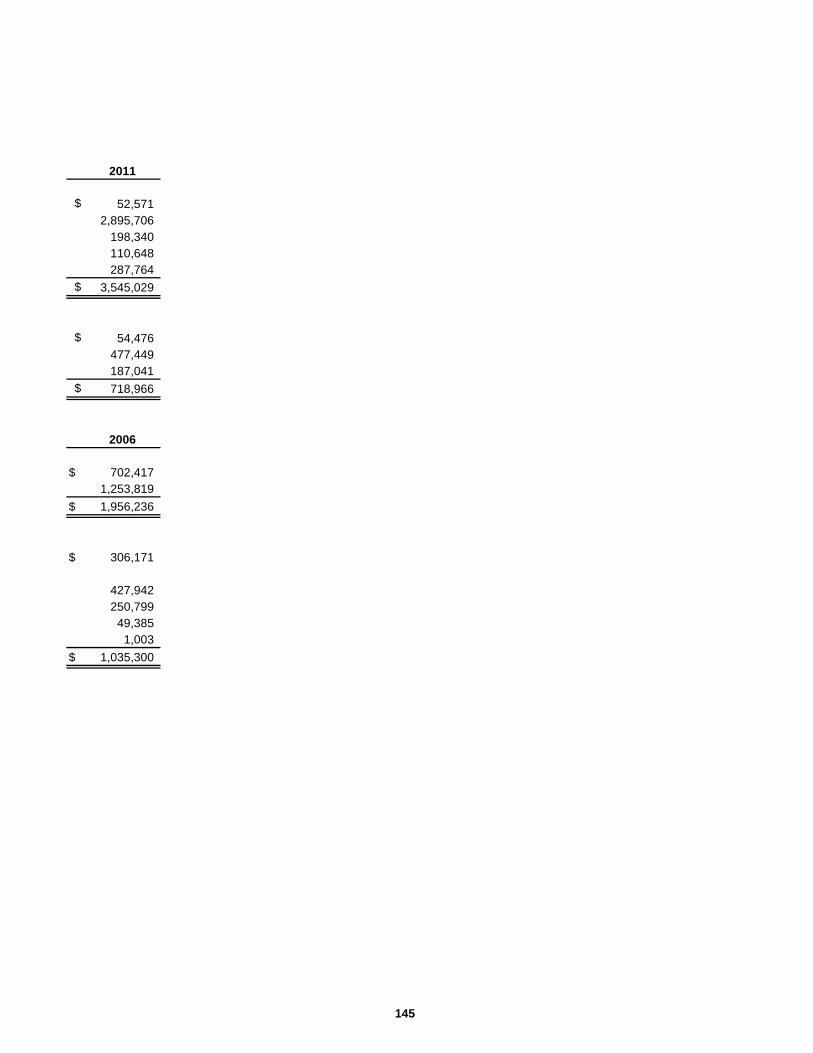
145
2011
$ 52,5712,895,706
198,340110,648287,764
$ 3,545,029
$ 54,476477,449187,041
$ 718,966
2006
$ 702,4171,253,819
$ 1,956,236
$ 306,171
427,942250,799
49,3851,003
$ 1,035,300

146
Last Ten Fiscal Years Table 4Modified Accrual Basis of Accounting (Expressed in Thousands)
2015 2014 2013 2012RevenuesTaxes
Sales and use1 $ 3,324,776 $ 3,264,343 $ 3,122,591 $ 3,037,136Gasoline and other motor fuel 419,622 406,647 409,730 415,508Individual income 1,747,961 1,676,064 1,680,470 1,551,576Corporate income and franchise 691,769 677,501 539,174 497,879Insurance 273,710 267,971 216,173 209,937Other 515,596 541,496 531,494 551,119
Licenses, fees and permits 564,702 522,824 533,880 533,573Federal government2 7,500,282 7,343,489 7,495,005 7,647,096Investment income 57,002 69,134 10,897 47,037Charges for sales and services 361,793 363,976 346,611 347,252Rentals 15,789 32,662 27,698 27,641Court assessments and settlements 163,915 169,497 141,008 156,163Refund of prior year disaster paymentsOther 653,608 562,028 607,047 535,500
Total Revenues 16,290,525 15,897,632 15,661,778 15,557,417
ExpendituresGeneral government 2,475,434 1,493,951 1,495,665 1,414,395Education 3,381,946 3,994,332 3,909,703 4,121,827Health and social services3 7,685,805 7,404,608 7,373,548 7,064,468Law, justice and public safety 959,927 930,805 985,149 933,574Recreation and resources development4 555,793 639,569 590,813 715,739Regulation of business and professions 41,284 39,444 39,654 37,440Transportation 1,047,355 1,143,230 1,109,584 1,204,625Debt service
Principal 319,916 319,798 307,377 290,870Interest and other fiscal charges 224,400 244,164 246,962 240,940Defeasance of debt
Capital outlay 68,471Total Expenditures 16,691,860 16,209,901 16,058,455 16,092,349
Excess of revenues over (under) expenditures $ (401,335) $ (312,269) $ (396,677) $ (534,932)
MississippiChanges in Fund Balances of Governmental Funds

147
2011 2010 2009 2008 2007 2006
$ 2,916,298 $ 2,848,169 $ 3,008,042 $ 3,146,711 $ 3,136,554 $ 3,074,831415,200 406,837 412,206 437,810 445,876 443,150
1,409,473 1,337,000 1,441,141 1,523,231 1,486,074 1,213,733447,322 413,930 420,482 503,165 477,166 412,839192,146 197,970 187,050 194,129 192,861 169,727520,689 511,351 461,064 459,483 397,515 385,810519,033 505,314 527,099 547,844 499,787 448,482
8,496,243 8,434,957 7,402,207 7,197,515 8,079,581 6,844,29888,553 96,596 69,725 132,566 174,142 118,888
379,741 311,236 351,618 327,874 310,769 279,89929,044 27,844 24,008 24,353 18,559 13,004
145,462 188,337 130,762 139,803 159,131 113,13555,557
511,610 521,636 410,345 345,593 309,521 281,90816,070,814 15,801,177 14,845,749 14,980,077 15,743,093 13,799,704
1,301,010 1,377,855 1,392,656 1,430,623 1,345,200 1,379,8474,134,654 4,076,285 4,090,971 4,155,180 3,949,505 3,663,0826,863,679 6,711,466 6,129,997 5,601,993 5,302,796 5,176,071
953,468 1,053,017 1,069,705 1,385,082 1,172,469 1,364,7501,002,286 1,055,786 1,138,031 1,203,801 1,926,281 351,801
37,713 37,847 36,450 35,841 33,364 30,9811,168,090 1,180,908 1,134,357 1,178,966 1,390,677 1,284,905
316,103 321,825 419,973 295,060 277,538 261,878226,906 163,207 210,654 210,311 184,346 177,228
2,505 2,13884,671 98,825 80,378 110,620 88,575 69,604
16,088,580 16,079,526 15,703,172 15,607,477 15,670,751 13,762,285
$ (17,766) $ (278,349) $ (857,423) $ (627,400) $ 72,342 $ 37,419
(Continued on Next Page)

148
Last Ten Fiscal Years Table 4Modified Accrual Basis of Accounting (Expressed in Thousands)
MississippiChanges in Fund Balances of Governmental Funds
(Continued from Previous Page)
2015 2014 2013 2012Other Financing Sources (Uses)Bonds and notes issued $ 366,575 $ 348,777 $ 341,420 $ 603,030Capital leases issued 2,322 16,107 487 9,524Discounts on bonds and notes issued (353)Insurance recovery 22,732 17,826 7,303 332Payments on refunded bond anticipation notes (19,000)Payments on refunded bonds and notesPayments to bond escrow agent (483,163)Payments to refunded bond, note and lease escrow agents (776,032) (115,002)Premiums on bonds, notes, and refunding bonds and
notes issued 86,758 15,838 120,265 40,400Refunding bonds and notes issued 429,115 697,790 123,075Transfers in 3,513 4,508 4,461 196,971Transfers out (106,709) (53,131) (86,752) (233,940)
Net Other Financing Sources (Uses) 320,790 349,925 308,942 605,390
Extraordinary ItemInsurance recovery from hurricane damage
Net Change in Fund Balances $ (80,545) $ 37,656 $ (87,735) $ 70,458
Debt Service as a Percentage of Noncapital Expenditures 3.4% 3.5% 3.7% 3.6%
Federal government revenues increased from 2006 to 2007. This can be attributed to federal assistance for homeownersaffected by Hurricane Katrina.
1 Sales and use taxes decreased from 2008 to 2009 and again from 2009 to 2010 as consumer spending on cars, lumber andbuilding materials and other taxable goods and services was down in response to a weakening economy.
Note: This table has been restated for prior period adjustments.
Health and social services expenditures increased from 2014 to 2015 as Medicaid enrollment increased in response to theAffordable Care Act mandate for health insurance.
4 Recreation and resources development expenditures rose from 2006 to 2007 as a result of federal assistance beingdistributed to homeowners to aid in their rebuilding efforts.
Health and social services expenditures rose from 2008 to 2009 primarily as Medicaid expenditures escalated for medicalassistance and disproportionate share payments.
2 Federal government revenues increased from 2009 to 2010. This is due in part to funding provided by the AmericanRecovery and Reinvestment Act.
3 Health and social services expenditures rose from 2009 to 2010 primarily as benefits and the number of participants in theMedicaid and the Supplemental Nutrition Assistance Programs increased.
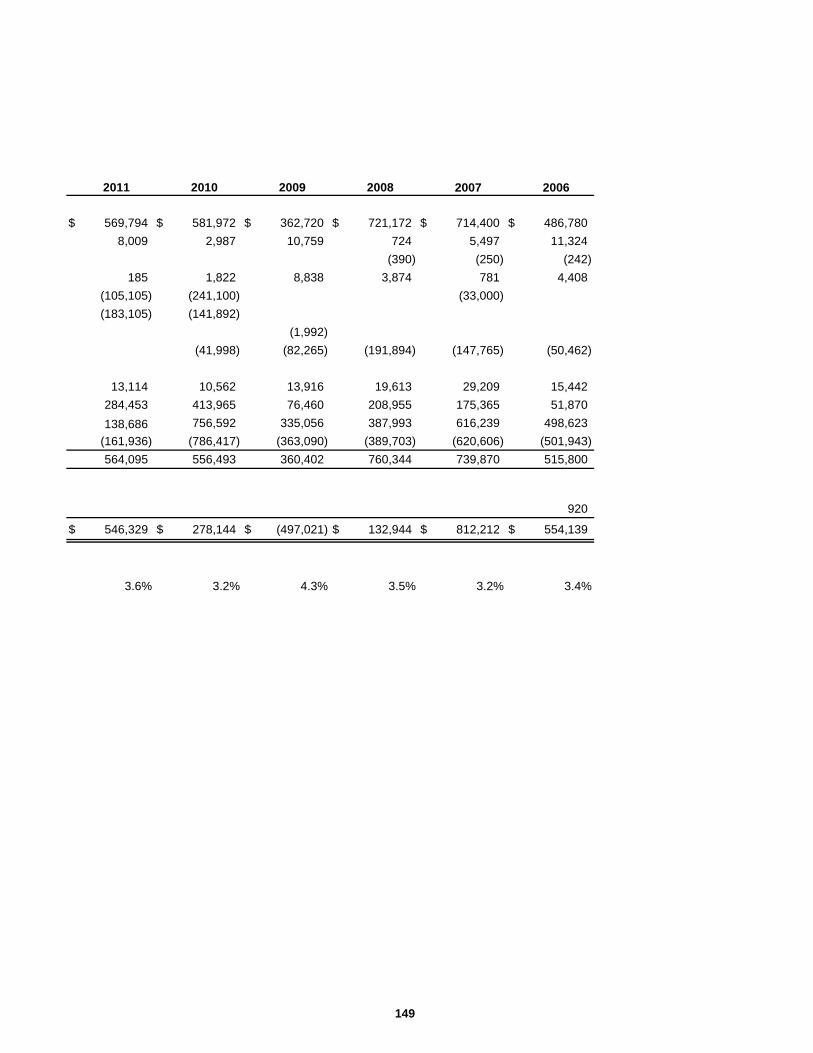
149
2011 2010 2009 2008 2007 2006
$ 569,794 $ 581,972 $ 362,720 $ 721,172 $ 714,400 $ 486,7808,009 2,987 10,759 724 5,497 11,324
(390) (250) (242)185 1,822 8,838 3,874 781 4,408
(105,105) (241,100) (33,000)(183,105) (141,892)
(1,992)(41,998) (82,265) (191,894) (147,765) (50,462)
13,114 10,562 13,916 19,613 29,209 15,442284,453 413,965 76,460 208,955 175,365 51,870138,686 756,592 335,056 387,993 616,239 498,623
(161,936) (786,417) (363,090) (389,703) (620,606) (501,943)564,095 556,493 360,402 760,344 739,870 515,800
920
$ 546,329 $ 278,144 $ (497,021) $ 132,944 $ 812,212 $ 554,139
3.6% 3.2% 4.3% 3.5% 3.2% 3.4%

150
Last Ten Fiscal Years Table 5(Expressed in Thousands)
2013 2012 2011 2010Automotive $ 6,282,431 $ 5,903,776 $ 5,443,950 $ 4,864,021Contracting 5,353,835 5,418,884 5,694,497 6,088,260Food and Beverage 8,449,285 8,193,223 7,889,072 7,712,477Furniture 853,711 865,405 864,544 874,401General Merchandise 7,896,794 7,732,806 7,592,421 7,496,027Lumber and Building Materials 2,672,756 2,574,449 2,587,393 2,510,439Machinery, Equipment and Supplies 3,578,629 3,099,301 2,704,961 2,380,929Miscellaneous Retail 3,715,848 3,591,929 3,453,367 3,339,710Miscellaneous Services 2,683,214 2,719,817 2,796,299 2,580,111Public Utilities 4,369,849 4,126,438 4,174,681 4,299,562Recreation 153,087 152,721 145,519 144,896Wholesale 816,077 799,970 785,349 756,599
Total taxable sales $ 46,825,516 $ 45,178,719 $ 44,132,053 $ 43,047,432
Gross tax collections $ 2,879,001 $ 2,785,750 $ 2,725,830 $ 2,652,437
Average effective rate 6.15% 6.17% 6.18% 6.16%
2014Accommodation and Food Services $ 4,590,836Administrative, Support, Waste Management 335,163Arts, Entertainment, Recreation 124,955Construction 5,716,050Information 2,635,722Manufacturing 896,040Mining, Quarrying and Oil and Gas Extraction 412,702Other Services 1,335,779Real Estate, Rental, and Leasing 862,594Retail Trade 25,048,766Utilities 1,439,020Wholesale Trade 3,658,202Other Industries 325,675
Total taxable sales $ 47,381,504
Gross tax collections $ 2,945,016
Average effective rate 6.22%
Source: Mississippi Department of Revenue
Taxable Sales by Industry
Notes: During Fiscal year 2014, the Mississippi Department of Revenue converted sales tax collection data from the Standard Industrial Classification (SIC) System to the North American Industry Classification System (NAICS).
The most current fiscal year available is fiscal year 2014.
Mississippi

151
2009 2008 2007 2006 2005$ 5,023,772 $ 6,083,873 $ 6,425,719 $ 6,659,353 $ 6,146,219
7,771,199 7,887,529 7,289,281 6,077,508 4,450,5807,658,372 7,502,956 7,183,345 6,860,282 6,667,695
858,990 959,992 1,017,087 1,011,007 759,2407,697,208 7,339,220 7,517,150 7,389,359 6,627,8402,870,910 3,423,567 3,892,931 3,944,938 2,675,2752,655,964 2,962,978 3,065,223 2,883,980 2,253,9563,567,676 3,743,749 3,741,915 3,562,267 3,317,4642,829,490 2,823,849 2,605,241 2,582,114 1,944,0144,383,720 4,225,268 4,160,798 4,323,055 3,687,135
136,388 134,763 135,866 119,248 110,930763,532 749,042 728,840 721,747 758,074
$ 46,217,221 $ 47,836,786 $ 47,763,396 $ 46,134,858 $ 39,398,422
2,809,904 $ 2,893,966 $ 2,899,368 $ 2,807,350 $ 2,421,537
6.08% 6.05% 6.07% 6.09% 6.15%

152
Fiscal Years 2014 and 2005
Number Percentageof Filers of Total
Accommodation and Food Services 9,649 10.8 % $ 321,277 10.9 %Administrative, Support, Waste Management 1,686 1.9 23,380 0.8Arts, Entertainment, Recreation 1,151 1.3 8,745 0.3Construction 10,538 11.8 217,428 7.4Information 778 0.9 184,498 6.3Manufacturing 3,803 4.2 45,311 1.5Mining, Quarrying and Oil and Gas Extraction 723 0.8 27,793 0.9Other Services 5,834 6.5 92,139 3.1Real Estate, Rental, and Leasing 2,160 2.4 55,689 1.9Retail Trade 40,118 44.8 1,658,072 56.3Utilities 763 0.9 80,171 2.7Wholesale Trade 9,162 10.2 209,226 7.1Other Industries 3,154 3.5 21,287 0.8 Total taxable sales 89,519 100.0 % $ 2,945,016 100.0 %
Source: Mississippi Department of Revenue
Sales Tax Revenue Payers by Industry
Mississippi
Percentage
2014
Notes: During Fiscal year 2014, the Mississippi Department of Revenue converted sales tax collection data from the Standard Industrial Classification (SIC) System to the North American Industry Classication System (NAICS). Due to confidentiality issues, the names of the ten largest sales tax revenue payers are not available. The categories presented are intended to provide alternative information regarding the sources of the State's revenue. The most current fiscal year available is 2014.
of Total
Tax Liability(expressed inthousands)
Table 6

153
Number Percentageof Filers of Total
Automotive 11,407 13.5 % $ 338,188 14.0 %Contracting 8,113 9.6 162,870 6.7Food and Beverage 15,515 18.4 464,743 19.2Furniture 2,679 3.2 53,710 2.2General Merchandise 5,386 6.4 464,513 19.2Lumber and Building Materials 5,354 6.3 184,937 7.6Machinery, Equipment, and Supplies 6,047 7.2 125,267 5.2Miscellaneous Retail 22,352 26.5 228,370 9.4Miscellaneous Services 5,859 6.9 135,960 5.6Public Utilities 1,131 1.3 209,731 8.7Recreation 454 0.5 7,764 0.3Wholesale 44 0.2 45,484 1.9 Total taxable sales 84,341 100.0 % $ 2,421,537 100.0 %
Tax Liability(expressed inthousands)
2005
of TotalPercentage

154
Last Ten Fiscal Years(Expressed in Thousands, except Per capita)
2015 2014 2013 2012Governmental ActivitiesGeneral Obligation Bonds and Notes1 $ 4,381,327 $ 4,297,643 $ 4,207,238 $ 4,239,834Limited Obligation BondsCapital Lease Obligations 20,209 22,775 13,158 18,079Notes Payable1 1,113,994 1,078,967 1,140,010 989,336Certificates of Participation
Total Governmental Activities 5,515,530 5,399,385 5,360,406 5,247,249
Business-type ActivitiesGeneral Obligation Bonds 12,670 15,503 18,210 20,792Revenue BondsCapital Lease Obligations 272 344 131 381
Total Business-type Activities 12,942 15,847 18,341 21,173Total Primary Government $ 5,528,472 $ 5,415,232 $ 5,378,747 $ 5,268,422
Amount of Debt Per capita2 $ 1,841 $ 1,811 $ 1,805 $ 1,768
Debt as a percentage of Personal Income3 5.4% 5.3% 5.4% 5.3%
Net General Obligation Bonded Debt4
General Obligation Bonds and Notes1 $ 4,381,327 $ 4,297,643 $ 4,207,238 $ 4,239,834Less: Debt Service 340,515 369,002 339,308 344,061
Net General Obligation Bonded Debt $ 4,040,812 $ 3,928,641 $ 3,867,930 $ 3,895,773
Amount of Net General Obligation Bonded Debt Per capita2 $ 1,350 $ 1,313 $ 1,298 $ 1,307
Net General Obligation Bonded Debtas a percentage of Taxable Sales5 8.5% 8.4% 8.6% 8.6%
Notes:
2 See Table 9 for population data. For the current fiscal year, the prior year population data is used in the calculation.
4 Net General Obligation Bonded Debt is long-term debt reported in governmental activities.
5 See Table 5 for taxable sales data. For the current fiscal year, the prior year taxable sales data is used in the calculation.
Ratios of Outstanding Debt by Type
Table 7
3 See Table 9 for personal income data. For the current fiscal year, the prior year personal income data is used in the calculation.
Mississippi
1 Fiscal years 2005 - 2012 have been restated for GASB Statement No. 65, Items Previously Reported as Assets and Liabilities, presentation.

155
2011 2010 2009 2008 2007 2006
$ 3,862,590 $ 3,578,528 $ 3,516,385 $ 3,516,217 $ 3,205,576 $ 3,085,78724,460 47,880 70,320
13,935 13,212 17,231 12,555 18,568 19,0341,021,016 1,047,983 853,156 883,283 709,940 347,200
2,045 2,190 2,330 2,4604,897,541 4,639,723 4,388,817 4,438,705 3,984,294 3,524,801
23,426 26,476 29,231 32,064 35,084 38,016
618 841 1,636 926 214 32024,044 27,317 30,867 32,990 35,298 38,336
$ 4,921,585 $ 4,667,040 $ 4,419,684 $ 4,471,695 $ 4,019,592 $ 3,563,137
$ 1,652 $ 1,571 $ 1,493 $ 1,516 $ 1,372 $ 1,229
5.2% 5.1% 5.0% 4.9% 4.6% 4.4%
$ 3,862,590 $ 3,578,528 $ 3,516,385 $ 3,516,217 $ 3,205,576 $ 3,085,787323,235 248,686 197,131 214,647 175,515 105,347
$ 3,539,355 $ 3,329,842 $ 3,319,254 $ 3,301,570 $ 3,030,061 $ 2,980,440
$ 1,188 $ 1,121 $ 1,121 $ 1,119 $ 1,034 $ 1,028
8.0% 7.7% 7.2% 6.9% 6.3% 6.5%

156
Last Ten Fiscal Years Table 8(Expressed in Thousands)
2015 2014 2013 2012 2011Legal debt limit $ 13,312,194 $ 12,823,921 $ 12,505,104 $ 12,451,109 $ 12,451,109Less: Net debt applicable to limit 4,040,812 3,928,641 3,867,930 3,847,744 3,490,465
Legal debt margin $ 9,271,382 $ 8,895,280 $ 8,637,174 $ 8,603,365 $ 8,960,644
Net debt applicable to the limitas a percentage of legal debt limit 30.4% 30.6% 30.9% 30.9% 28.0%
2010 2009 2008 2007 2006Legal debt limit $ 12,451,109 $ 12,451,109 $ 12,009,366 $ 10,930,262 $ 10,056,571Less: Net debt applicable to limit 3,275,320 3,259,476 3,237,426 2,959,717 2,906,373
Legal debt margin $ 9,175,789 $ 9,191,633 $ 8,771,940 $ 7,970,545 $ 7,150,198
Net debt applicable to the limitas a percentage of legal debt limit 26.3% 26.2% 27.0% 27.1% 28.9%
Legal Debt Margin Calculation for Fiscal Year 2015:Legal debt limit1 $ 13,312,194
Amount of debt applicable to limit2 $ 4,381,327Less: amounts available for debt service 340,515
Less: Net debt applicable to limit 4,040,812Legal debt margin $ 9,271,382
Notes:
Fiscal ApplicableYear Revenues2014 $ 8,874,7962013 $ 8,549,281 2012 8,336,7362011 7,956,269
Legal Debt Margin
1 The State's constitutional debt limit is established under Section 115 of the Mississippi Constitution at one and one-half timesthe sum of all revenues collected by the State during any one of the four preceding fiscal years, whichever may be higher.Revenues included in the foregoing debt limitation computation are restricted by current practice to the following revenues:taxes, licenses, fees and permits, investment income, rental income, service charges (including net income from the sale ofalcoholic beverages), fines, forfeits, and penalties. Defined revenues for the four preceding years were:
Mississippi
2 The legal debt limit applies to total governmental activities long-term bonded debt.

157
Last Ten Calendar Years Table 9
Year Population Mississippi U. S. 2014 2,994,000 7.8% 6.2% $ 102,795,000,000 $ 34,3332013 2,991,000 8.7 7.4 103,132,000,000 34,4782012 2,980,000 9.0 8.1 98,722,000,000 33,1282011 2,980,000 10.0 8.9 95,313,000,000 31,9842010 2,970,000 10.4 9.6 91,600,000,000 30,8422009 2,960,000 9.5 9.3 88,801,000,000 30,0002008 2,950,000 6.6 5.8 91,220,000,000 30,9222007 2,930,000 6.1 4.6 86,585,000,000 29,5512006 2,900,000 6.5 4.6 81,098,000,000 27,9652005 2,900,000 7.5 5.1 77,748,000,000 26,810
Sources:
Most Current Calendar Year and Nine Years Prior Table 10(Ranked by Number of Employees)
Industry Rank RankGovernment 1 245,100 21.5 % 1 240,800 19.8 %Manufacturing 2 139,300 12.2 2 178,300 14.6Retail Trade 3 135,400 11.9 3 138,200 11.3Health Care and Social Assistance 4 123,300 10.8 5 105,700 8.7Accommodation and Food Services 5 114,700 10.1 4 112,200 9.2Professional and Business Services 6 100,800 8.8 6 87,500 7.2Transportation and Warehousing 7 50,300 4.4 7 47,000 3.9Construction 8 49,000 4.3 8 52,200 4.3Other Services 9 38,800 3.4 9 40,900 3.4Wholesale Trade 10 34,100 3.0 10 35,300 2.9
Total 1,030,800 90.4 % 1,038,100 85.3 %
Total Employed Labor Force 1,140,000 100.0 % 1,218,800 100.0 %
Source: Mississippi Department of Employment Security
Mississippi
U.S. Bureau of Economic Analysis
U.S. Department of Labor, Bureau of Labor StatisticsMississippi Department of Employment Security
Personal Income
Per capita Personal
Income
Unemployment Rate
2005
Note: This schedule is presented as an alternative to the principal employer schedule for which employer data could not be obtained. Information contained in the schedule represents nonagricultural employment.
2014
Demographic and Economic Statistics
Employment by Industry
Average Number of Employees
Percentage of All
Employees
Average Number of Employees
Percentage of All
Employees

158
Last Ten Academic Years Table 11
2014/2015 2013/2014 2012/2013 2011/2012Kindergarten 44,950 46,297 47,198 44,890Grades 1-3 120,791 119,432 116,562 114,814Grades 4-6 108,968 110,211 111,609 114,498Grades 7-9 112,337 113,675 113,490 111,616Grades 10-12 95,767 95,399 96,485 97,292Special Education 7,412 7,572 7,503 7,509 Total Enrollment 490,225 492,586 492,847 490,619
Source: Mississippi Department of Education
Last Ten Academic Years Table 12
2014-2015 2013/2014 2012/2013 2011/2012Coahoma Community College 1,746 2,722 2,694 2,889Copiah-Lincoln Community College 3,040 3,186 3,308 3,578East Central Community College 2,621 3,049 3,112 3,091East Mississippi Community College 3,676 3,712 4,367 5,240Hinds Community College 12,844 10,975 10,609 14,306Holmes Community College 4,905 6,330 6,728 6,707Itawamba Community College 6,320 6,972 6,977 7,602Jones County Junior College 4,617 5,113 4,192 4,637Meridian Community College 3,386 3,047 3,330 3,883Mississippi Delta Community College 2,499 3,006 3,001 3,977Mississippi Gulf Coast Community College 9,767 11,821 11,350 11,434Northeast Mississippi Community College 3,643 3,520 3,603 3,736Northwest Mississippi Community College 7,294 8,450 7,202 8,437Pearl River Community College 4,140 4,231 4,675 4,675Southwest Mississippi Community College 2,097 2,224 2,143 2,224 Total Enrollment 72,595 78,358 77,291 86,416 Source: Mississippi Community College Board
Last Ten Academic Years Table 13
2014/2015 2013/2014 2012/2013 2011/2012Alcorn State University 3,639 3,848 3,950 4,018Delta State University 3,614 4,785 4,763 4,624Jackson State University 9,508 9,134 8,819 8,903Mississippi State University 20,138 20,161 20,365 20,424Mississippi University for Women 2,696 2,629 2,650 2,661Mississippi Valley State University 2,221 2,203 2,479 2,452University of Mississippi 23,096 22,291 21,528 20,830University of Southern Mississippi 14,792 15,249 16,468 16,604 Total Enrollment 79,704 80,300 81,022 80,516
Source: Institutions of Higher Learning, Office of Strategic Data Management
MississippiPublic School Enrollment
Community and Junior College Enrollment
University Enrollment

159
2010/2011 2009/2010 2008/2009 2007/2008 2006/2007 2005/200642,371 42,790 41,602 41,453 42,277 42,824
115,503 116,320 118,249 118,969 117,424 114,830115,057 114,328 111,783 111,009 112,101 113,468111,826 113,802 115,901 118,593 120,271 120,852
98,536 97,942 97,024 96,003 93,287 91,6637,233 6,923 6,635 7,275 8,775 10,401
490,526 492,105 491,194 493,302 494,135 494,038
2010/2011 2009/2010 2008/2009 2007/2008 2006/2007 2005/20062,781 3,210 2,239 2,398 2,201 2,4285,221 4,649 3,886 3,811 3,933 3,7922,738 3,554 3,219 2,841 3,096 3,2685,906 6,063 6,356 6,353 4,938 4,569
13,693 15,370 12,661 16,747 13,487 13,0045,711 5,943 5,754 5,124 5,164 5,2208,003 9,965 9,173 8,339 7,363 7,0896,783 6,982 5,951 5,658 5,785 6,2193,956 4,856 4,317 4,065 3,946 3,8134,320 4,410 4,011 3,659 3,815 3,995
12,171 13,426 11,736 9,674 9,045 8,9343,966 5,482 5,006 5,223 5,264 5,2667,312 8,777 7,326 6,900 7,457 6,9534,406 4,853 5,081 4,263 4,411 4,2562,283 2,289 2,106 2,080 1,986 2,121
89,250 99,829 88,822 87,135 81,891 80,927
2010/2011 2009/2010 2008/2009 2007/2008 2006/2007 2005/20063,682 3,334 3,252 3,668 3,583 3,5444,327 4,031 4,064 4,091 4,217 4,1198,687 8,783 8,374 8,698 8,256 8,416
19,643 18,600 17,824 17,039 16,206 16,1012,587 2,476 2,365 2,379 2,428 2,2852,636 2,846 2,929 3,009 3,162 3,165
19,546 18,344 17,601 17,323 17,312 16,92815,778 15,293 14,793 14,592 14,777 15,03076,886 73,707 71,202 70,799 69,941 69,588

160
Last Ten Fiscal Years Table 14
2015 2014 2013 2012General Government
Department of Finance and AdministrationBuildings 59 36 37 37Vehicles 44 44 41 42
Department of RevenueVehicles 62 49 46 46
EducationDepartment of Education
Vehicles 55 44 45 41
Law, Justice and Public SafetyDepartment of Corrections
Buildings 252 558 572 576Vehicles 618 691 611 611
Department of Public SafetyBuildings 45 43 41 41Vehicles 1,118 913 896 963
Recreation and Resource DevelopmentDepartment of Wildlife, Fisheries and Parks
State Parks 25 25 25 25Acres of State Parks 24,481 24,481 24,591 24,591Buildings 211 843 835 842Vehicles 594 558 591 614
Forestry CommissionBuildings 24 317 369 388Vehicles 490 413 421 429
Regulation of Business and ProfessionsWorkers' Compensation Commission
Buildings 1 1 1 1
TransportationDepartment of Transportation
Miles of state highway 10,897 10,898 10,886 10,913Vehicles 2,272 2,339 2,352 2,554
Health and Social SciencesDepartment of Mental Health
Buildings 475 538 545 551Vehicles 755 752 756 778
Sources:Mississippi Department of Wildlife, Fisheries and ParksMississippi Department of Transportation
MississippiCapital Asset Statistics by Function

161
2011 2010 2009 2008 2007 2006
36 37 37 46 46 4249 48 42 42 41 37
44 49 49 47 47 45
44 43 42 47 44 46
611 627 627 626 633 633593 608 673 676 707 683
39 39 38 37 37 37877 845 908 924 943 907
25 26 26 26 26 2424,446 24,260 24,260 24,260 23,904 23,908
843 831 817 815 812 831606 614 632 609 614 627
392 394 398 408 418 422430 440 446 493 508 483
1 1 1 1 1 1
10,907 10,907 10,984 10,949 10,974 10,9502,534 2,569 2,530 2,547 2,595 2,604
551 553 553 547 541 535786 801 794 802 798 755

162
Last Ten Fiscal Years Table 15
2015 2014 2013 2012 2011 2010General Government
Department of Finance and Administration 413 413 418 413 407 387Department of Revenue 764 727 694 664 681 659Treasury 38 39 36 37 38 38All Other 1,429 1,441 1,454 1,405 1,399 1,408
EducationDepartment of Education 607 653 687 714 717 741All Other 185 182 187 195 191 193
Health and Social ServicesDepartment of Human Services 3,411 3,391 3,483 3,302 3,276 3,219Division of Medicaid 925 936 923 869 897 934Department of Mental Health 7,460 7,716 7,815 8,189 8,173 8,586Department of Rehabilitation Services 954 964 969 995 1,026 1,060All Other 3,251 3,340 3,449 3,476 3,399 3,549
Law, Justice and Public SafetyDepartment of Corrections 2,647 2,870 2,958 2,746 2,824 2,919Department of Public Safety 1,282 1,215 1,252 1,291 1,256 1,275All Other 2,087 2,163 2,188 2,192 2,141 2,130
Recreation and Resource DevelopmentDepartment of Environmental Quality 394 397 401 423 432 435Department of Wildlife, Fisheries and Parks 522 522 543 566 582 665Forestry Commission 401 418 414 423 443 455Mississippi Development Authority 271 287 300 308 316 324All Other 366 365 367 378 375 392
Regulation of Business and ProfessionsPublic Service Commission 67 85 101 100 100 92Oil and Gas Board 32 31 32 34 34 34All Other 279 260 248 245 252 262
TransportationDepartment of Transportation 3,162 3,277 3,351 3,342 3,363 3,448
Total 30,947 31,692 32,270 32,307 32,322 33,205
Source: Statewide Payroll and Human Resource System, Total Filled Positions
MississippiState Government Employees by Function

163
2009 2008 2007 2006
408 380 363 338711 726 713 697
38 39 37 381,484 1,438 1,402 1,380
779 782 773 737201 200 195 191
3,284 3,046 2,991 2,925940 908 917 942
8,978 8,951 8,930 8,6851,024 964 949 8823,438 3,329 3,393 3,336
3,090 3,153 3,071 3,0721,338 1,365 1,274 1,1992,134 1,994 1,883 1,746
448 428 433 426807 710 788 777475 521 513 479319 279 282 261402 412 408 395
97 97 95 9236 33 32 31
255 246 242 244
3,413 3,346 3,267 3,27134,099 33,347 32,951 32,144

164
Last Ten Fiscal Years Table 16
2014 2013 2012 2011General Government
Tax returns processed 4,950,000 4,950,000 4,950,000 4,950,000On-going construction projects 699 743 783 820Tort claims processed 929 1,098 986 1,117Unclaimed property claims paid 5,187 5,309 7,298 4,581Corporate filings processed 67,873 110,008 243,634 112,983UCC filings processed 318,307 322,350 342,552 254,872
EducationAverage cost per public school student $9,209 $8,921 $8,932 $8,752Public high school graduates 28,556 28,317 28,933 29,569Public school teachers, K-12 32,102 32,356 32,170 32,042
Health and Social ServicesAverage monthly households receiving food assistance 304,060 303,719 289,660 266,966Child support collections from non-custodial parents $333,825,397 $332,931,089 $332,298,519 $314,027,549Medicaid recipients receiving medical services 689,153 643,687 640,957 637,781
Law, Justice and Public SafetyAverage inmate population in prisons 9,719 9,868 9,449 9,636Supervised offenders in communities 30,689 30,078 35,097 Not AvailableDriver licenses issued 594,005 807,582 747,173 821,000
Recreation and Resource DevelopmentTourist registered at welcome centers 2,454,373 2,502,048 2,471,958 2,462,209Land reforested (acres) 32,238 29,732 52,830 38,753Hunting and fishing licenses sold 571,785 578,154 550,000 493,773Overnight accommodations at state parks 689,774 544,887 646,752 573,975
Regulation of Business and ProfessionsUtility complaints investigated 3,915 3,988 4,002 8,059Well inspections by Oil and Gas Board 25,073 21,893 22,236 12,166
TransportationOverlays (miles) 320 135 64 279Replacement of deficit bridges 66 50 55 85
Sources: Mississippi Joint Legislative Budget Committee, Legislative Budget ReportMississippi Department of Education, Superintendent's Annual Report
Mississippi Department of Education, Office of Reporting
Note: The most current fiscal year available is fiscal year 2014.
Operating Indicators by Function
Mississippi

165
2010 2009 2008 2007 2006 2005
4,950,000 4,900,000 4,850,000 4,800,000 4,750,000 4,700,000688 656 676 725 708 707
1,117 538 353 1,081 726 1,3548,050 7,799 6,175 9,781 6,670 5,360
104,842 113,217 40,218 30,740 30,441 27,184280,335 268,108 286,740 289,990 28,317 261,215
$8,930 $8,895 $8,737 $8,298 $7,996 $7,20828,517 24,393 23,935 23,149 23,691 23,41533,210 33,972 33,613 32,746 32,129 32,027
241,785 204,068 184,779 174,924 172,814 153,943$292,715,332 $286,696,080 $264,727,366 $242,768,697 $230,206,702 $218,293,613
621,607 598,476 569,294 547,811 583,523 673,571
10,054 10,761 10,856 10,145 9,669 9,891Not Available 25,910 27,323 29,964 21,736 23,781
780,000 783,508 907,850 755,000 755,000 667,800
2,485,233 2,962,056 2,906,700 2,782,648 2,551,894 2,862,34924,239 38,257 44,546 61,075 54,886 91,035
502,024 588,095 584,891 585,466 525,000 525,000548,224 575,502 675,000 674,280 682,525 672,525
7,906 7,701 7,299 6,766 6,749 6,52015,323 24,419 21,227 22,083 20,879 18,000
397 455 251 146 340 42147 63 55 62 11 29

Acknowledgements The Comprehensive Annual Financial Report was prepared by the Mississippi Department of Finance and Administration, Office of Financial Reporting. Management
Donna McFarland, Director Cindy L. Ogletree, CPA, Assistant Director Robert Johnson, Assistant Director
Fiscal Analysts
Shondra Barker, CPA Chelsea Boothe R. Jeff Brown Nekeida A. McSwain Monique Sims Kristi Webb
Additional assistance Betty L. Smith Dianne P. Sturgis Deborah L. White Special acknowledgements The Office of the State Auditor, whose commitment and valued input into this project are reflected in this accomplishment. The Department of Transportation, General Services Division whose services in the printing of this report are greatly appreciated. All financial and accounting personnel throughout Mississippi state government, whose extra efforts to contribute accurate, timely financial data for their agencies made this report possible. Cover “Biloxi Blues Lighthouse Reflection” photograph is courtesy of Kim Hunt. Mississippi photographer Kim Hunt enjoys capturing the natural and man-made beauty of this beautiful state. Kim Hunt’s website is www.PictureMississippi.com. Kim Hunt has additional photos of Mississippi scenes posted on the web at www.facebook.com/PictureMississippi.
This report is available on the DFA website: www.dfa.state.ms.us