comprehensive annual finance report
TRANSCRIPT

COMPREHENSIVE ANNUAL FINANCE REPORT
of the
LINN-MAR COMMUNITY SCHOOL DISTRICT
Marion, Iowa
For the fiscal year ending June 30, 2016
OFFICIAL ISSUING REPORT J.T. Anderson, CPA
Chief Financial Officer
Chief Operating Officer
2999 North 10th Street
Marion, IA 52302


LINN-MAR COMMUNITY SCHOOL DISTRICT
COMPREHENSIVE ANNUAL FINANCIAL REPORT CONTENTS
PageLetter of Transmittal 1-6Certificate of Excellence from the Association of School Business Officials 7 of the United States and CanadaOrganizational Chart 8Board of Education and School District Administration 9
Independent Auditor's Report 11-13Management's Discussion and Analysis 15-25Basic Financial Statements:
Government-wide Financial Statements:Statement of Net Position 28Statement of Activities 29
Governmental Fund Financial Statements:Balance Sheet 30Reconciliation of the Balance Sheet - Governmental Funds to the Statement of Net Position 31Statement of Revenues, Expenditures and Changes in Fund Balances 32Reconciliation of the Statement of Revenues, Expenditures and Changes in Fund Balances - Governmental Funds to the Statement of Activities 33
Proprietary Fund Financial Statements:Statement of Net Position 34Statement of Revenues, Expenses and Changes in Fund Net Position 35Statement of Cash Flows 36
Notes to Financial Statements 37-55Required Supplementary Information:
Budgetary Comparison Schedule of Revenues, Expenditures/Expenses and Changes in Balances - Budget and Actual - All Governmental Funds and Proprietary Funds 58
Notes to Required Supplementary Information - Budgetary Reporting 59Schedule of the District's Proportionate Share of the Net Pension Liability 60Schedule of District Contributions 61Notes to Required Supplementary Information - Pension Liability 62Schedule of Funding Progress for the Retiree Health Plan 63
Supplementary Information:Nonmajor Governmental Funds:
Combining Balance Sheet 66Combining Schedule of Revenues, Expenditures and Changes in Fund Balances 67
Capital Projects Fund Accounts:Combining Balance Sheet 68Combining Schedule of Revenues, Expenditures and Changes in Fund Balances 69
Nonmajor Proprietary Funds:Combining Schedule of Net Position 70Combining Schedule of Changes in Fund Net Position 71Combining Schedule of Cash Flows 72
INTRODUCTORY SECTION
FINANCIAL SECTION

LINN-MAR COMMUNITY SCHOOL DISTRICT
COMPREHENSIVE ANNUAL FINANCIAL REPORT CONTENTS
Contents Page 73Net Position by Component, Last Ten Fiscal Years 74-75Expenses, Program Revenues and Net (Expense)/Revenue, Last Ten Fiscal Years 76-77Total Primary Government Net Expenses, General Revenues and Total Change in Net Position
Last Ten Fiscal Years 78-79Fund Balances, Governmental Funds, Last Ten Fiscal Years 80-81Governmental Fund Revenues, Last Ten Fiscal Years 82-83Governmental Fund Expenditures, and Debt Ratio, Last Ten Fiscal Years 84-85Other Financing Sources and Uses and Net Change in Fund Balances, Governmental Funds,
Last Ten Fiscal Years 86-87General Fund Expenditures, By Function, and Other Financing Uses, Last Ten Fiscal Years 88General Fund Revenues, By Source, and Other Financing Sources, Last Ten Fiscal Years 89Assessed Value and Actual Value of Taxable Property, Last Ten Fiscal Years 90Property Tax Levies and Collections, Last Ten Fiscal Years 91Property Tax Rates Per $1,000 Assessed Valuation All Direct and Overlapping Governments
Last Ten Fiscal Years 92-94Property Tax rates by Fund per $1,000 Assessed Valuation, Last Ten Fiscal Years 95Principal Property Tax Payers, Current Year and Nine Years Ago 96Ratio of Bonded Debt to Assessed Values and Bonded Debt Per Capita, Last Ten Fiscal Years 97Oustanding Debt by Type, Last Ten Fiscal Years 98Computation of Direct and Overlapping Debt, June 30, 2016 99Computation of Legal Debt Margin, Last Ten Fiscal Years 100-101Miscellaneous Demographic Statistics, Last Ten Years 102New Commercial and Industrical Building Permits, Last Ten Years 103New Single and Multi-Family Dwelling Permits, Last Ten Years 104Principal Employers, Current Year and Nine Years Ago 105Full-Time Equivalent District Employees By Type, Last Ten Fiscal Years 106-107Propety Values, Construction and Bank Deposits, Last Ten Fiscal Years 108Operating Cost Per Pupil, Last Ten Fiscal Years 109School Building Information, Last Ten Fiscal Years 110-111Financial Solvency Ratio, Last Ten Fiscal Years 112Schedule of Average Daily Membership(ADM), Average Daily Attendance(ADA) and Ratio
of ADA to ADM, Last Ten Fiscal Years 113Open Enrolled Students, Last Ten Fiscal Years 114
Schedule of Expenditures of Federal Awards 116
Independent Auditor's Report on Internal Control over Financial Reporting and onCompliance and Other Matters Based on an Audit of Financial Statements Performedin Accordance with Government Auditing Standards 117-118
Independent Auditor's Report on Compliance for Each Major Federal Program and onInternal Control over Compliance Required by the Uniform Guidance 119-120
Schedule of Findings and Questioned Costs 121-125
STATISTICAL SECTION
SINGLE AUDIT SECTION
Quintin Shepherd, Ph.D. Superintendent
Shannon Bisgard Associate Superintendent Chief Academic Officer
J.T. Anderson Chief Operating Officer & Chief Financial Officer
Karla Christian Chief Human Resources Officer & Exec Director of Public Relations
Leisa Breitfelder Executive Director of Student Services
Rick Ironside, Ed.D. Executive Director of Support Services
Jeri Ramos Executive Director of Technology Services
Angie Morrison Business Manager
Tim Isenberg President Board of Directors DISTRICT SCHOOLS High School, 9-12 Jeff Gustason, Ph.D. Principal
Excelsior, 6-8 John Christian Principal
Oak Ridge, 6-8 Erica Rausch Principal
Bowman Woods, K-5 Tina March Principal
Echo Hill, K-5 Dan Ludwig Principal
Indian Creek, K-5 Marilee McConnell Principal
Linn Grove, ECBP/PK-5 Chad Buchholz Principal
Novak, ECBP/PK-5 Carol O'Donnell Principal
Westfield, K-5 Ed Rogers Principal
Wilkins, K-5 Pamela Schulz Principal
2999 North Tenth Street Marion, IA 52302 Phone 319.447.3000 FAX 319.377.9252 www.linnmar.k12.ia.us
November 22, 2016 Tim Isenberg, President, Members of the Board of Education, and the Citizens of Linn-Mar Community School District Marion, Iowa We are proud to submit to you the Comprehensive Annual Financial Report of the Linn-Mar Community School District for the year ending June 30, 2016. This report has been prepared to conform to the guidelines recommended by the Association of School Business Officials International.
MANAGEMENT RESPONSIBILITY Responsibility for both the accuracy of the data and the completeness and fairness of the presentation, including all disclosures, rests with the District. To the best of our knowledge and belief, the enclosed information is fairly stated in all material respects and is presented in a manner which sets forth the financial position and results of the operations of the governmental activities, business-type activities, each major fund and aggregate of the remaining funds of the District in accordance with generally accepted accounting principles, (GAAP). It includes all funds of the entire District. The District is not included in any other reporting entity, nor are other entities included within this report. All disclosures necessary to enable a reader to gain maximum understanding of the District’s financial activities have been included.
CAFR The 2016 Comprehensive Annual Financial Report is presented in four sections: Introductory, Financial, Statistical and Internal Controls and Compliance. Introductory Section- This section includes a transmittal letter, economic outlook of the community, the District’s accomplishments, the Certificate of Excellence in Financial Reporting for the year ended June 30, 2015, the District’s Team Leadership Network and a list of the Board of Directors and District Officials.
Financial Section- The School District’s financial statements and schedules are
presented in accordance with the financial reporting pyramid set forth by the Governmental Accounting Standards Board. This section includes the independent auditor’s report, Management’s Discussion and Analysis (MD&A), audited basic financial statements, required supplementary information, and combining and individual fund statements and schedules. The audited basic financial statements provide both an overview and a
1

2
broad long-term perspective of the School District as a whole in the government-wide financial statements. The MD&A is provided by management as a narrative introduction, overview, and analysis to accompany the basic financial statements. This letter of transmittal is designed to complement the MD&A and should be read in conjunction with it. The District’s MD&A can be found immediately following the report of the independent auditors.
Statistical Section- This section includes selective financial, economic and demographic information, generally presented on a multi-year basis for comparison. Compliance Section- This section includes audit reports relating to the Board’s single audit over internal control, federal and state awards, Schedule of Expenditures of Federal and State Awards. Linn-Mar Community School District This report includes all funds of the Linn-Mar Community School District. The District provides a full range of services including instructional, administrative, transportation, food service, maintenance of sites and facilities, clerical and extra- and co-curricular activities. The District is governed by a seven-member elected Board of Education. During the 2008 legislative session, a bill was passed that changed the board terms from three years to four years and requires school elections to be held in September of odd numbered years, beginning in September 2009. The Board of Directors is a policy-making and planning body whose decisions are carried out by school administrators. The Linn-Mar Community School District is located in Linn County in east central Iowa. The District includes portions of Cities of Cedar Rapids, Marion and Robins, as well as unincorporated land in northern Linn County. The District originated in 1948 as Marion Rural Independent School District, and became the Marion Rural Community School District under the Community School Reorganization Act adopted in 1955. It operated under this name from 1955 to 1963 when its name was changed to Linn-Mar Community School District. The District is currently the 12th largest of Iowa’s 336 public school systems. The certified enrollment taken on October 1, 2015, was approximately 7,198 students. The District operates one high school, two middle schools, seven elementary schools, an alternative High School Program, a special education transition program, a home school assistance program and an early childhood preschool program. The District provides a full range of educational services appropriate to students in early childhood and preschool through grade twelve. These services include basic, regular and enriched academic education; special education for children with special needs; vocational-technical education; and numerous individualized programs such as specialized instruction for students at-risk and for limited English speaking students. In addition to a strong PK-12 educational program, the District works with Kirkwood Community College to offer courses for qualified high school students and a community education program for adult learners. The District is supported financially by state aid, property taxes, state and federal grants for special projects, local revenue received for tuition and other services, and a state-wide one percent sales tax.

3
Economic Condition and Outlook Linn-Mar Community School District is located in the Cedar Rapids Metropolitan Service Area (MSA). The District covers 64 square miles and encompasses the north part of the city of Marion and the NE portion of city of Cedar Rapids. The Cedar Rapids Metropolitan Service Area is home to numerous Fortune 500 companies, two of which are located within Linn-Mar’s District boundaries. Rockwell Collins, a Fortune 500 company, is the largest employer, not only in the Linn-Mar District, but in the Cedar Rapids metro area. Rockwell Collins produces advanced communications and aviation electronics for both government and commercial customers. The company is a leading supplier of commercial and military aviation electronics and communications systems. Rockwell Collins currently employs approximately 8,700 people in the Cedar Rapids / Iowa City Corridor and continues to expand their facilities throughout the Cedar Rapids Community. Rockwell Collins has been and will continue to have the state’s largest technical workforce. The company also prides itself in the partnerships they have established with the local school districts in the area. The District’s facilities are in average-to-good condition. The oldest building, which opened in 1948 and has several additions, was repurposed in 2010 to house the central administrative offices, the district’s alternative HS program, and the district’s home school assistance program. Four facilities were initially built between 1959 and 1968. Each has had several additions over the years. The five remaining school sites were built between 1995 and 2010. The Transportation and Operations & Maintenance facility was completed in 2010. In 2013, construction was completed on a district Aquatic Center. The financial solvency ratio of the District measures movement and distribution of current assets. The financial solvency ratio represents a school district’s year-end position after payment of all current and outstanding or accrued liabilities. Iowa Association of School Boards recommends a target solvency ratio within a range of 5% to 15%. Since fiscal year 2008 the District has maintained a solvency ratio within this defined range, with a peak solvency ratio of 15.83% in the 2012 fiscal year. In fiscal years 2013, 2014 and 2015 the solvency ratio decreased slightly to 15.27%, 13.68% and 11.90% respectively. The current solvency ratio is 11.45%. The State set the supplemental state aid growth rate at 2.25% for the 2017 fiscal year. However, future supplemental state aid beyond fiscal year 2017 is not known. Despite this unknown, Linn-Mar continues to realize steady enrollment growth and the District will thoughtfully plan its budget in order to maintain a solvency ratio and unspent balance ratio that is within the target range of 5% to 15%. Linn-Mar continues to see steady residential growth. In the City of Marion during the 2015 calendar year, 202 new single-family dwelling building permits were issued at a valuation of $26,212,686 and 13 new multi-family dwelling unit permits were issued at a valuation of $11,019,666. District Major Initiative and Achievements The staff, board, students, and community members are to be commended for making the 2015-2016 school year a very productive one. Some of the many accomplishments for the year include:
• The District continued construction on a new multi-million dollar renovation and addition of Linn-Mar High School. This project will remodel and enhance many of the instructional spaces within the school, including STEM programs such as industrial technology and family

4
consumer science. The project scope also includes various technology and security upgrades, such as wireless internet and security cameras. This project is scheduled for completion in January 2017.
• Many staff members received local, regional, state and national recognition from various
professional and community organizations for their dedicated work in educating our youth.
• The recording of approximately 24,327 volunteer hours with over 716 volunteers in the District. Volunteers enhance our students’ learning by acting as tutors, reading to kindergarten classrooms, assisting teachers in their classrooms or on field trips, or serving on committees. Last year, 83 volunteers gave more than 100 hours each to our schools.
• The District was recognized for its continued excellence in financial reporting with the receipt
of the District’s twelfth consecutive Certificate of Excellence in Financial Reporting award for the 2014-2015 Comprehensive Annual Financial Report (CAFR).
All of the dedicated work that went into these initiatives and achievements had one main focus: supporting the learning of the District’s students. For the 2015-2016 school year, the students, as a group, continued to perform at a high level. Following are a few indicators:
• Student achievement exceeded the primary goal of one year of growth for each grade span in reading, math and science as measured on ITBS standardize test.
• Students in grades 5-8 met or exceeded their target growth on the NWEA MAP mathematics
test.
• On the ITBS and ITED assessments, the students out-performed the state and nation in the content areas of reading, math, and science, continuing a multi-year tradition.
• Linn-Mar students continue to score higher than both the state and national averages of students that complete the ACT assessment. The 15-16 Linn-Mar Community School District composite ACT score was 24.8 compared to 22.1 for the state.
• The 2015-16 Linn-Mar composite average for Advanced Placement exams was 3.55 compared to 2.92 for the state and 2.87 for the nation.
• Six Linn-Mar students were recognized as National Merit semi-finalists.
Financial Information Management of the District is responsible for establishing and maintaining an internal control structure designed to ensure that the assets of the District are protected from loss, theft, or misuse and to ensure that adequate accounting data are compiled to allow for the preparation of financial statements in conformity with generally accepted accounting principles. The internal control structure is designed to provide reasonable, but not absolute, assurance that these objectives are met. The concept of reasonable assurance recognizes that: (1) the cost of a control should not exceed the benefits likely to be derived; and (2) the evaluation of costs and benefits requires estimates and judgments by management. All internal accounting controls adequately safeguard assets and provide reasonable assurance of proper recording of financial transactions.

5
In addition, the District maintains budgetary controls. The objective of these budgetary controls is to ensure compliance with legal provisions embodied in the annual budget approved by the District’s governing body. Activities of the General Fund, Special Revenue Funds, Enterprise Fund, Debt Service Fund and Capital Projects Fund are included in the annual budget. The level of budgetary control (that is, the level at which expenditures cannot legally exceed the budgeted amount) is established by function and encompasses all fund types. To facilitate the monitoring of the legal provisions, and to provide more complete information to interested parties the District prepares a more detailed budget for each fund. The following information reflects the comprehensive budget for these individual funds rather than demonstrating compliance at the legal level. The District also maintains an encumbrance accounting system as one technique of accomplishing budgetary control. Independent Audit State law and District policy require an annual audit to be made of the books of account, financial records and transactions of all funds of the District by a Certified Public Accountant selected by the Board of Directors of the District. The District has complied with this requirement. The report of the District’s independent accountants, Nolte, Cornman and Johnson, P.C., appears in this report. Their audit of the basic financial statements was performed in accordance with auditing standards generally accepted in the United State of America and, accordingly, included a review of the District’s system of budgetary and accounting controls. Certificate of Excellence in Financial Reporting The Association of School Business Officials International (ASBO), awards a Certificate of Excellence in Financial Reporting. This certificate is a prestigious national award recognizing conformance with the highest standards for preparation of government financial reports. In order to be eligible to receive the Certificate, a governmental unit must publish an easily readable and efficiently organized Comprehensive Annual Financial Report, (CAFR) whose contents conform to program standards. Such CAFR must satisfy both Generally Accepted Accounting Principles and applicable legal requirements. This Certificate is valid for a period of one year only. The District believes that the current CAFR conforms to the requirements for the Certificate of Excellence and therefore, is submitting to ASBO to determine its eligibility for the Certificate. Acknowledgements The publication of this report is a major step toward the commitment to professionalism in financial reporting and significantly increases the accountability of the District to the taxpayers. This would not have been possible without the help of several people. We would like to express our appreciation to all District, City and County employees who assisted in the preparation of this report. Finally, sincere appreciation is extended to the Board of Education, where commitment to excellence begins. It is with great pleasure that this year’s Comprehensive Annual Financial Report is submitted to the Board of Education.

J.T. Anderson Chief Operating Officer Chief Financial Officer
Dr. Quintin Shepherd Superintendent of Schools
6
The Certificate of Excellence in Financial Reporting Award is presented to
Linn-Mar Community School District
for its Comprehensive Annual Financial Report (CAFR) for the Fiscal Year Ended June 30, 2015.
The CAFR has been reviewed and met or exceeded ASBO International’s Certificate of Excellence standards.
Brenda R. Burkett, CPA, CSBA, SFO John D. Musso, CAE, RSBA President Executive Director
7
2015-1
6 O
RG
AN
IZA
TIO
NA
L C
HA
RT
BO
AR
D O
F E
DU
CA
TIO
N
Su
peri
nte
nd
en
t -
Qu
inti
n S
hep
her
d
Ad
min
Ass
t (1
.5)
Gayla
& J
essi
(.5
)
Ad
min
Ass
t (.
5)
Sar
ah O
ffer
man
Ad
min
Ass
t (1
)
Ali
son
Vis
EL
L (
4)
Sar
ah K
elle
y
Lis
a K
lein
Ali
cia
Jess
en
Mar
gar
et S
hort
er
Stu
den
t A
ssis
tan
ce (
6)
Sta
cia
Wal
ker
Man
dy B
ark
er
Kev
in M
cCau
ley
Lis
a M
oon
ey
Mik
e S
hip
ley
Jess
ica
Dea
hl
Nu
rse
s (5
)
An
na
Str
and
Sh
eri
Sto
ckm
aste
r
Mar
ilyn
Cal
cara
N
ancy
Kle
itsc
h
Lyn
n O
’Bri
en (
.5)
K’D
ean
Du
nn
wal
d (
.5)
Ad
min
Ass
t (1
) K
aren
Wil
son
Ass
oc P
rin
cip
al/
Ath
leti
c D
ir
(8)
Kim
Bu
elt,
Mar
k H
utc
hes
on
,
Du
ane
Orr
, S
teve
Sta
rkey
, Ja
nel
le S
teic
hen
, T
ravis
Axee
n,
Sco
tt M
ahm
ens,
Ton
ya
Moe
Tea
ch
ing
&
Lea
rn
ing
Dir
ecto
rs
(5)
Kri
sti
Hic
ks
Ch
rist
ine
McS
wee
ney
K
elly
Kre
tsch
mar
Bob
Rea
d
Jeff
Fro
st
Tra
nsp
ort.
Ma
nag
er
Bri
an C
ruis
e
Nu
trit
ion
Servic
es
Ma
nag
er
Su
san
Kn
ight
O &
M
Ma
nag
er
Ste
ve
Nel
son
Poo
l C
en
ter
Tech
nic
ian
s
(2)
Aq
ua
tic C
en
ter
Ma
nag
er
Bobb
y K
elle
y
Bu
sin
ess
Off
ice (
3.5
)
San
dy C
lab
ou
gh
Kat
ie W
edek
ing
Sta
cey W
alk
er
Mic
hel
le D
iest
ler
Execu
tive
Dir
ecto
r
Su
pp
ort
Ser
vic
es
Ric
k I
ron
sid
e B
usi
ness
Ma
nag
er
Boa
rd
Secr
eta
ry
An
gie
Morr
ison
Ch
ief
Fin
an
cia
l
Off
icer
Chi
ef O
pera
ting
Off
icer
JT A
nd
erso
n
Ass
oci
ate
Su
per
inte
nd
en
t
Ch
ief
Acad
em
ic O
ffic
er
Sh
anno
n B
isgar
d
Co
mm
un
ica
tio
ns
& M
ed
ia
Rela
tio
ns
Coo
rd
ina
tor (
.5)
San
die
Roh
rer
Co
mm
un
ity
Rela
tio
ns
Co
ord
ina
tor
(1)
Kar
la T
erry
Execu
tive
Dir
ecto
r
Hu
ma
n R
eso
urce
s
Kar
la C
hri
stia
n
Execu
tive
Dir
ecto
r
Stu
den
t S
ervic
es
Lei
sa B
reit
feld
er
Execu
tive
Dir
ecto
r
Tech
no
log
y
Jeri
Ram
os
Bu
ild
ing P
rin
cip
als
(1
0)
Tin
a M
on
roe,
Dan
Lu
dw
ig,
Mar
ilee
McC
onn
ell,
Ch
ad B
uch
holz
, C
arol
O’D
on
nel
l, E
d R
oger
s, P
am S
chu
lz,
Joh
n
Ch
rist
ian
, E
rica
Rau
sch
, Je
ff G
ust
ason
HR
Gen
erali
st (
3)
Ph
il M
ille
r H
eath
er J
ord
an
Cat
hy G
auger
Certi
fied
Sta
ff
Cla
ssif
ied
Sta
ff
Cu
sto
dia
l
Sta
ff
Secre
tari
es
NS
Co
ord
(1
)
Cat
hy B
erggre
n
To
tal
Access
Ma
nag
er
(1)
Ruth
Noth
NS
Sta
ff
O &
M
Dep
t.
(12
)
Gro
un
ds
Su
pv
Jam
ie J
ohn
son
HV
AC
Su
pv
Bil
l H
osk
ins
Secre
tary
(1
)
Bre
Hin
der
s S
ecre
tary
(1)
Deb
Ste
war
d
Dis
pa
tch
er
Bre
nt
Wil
fon
g
Mech
an
ics
(2)
Driv
ers
(38
.5)
Rid
ers
(10
)
Hel
per
s
(2)
SA
Ms
(7)
Val
Law
ren
ce,
Ter
esa
Gar
cia
Mau
rice
Fra
zier
, A
nd
y
Ku
emp
el,
Ryan
Phil
lip
s
Lyn
ette
Sti
ckn
ey,
Lis
a S
ilver
Co
nsu
lta
nt
Au
tism
(1
)
Kel
ly T
rier
Recep
tio
nis
t (1
)
Cas
ey F
asse
liu
s
Tech
nic
ian
s (4
)
Ph
il B
row
n
Daw
n C
ook
sley
Kev
in F
ry
Ben
San
der
s
Ad
min
. A
sst
(1)
Lou
ann
e L
awso
n Secre
tary
(1
)
Dia
nn
e V
an P
raag
Ad
min
. A
sst
(.5
)
Sar
ah O
ffer
man
Tea
ch
er L
ead
ersh
ip
Prog
ram
Co
ord
(2
)
Deb
ra B
arry
, E
rin
Wat
ts
Tea
ch
er L
ead
ersh
ip R
elea
se P
osi
tion
s (2
1)
Car
ol
Kes
l, J
enn
ie L
ore
nze
n,
Su
e A
twat
er,
Ryan
Gott
o,
Kar
la K
oen
en,
Jess
ica
Zim
mer
man
, T
odd
Lan
e, D
ana
Lam
pe,
Bet
h H
ayes
, S
ym
on
San
born
, T
erri
Str
eich
er,
Lau
ra R
ob
erts
on
, S
ara
Hofe
r, T
iffa
ny K
inze
nb
aw,
Kim
Op
hoff
, Jo
Nel
Boek
hoff
, L
ori
Man
ley,
CJ
McD
on
ald
, N
icole
Red
ingto
n,
Sh
eri
Cra
nd
all,
Tin
a O
ber
bro
eck
lin
g
Aq
ua
tic C
en
ter
Ass
t M
an
ag
er
Par
ker
Cra
w
Sy
stem
s E
ng
ineer
Rod
Sco
tt
Pro
ject
Ma
nag
er/A
dm
in
Chad
Sch
um
ach
er
8

9
LINN-MAR COMMUNITY SCHOOL DISTRICT
BOARD OF EDUCATION AND SCHOOL DISTRICT ADMINISTRATION
Year Ended June 30, 2016
Board of Education
Term/ContractTitle Expires
(Before September 2015 Election)
Tim Isenberg President September, 2015Barry Buchholz Vice President September, 2015Tina Patterson Director September, 2017Elizabeth Wilson Director September, 2015Rene Gadelha Director September, 2017Todd Hutcheson Director September, 2017Robert Crawford Director September, 2015
(After September 2015 Election)
Tim Isenberg President September, 2019Tina Patterson Vice President September, 2017Rene Gadelha Director September, 2017Todd Hutcheson Director September, 2017George Abouassaly Director September, 2019Sondra Nelson Director September, 2019Clark Weaver Director September, 2019
School Officials
Dr. Quintin Shepherd Superintendent 2016
J.T. Anderson Chief Operating Officer/Chief Financial Officer 2016
Angie Morrison Business Manager/Board Secretary 2016
Terry Abernathy Attorney Indefinite
Simmons Perrine Moyer Bergman PC Attorney Indefinite
Ahlers & Cooney Attorney Indefinite

10
LINN-MAR COMMUNITY SCHOOL DISTRICT
11
NOLTE, CORNMAN & JOHNSON, P.C. Certified Public Accountants (a professional corporation)
117 West 3rd Street North, Newton, Iowa 50208-3040 Telephone (641) 792-1910
INDEPENDENT AUDITOR’S REPORT To the Board of Education of Linn-Mar Community School District: Report on the Financial Statements We have audited the accompanying financial statements of the governmental activities, the business type activities, each major fund and the aggregate remaining fund information of the Linn-Mar Community School District, Marion, Iowa as of and for the year ended June 30, 2016, and the related Notes to Financial Statements, which collectively comprise the District’s basic financial statements listed in the table of contents. Management’s Responsibility for the Financial Statements Management is responsible for the preparation and fair presentation of these financial statements in accordance with U.S. generally accepted accounting principles. This includes the design, implementation and maintenance of internal control relevant to the preparation and fair presentation of financial statements that are free from material misstatement, whether due to fraud or error. Auditor’s Responsibility Our responsibility is to express opinions on these financial statements based on our audit. We conducted our audit in accordance with U.S. generally accepted auditing standards and the standards applicable to financial audits contained in Government Auditing Standards, issued by the Comptroller General of the United States. Those standards require that we plan and perform the audit to obtain reasonable assurance about whether the financial statements are free from material misstatement. An audit involves performing procedures to obtain audit evidence about the amounts and disclosures in the financial statements. The procedures selected depend on the auditor’s judgment, including the assessment of the risks of material misstatement of the financial statements, whether due to fraud or error. In making those risk assessments, the auditor considers internal control relevant to the District’s preparation and fair presentation of the financial statements in order to design audit procedures that are appropriate in the circumstances, but not for the propose of expressing an opinion of the effectiveness of the District’s internal control. Accordingly, we express no such opinion. An audit also includes evaluating the appropriateness of accounting policies used and the reasonableness of significant accounting estimates made by management, as well as evaluating the overall presentation of the financial statements. We believe the audit evidence we have obtained is sufficient and appropriate to provide a basis for our audit opinions.
Members American Institute & Iowa Society of Certified Public Accountants

12
Opinions In our opinion, the financial statements referred to above present fairly, in all material respects, the respective financial position of the governmental activities, the business type activities, each major fund and the aggregate remaining fund information of the Linn-Mar Community School District as of June 30, 2016, and the respective changes in financial position and, where applicable, cash flows thereof for the year then ended in accordance with U.S. generally accepted accounting principles. Other Matters Required Supplementary Information U.S. generally accepted accounting principles require Management’s Discussion and Analysis, the Budgetary Comparison Information, the Schedule of the District’s proportionate Share of Net Pension Liability, the Schedule of District contributions and the Schedule of Funding Progress for the Retiree Health Plan on pages 15 through 25 and 58 through 63 be presented to supplement the basic financial statements. Such information, although not a part of the basic financial statements, is required by the Governmental Accounting Standards Board which considers it to be an essential part of financial reporting for placing the basic financial statements in an appropriate operational, economic or historical context. We have applied certain limited procedures to the required supplementary information in accordance with U.S. generally accepted auditing standards, which consisted of inquiries of management about the methods of preparing the information and comparing the information for consistency with management’s responses to our inquiries, the basic financial statements and other knowledge we obtained during our audit of the basic financial statements. We do not express an opinion or provide any assurance on the information because the limited procedures do not provide us with sufficient evidence to express an opinion or provide any assurance. Supplementary Information and Statistical Section Our audit was conducted for the purpose of forming opinions on the financial statements that collectively comprise Linn-Mar Community School District’s basic financial statements. We previously audited, in accordance with the standards referred to in the third paragraph of this report, the financial statements for the four years ended June 30, 2015, (which are not presented herein) and expressed unmodified opinions on those financial statements. Another auditor previously audited the financial statements for the five years ended June 30, 2011, (which are not presented herein) and expressed unmodified opinions on those financial statements. The combining and individual fund financial statements and schedules, including the Schedule of Expenditures of Federal Awards required by Title 2, U.S. Code of Federal Regulations, Part 200, Uniform Administrative Requirements, Cost Principles and Audit Requirements for Federal Awards (Uniform Guidance), is presented for purposes of additional analysis and are not a required part of the basic financial statements.
The supplementary information, including the Schedule of Expenditures of Federal Awards, contained in this report is the responsibility of management and was derived from and relates directly to the underlying accounting and other records used to prepare the basic financial statements. Such information has been subjected to the auditing procedures applied in the audit reconciling such information directly to the underlying accounting and other records used to prepare the basic financial statements or to the basic financial statements themselves, and other additional procedures in accordance with U.S. generally accepted auditing standards. In our opinion, the supplementary information, including the Schedule of Expenditures of Federal Awards, is fairly stated in all material respects in relation to the basic financial statements take as a whole.
The statistical section, as listed in the table of contents, is the responsibility of management and is presented for purposes of additional analysis and is not a required part of the basic financial statements. This information has not been subjected to the auditing procedures applied in our audit of the basic financial statements and, accordingly, we express no opinion on it.

13
Other Reporting Required by Government Auditing Standards
In accordance with Government Auditing Standards, we have also issued our report dated November 22, 2016, on our consideration of Linn-Mar Community School District’s internal control over financial reporting and on our tests of its compliance with certain provisions of laws, regulations, contracts and grant agreements and other matters. The purpose of that report is to describe the scope of our testing of internal control over financial reporting and compliance and the results of that testing and not to provide an opinion on the internal control over financial reporting or on compliance. That report is an integral part of an audit performed in accordance with Government Auditing Standards in considering Linn-Mar Community School District’s internal control over financial reporting and compliance. Nolte, Cornman & Johnson, P.C. Newton, Iowa November 22, 2016
5
Other Matters Required Supplementary Information U.S. generally accepted accounting principles require Management’s Discussion and Analysis, the Budgetary Comparison Information and the Schedule of Funding Progress for Retiree Health Plan on pages 7 through 15 and 40 through 42 be presented to supplement the basic financial statements. Such information, although not a part of the basic financial statements, is required by the Governmental Accounting Standards Board which considers it to be an essential part of financial reporting for placing the basic financial statements in an appropriate operational, economic or historical context. We have applied certain limited procedures to the required supplementary information of management about the methods of preparing the information and comparing the information for consistency with management’s responses to our inquiries, the basic financial statements and other knowledge we obtained during our audit of the basic financial statements. We do not express an opinion or provide any assurance on the information because the limited procedures do not provide us with sufficient evidence to express an opinion or provide any assurance. Supplementary Information Our audit was conducted for the purpose of forming opinions on the financial statements that collectively comprise Wayne Community School District’s basic financial statements. We previously audited, in accordance with the standards referred to in the third paragraph of this report, the financial statements for the year ended June 30, 2012 (which is not presented herein) and expressed an unqualified opinion on those financial statements. The supplementary information included in Schedules 1 through 4, is present for purposes of additional analysis and is not a required part of the basic financial statements. The supplementary information is the responsibility of management and was derived from and relates directly to the underlying accounting and other records used to prepare the basic financial statements. Such information has been subjected to the auditing procedures applied in the audit of the basic financial statements and certain additional procedures, including comparing and reconciling such information directly to the underlying accounting and other records used to prepare the basic financial statements or to the basic financial statements themselves, and other additional procedures in accordance with U.S. generally accepted auditing standards. In our opinion, the supplementary information is fairly stated in all material respects in relation to the basic financial statements taken as a whole. Other Reporting Required by Government Auditing Standards In accordance with Government Auditing Standards, we have also issued our report dated January 3, 2014 on our consideration so Wayne Community School District’s internal control over financial reporting and on our tests of its compliance with certain provisions of laws, regulations, contracts and grant agreements and other matters. The purpose of that report is to describe the scope of our testing of internal control over financial reporting and compliance and the results of that testing and not to provide an opinion on the internal control over financial reporting or on compliance. That report is an integral part of an audit per formed accordance with Government Auditing Standards in considering Wayne Community School District’s internal control over financial reporting and compliance. NOLTE, CORNMAN & JOHNSON, P.C. January 3, 2014 Newton, Iowa
14
LINN-MAR COMMUNITY SCHOOL DISTRICT

15
Management Discussion and Analysis This section of the Linn-Mar Community School District’s Comprehensive Annual Financial Report presents its “discussion and analysis” of the District’s financial performance during the fiscal year ending June 30, 2016. The analysis focuses on the District’s financial performance as a whole. Please read it in conjunction with the District’s financial statements, which immediately follow this section.
Financial Highlights
• The District’s total net position for governmental activities was $48,859,879 at June 30, 2016, compared to $42,959,608 at June 30, 2015, an increase of 13.73%.
• At the end of the current fiscal year, the total of assigned and unassigned fund balances in the
general fund was $8,762,447 or 11.45% of total general fund revenues compared to prior year’s total balance of $8,612,834 or 11.90% of total general fund revenues.
• The State of Iowa approved an increase in supplemental state aid of 1.25% for the 2015-2016 school year. The District had an enrollment increase of 202.2 students, which generated $1,859,023 in new money.
Overview of the Financial Statements The audited financial statements of the District consist of three components, which are the following:
• Management Discussion and Analysis
• Basic Financial Statements, which include government-wide financial statements, fund financial statements and notes to financial statements
• Required supplemental section that represents individual statements and schedules
The basic financial statements include two kinds of statements that present different views of the District:
• The first two statements are Government-wide financial statements that provide both short-term and long-term information about the District’s overall financial status.
• The remaining statements are fund financial statements that focus on individual parts of the
District, reporting the District’s operations in more detail than the Government-wide statements.
• The governmental funds statements show how basic services such as regular and special education were financed in the short term as well as what remains for future spending.
• Proprietary funds statements offer short and long-term financial information about the activities
the District operates like businesses, such as food services, aquatic center and ROAR store. The financial statements also include notes that explain some of the information in the statements and provide more detailed data. The statements are followed by a section of required supplementary information that further explains and supports the financial statements with a comparison of the District’s budget for the year, the District’s proportionate share of the net pension liability and related contributions as well as the Schedule of Funding Progress for the Retiree Health Plan which is followed by supplementary information which provides detail about the non-major governmental funds, capital projects accounts, and combining schedules for the non-major enterprise funds.

16
Figure A-1 shows how the various parts of this annual report are arranged and related to one another.
Statements Basic Financial
Analysis Discussion and Management’s
Information Supplementary
Required
Summary Detail
Figure A - 1
Linn-Mar Community School District Annual Financial Report
Statements
wide District - Fund Financial
Financial Notes to the
Statements
Financial Statements

17
Figure A-2 summarizes the major features of the District’s financial statements, including the portion of the District’s activities they cover and the types of information they contain. The remainder of this overview section of management’s discussion and analysis highlights the structure and contents of each of the statements.
Government -Wide Financial Statements
Government-wideStatements Governmental Funds Proprietary Funds
Scope Entire district (except fiduciary funds)
The activities of the district that are not proprietary or fiduciary, such as special education and building maintenance
Activities the district operates similar to private businesses: food service, aquatic center and ROAR store
· Statement of net position · Balance sheet · Statement of net position
· Statement of activities· Statement of revenues, expenditures, and changes in fund balances
· Statement of revenues, expenses and changes in fund net position
· Statement of cash flows
Accounting basis and measurement focus
Accrual accounting and economic resources focus
Modified accrual accounting and current financial resources focus
Accrual accounting and economic resources focus
Type of asset/liability information
Type of deferred outflow / inflow information
Consumption/acquisition of net position that is applicable to a future reporting period
Consumption/ acquisition of fund balance that is applicable to a future reporting period
Consumption/ acquisition of net position that is applicable to a future reporting period
Type of inflow/ outflow information
All revenues and expenses during year, regardless of when cash is received or paid
Revenues for which cash is received during or soon after the end of the year; expenditures when goods or services have been received and the related liability is due during the year or soon thereafter
All revenues and expenses during the year, regardless of when cash is received or paid
All assets and liabilities, both financial and capital, short-term and long-term
Generally assets expected to be used up and liabilities that come due during the year or soon thereafter; no capital assets or long-term liabilities included
All assets and liabilities, both financial and capital, and short-term and long-term
Figure A-2 Major Features of the Government-Wide and Fund Financial Statements
Fund Statements
Required financial statements
18
The Government-wide statements report information about the District as a whole using accounting methods similar to those used by private sector companies. The Statement of Net Position includes all of the District’s assets, deferred outflows of resources, liabilities and deferred inflows of resources, with the difference reported as net position. All of the current year’s revenues and expenses are accounted for in the Statement of Activities regardless of when cash is received or paid. The two Government-wide statements report the District’s net position and how it has changed. Net position is one way to measure the District’s financial health or position.
• Over time, increases or decreases in the District’s net position are an indicator of whether its financial position is improving or deteriorating, respectively.
• To assess the District’s overall health, you need to consider additional non-financial factors such as changes in the District’s property tax base and the condition of school buildings and other facilities.
In the Government-wide financial statements, the District’s activities are divided into two categories:
• Governmental activities: Most of the District’s basic services are included here, such as regular and special education, transportation and administration. Property taxes and state aid finance most of these activities.
• Business type activities: The District charges fees to help it cover the costs of certain services it provides. The District’s food service program, aquatic center and ROAR store would be included here.
Fund Financial Statements The fund financial statements provide more detailed information about the District’s funds, focusing on its most significant or “major” funds - not the district as a whole. Funds are accounting devices the District uses to keep track of specific sources of funding and spending on particular programs.
• Some funds are required by state law and by bond covenants.
• The District establishes other funds to control and manage money for particular purposes, (such as repaying its long-term debts) or to show that it is properly using certain revenues, (such as federal grants).
The District has two kinds of funds:
• Governmental funds: Most of the District’s basic services are included in governmental funds, which generally focus on (1) how cash and other financial assets that can readily be converted to cash flow in and out and (2) the balances left at year-end that are available for spending. Consequently, the governmental funds statements provide a detailed short-term view that helps the reader determine whether there are more or fewer financial resources that can be spent in the near future to finance the District’s programs. Because this information does not encompass the additional long-term focus of the Government-wide statements, additional information in the notes to financial statements explains the relationship (or differences) between them.
• Proprietary funds: Services for which the District charges a fee are generally reported in proprietary funds. Proprietary funds are reported in the same way as the Government-wide statements. The District’s enterprise funds (one type of proprietary fund) are the same as its business-type activities but provide more detail and additional information, such as cash flows.
Reconciliations between the government-wide financial statements and the fund financial statements follow the fund financial statements.
19
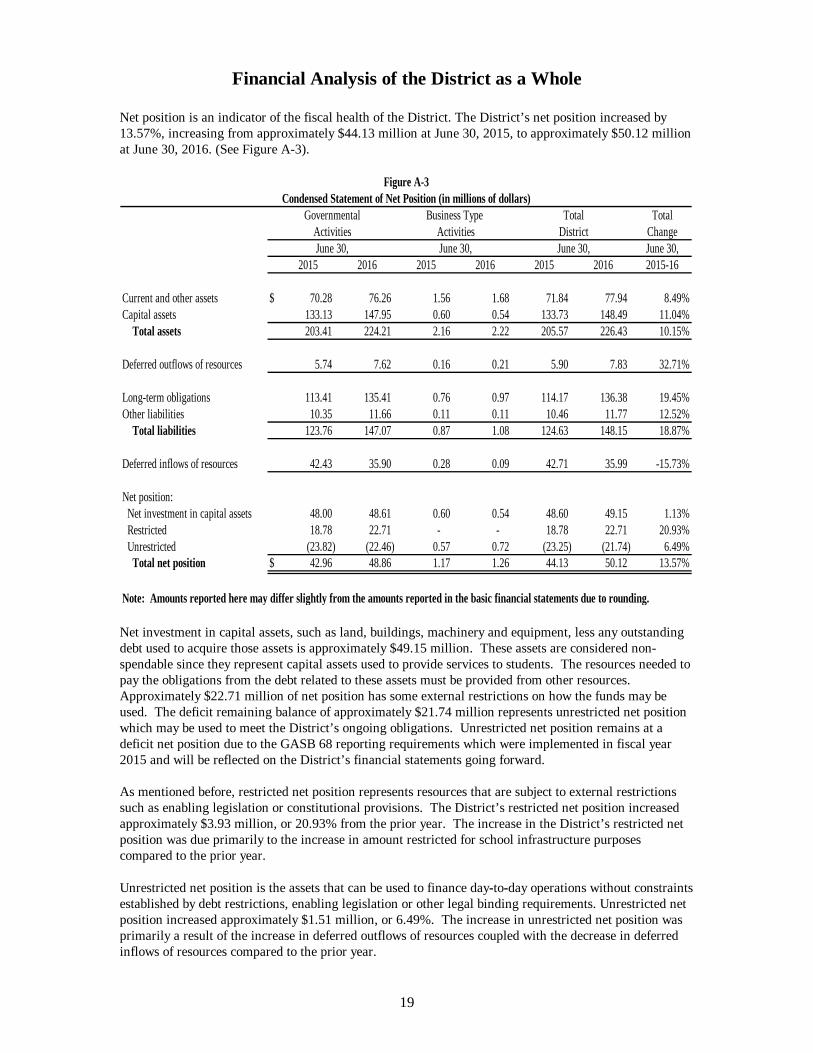
Financial Analysis of the District as a Whole Net position is an indicator of the fiscal health of the District. The District’s net position increased by 13.57%, increasing from approximately $44.13 million at June 30, 2015, to approximately $50.12 million at June 30, 2016. (See Figure A-3).
Figure A-3Condensed Statement of Net Position (in millions of dollars)
Governmental Business Type Total TotalActivities Activities District ChangeJune 30, June 30, June 30, June 30,
2015 2016 2015 2016 2015 2016 2015-16
Current and other assets $ 70.28 76.26 1.56 1.68 71.84 77.94 8.49%Capital assets 133.13 147.95 0.60 0.54 133.73 148.49 11.04% Total assets 203.41 224.21 2.16 2.22 205.57 226.43 10.15%
Deferred outflows of resources 5.74 7.62 0.16 0.21 5.90 7.83 32.71%
Long-term obligations 113.41 135.41 0.76 0.97 114.17 136.38 19.45%Other liabilities 10.35 11.66 0.11 0.11 10.46 11.77 12.52% Total liabilities 123.76 147.07 0.87 1.08 124.63 148.15 18.87%
Deferred inflows of resources 42.43 35.90 0.28 0.09 42.71 35.99 -15.73%
Net position: Net investment in capital assets 48.00 48.61 0.60 0.54 48.60 49.15 1.13% Restricted 18.78 22.71 - - 18.78 22.71 20.93% Unrestricted (23.82) (22.46) 0.57 0.72 (23.25) (21.74) 6.49% Total net position $ 42.96 48.86 1.17 1.26 44.13 50.12 13.57%
Note: Amounts reported here may differ slightly from the amounts reported in the basic financial statements due to rounding. Net investment in capital assets, such as land, buildings, machinery and equipment, less any outstanding debt used to acquire those assets is approximately $49.15 million. These assets are considered non-spendable since they represent capital assets used to provide services to students. The resources needed to pay the obligations from the debt related to these assets must be provided from other resources. Approximately $22.71 million of net position has some external restrictions on how the funds may be used. The deficit remaining balance of approximately $21.74 million represents unrestricted net position which may be used to meet the District’s ongoing obligations. Unrestricted net position remains at a deficit net position due to the GASB 68 reporting requirements which were implemented in fiscal year 2015 and will be reflected on the District’s financial statements going forward. As mentioned before, restricted net position represents resources that are subject to external restrictions such as enabling legislation or constitutional provisions. The District’s restricted net position increased approximately $3.93 million, or 20.93% from the prior year. The increase in the District’s restricted net position was due primarily to the increase in amount restricted for school infrastructure purposes compared to the prior year. Unrestricted net position is the assets that can be used to finance day-to-day operations without constraints established by debt restrictions, enabling legislation or other legal binding requirements. Unrestricted net position increased approximately $1.51 million, or 6.49%. The increase in unrestricted net position was primarily a result of the increase in deferred outflows of resources coupled with the decrease in deferred inflows of resources compared to the prior year.

20
The following figure shows changes in net position for the year ended June 30, 2016, compared to the year ended June 30, 2015. (See Figure A-4).
Figure A-4Changes in Net Position (in millions of dollars)
Governmental Business Type Total TotalActivities Activities District Change
2015 2016 2015 2016 2015 2016 2015-16Revenues: Program revenues: Charges for service $ 5.61 6.42 2.41 2.47 8.02 8.89 10.85% Operating grants, contributions and restricted interest 5.99 6.05 1.17 1.23 7.16 7.28 1.68% Capital grants,contributions and restricted interest 0.01 0.02 - - 0.01 0.02 100.00% General revenues: Property tax 31.09 32.23 - - 31.09 32.23 3.67% Statewide sales, services and use tax 6.59 6.81 - - 6.59 6.81 3.34% Unrestricted state grants 39.05 41.33 - - 39.05 41.33 5.84% Unrestricted investment earnings 0.08 0.10 - - 0.08 0.10 25.00% Other 0.59 0.53 - - 0.59 0.53 -10.17%Total revenues 89.01 93.49 3.58 3.70 92.59 97.19 4.97%
Program expenses: Instruction 48.14 51.17 - - 48.14 51.17 6.29% Support services 24.11 26.07 0.07 0.10 24.18 26.17 8.23% Non-instructional programs 0.13 0.13 3.20 3.51 3.33 3.64 9.31% Other expenses 9.74 10.22 - - 9.74 10.22 4.93%Total expenses 82.12 87.59 3.27 3.61 85.39 91.20 6.80%
Excess of revenues over expenditues before special item 6.89 5.90 0.31 0.09 7.20 5.99 -16.81%
Special ItemLoss on sale of real property 0.02 - - - 0.02 - -100.00%
Change in net position 6.87 5.90 0.31 0.09 7.18 5.99 -16.57%
Net position beginning of year 36.09 42.96 0.86 1.17 36.95 44.13 19.43%
Net position end of year $ 42.96 48.86 1.17 1.26 44.13 50.12 13.57%
Note: Amounts reported here may differ slightly from the amounts reported in the basic financial statements due to rounding.
In fiscal year 2016, property tax and unrestricted state grants accounted for 78.68 percent of governmental activities revenue while charges for service and operating grants, contributions and restricted interest accounted for all of business type activities revenue. The District as a whole experienced a 4.97 percent increase in operating revenue while experiencing a 6.80 percent increase in expenses. The District’s total revenue was approximately $97.19 million of which $93.49 million was for governmental activities, while the remaining $3.70 million was for business-type activities. Property taxes and unrestricted state grants account for most of the district’s revenue, with each contributing approximately 33 percent and 43 percent respectively of the total dollars raised, (See Figure A-5).

21
9.15%7.48%
0.02%
33.16%
7.01%
42.52%
0.11% 0.55%
Total Revenues for FY 16 Figure A-5
Charges for Service
Operating grants, contributions
Capital grants, contributions
Property Tax
Statewide sales, services and use tax
Unrestricted state grants
Unrestricted investment earning
Other revenues
The total cost for all programs and services increased 6.80 percent to $91.20 million. The District’s total expenses are listed in Figure A-6. The chart shows that the majority of the District’s expenses (67.13%) are devoted to instruction and student instructional services. Another 3.02 percent is spent on transporting students safely to and from school and on extra-curricular events.
56.11%
11.02%
7.54%
7.13%
3.02%
3.99% 11.21%
Total Expenses for FY 16 Figure A-6
Instruction
Student & Instructional
Administrative & Business
Operation & Maintenance
Transportaton
Non-Instructional
Other Expenses
22
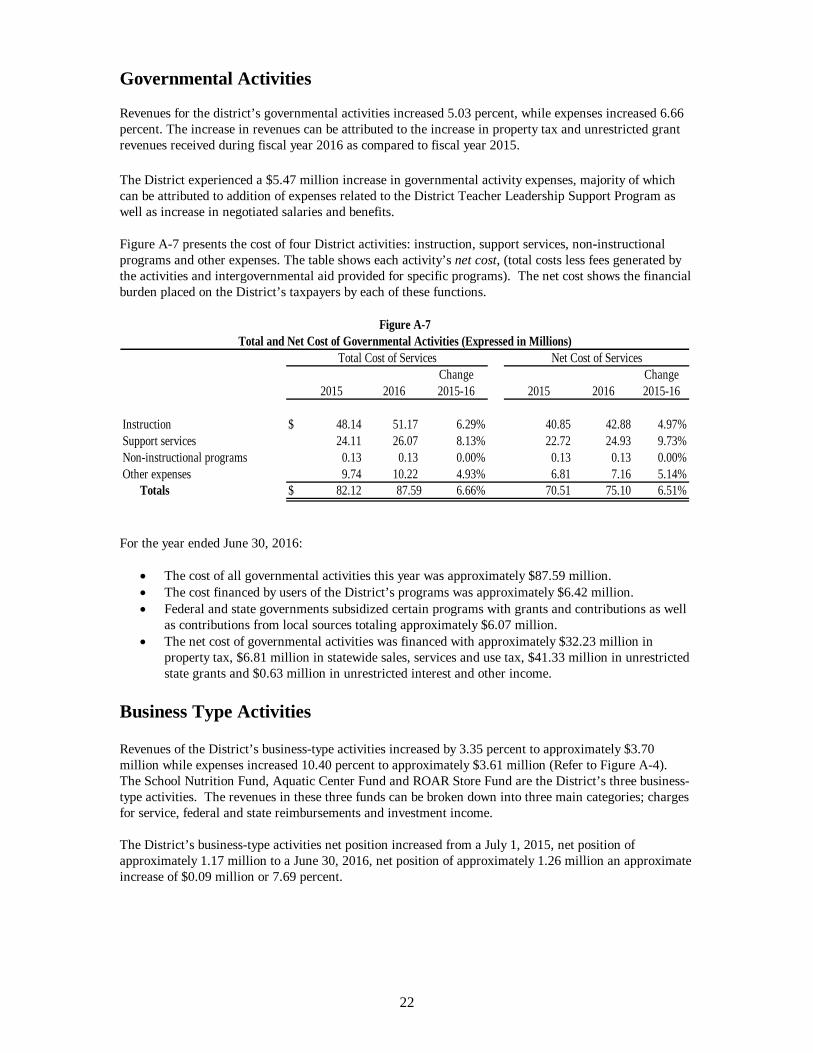
Governmental Activities Revenues for the district’s governmental activities increased 5.03 percent, while expenses increased 6.66 percent. The increase in revenues can be attributed to the increase in property tax and unrestricted grant revenues received during fiscal year 2016 as compared to fiscal year 2015. The District experienced a $5.47 million increase in governmental activity expenses, majority of which can be attributed to addition of expenses related to the District Teacher Leadership Support Program as well as increase in negotiated salaries and benefits. Figure A-7 presents the cost of four District activities: instruction, support services, non-instructional programs and other expenses. The table shows each activity’s net cost, (total costs less fees generated by the activities and intergovernmental aid provided for specific programs). The net cost shows the financial burden placed on the District’s taxpayers by each of these functions.
Figure A-7Total and Net Cost of Governmental Activities (Expressed in Millions)
Total Cost of Services Net Cost of ServicesChange Change
2015 2016 2015-16 2015 2016 2015-16
Instruction $ 48.14 51.17 6.29% 40.85 42.88 4.97%Support services 24.11 26.07 8.13% 22.72 24.93 9.73%Non-instructional programs 0.13 0.13 0.00% 0.13 0.13 0.00%Other expenses 9.74 10.22 4.93% 6.81 7.16 5.14% Totals $ 82.12 87.59 6.66% 70.51 75.10 6.51%
For the year ended June 30, 2016:
• The cost of all governmental activities this year was approximately $87.59 million. • The cost financed by users of the District’s programs was approximately $6.42 million. • Federal and state governments subsidized certain programs with grants and contributions as well
as contributions from local sources totaling approximately $6.07 million. • The net cost of governmental activities was financed with approximately $32.23 million in
property tax, $6.81 million in statewide sales, services and use tax, $41.33 million in unrestricted state grants and $0.63 million in unrestricted interest and other income.
Business Type Activities Revenues of the District’s business-type activities increased by 3.35 percent to approximately $3.70 million while expenses increased 10.40 percent to approximately $3.61 million (Refer to Figure A-4). The School Nutrition Fund, Aquatic Center Fund and ROAR Store Fund are the District’s three business-type activities. The revenues in these three funds can be broken down into three main categories; charges for service, federal and state reimbursements and investment income. The District’s business-type activities net position increased from a July 1, 2015, net position of approximately 1.17 million to a June 30, 2016, net position of approximately 1.26 million an approximate increase of $0.09 million or 7.69 percent.

23
Financial Analysis of the District’s Funds Governmental Fund Highlights At the end of fiscal year 2016, the District’s governmental funds reported combined ending fund balances of $32,720,361 an increase of approximately $3.99 million from the prior year. A closer look at each individual major governmental fund reveals the following:
• The General Fund balance decreased from approximately $10.41 million on June 30, 2015, to $10.13 million on June 30, 2016. Although General Fund revenues increased from the prior year by approximately $4.12 million, General Fund expenditures increased by $3.78 million to counteract this increase in revenues. Total expenditures still outpaced total revenues ensuring a decrease in fund balance at year end.
• The Capital Projects Fund balance increased from approximately $11.96 million on June 30, 2015 to $15.47 million on June 30, 2016. The increase in overall Capital Projects Fund balance can be attributed to the issuance of a $10.00 million revenue bond and $10.00 million capital loan note during the year which were used to finance District construction and building improvement projects during the year. The increase is primarily due to the unspent bond proceeds from these issuances which will be spent in the succeeding fiscal year.
• The Debt Service Fund balance increased from approximately $3.02 million on June 30, 2015, to $4.24 million on June 30, 2016. Revenues and expenditures did not vary significantly from the prior year.
Business Type Fund Highlights This is the eighth year in a row that the District’s business type revenues exceeded expenses. At the close of fiscal year 2016, revenues exceeded expenditures by $91,621. The steps taken by management to control costs include adjusting the staffing model, additional federal grant funds and managing fund expenses has made a difference in the overall financial condition of the nutrition program, the operation of the district’s aquatic center and the Student ROAR store. Budgetary Highlights In accordance with the Code of Iowa, the Board of Education annually adopts a budget following required public notice and hearing for all funds, except its private-purpose trust and agency funds. Although the budget document presents functional area expenditures or expenses by fund, the legal level of control is at the aggregated functional level, not at the fund or fund type level. The budget may be amended during the year utilizing similar statutorily prescribed procedures. The District’s budget is prepared according to U.S. Generally Accepted Accounting Principles. A schedule showing the original and final budget amounts compared to the District’s actual financial activity is included in the required supplementary information section of this report. Since the District does not adopt a budget for individual funds, budgets for the General Fund and major Special Revenue Funds are not presented in the budgetary comparison on page 58. The District’s total actual receipts were $1,655,483 more than budgeted receipts, a variance of 1.73 percent. The main contributing factor to this variance had to do with the District receiving more in local source revenue than was originally budgeted. By April 15th of each year, the budget must be adopted by the Board of Directors for the fiscal year beginning July 1 through June 30, which immediately follows. Because there are a number of unknowns at that time, such as State revenue allocations, insurance premiums, negotiated employee contracts, enrollment increase, and construction project invoicing, the District has the ability to amend its budget before May 31st of each year.

24
In spite of the District’s budgetary practice, expenditures in the instruction functional area exceeded the amount budgeted for fiscal year 2016. Capital Asset Administration By the end of 2016, the District had invested, net of depreciation, approximately $148.49 million in various capital assets including land, buildings, vehicles and equipment (See Figure A-8). This amount represents a net increase of approximately $14.76 million or 11.04 percent over the previous fiscal year. The primary reason for the increase in capital assets for fiscal year 2016 is due to continued expenses associated with District construction projects which will be reclassified upon completion in succeeding fiscal years. Detailed information regarding the District’s capital assets can be found in Note 5 of the notes to financial statements.
Figure A-8Capital Assets, Net of Depreciation (Expressed in Thousands)
Governmental Business Type Total TotalActivities Activities District ChangeJune 30, June 30, June 30, June 30,
2015 2016 2015 2016 2015 2016 2015-16
Land $ 5,262 5,262 - - 5,262 5,262 0.00%Construction in progress 7,019 20,096 7,019 20,096 186.31%Buildings 100,275 102,188 - - 100,275 102,188 1.91%Land improvements 16,474 15,849 - - 16,474 15,849 -3.79%Machinery and equipment 4,099 4,557 603 542 4,702 5,099 8.44% Total $ 133,129 147,952 603 542 133,732 148,494 11.04%
Long-Term Liabilities At year end, the District had approximately $136.39 million in long-term debt, an increase of approximately $22.22 million from the previous fiscal year. Of this amount, $8,273,601 is due within one year. The issuance of $10 million in revenue bond and $10 million in capital loan notes were the primary reasons for the increase in long-term liabilities for fiscal year 2016. Detailed information regarding the District’s long-term debt can be found in Note 6 of the Notes to Financial Statements.
Figure A-9Outstanding Long-Term Obligations(Expressed in Thousands)
TotalChange
June 30, June 30, June 30, June 30,2015 2016 2015 2016 2015 2016 2015-16
General Obligation Bonds $ 35,585 32,335 - - 35,585 32,335 -9.13%Revenue Bonds 49,540 57,010 - - 49,540 57,010 15.08%Capital Loan Notes - 10,000 - - - 10,000 100.00%Termination benefits 382 191 - - 382 191 -50.00%Compensated absences 180 68 - - 180 68 -62.22%Net pension liability 26,615 34,519 727 940 27,342 35,459 29.69%Net OPEB liability 1,105 1,291 30 34 1,135 1,325 16.74% Totals $ 113,407 135,414 757 974 114,164 136,388 19.47%
DistrictTotal
ActivitiesBusiness Type
ActivitiesGovernmental

25
Factors Bearing on the District’s Future At the time these financial statements were prepared and audited, the District was aware of three existing circumstances that could significantly affect its financial health in the future:
• The state has set supplemental state aid at 2.25% for fiscal year 2017. A supplemental state
aid below 4 percent creates significant challenges for schools in Iowa to meet increasing expenditure demands.
• With increasing residential and multi-residential building permits issued and a stable
employer base, the District is expecting annual certified enrollment growth of at least 50 to 100 students for the next several years. Student enrollment is the primary driver of funding for Iowa schools.
• Due to underfunded mandates (e.g. special education) and also a potential voter-approved
capital bond, the District expects that it will have to increase its property tax levy to meet its budgetary obligations.
Contacting the District’s Financial Management This financial report is designed to provide the District’s citizens, taxpayers, customers, investors and creditors with a general overview of the District’s finances and to demonstrate the District’s accountability of the money it receives. If you have questions about this report or need additional financial information, contact the office of the Business Administrator, Linn-Mar Community School District, 2999 10th Street, Marion, Iowa 52302.

26
LINN-MAR COMMUNITY SCHOOL DISTRICT

27
BASIC FINANCIAL STATEMENTS
28
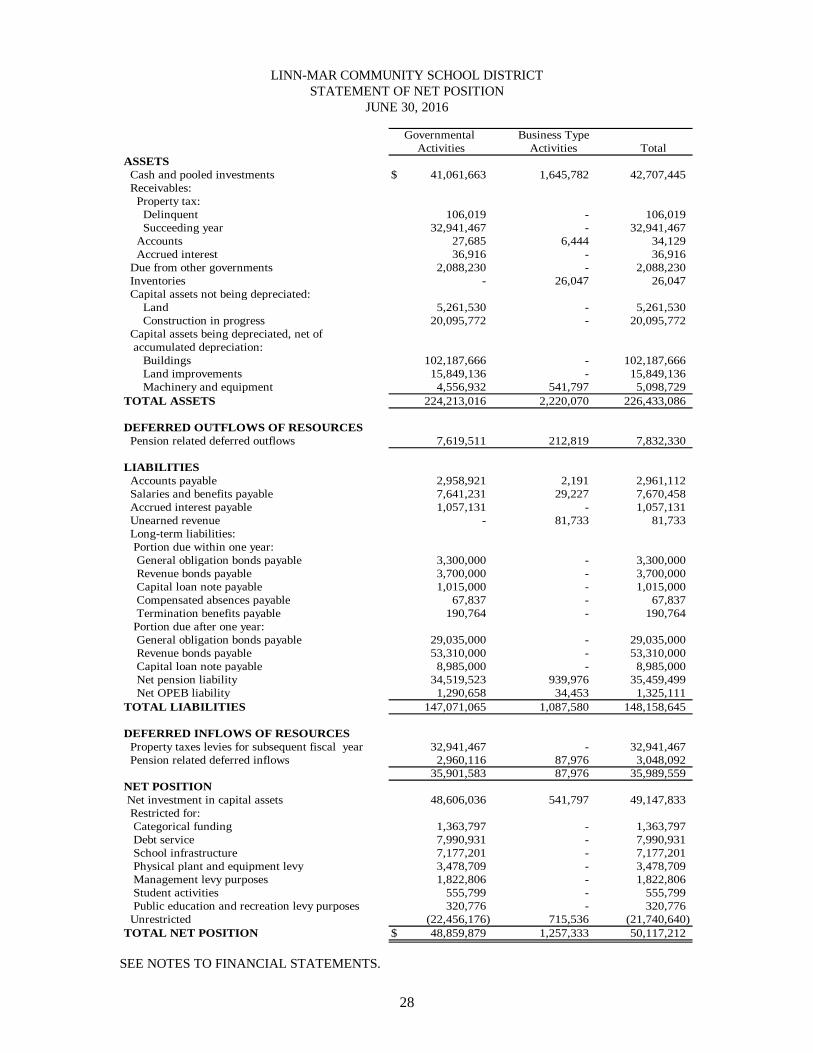
LINN-MAR COMMUNITY SCHOOL DISTRICT STATEMENT OF NET POSITION
JUNE 30, 2016
Governmental Business TypeActivities Activities Total
ASSETS Cash and pooled investments $ 41,061,663 1,645,782 42,707,445 Receivables: Property tax: Delinquent 106,019 - 106,019 Succeeding year 32,941,467 - 32,941,467 Accounts 27,685 6,444 34,129 Accrued interest 36,916 - 36,916 Due from other governments 2,088,230 - 2,088,230 Inventories - 26,047 26,047 Capital assets not being depreciated: Land 5,261,530 - 5,261,530 Construction in progress 20,095,772 - 20,095,772 Capital assets being depreciated, net of accumulated depreciation: Buildings 102,187,666 - 102,187,666 Land improvements 15,849,136 - 15,849,136 Machinery and equipment 4,556,932 541,797 5,098,729 TOTAL ASSETS 224,213,016 2,220,070 226,433,086
DEFERRED OUTFLOWS OF RESOURCES Pension related deferred outflows 7,619,511 212,819 7,832,330
LIABILITIES Accounts payable 2,958,921 2,191 2,961,112 Salaries and benefits payable 7,641,231 29,227 7,670,458 Accrued interest payable 1,057,131 - 1,057,131 Unearned revenue - 81,733 81,733 Long-term liabilities: Portion due within one year: General obligation bonds payable 3,300,000 - 3,300,000 Revenue bonds payable 3,700,000 - 3,700,000 Capital loan note payable 1,015,000 - 1,015,000 Compensated absences payable 67,837 - 67,837 Termination benefits payable 190,764 - 190,764 Portion due after one year: General obligation bonds payable 29,035,000 - 29,035,000 Revenue bonds payable 53,310,000 - 53,310,000 Capital loan note payable 8,985,000 - 8,985,000 Net pension liability 34,519,523 939,976 35,459,499 Net OPEB liability 1,290,658 34,453 1,325,111 TOTAL LIABILITIES 147,071,065 1,087,580 148,158,645
DEFERRED INFLOWS OF RESOURCES Property taxes levies for subsequent fiscal year 32,941,467 - 32,941,467 Pension related deferred inflows 2,960,116 87,976 3,048,092
35,901,583 87,976 35,989,559 NET POSITION Net investment in capital assets 48,606,036 541,797 49,147,833 Restricted for: Categorical funding 1,363,797 - 1,363,797 Debt service 7,990,931 - 7,990,931 School infrastructure 7,177,201 - 7,177,201 Physical plant and equipment levy 3,478,709 - 3,478,709 Management levy purposes 1,822,806 - 1,822,806 Student activities 555,799 - 555,799 Public education and recreation levy purposes 320,776 - 320,776 Unrestricted (22,456,176) 715,536 (21,740,640) TOTAL NET POSITION $ 48,859,879 1,257,333 50,117,212
SEE NOTES TO FINANCIAL STATEMENTS.
29
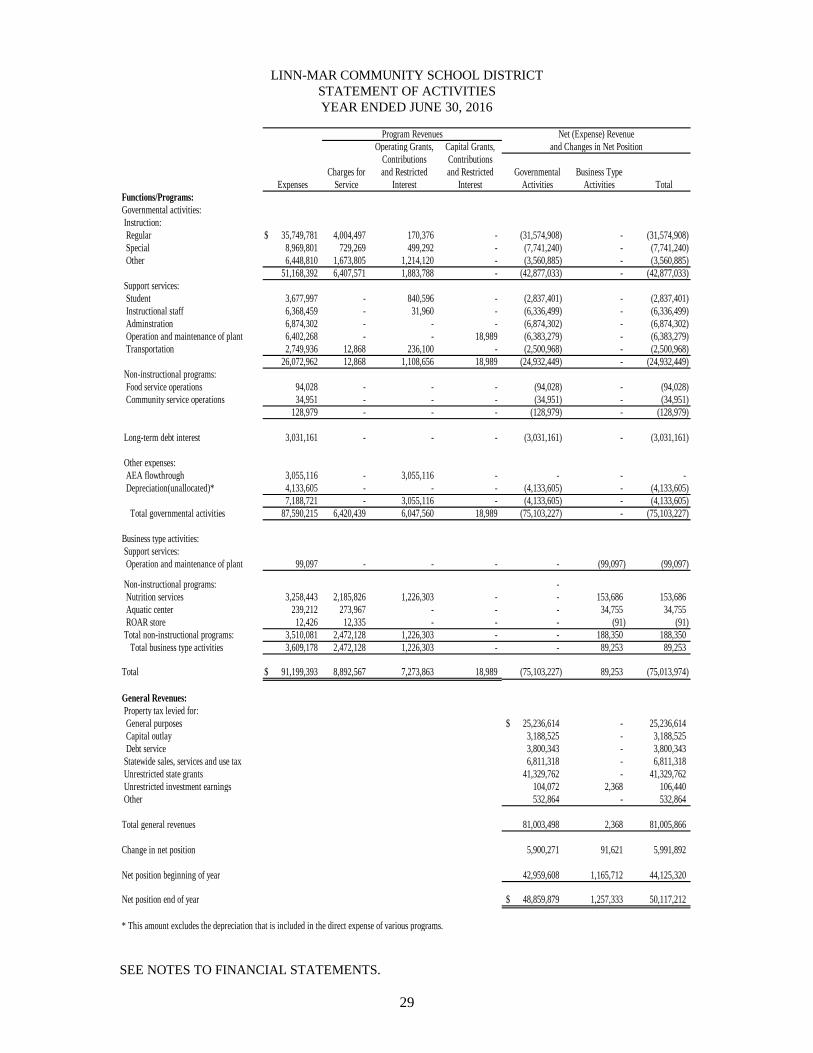
LINN-MAR COMMUNITY SCHOOL DISTRICT STATEMENT OF ACTIVITIES YEAR ENDED JUNE 30, 2016
Program Revenues Net (Expense) RevenueOperating Grants, Capital Grants, and Changes in Net Position
Contributions ContributionsCharges for and Restricted and Restricted Governmental Business Type
Expenses Service Interest Interest Activities Activities TotalFunctions/Programs:Governmental activities: Instruction: Regular $ 35,749,781 4,004,497 170,376 - (31,574,908) - (31,574,908) Special 8,969,801 729,269 499,292 - (7,741,240) - (7,741,240) Other 6,448,810 1,673,805 1,214,120 - (3,560,885) - (3,560,885)
51,168,392 6,407,571 1,883,788 - (42,877,033) - (42,877,033) Support services: Student 3,677,997 - 840,596 - (2,837,401) - (2,837,401) Instructional staff 6,368,459 - 31,960 - (6,336,499) - (6,336,499) Adminstration 6,874,302 - - - (6,874,302) - (6,874,302) Operation and maintenance of plant 6,402,268 - - 18,989 (6,383,279) - (6,383,279) Transportation 2,749,936 12,868 236,100 - (2,500,968) - (2,500,968)
26,072,962 12,868 1,108,656 18,989 (24,932,449) - (24,932,449) Non-instructional programs: Food service operations 94,028 - - - (94,028) - (94,028) Community service operations 34,951 - - - (34,951) - (34,951)
128,979 - - - (128,979) - (128,979)
Long-term debt interest 3,031,161 - - - (3,031,161) - (3,031,161)
Other expenses: AEA flowthrough 3,055,116 - 3,055,116 - - - - Depreciation(unallocated)* 4,133,605 - - - (4,133,605) - (4,133,605)
7,188,721 - 3,055,116 - (4,133,605) - (4,133,605) Total governmental activities 87,590,215 6,420,439 6,047,560 18,989 (75,103,227) - (75,103,227)
Business type activities: Support services: Operation and maintenance of plant 99,097 - - - - (99,097) (99,097)
Non-instructional programs: - Nutrition services 3,258,443 2,185,826 1,226,303 - - 153,686 153,686 Aquatic center 239,212 273,967 - - - 34,755 34,755 ROAR store 12,426 12,335 - - - (91) (91) Total non-instructional programs: 3,510,081 2,472,128 1,226,303 - - 188,350 188,350 Total business type activities 3,609,178 2,472,128 1,226,303 - - 89,253 89,253
Total $ 91,199,393 8,892,567 7,273,863 18,989 (75,103,227) 89,253 (75,013,974)
General Revenues: Property tax levied for: General purposes $ 25,236,614 - 25,236,614 Capital outlay 3,188,525 - 3,188,525 Debt service 3,800,343 - 3,800,343 Statewide sales, services and use tax 6,811,318 - 6,811,318 Unrestricted state grants 41,329,762 - 41,329,762 Unrestricted investment earnings 104,072 2,368 106,440 Other 532,864 - 532,864
Total general revenues 81,003,498 2,368 81,005,866
Change in net position 5,900,271 91,621 5,991,892
Net position beginning of year 42,959,608 1,165,712 44,125,320
Net position end of year $ 48,859,879 1,257,333 50,117,212
* This amount excludes the depreciation that is included in the direct expense of various programs.
SEE NOTES TO FINANCIAL STATEMENTS.

30
LINN-MAR COMMUNITY SCHOOL DISTRICT BALANCE SHEET
GOVERNMENTAL FUNDS JUNE 30, 2016
Capital DebtGeneral Projects Service Nonmajor Total
ASSETS Cash and pooled investments $ 17,609,829 16,274,529 4,224,092 2,953,213 41,061,663 Receivables: Property tax: Delinquent 79,095 10,393 12,386 4,145 106,019 Succeeding year 24,711,671 3,265,527 3,831,910 1,132,359 32,941,467 Accounts 26,062 390 - 1,233 27,685 Accrued interest - 36,916 - - 36,916 Due from other funds 1,749 - - - 1,749 Due from other governments 968,440 1,119,790 - - 2,088,230
TOTAL ASSETS $ 43,396,846 20,707,545 8,068,388 4,090,950 76,263,729
LIABILITIES, DEFERRED INFLOWS OF RESOURCES AND FUND BALANCES Liabilities: Due to other funds $ - - - 1,749 1,749 Accounts payable 935,127 1,974,524 - 49,270 2,958,921 Salaries and benefits payable 7,623,804 - - 17,427 7,641,231 Total liabilities 8,558,931 1,974,524 - 68,446 10,601,901
Deferred inflows of resources: Property taxes levies for subsequent fiscal year 24,711,671 3,265,527 3,831,910 1,132,359 32,941,467
Fund balances: Restricted for:
Categorical funding 1,363,797 - - - 1,363,797 Debt service - 4,811,584 4,236,478 - 9,048,062 School infrastructure - 7,177,201 - - 7,177,201 Physical plant and equipment levy - 3,478,709 - - 3,478,709 Management levy purposes - - - 2,013,570 2,013,570 Student activities - - - 555,799 555,799 Public education and recreation levy purposes - - - 320,776 320,776
Assigned for special specific purposes 445,301 - - - 445,301 Unassigned 8,317,146 - - - 8,317,146 Total fund balances 10,126,244 15,467,494 4,236,478 2,890,145 32,720,361 TOTAL LIABILITIES, DEFERRED INFLOWS OF RESOURCES AND FUND BALANCES $ 43,396,846 20,707,545 8,068,388 4,090,950 76,263,729
SEE NOTES TO FINANCIAL STATEMENTS.
31
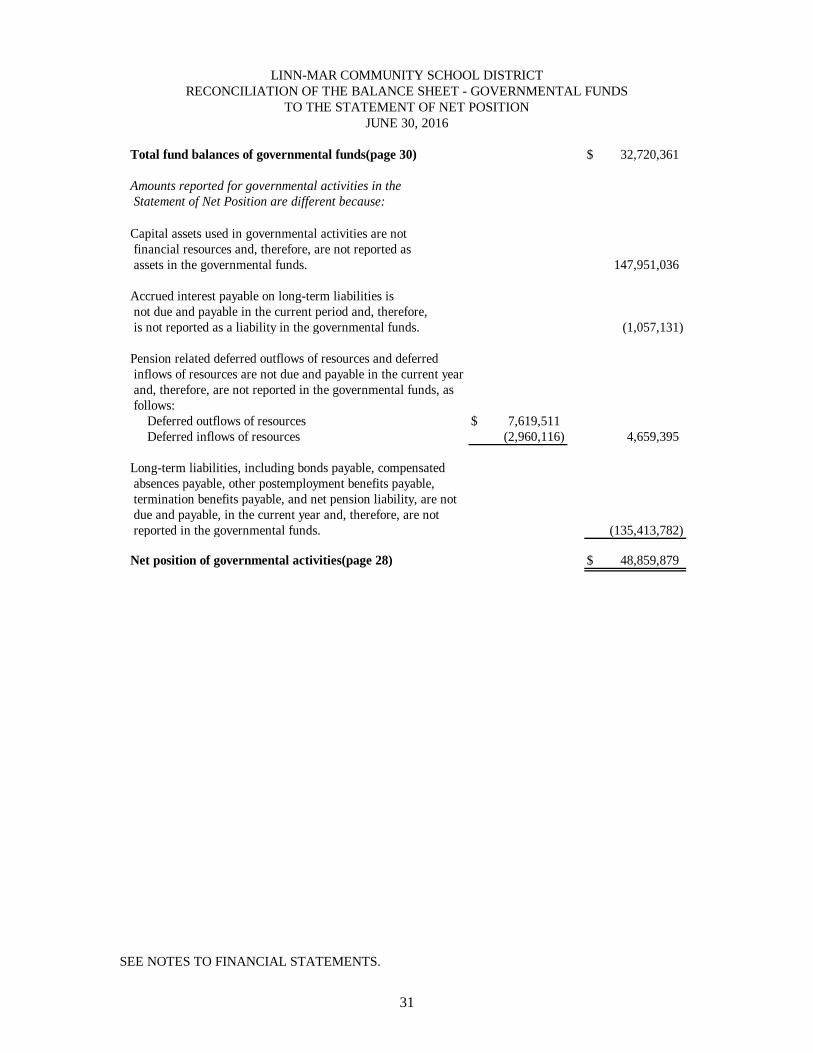
LINN-MAR COMMUNITY SCHOOL DISTRICT RECONCILIATION OF THE BALANCE SHEET - GOVERNMENTAL FUNDS
TO THE STATEMENT OF NET POSITION JUNE 30, 2016
Total fund balances of governmental funds(page 30) $ 32,720,361
Amounts reported for governmental activities in the Statement of Net Position are different because:
Capital assets used in governmental activities are not financial resources and, therefore, are not reported as assets in the governmental funds. 147,951,036
Accrued interest payable on long-term liabilities is not due and payable in the current period and, therefore, is not reported as a liability in the governmental funds. (1,057,131)
Pension related deferred outflows of resources and deferred inflows of resources are not due and payable in the current year and, therefore, are not reported in the governmental funds, as follows: Deferred outflows of resources $ 7,619,511 Deferred inflows of resources (2,960,116) 4,659,395
Long-term liabilities, including bonds payable, compensated absences payable, other postemployment benefits payable, termination benefits payable, and net pension liability, are not due and payable, in the current year and, therefore, are not reported in the governmental funds. (135,413,782)
Net position of governmental activities(page 28) $ 48,859,879
SEE NOTES TO FINANCIAL STATEMENTS.

32
LINN-MAR COMMUNITY SCHOOL DISTRICT STATEMENT OF REVENUES, EXPENDITURES AND CHANGES IN FUND BALANCES
GOVERNMENTAL FUNDS YEAR ENDED JUNE 30, 2016
Capital DebtGeneral Projects Service Nonmajor Total
REVENUES: Local sources: Local tax $ 23,986,903 3,188,525 3,800,343 1,249,711 32,225,482 Tuition 4,266,217 - - - 4,266,217 Other 1,176,948 95,837 8,971 1,562,927 2,844,683 State sources 45,028,110 6,913,538 121,912 41,771 52,105,331 Federal sources 2,048,773 - - - 2,048,773 TOTAL REVENUES 76,506,951 10,197,900 3,931,226 2,854,409 93,490,486
EXPENDITURES: Current: Instruction: Regular 35,695,429 864,602 - 273,932 36,833,963 Special 9,149,720 - - 92,753 9,242,473 Other 5,152,292 - - 1,635,907 6,788,199
49,997,441 864,602 - 2,002,592 52,864,635 Support services: Student 3,670,778 - - 33,976 3,704,754 Instructional staff 5,343,983 10,427 - 27,799 5,382,209 Administration 6,766,748 136,788 - 29,347 6,932,883 Operation and maintenance of plant 5,773,682 209,900 - 583,924 6,567,506 Transportation 2,192,512 444,721 - 144,889 2,782,122
23,747,703 801,836 - 819,935 25,369,474 Non-instructional programs: Food service operations - - - 94,028 94,028 Community service operations - - - 34,951 34,951
- - - 128,979 128,979 Debt service: Principal - - 5,780,000 - 5,780,000 Interest and fiscal charges - - 2,933,691 - 2,933,691
- - 8,713,691 - 8,713,691
Capital outlay - 19,022,983 - 358,453 19,381,436
Intergovernmental: AEA flowthrough 3,055,116 - - - 3,055,116
3,055,116 19,022,983 8,713,691 358,453 31,150,243 TOTAL EXPENDITURES 76,800,260 20,689,421 8,713,691 3,309,959 109,513,331
Deficiency of revenues under expenditures (293,309) (10,491,521) (4,782,465) (455,550) (16,022,845)
OTHER FINANCING SOURCES(USES): Sale of equipment 13,676 - - - 13,676 Transfer in - - 6,001,233 - 6,001,233 Transfer out - (6,001,233) - - (6,001,233) Revenue bond issuance - 10,000,000 - - 10,000,000 Capital loan note issuance - 10,000,000 - - 10,000,000 TOTAL OTHER FINANCING SOURCES(USES) 13,676 13,998,767 6,001,233 - 20,013,676
Change in fund balances (279,633) 3,507,246 1,218,768 (455,550) 3,990,831
Fund balances beginning of year 10,405,877 11,960,248 3,017,710 3,345,695 28,729,530
Fund balances end of year $ 10,126,244 15,467,494 4,236,478 2,890,145 32,720,361
SEE NOTES TO FINANCIAL STATEMENTS.
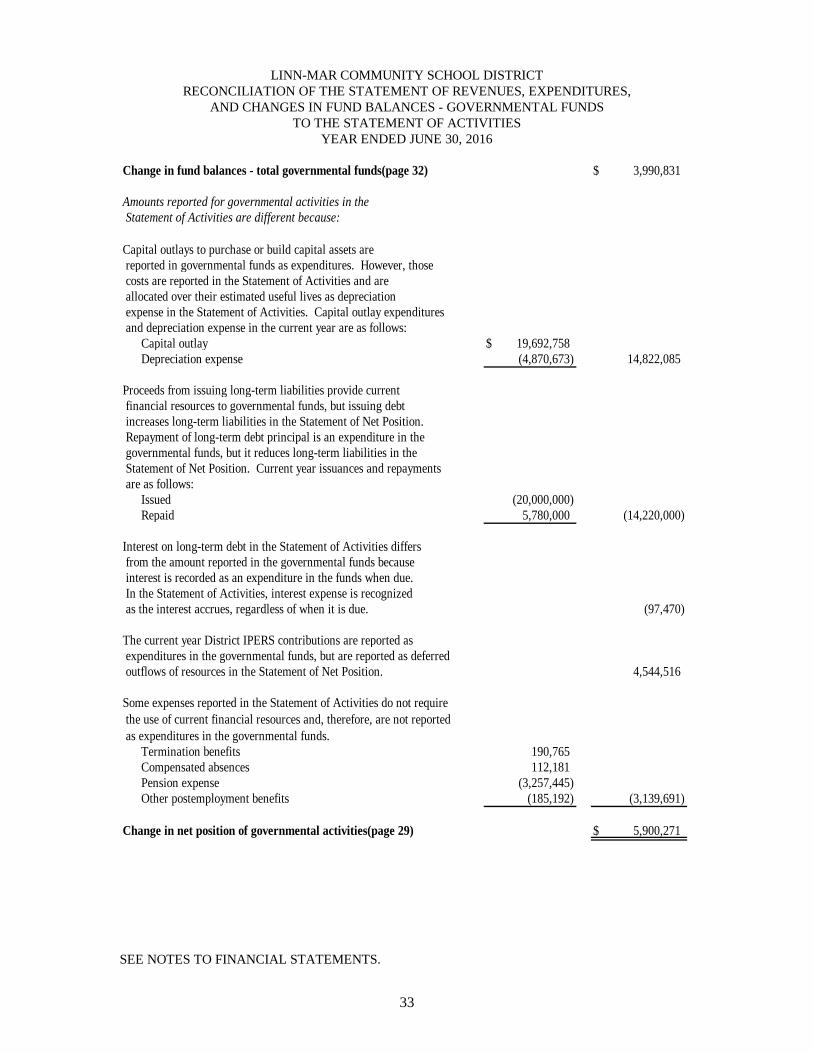
33
LINN-MAR COMMUNITY SCHOOL DISTRICT RECONCILIATION OF THE STATEMENT OF REVENUES, EXPENDITURES,
AND CHANGES IN FUND BALANCES - GOVERNMENTAL FUNDS TO THE STATEMENT OF ACTIVITIES
YEAR ENDED JUNE 30, 2016
Change in fund balances - total governmental funds(page 32) $ 3,990,831
Amounts reported for governmental activities in the Statement of Activities are different because:
Capital outlays to purchase or build capital assets are reported in governmental funds as expenditures. However, those costs are reported in the Statement of Activities and are allocated over their estimated useful lives as depreciation expense in the Statement of Activities. Capital outlay expenditures and depreciation expense in the current year are as follows: Capital outlay $ 19,692,758 Depreciation expense (4,870,673) 14,822,085
Proceeds from issuing long-term liabilities provide current financial resources to governmental funds, but issuing debt increases long-term liabilities in the Statement of Net Position. Repayment of long-term debt principal is an expenditure in the governmental funds, but it reduces long-term liabilities in the Statement of Net Position. Current year issuances and repayments are as follows: Issued (20,000,000) Repaid 5,780,000 (14,220,000)
Interest on long-term debt in the Statement of Activities differs from the amount reported in the governmental funds because interest is recorded as an expenditure in the funds when due. In the Statement of Activities, interest expense is recognized as the interest accrues, regardless of when it is due. (97,470)
The current year District IPERS contributions are reported as expenditures in the governmental funds, but are reported as deferred outflows of resources in the Statement of Net Position. 4,544,516
Some expenses reported in the Statement of Activities do not require the use of current financial resources and, therefore, are not reported as expenditures in the governmental funds. Termination benefits 190,765 Compensated absences 112,181 Pension expense (3,257,445) Other postemployment benefits (185,192) (3,139,691)
Change in net position of governmental activities(page 29) $ 5,900,271
SEE NOTES TO FINANCIAL STATEMENTS.

34
LINN-MAR COMMUNITY SCHOOL DISTRICT STATEMENT OF NET POSITION
PROPRIETARY FUNDS JUNE 30, 2016
ASSETSCurrent assets: Cash and pooled investments $ 1,645,782 Accounts receivable 6,444 Inventories 26,047 Total current assets 1,678,273
Noncurrent assets:Capital assets: Machinery and equipment, net of accumulated depreciation 541,797 TOTAL ASSETS 2,220,070
DEFERRED OUTFLOWS OF RESOURCES Pension related deferred outflows 212,819
LIABILITIESCurrent liabilities: Accounts payable 2,191 Salaries and benefits payable 29,227 Unearned revenues 81,733 Total current liabilities 113,151
Noncurrent liabilities: Net pension liability 939,976 Net OPEB liability 34,453 Total long-term liabilities 974,429 TOTAL LIABILITIES 1,087,580
DEFERRED INFLOWS OF RESOURCES Pension related deferred inflows 87,976
NET POSITION Investment in capital assets 541,797 Unrestricted 715,536 TOTAL NET POSITION $ 1,257,333
Business Type Activities:NonmajorEnterprise
Funds
SEE NOTES TO FINANCIAL STATEMENTS.
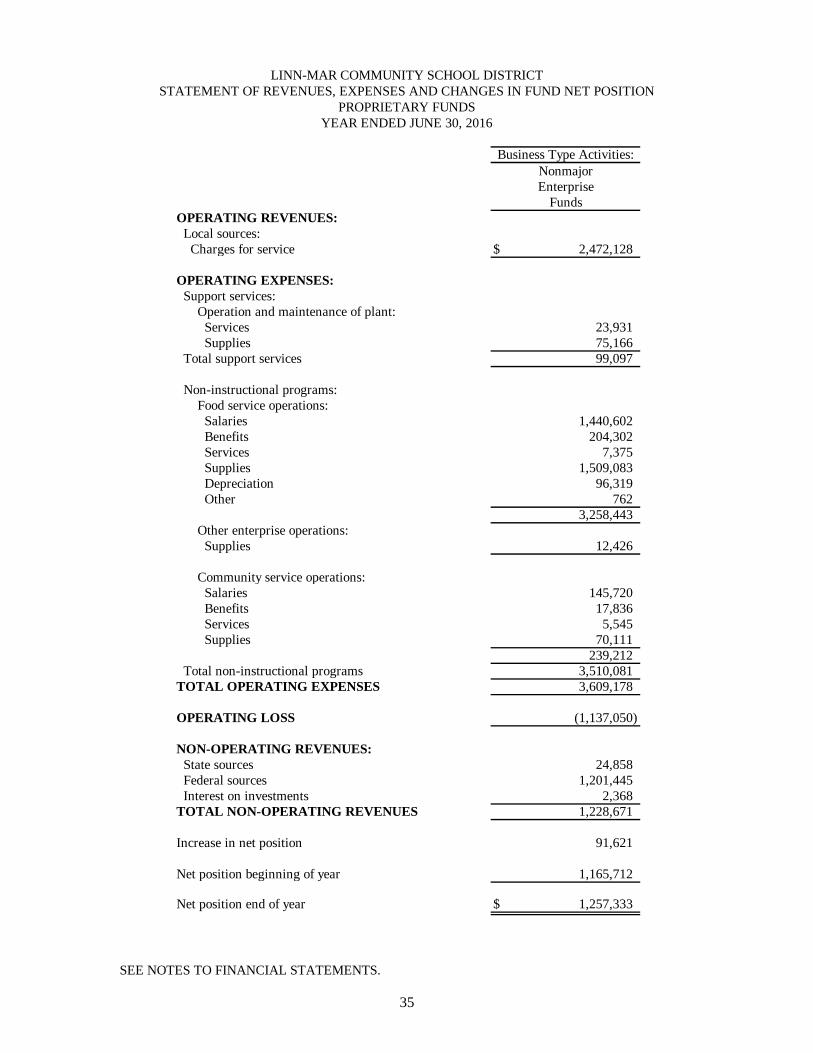
35
LINN-MAR COMMUNITY SCHOOL DISTRICT STATEMENT OF REVENUES, EXPENSES AND CHANGES IN FUND NET POSITION
PROPRIETARY FUNDS YEAR ENDED JUNE 30, 2016
OPERATING REVENUES: Local sources: Charges for service $ 2,472,128
OPERATING EXPENSES: Support services: Operation and maintenance of plant: Services 23,931 Supplies 75,166 Total support services 99,097
Non-instructional programs: Food service operations: Salaries 1,440,602 Benefits 204,302 Services 7,375 Supplies 1,509,083 Depreciation 96,319 Other 762
3,258,443 Other enterprise operations: Supplies 12,426
Community service operations: Salaries 145,720 Benefits 17,836 Services 5,545 Supplies 70,111
239,212 Total non-instructional programs 3,510,081 TOTAL OPERATING EXPENSES 3,609,178
OPERATING LOSS (1,137,050)
NON-OPERATING REVENUES: State sources 24,858 Federal sources 1,201,445 Interest on investments 2,368 TOTAL NON-OPERATING REVENUES 1,228,671
Increase in net position 91,621
Net position beginning of year 1,165,712
Net position end of year $ 1,257,333
Business Type Activities:NonmajorEnterprise
Funds
SEE NOTES TO FINANCIAL STATEMENTS.
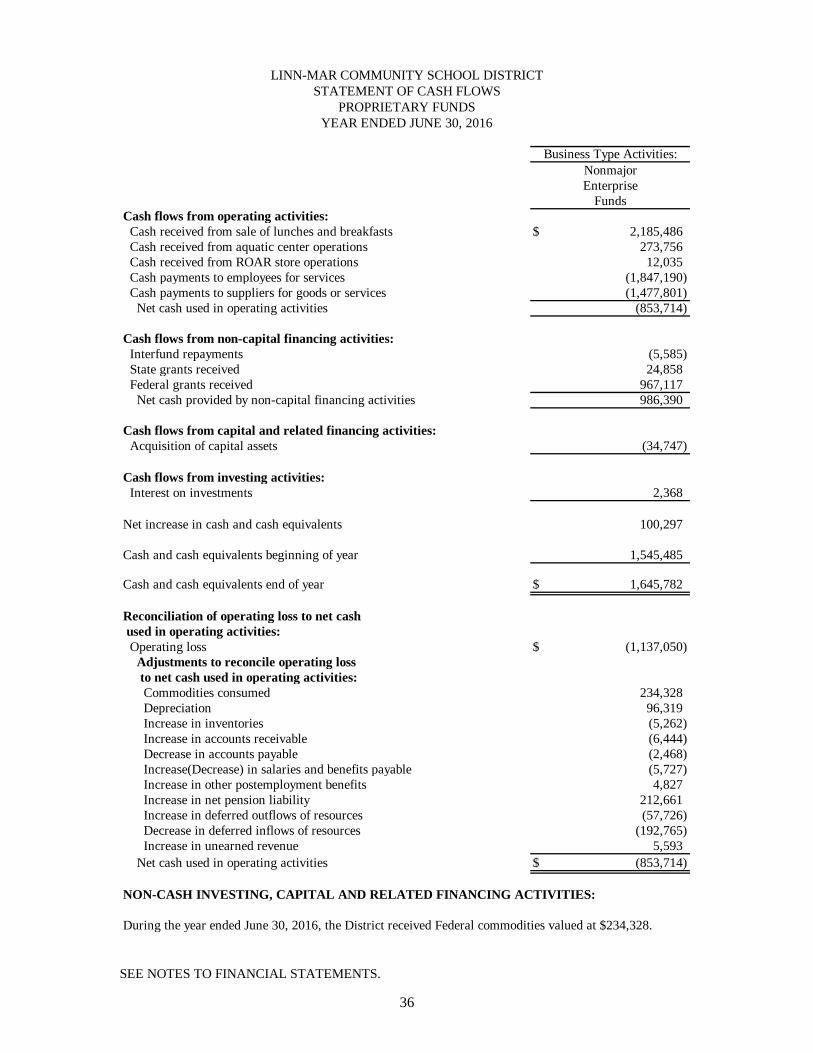
36
LINN-MAR COMMUNITY SCHOOL DISTRICT STATEMENT OF CASH FLOWS
PROPRIETARY FUNDS YEAR ENDED JUNE 30, 2016
Cash flows from operating activities: Cash received from sale of lunches and breakfasts $ 2,185,486 Cash received from aquatic center operations 273,756 Cash received from ROAR store operations 12,035 Cash payments to employees for services (1,847,190) Cash payments to suppliers for goods or services (1,477,801) Net cash used in operating activities (853,714)
Cash flows from non-capital financing activities: Interfund repayments (5,585) State grants received 24,858 Federal grants received 967,117 Net cash provided by non-capital financing activities 986,390 Cash flows from capital and related financing activities: Acquisition of capital assets (34,747)
Cash flows from investing activities: Interest on investments 2,368
Net increase in cash and cash equivalents 100,297
Cash and cash equivalents beginning of year 1,545,485
Cash and cash equivalents end of year $ 1,645,782
Reconciliation of operating loss to net cash used in operating activities: Operating loss $ (1,137,050) Adjustments to reconcile operating loss to net cash used in operating activities: Commodities consumed 234,328 Depreciation 96,319 Increase in inventories (5,262) Increase in accounts receivable (6,444) Decrease in accounts payable (2,468) Increase(Decrease) in salaries and benefits payable (5,727) Increase in other postemployment benefits 4,827 Increase in net pension liability 212,661 Increase in deferred outflows of resources (57,726) Decrease in deferred inflows of resources (192,765) Increase in unearned revenue 5,593 Net cash used in operating activities $ (853,714)
NON-CASH INVESTING, CAPITAL AND RELATED FINANCING ACTIVITIES:
During the year ended June 30, 2016, the District received Federal commodities valued at $234,328.
Funds
Business Type Activities:NonmajorEnterprise
SEE NOTES TO FINANCIAL STATEMENTS.
37
LINN-MAR COMMUNITY SCHOOL DISTRICT NOTES TO FINANCIAL STATEMENTS
JUNE 30, 2016 Note 1. Summary of Significant Accounting Policies The Linn-Mar Community School District is a political subdivision of the State of Iowa and operates public schools for children in grades kindergarten through twelve and special education pre-kindergarten. Additionally, the District operates and sponsors various adult education programs. The geographic area served includes the City of Marion, Iowa, portions of the Cities of Robbins and Cedar Rapids and portions of the agricultural territory in Linn County. The District is governed by a Board of Education whose members are elected on a non-partisan basis.
The District’s financial statements are prepared in conformity with U.S. generally accepted accounting principles as prescribed by the Governmental Accounting Standards Board. A. Reporting Entity For financial reporting purposes, Linn-Mar Community School District has included all funds, organizations, agencies, boards, commissions and authorities. The District has also considered all potential component units for which it is financially accountable, and other organizations for which the nature and significance of their relationship with the District are such that exclusion would cause the District’s financial statements to be misleading or incomplete. The Governmental Accounting Standards Board has set forth criteria to be considered in determining financial accountability. These criteria include appointing a voting majority of an organization’s governing body, and (1) the ability of the District to impose its will on that organization or (2) the potential for the organization to provide specific benefits to, or impose specific financial burdens on the District. The Linn-Mar Community School District has no component units which meet the Governmental Accounting Standards Board criteria. Jointly Governed Organizations - The District participates in a jointly governed organization that provides services to the District but do not meet the criteria of a joint venture since there is no ongoing financial interest or responsibility by the participating governments. The District is a member of the Linn County Assessors’ Conference Board. B. Basis of Presentation Government-wide Financial Statements - The Statement of Net Position and the Statement of Activities report information on all of the nonfiduciary activities of the District. For the most part, the effect of interfund activity has been removed from these statements. Governmental activities, which normally are supported by tax and intergovernmental revenues, are reported separately from business type activities, which rely to a significant extent on fees and charges for service. The Statement of Net Position presents the District’s nonfiduciary assets, deferred outflows of resources, liabilities and deferred inflows of resources, with the difference reported as net position. Net position is reported in three categories: Net investment in capital assets consists of capital assets, net of accumulated depreciation and reduced by outstanding balances for bonds, notes, and other debt that are attributed to the acquisition, construction, or improvement of those assets. Restricted net position results when constraints placed on net position use are either externally imposed or imposed by law through constitutional provisions or enabling legislation. Enabling legislation did not result in any restricted net position.
Unrestricted net position consists of net position that does not meet the definition of the two preceding categories. Unrestricted net position is often subject to constraints imposed by management which can be removed or modified.

38
The Statement of Activities demonstrates the degree to which the direct expenses of a given function or segment is offset by program revenues. Direct expenses are those that are clearly identifiable with a specific function. Program revenues include 1) charges to customers or applicants who purchase, use, or directly benefit from goods, services, or privileges provided by a given function and 2) grants, contributions and interest that are restricted to meeting the operational or capital requirements of a particular function. Property tax and other items not properly included among program revenues are reported instead as general revenues. Fund Financial Statements - Separate financial statements are provided for governmental, proprietary, and fiduciary funds, even though the latter are excluded from the Government-wide financial statements. Major individual governmental funds are reported as separate columns in the fund financial statements. All remaining governmental funds are aggregated and reported as other nonmajor governmental funds. Combining schedules are also included for the Capital Project Fund accounts as well as the nonmajor enterprise funds. The District reports the following major governmental funds: The General Fund is the general operating fund of the District. All general tax revenues and other receipts that are not allocated by law or contractual agreement to some other fund are accounted for in this fund. From the fund are paid the general operating expenses, including instructional, support and other costs. The Capital Projects Fund is utilized to account for all resources used in the acquisition and construction of capital facilities and other capital assets.
The Debt Service Fund is utilized to account for property tax and other revenues to be used for
the payment of interest and principal on the District’s general long-term debt. The District reports the following nonmajor governmental funds: The Special Revenue - Management Fund is utilized to account for the payment of property insurance as well as early retirement incentives.
The Special Revenue - Student Activity Fund is utilized to account for the various student run organizations and athletic accounts of the District.
The Special Revenue - Public Education and Recreation Levy Fund is utilized to account for the
resources used to establish and maintain public recreation places and playgrounds and necessary accommodations for children and adults. The District reports the following nonmajor proprietary funds: The Enterprise, School Nutrition Fund. The School Nutrition Fund is used to account for the food service operations of the District. The Enterprise, Aquatic Center Fund. The Aquatic Center Fund is used to account for the operations of the District’s pool activities. The Enterprise, Student ROAR Store Fund. The ROAR Store is used to account for student store operations of the District. C. Measurement Focus and Basis of Accounting The government-wide and proprietary financial statements are reported using the economic resources measurement focus and the accrual basis of accounting. Revenues are recorded when earned and expenses are recorded when a liability is incurred, regardless of the timing of related cash flows. Property tax is recognized as revenue in the year for which it is levied. Grants and similar items are recognized as revenue as soon as all eligibility requirements imposed by the provider have been satisfied.
39
Governmental fund financial statements are reported using the current financial resources measurement focus and the modified accrual basis of accounting. Revenues are recognized as soon as they are both measurable and available. Revenues are considered to be available when they are collectible within the current period or soon enough thereafter to pay liabilities of the current period. For this purpose, the government considers revenues to be available if they are collected within 60 days after year end. Property tax, intergovernmental revenues (shared revenues, grants and reimbursements from other governments) and interest associated with the current fiscal period are all considered to be susceptible to accrual. All other revenue items are considered to be measurable and available only when cash is received by the District. Expenditures generally are recorded when a liability is incurred, as under accrual accounting. However, principal and interest on long-term debt, claims and judgments, and compensated absences are recognized as expenditures only when payment is due. Capital asset acquisitions are reported as expenditures in governmental funds. Proceeds of general long-term debt and acquisitions under capital leases are reported as other financing sources. Under terms of grant agreements, the District funds certain programs by a combination of specific cost-reimbursement grants and general revenues. Thus, when program expenses are incurred, there are both restricted and unrestricted net positions available to finance the program. It is the District’s policy to first apply cost-reimbursement grant resources to such programs, and then general revenues. When an expenditure is incurred in governmental funds which can be paid using either restricted or unrestricted resources, the District’s policy is generally to first apply the expenditure toward restricted fund balance and then to less restrictive classifications - assigned and then unassigned fund balances. Proprietary funds distinguish operating revenues and expenses from nonoperating items. Operating revenues and expenses generally result from providing services and producing and delivering goods in connection with a proprietary fund’s principle ongoing operations. The principle operating revenues of the District’s enterprise fund are charges to customers for sales and services. Operating expenses for enterprise funds include the cost of sales and services, administrative expenses, and depreciation on capital assets. All revenues and expenses not meeting this definition are reported as nonoperating revenues and expenses. The District maintains its financial records on the accrual basis. D. Cash, Pooled Investments and Cash Equivalents The cash balances of most District funds are pooled and invested. Investments are stated at fair value except for the investments in the Iowa Schools Joint Investment Trust, which are valued at amortized cost and non-negotiable certificates of deposit which are stated at cost. For purposes of the Statement of Cash Flows, all short-term cash investments that are highly liquid are considered to be cash equivalents. Cash equivalents are readily convertible to known amounts of cash, and at the day of purchase, they have a maturity date no longer than three months. E. Property Taxes Property taxes in Governmental Funds are accounted for using the modified accrual basis of accounting. Property taxes revenue receivable is recognized in these funds on the levy date that the tax asking is certified by the Board of Education to the County Board of Supervisors. Current year delinquent property taxes receivable represents unpaid taxes from the current year. The succeeding year property tax receivable represents taxes certified by the Board of Education to be collected in the next fiscal year for the purposes set out in the budget for the next fiscal year. By statute, the Board of Education is required to certify its budget to the County Auditor by April 15 of each year for the subsequent fiscal year. However,

40
by statute, the tax asking and budget certification for the following fiscal year becomes effective on the first day of that year. Although the succeeding year property tax receivable has been recorded, the related revenue is deferred and will not be recorded as revenue until the year for which it is levied.
Property tax revenue recognized in these funds becomes due and collectible in September and March of the fiscal year with a 1½% per month penalty for delinquent payments; is based on January 1, 2014 assessed property valuations; is for the tax accrual period July 1, 2015 through June 30, 2016 and reflects the tax asking contained in the budget certified to the County Board of Supervisors in April, 2015. F. Due from Other Governments Due from other governments represents amounts due from the State of Iowa, various shared revenues, grants and reimbursements from other governments. G. Inventories Inventories are valued at cost using the first-in, first-out method for purchased items in the government commodities. Inventories of proprietary funds are recorded as expense when consumed rather than when purchased or received. H. Capital Assets Capital assets, which include property, machinery and equipment and intangibles, are reported in the applicable governmental or business type activities columns in the Government-wide Statement of Net Position. Capital assets are recorded at historical cost. Donated capital assets are recorded at estimated fair market value at the date of donation. The costs of normal maintenance and repairs that do not add to the value of the asset or materially extend asset lives are not capitalized. Capital assets are defined by the District as assets with an initial, individual cost in excess of the following thresholds and estimated useful lives in excess of two years.
Assets Amounts
Land $ 2,500Buildings 2,500Land improvements 2,500Intangibles 175,000Machinery and equipment: School Nutrition Fund equipment 500 Other machinery and equipment 2,500
Land is not depreciated. Buildings, land improvements, machinery and equipment and
intangibles are depreciated/amortized using the straight-line method of depreciation over the following estimated useful lives:
EstimatedAsset Class Useful Lives
Buildings 50 yearsLand improvements 20 yearsIntangibles 5-20 yearsMachinery and equipment 5-20 years
I. Deferred Outflows of Resources
Deferred outflows of resources represent a consumption of net position that applies to a future
period(s) and will not be recognized as an outflow of resources (expense/expenditure) until then. Deferred outflows of resources consist of unrecognized items not yet charged to pension expense and contributions from the employer after the measurement date but before the end of the employer’s reporting period.
41
J. Salaries and Benefits Payable Payroll and related payroll taxes and benefits for teachers with annual contracts corresponding to the school year, but which have balances payable in July and August 2016, have been accrued as a liability as it is applicable to the fiscal year ended June 30, 2016. K. Unearned Revenue Unearned revenues are monies collected for lunches that have not yet been served. The lunch account balances will either be reimbursed or served lunches. The lunch account balances are reflected on the Statement of Net Position in the Proprietary, School Nutrition Fund. L. Compensated Absences District employees accumulate a limited amount of earned but unused vacation benefits payable to employees. Compensated absences are reported in governmental funds only if they have matured. The cost of vacation payments expected to be liquidated currently is recorded as a long-term liability on the Statement of Net Position and will be paid in the future primarily from the General Fund. The compensated absences liability has been computed based on rates of pay in effect at June 30, 2016. M. Long-term Liabilities In the government-wide financial statements, long-term debt and other long-term obligations are reported as liabilities in the governmental activities column in the Statement of Net Position. N. Pensions
For purposes of measuring the net pension liability, deferred outflows of resources and deferred inflows of resources related to pensions, and pension expense, information about the fiduciary net position of the Iowa Public Employees’ Retirement System (IPERS) and additions to/deductions from IPERS’ fiduciary net position have been determined on the same basis as they are reported by IPERS. For this purpose, benefit payments (including refunds of employee contributions) are recognized when due and payable in accordance with the benefit terms. Investments are reported at fair value. O. Deferred Inflows of Resources Deferred inflows of resources represent an acquisition of net position that applies to future period(s) and will not be recognized as an inflow of resources (revenue) until that time. Although certain revenues are measurable, they are not available. Available means collected within the current year or expected to be collected soon enough thereafter to be used to pay liabilities of the current year. Deferred inflows of resources in the governmental fund financial statements represent the amount of assets that have been recognized, but the related revenue has not been recognized since the assets are not collected within the current year or expected to be collected soon enough thereafter to be used to pay liabilities of the current year. Deferred inflows of resources consist of property tax receivable and other receivables not collected within sixty days after year end. Deferred inflows of resources in the Statement of Net Position consists of succeeding year property tax receivable that will not be recognized as revenue until the year for which it is levied and the unamortized portion of the net difference between projected and actual earnings on pension plan investments. P. Fund Balances In the governmental fund financial statements, fund balances are classified as follows:
Restricted - Amounts restricted to specific purposes when constraints placed on the use of the resources are either externally imposed by creditors, grantors or state or federal laws or imposed by law through constitutional provisions or enabling legislation.

42
Assigned - Amounts are not available for appropriation but are set aside for specific purposes in the District’s General Fund. The District’s Board of Directors authorizes the Chief Executive Officer to assign General Fund balance amounts pursuant to Board Policy 801.4.
Unassigned - All amounts not included in other spendable classifications. It is only to be used for residual amounts in the General Fund or for deficit balances in other governmental funds. Note 2. Budgets and Budgetary Accounting In accordance with the Code of Iowa, the District’s Board of Education annually adopts a single district-wide budget and approves the related appropriations following required public notice and hearing for all funds. The budgets and related appropriations as well as the financial statements are prepared on the modified accrual basis or accrual basis of accounting. The budget may be amended during the year utilizing similar statutorily prescribed procedures. Formal and legal budgetary control for the certified budget is based upon four major classes of disbursements known as functional areas, not by fund. These four functional areas are instruction, support services, non-instructional programs and other expenditures. The Code of Iowa also provides that District disbursements in the General Fund may not exceed the amount authorized by the school finance formula. The Board of Education follows these procedures in establishing budgetary data reflected in the financial statements:
1. In accordance with the Statutes of the State of Iowa, prior to March 15, the Board Secretary submits to the Board of Education a proposed operating budget for the fiscal year commencing the following July 1. The operating budget includes proposed expenditures or expenses and the means of financing them for the upcoming year, along with estimates for the current year and actual data for the preceding years. This budget is submitted in summary form, with an administrative control. The legal level of control for the detailed budget is at the functional area level. 2. Public hearings are required to be conducted to obtain taxpayer comment. 3. Prior to April 15, the budget is legally enacted through certification by the County Auditor.
4. Management is authorized to transfer budgeted amounts between departments within any functional area; however, any revisions that alter the total expenditures or expenses of any functional area must be approved by the Board of Education.
5. The Board of Education may amend the budget during the year by holding public hearings and certifying the amendment with the County Auditor.
6. Appropriations lapse at the end of each fiscal year. 7. The budget cannot be amended without the approval of the Board of Education. 8. Unexpended budgetary balances lapse at June 30 and are not available to finance expenditures or expenses of the following year. Note 3. Deposits and Pooled Investments
The District is authorized by statute to invest public funds in obligations of the United States
government, its agencies and instrumentalities; certificates of deposit and other evidence of deposit at federally insured depository institutions approved by the Board of Education; prime eligible bankers acceptances; certain high rated commercial paper; perfected repurchase agreements; certain registered open-end management investment companies; certain joint investment trusts; and warrants or improvement certificates of a drainage district. As of June 30, 2016, the carrying amount of the District’s bank deposits and pooled investments totaled $42,703,645 with bank balances of $43,247,835. These amounts are included in the cash and pooled investments on the Statement of Net Position. Of the bank balance, $1,000,000 was covered by

43
federal depository insurance and $42,247,835 was collateralized by the State Sinking Fund in accordance with 12C of the Code of Iowa. This chapter provides additional assessments against depositories to insure there will be no loss of public funds.
At June 30, 2016, the District had no investments meeting the disclosure requirements of Government Accounting Standards Board Statement No. 72, or any other investments which would require disclosure. Interest rate risk. The District’s investment policy limits the investment of operating funds (funds expected to be expended in the current budget year or within 15 months of receipt) in instruments that mature within 397 days. Funds not identified as operating funds may be invested in investments with maturities longer than 397 days but the maturities shall be consistent with the needs and use of the District and must also conform to any loan covenant investment maturity restrictions. The maturity of the District’s position in an external investment pool is based on the average maturity of the pool’s investments.
Credit risk. Generally, credit risk is the risk that an issuer of an investment will not fulfill its obligation to the holder of an investment. This is measured by the assignment of a rating by a nationally recognized rating organization (Standard and Poor’s and Moody Investor Services). The District’s investment policy does not formally address credit risk.
Custodial credit risk for deposits. Custodial credit risk for deposits is the risk that, in the event of the failure of a depository financial institution, a government will not be able to recover its deposits or will not be able to recover collateral securities that are in the possession of an outside party. The custodial credit risk for investments is the risk that, in the event of the failure of the counterparty (e.g. broker-dealer) to a transaction, a government will not be able to recover the value of its investment or collateral securities that are in the possession of another party. It is the District's policy to require that time deposits in excess of FDIC insurable limits ($250,000) be secured by collateral or private insurance to protect public deposits in a single financial institution if it were to default. Chapter 12C of the Code of Iowa requires all District funds be deposited into an approved depository and be either insured or collateralized. Note 4. Interfund Transfers The detail of interfund transfers for the year ended June 30, 2016 is as follows:
Transfer to Transfer from Amount
Debt Service Capital Projects: Statewide Sales, Services & Use Tax $ 5,923,233
Debt Service Capital Projects: Physical Plant & Equipment Levy 78,000
Total $ 6,001,233
The transfer from the Capital Projects: Statewide Sales, Services and Use Tax Account to the
Debt Service Fund was needed for repayment of principal and interest on the District’s revenue bond indebtedness as well as for general obligation bond debt relief.
The transfer from the Capital Projects: Physical Plant & Equipment Levy Account to the Debt
Service Fund was needed for principal and interest payments on the District’s capital loan note indebtedness.
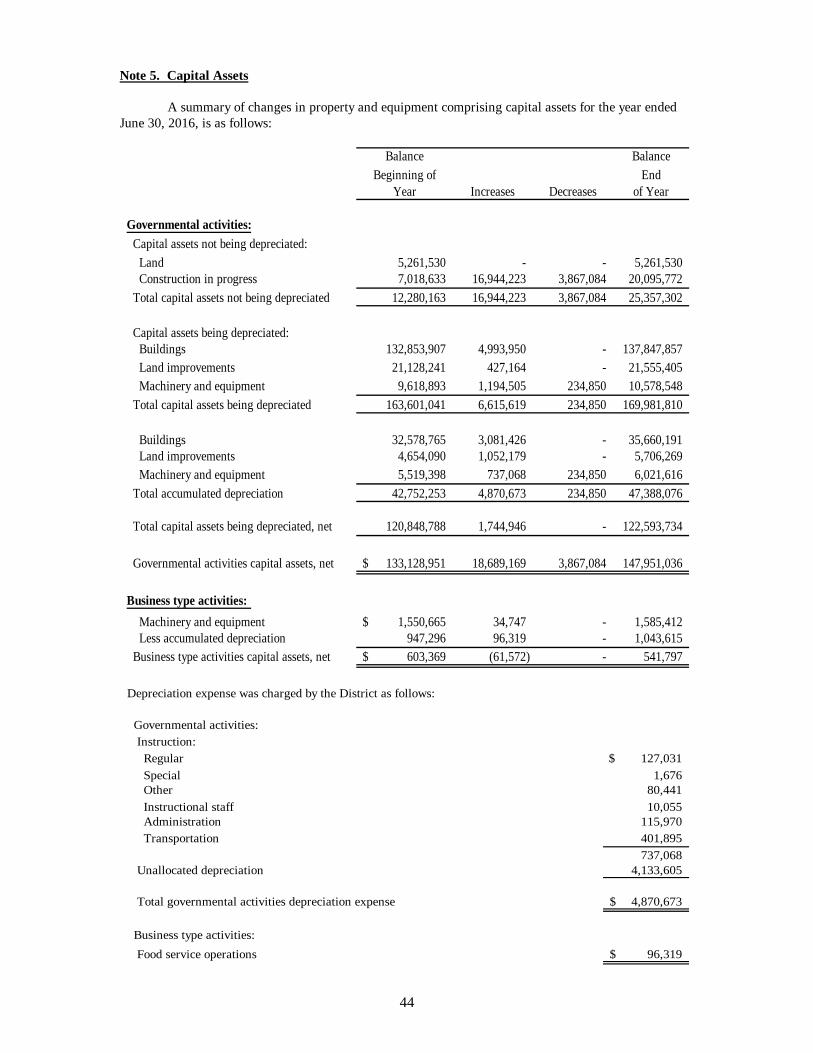
44
Note 5. Capital Assets A summary of changes in property and equipment comprising capital assets for the year ended June 30, 2016, is as follows:
Balance BalanceBeginning of End
Year Increases Decreases of Year
Governmental activities: Capital assets not being depreciated: Land 5,261,530 - - 5,261,530 Construction in progress 7,018,633 16,944,223 3,867,084 20,095,772 Total capital assets not being depreciated 12,280,163 16,944,223 3,867,084 25,357,302
Capital assets being depreciated: Buildings 132,853,907 4,993,950 - 137,847,857 Land improvements 21,128,241 427,164 - 21,555,405 Machinery and equipment 9,618,893 1,194,505 234,850 10,578,548 Total capital assets being depreciated 163,601,041 6,615,619 234,850 169,981,810
Buildings 32,578,765 3,081,426 - 35,660,191 Land improvements 4,654,090 1,052,179 - 5,706,269 Machinery and equipment 5,519,398 737,068 234,850 6,021,616 Total accumulated depreciation 42,752,253 4,870,673 234,850 47,388,076
Total capital assets being depreciated, net 120,848,788 1,744,946 - 122,593,734
Governmental activities capital assets, net $ 133,128,951 18,689,169 3,867,084 147,951,036
Business type activities: Machinery and equipment $ 1,550,665 34,747 - 1,585,412 Less accumulated depreciation 947,296 96,319 - 1,043,615 Business type activities capital assets, net $ 603,369 (61,572) - 541,797
Depreciation expense was charged by the District as follows:
Governmental activities: Instruction: Regular $ 127,031 Special 1,676 Other 80,441 Instructional staff 10,055 Administration 115,970 Transportation 401,895
737,068 Unallocated depreciation 4,133,605
Total governmental activities depreciation expense $ 4,870,673
Business type activities: Food service operations $ 96,319

45
Note 6. Long-Term Liabilities A summary of changes in long-term liabilities for the year ended June 30, 2016 are summarized as follows:
Balance Balance DueBeginning End Within
of Year Additions Reductions of Year One YearGovernmental activities: General obligation bonds $ 35,585,000 - 3,250,000 32,335,000 3,300,000 Revenue bonds 49,540,000 10,000,000 2,530,000 57,010,000 3,700,000 Capital loan notes - 10,000,000 - 10,000,000 1,015,000 Termination benefits 381,529 - 190,765 190,764 190,764 Compensated absences 180,018 67,837 180,018 67,837 67,837 Net pension liability 26,615,319 7,904,204 - 34,519,523 - Net OPEB liablity 1,105,466 185,192 - 1,290,658 - Total $ 113,407,332 28,157,233 6,150,783 135,413,782 8,273,601
Business type activities: Net pension liability $ 727,315 212,661 - 939,976 - Net OPEB liablity 29,626 4,827 - 34,453 - Total $ 756,941 217,488 - 974,429 -
General Obligation Bonds
As of June 30, 2016, the District had general obligation bonds outstanding of $32,335,000, which had been issued for capital facility construction purposes in prior fiscal years. The general obligation bonds will be paid with property taxes collected in the Debt Service Fund. Details of the District's June 30, 2016 general obligation bonded indebtedness are as follows:
YearEnding Interest InterestJune 30, Rates Principal Interest Rates Principal Interest
2017 4.000 % $ 850,000 677,607 3.250 % $ - 343,663 2018 4.000 1,950,000 643,606 3.250 - 343,662 2019 4.000 2,035,000 565,606 3.250 - 343,663 2020 4.000 2,125,000 484,206 3.250 - 343,662 2021 4.000 2,220,000 399,206 3.250 - 343,663
2022-2026 4.125 7,525,000 527,382 3.25-3.50 10,000,000 1,425,262 $ 16,705,000 3,297,613 $ 10,000,000 3,143,575
Bond Issue of April 12, 2011Bond Issue of January 1, 2007
YearEnding Interest InterestJune 30, Rates Principal Interest Rates Principal Interest Interest Total
2017 1.250 % $ 770,000 58,235 3.000 % $ 1,680,000 50,400 $ 1,129,905 4,429,905 2018 1.250 780,000 48,610 - - - 1,035,878 3,765,878 2019 1.250 790,000 38,860 - - - 948,129 3,773,129 2020 1.300 800,000 28,590 - - - 856,458 3,781,458 2021 1.900 810,000 15,390 - - - 758,259 3,788,259
2022-2026 - - - - - - 1,952,644 19,477,644 $ 3,950,000 189,685 $ 1,680,000 50,400 $ 6,681,273 39,016,273
2,925,000 2,825,000
Refunding Bond Issue of April 23, 2014
2,730,000 3,300,000
Principal
Refunding Bond Issue of February 24, 2014 Total
32,335,000 17,525,000 3,030,000

46
Revenue Bonds
As of June 30, 2016, the District had statewide sales, services and use tax bonds of $57,010,000, which had been issued for capital facility construction/building improvement projects. These bonds will be paid with statewide sales, services and use tax collected in the Capital Projects: Statewide Sales, Services and Use Tax Fund. Details of the District's June 30, 2016 statewide sales, services and use tax bonded indebtedness are as follows:
YearEnding Interest Interest InterestJune 30, Rates Principal Interest Rates Principal Interest Rates Principal Interest
2017 4.000 % $ - 815,030 1.350 % $ - 210,808 1.350 % $ 100,000 214,308 2018 4.000 - 815,030 1.350 - 210,808 1.350 100,000 213,308 2019 4.000 1,215,000 790,730 1.350 730,000 205,880 1.350 760,000 208,058 2020 4.000 1,270,000 741,030 1.500 745,000 195,365 1.500 765,000 197,570 2021 4.000 1,325,000 689,130 1.650 760,000 183,508 1.650 765,000 185,138
2022-2026 4.00-4.40 7,565,000 2,558,093 1.75-2.30 4,075,000 694,150 1.75-2.30 3,990,000 681,927 2027-2030 4.50-4.625 7,475,000 710,829 2.40-2.70 3,690,000 196,652 2.40-2.70 3,020,000 173,275
$ 18,850,000 7,119,872 $ 10,000,000 1,897,171 $ 9,500,000 1,873,584
YearEnding Interest InterestJune 30, Rates Principal Interest Rates Principal Interest
2017 3.000 % $ 1,695,000 77,475 2.000 % $ 775,000 23,550 2018 3.000 1,735,000 26,025 2.000 790,000 7,900 2019 - - - - 2020 - - - - 2021 - - - -
2022-2026 - - - - 2027-2030 - - - -
$ 3,430,000 103,500 $ 1,565,000 31,450
Bond Issue of June 4, 2013Bond Issue of March 1, 2010 Bond Issue of October 1, 2012
Refunding Bond Issue of February 24, 2014 Refunding Bond Issue of March 12, 2014
YearEnding Interest InterestJune 30, Rates Principal Interest Rates Principal Interest Interest Total
2017 0.750 % $ 260,000 86,413 2.610 % $ 870,000 249,647 $ 1,677,231 5,377,231 2018 1.150 260,000 83,943 2.610 935,000 226,091 1,583,105 5,403,105 2019 1.450 260,000 80,562 2.610 535,000 206,908 1,492,138 4,992,138 2020 1.700 260,000 76,468 2.610 545,000 192,814 1,403,247 4,988,247 2021 1.850 260,000 71,852 2.610 575,000 178,197 1,307,825 4,992,825
2022-2026 2.15-2.90 1,300,000 270,927 2.610 3,225,000 651,522 4,856,619 25,011,619 2027-2030 3.10-3.75 1,065,000 78,096 2.610 3,315,000 180,938 1,339,790 19,904,790
$ 3,665,000 748,261 $ 10,000,000 1,886,117 $ 13,659,955 70,669,955 57,010,000
Principal
18,565,000 20,155,000 3,685,000 3,585,000 3,500,000
3,700,000 3,820,000
Bond Issue of October 21, 2014 TotalBond Issue of July 1, 2015
The District has pledged future statewide sales, services and use tax revenues to repay the bonds issued in March of 2010, October of 2012, June of 2013, February of 2014, March of 2014, October of 2014 and July of 2015. The bonds were issued for the purpose of financing a portion of the costs of several ongoing projects or to refund prior year revenue bond issuances. The bonds are payable solely from the proceeds of the statewide sales, services, and use tax revenues received by the District and are payable through 2030. The bonds are not general obligations of the District. However, the debt is subject to the constitutional debt limitation of the District. Annual principal and interest payments on the bonds are expected to require nearly 79 percent of the statewide sales, services, and use tax revenues. The total
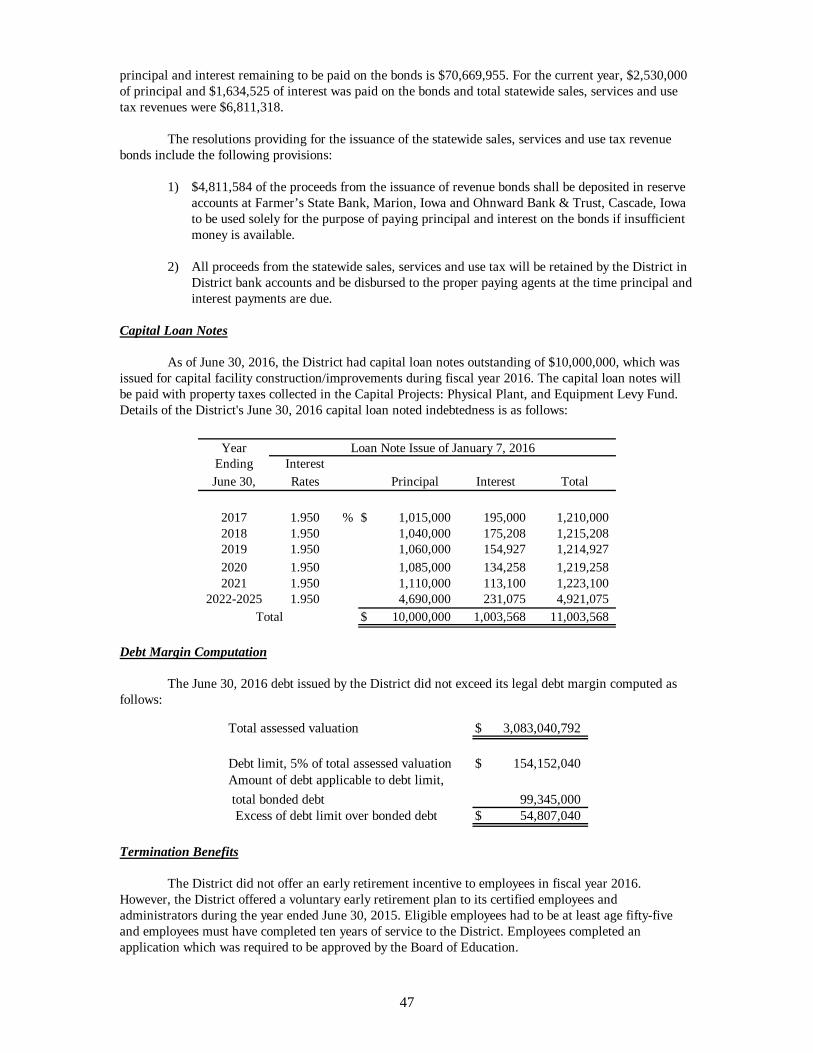
47
principal and interest remaining to be paid on the bonds is $70,669,955. For the current year, $2,530,000 of principal and $1,634,525 of interest was paid on the bonds and total statewide sales, services and use tax revenues were $6,811,318.
The resolutions providing for the issuance of the statewide sales, services and use tax revenue bonds include the following provisions:
1) $4,811,584 of the proceeds from the issuance of revenue bonds shall be deposited in reserve accounts at Farmer’s State Bank, Marion, Iowa and Ohnward Bank & Trust, Cascade, Iowa to be used solely for the purpose of paying principal and interest on the bonds if insufficient money is available.
2) All proceeds from the statewide sales, services and use tax will be retained by the District in
District bank accounts and be disbursed to the proper paying agents at the time principal and interest payments are due.
Capital Loan Notes
As of June 30, 2016, the District had capital loan notes outstanding of $10,000,000, which was issued for capital facility construction/improvements during fiscal year 2016. The capital loan notes will be paid with property taxes collected in the Capital Projects: Physical Plant, and Equipment Levy Fund. Details of the District's June 30, 2016 capital loan noted indebtedness is as follows:
YearEnding InterestJune 30, Rates Principal Interest Total
2017 1.950 % $ 1,015,000 195,000 1,210,000 2018 1.950 1,040,000 175,208 1,215,208 2019 1.950 1,060,000 154,927 1,214,927 2020 1.950 1,085,000 134,258 1,219,258 2021 1.950 1,110,000 113,100 1,223,100
2022-2025 1.950 4,690,000 231,075 4,921,075 $ 10,000,000 1,003,568 11,003,568 Total
Loan Note Issue of January 7, 2016
Debt Margin Computation
The June 30, 2016 debt issued by the District did not exceed its legal debt margin computed as
follows:
Total assessed valuation $ 3,083,040,792
Debt limit, 5% of total assessed valuation $ 154,152,040 Amount of debt applicable to debt limit, total bonded debt 99,345,000 Excess of debt limit over bonded debt $ 54,807,040
Termination Benefits The District did not offer an early retirement incentive to employees in fiscal year 2016. However, the District offered a voluntary early retirement plan to its certified employees and administrators during the year ended June 30, 2015. Eligible employees had to be at least age fifty-five and employees must have completed ten years of service to the District. Employees completed an application which was required to be approved by the Board of Education.

48
The early retirement incentive for each eligible employee was equal to the employee's base salary calculated by using the fiscal year 2015 regular salary schedule, less any other additional pay, multiplied by 50 percent plus all unused personal days compensated for at the rate of substitute pay used during the last year of service. Employees could also elect to continue participation in the District's group health insurance plan until age 65 or until insurance is acquired elsewhere. Their participation was at the employee's expense with the exception that any unused personal days of separation compensation may be used to cover the cost of premiums.
At June 30, 2016, the District’s obligations to eleven participants with a total amount of $190,764 payable from the Nonmajor Special Revenue: Management Levy Fund. The District paid $190,765 in early retirement benefits to retirees during fiscal year 2016. Note 7. Pension Plan Plan Description - IPERS membership is mandatory for employees of the District, except for those covered by another retirement system. Employees of the District are provided with pensions through a cost-sharing multiple employer defined benefit pension plan administered by Iowa Public Employees’ Retirement System (IPERS). IPERS issues a stand-alone financial report which is available to the public by mail at 7401 Register Drive P.O. Box 9117, Des Moines, Iowa 50306-9117 or at www.ipers.org. IPERS benefits are established under Iowa Code chapter 97B and the administrative rules thereunder. Chapter 97B and the administrative rules are the official plan documents. The following brief description is provided for general information purposes only. Refer to the plan documents for more information. Pension Benefits - A regular member may retire at normal retirement age and receive monthly benefits without an early-retirement reduction. Normal retirement age is age 65, anytime after reaching age 62 with 20 or more years of covered employment, or when the member’s years of service plus the member’s age at the last birthday equals or exceeds 88, whichever comes first. (These qualifications must be met on the member’s first month of entitlement to benefits.) Members cannot begin receiving retirement benefits before age 55. The formula used to calculate a Regular member’s monthly IPERS benefit includes:
• A multiplier (based on years of service). • The member’s highest five-year average salary. (For members with service before June 30, 2012,
the highest three-year average salary as of that date will be used if it is greater than the highest five-year average salary.) If a member retires before normal retirement age, the member’s monthly retirement benefit will
be permanently reduced by an early-retirement reduction. The early retirement reduction is calculated differently for service earned before and after July 1, 2012. For service earned before July 1, 2012, the reduction is 0.25 percent for each month that the member receives benefits before the member’s earliest normal retirement age. For service earned starting July 1, 2012, the reduction is 0.50 percent for each month that the member receives benefits before age 65.
Generally, once a member selects a benefit option, a monthly benefit is calculated and remains
the same for the rest of the member’s lifetime. However, to combat the effects of inflation, retirees who began receiving benefits prior to July 1990 receive a guaranteed dividend with their regular November benefit payments.
Disability and Death Benefits - A vested member who is awarded federal Social Security
disability or Railroad Retirement disability benefits is eligible to claim IPERS benefits regardless of age. Disability benefits are not reduced for early retirement. If a member dies before retirement, the member’s beneficiary will receive a lifetime annuity or a lump-sum payment equal to the present actuarial value of the member’s accrued benefit or calculated with a set formula, whichever is greater. When a member dies after retirement, death benefits depend on the benefit option the member selected at retirement.

49
Contributions - Contribution rates are established by IPERS following the annual actuarial valuation, which applies IPERS’ Contribution Rate Funding Policy and Actuarial Amortization Method. Statute limits the amount rates can increase or decrease each year to 1 percentage point. IPERS Contribution Rate Funding Policy requires that the actuarial contribution rate be determined using the “entry age normal” actuarial cost method and the actuarial assumptions and methods approved by the IPERS Investment Board. The actuarial contribution rate covers normal cost plus the unfunded actuarial liability payment based on a 30-year amortization period. The payment to amortize the unfunded actuarial liability is determined as a level percentage of payroll, based on the Actuarial Amortization Method adopted by the Investment Board.
In fiscal year 2016, pursuant to the required rate, Regular members contributed 5.95 percent of
pay and the District contributed 8.93 percent for a total rate of 14.88 percent. The District’s contributions to IPERS for the year ended June 30, 2016 were $4,673,985. Net Pension Liabilities, Pension Expense, and Deferred Outflows of Resources and Deferred
Inflows of Resources Related to Pensions - At June 30, 2016, the District reported a liability of $35,459,499 for its proportionate share of the net pension liability. The net pension liability was measured as of June 30, 2015, and the total pension liability used to calculate the net pension liability was determined by an actuarial valuation as of that date. The District’s proportion of the net pension liability was based on the District’s share of contributions to the pension plan relative to the contributions of all IPERS participating employers. At June 30, 2015, the District’s collective proportion was 0.717733 percent, which was an increase of 0.0028291 from its proportion measured as of June 30, 2014.
For the year ended June 30, 2016, the District recognized pension expense of $3,345,472. At
June 30, 2015, the District reported deferred outflows of resources and deferred inflows of resources related to pensions from the following sources:
Differences between expected and actual experience $ 535,748 $ -
Changes of assumptions 976,289 -
Net difference between projected and actual earnings on IPERS investments - 2,951,159
Changes in proportion and differences between District contributions and the District's proportionate share of contributions 1,646,308 96,933
District contributions subsequent to the measurement date 4,673,985 -
Total $ 7,832,330 $ 3,048,092
of ResourcesDeferred Inflows
of ResourcesDeferred Outflows
$4,673,985 reported as deferred outflows of resources related to pensions resulting from the
District contributions subsequent to the measurement date will be recognized as a reduction of the net pension liability in the year ended June 30, 2017. Other amounts reported as deferred outflows of resources and deferred inflows of resources related to pensions will be recognized in pension expense as follows:

50
Year EndedJune 30,
2017 $ (628,662) 2018 (628,662) 2019 (628,662) 2020 1,877,735 2021 118,504
$ 110,253
There were no non-employer contributing entities at IPERS. Actuarial Assumptions - The total pension liability in the June 30, 2015 actuarial valuation was
determined using the following actuarial assumptions, applied to all periods included in the measurement:
Rate of inflation 3.00 percent per annum(effective June 30, 2014)
Rates of salary increase 4.00 to 17.00 percent, average, including inflation. Rates(effective June 30, 2010) vary by membership group.
Long-term investment rate of return 7.50 percent, compounded annually, net of investment(effective June 30, 1996) expense, including inflation
Wage growth 4.00 percent per annum, based on 3.00 percent inflation(effective June 30, 1990) and 1.00 percent real wage inflation
The actuarial assumptions used in the June 30, 2015 valuation were based on the results of
actuarial experience studies with dates corresponding to those listed above. Mortality rates were based on the RP-2000 Mortality Table for Males or Females, as appropriate,
with adjustments for mortality improvements based on Scale AA. The long-term expected rate of return on IPERS’ investments was determined using a building-
block method in which best-estimate ranges of expected future real rates (expected returns, net of pension plan investment expense and inflation) are developed for each major asset class. These ranges are combined to produce the long-term expected rate of return by weighting the expected future real rates of return by the target asset allocation percentage and by adding expected inflation. The target allocation and best estimates of arithmetic real rates of return for each major asset class are summarized in the following table:
Long-Term ExpectedAsset Class Asset Allocation Real Rate of Return
Core plus fixed income 28% 2.04Domestic equity 24 . 6.29International equity 16 . 6.75 .Private equity/debt 11 . 11.32 'Real estate 8 . 3.48Credit opportunities 5 . 3.63U.S. TIPS 5 . 1.91Other real assets 2 . 6.24Cash 1 . (0.71) Total 100% .
Discount Rate - The discount rate used to measure the total pension liability was 7.5 percent. The
projection of cash flows used to determine the discount rate assumed that employee contributions will be made at the contractually required rate and that contributions from the District will be made at contractually required rates, actuarially determined. Based on those assumptions, the pension plan’s fiduciary net position was projected to be available to make all projected future benefit payments of

51
current active and inactive employees. Therefore, the long-term expected rate of return on IPERS’ investments was applied to all periods of projected benefit payments to determine the total pension liability.
Sensitivity of the District’s Proportionate Share of the Net Pension Liability to Changes in the
Discount Rate - The following presents the District’s proportionate share of the net pension liability calculated using the discount rate of 7.5 percent, as well as what the District’s proportionate share of the net pension liability would be if it were calculated using a discount rate that is 1-percentage-point lower (6.5 percent) or 1-percentage-point higher (8.5 percent) than the current rate.
District's proportionate share of the net pension liability $ 62,083,203 $ 35,459,499 $ 12,987,182
1%Decrease(-6.5%) (-7.5%)
RateDiscount 1%
Increase(-8.5%)
Pension Plan Fiduciary Net Position - Detailed information about the pension plan’s fiduciary net
position is available in the separately issued IPERS financial report which is available on IPERS’ website at www.ipers.org.
Payables to IPERS - At June 30, 2016, the District reported payables to the defined benefit
pension plan of $576,747 for legally required employer contributions and $384,283 for legally required employee contributions which had been withheld from employee wages but not yet remitted to IPERS.
Note 8. Other Postemployment Benefits(OPEB)
Plan Description - The District participates in an agent multiple-employer health care plan called the Metro Interagency Insurance Plan (MIIP). This plan provides medical and prescription drug benefits for eligible employees and retirees and their spouses. There are 574 active and 24 retired members in the plan. Participants must be age 55 or older at retirement. The plan issues financial statements and required supplementary information which are available in a report publicly available through request at the Metro Interagency Insurance Program at 1120 33rd Avenue SW, Cedar Rapids, Iowa 52404.
The medical/prescription drug coverage is provided through a self-insured 28E organization plan
with Metro Interagency Insurance Program. Retirees under age 65 pay the same premium for the medical/prescription drug benefit as active employees, which results in an implicit subsidy and an OPEB liability. Funding Policy - The contribution requirements of plan members are established and may be amended by the District. The District currently finances the retiree benefit plan on a pay-as-you-go basis. Liabilities of the District’s OPEB are paid primarily from the General Fund. Annual OPEB Cost and Net OPEB Obligation - The District’s annual OPEB cost is calculated based on the annual required contribution (ARC) of the District, an amount actuarially determined in accordance with GASB Statement No. 45. The ARC represents a level of funding that, if paid on an ongoing basis, is projected to cover normal cost each year and amortize any unfunded actuarial liabilities over a period not to exceed 30 years. The following table shows the components of the District’s annual OPEB cost for the year ended June 30, 2016, the amount actually contributed to the plan and changes in the District's net OPEB obligation:

52
Annual required contribution $ 259,898 Interest on net OPEB obligation 28,377 Adjustment to annual required contribution (72,397) Annual OPEB cost 215,878 Contributions made (25,859) Increase in net OPEB obligation 190,019 Net OPEB obligation beginning of year 1,135,092 Net OPEB obligation end of year $ 1,325,111
For calculation of the net OPEB obligation, the actuary has set the transition day as July 1, 2008. The end of year net OPEB obligation was calculated by the actuary as the cumulative difference between the actuarially determined funding requirements and the actual contributions for the year ended June 30, 2016. For the year ended June 30, 2016, the District contributed $25,859 to the medical plan. The District’s annual OPEB cost, the percentage of annual OPEB cost contributed to the plan and the net OPEB obligation are summarized as follows:
Year NetEnded Annual OPEB
June 30, OPEB Cost Obligation
2014 $ 254,642 % $ 934,0062015 245,788 18.2 1,135,0922016 215,878 12.0 1,325,111
21.5
Percentage ofAnnual OPEB
Cost Contributed
Funded Status and Funding Progress - As of July 1, 2015, the most recent actuarial valuation date for the period July 1, 2015 through June 30, 2016, the actuarial accrued liability was $1,741,652 with no actuarial value of assets, resulting in an unfunded actuarial accrued liability (UAAL) of $1,741,652. The covered payroll (annual payroll of active employees covered by the plan) was $32,422,588 and the ratio of the UAAL to covered payroll was 5.4%. As of June 30, 2016, there were no trust fund assets. Actuarial Methods and Assumptions - Actuarial valuations of an ongoing plan involve estimates of the value of reported amounts and assumptions about the probability of occurrence of events far into the future. Examples include assumptions about future employment, mortality and the health care cost trend. Actuarially determined amounts are subject to continual revision as actual results are compared with past expectations and new estimates are made about the future. The Schedule of Funding Progress for the Retiree Health Plan, presented as required supplementary information in the section following the Notes to Financial Statements, will present multiyear trend information about whether the actuarial value of plan assets is increasing or decreasing over time relative to the actuarial accrued liabilities for benefits. Projections of benefits for financial reporting purposes are based on the plan as understood by the employer and the plan members and include the types of benefits provided at the time of each valuation and the historical pattern of sharing of benefit costs between the employer and plan members to that point. The actuarial methods and assumptions used include techniques designed to reduce the effects of short-term volatility in actuarial accrued liabilities and the actuarial value of assets, consistent with the long-term perspective of the calculations. As of the July 1, 2015 actuarial valuation date, the frozen entry age actuarial cost method was used. The actuarial assumptions include a 2.5% discount rate based on the District's funding policy. The projected annual medical trend rate is 6%. Mortality rates are from the RP 2000 Group Annuity Mortality Table Projected to 2015, applied on a 2/3 female, 1/3 male basis. Annual retirement probabilities were developed based upon recent Linn-Mar Community School District experience. Termination probabilities were based upon national

53
termination studies performed by the Society of Actuaries and were adjusted to reflect the recent lower termination rates experienced by Linn-Mar Community School District. The UAAL is being amortized as a level percentage of projected payroll expense on an open basis over 30 years.
Note 9. Due From and Due to Other Funds
Receivable Fund Payable Fund Amount
Special Revenue: General Student Activity $ 1,749
These interfund balances arise from timing differences involved in the reimbursement of
expenses at year end. The balances between governmental funds have been eliminated from the Government-wide Statement of Net Position. Note 10. Risk Management
Health insurance - Six public education entities are currently participating in a 28E organization which was established in 1990 to provide a self-insurance plan for employee medical coverage. The Districts contribute to the self-insurance plan an amount equal to 125% of Wellmark Blue Cross/Blue Shield projections of the rating period. The fund reinsures for stop-loss insurance for claims in excess of $200,000 per year per individual. An insurance carrier is paid an administrative fee to process the claims.
The total premium paid into the plan by all six members from July 1, 2015 to June 30, 2016 was approximately $33,000,000 of which $6,315,177 was paid by Linn-Mar Community School District. In addition, the District is exposed to various risks of loss related to torts, theft, damage to and destruction of assets, errors and omissions, injuries to employees, and natural disasters. These risks are covered by the purchase of commercial insurance. Settled claims from these risks have not exceeded commercial insurance coverage in any of the past four fiscal years. Note 11. Area Education Agency The District is required by the Code of Iowa to budget for its share of special education support, media and educational services provided through the area education agency. The District’s actual amount for this purpose totaled $3,055,116 for the year ended June 30, 2016 and is recorded in the General Fund by making a memorandum adjusting entry to the cash basis financial statements. Note 12. Categorical Funding
The District's restricted fund balance for categorical funding at June 30, 2016 is comprised of the following programs:
Programs Amount
Gifted and talented programs $ 133,421 Returning dropouts and dropout prevention programs 94,674 Teacher leadership grants 112,384 Beginning teacher mentoring and induction program 10,294 Teacher salary supplement 171,646 Successful progression for early readers 171,931 Professional development for model core curriculum 350,843 Professional development 304,026 Market factor incentives 14,578 Total restricted for categorical funding $ 1,363,797

54
Note 13. Budget Overexpenditure
Per the Code of Iowa, expenditures may not legally exceed budgeted appropriations at the functional area level. During the year ended June 30, 2016, expenditures in the instruction functional area exceeded the amount budgeted. Note 14. Construction Commitments
The District has entered into contracts totaling $26,283,574 for various construction projects throughout the District. As of June 30, 2016, costs of $20,095,772 had been incurred against these contracts. The remaining balance on the projects at June 30, 2016 will be paid as work on the projects progresses. Note 15. Disaggregation of Receivables and Payables Receivables and payables are disaggregated on the face of the basic financial statements. All receivables are expected to be collected within the next year. Note 16. Due from Other Governments Amount due from other governments by fund as of June 30, 2016 are as follows:
Statewide Sales,Services & Use Tax
Account Total
Local appropriations: Tuition $ 575,740 - 575,740 Other 50,396 - 50,396 Total local appropriations 626,136 - 626,136
State appropriations: Statewide Sales, Services and Use Tax - 1,119,790 1,119,790 Nonpublic Transportation 116,327 - 116,327 Fuel Tax Refund 3,990 - 3,990 District Court Placed SPED 37,577 - 37,577 Foster Care 21,827 - 21,827 Vocational Aid 18,567 - 18,567 Total state appropriations 198,288 1,119,790 1,318,078
Federal appropriations: Aid Education 447 - 447 Title I 100,627 - 100,627 Perkins 42,942 - 42,942 Total federal appropriations 144,016 - 144,016 Total $ 968,440 1,119,790 2,088,230
GeneralFund
Note 17. Lease Agreements On June 9, 2014 the District entered into an agreement with De Lange Public Finance LLC to lease forty three copy machines for sixty months. During the year ended June 30, 2015 the District paid $47,419 in principal and $6,881 in interest on this lease agreement. At June 30, 2016 thirty-six monthly payments of $4,525 totaling $162,900 remain.
On May 1, 2015, Kids, Inc. entered into an agreement with the District for the rental of a multi-purpose room for fiscal year 2016 at Bowman Woods Elementary, Indian Creek Elementary and Westfield Elementary for the purpose of operating a daycare/before and after school program. According to the

55
terms of the agreement, Kids Inc. will pay the District $750 per month per location for September through May and $1,300 per month per location for June through August for the multi-purpose room.
On February 25, 2015, the YMCA entered into an agreement with the District for the rental of a multi-purpose room for fiscal years 2016 and 2017 at Echo Hill Elementary for the purpose of operating a daycare/before and after school program. According to the terms of the agreement, the YMCA will pay the District $750 per month for September through May and $1,300 per month for June through August for the multi-purpose room.
On February 25, 2015, the Hand In Hand Daycare entered into an agreement with the District for
the rental of a multi-purpose room for fiscal years 2016 and 2017 at Linn Grove Elementary, Novak Elementary and Wilkins Elementary for the purpose of operating a daycare/before and after school program. According to the terms of the agreement, Hand in Hand Daycare will pay the District $750 per month for September through May and $1,300 per month for June through August for the multi-purpose room. Note 18. Reconciliation of Governmental Fund Balances to Net Position
The following is the detailed reconciliation of the Governmental Fund Balance Sheet to the Statement of Net Position.
Net investment Management Debt Unassigned/in Capital Assets Levy Service Unrestricted
Fund balance (page 30) $ - 2,013,570 9,048,062 8,317,146 Captial assets, net of accumulated depreciation 147,951,036 - - - Revenue bond capitalized indebtedness (57,010,000) - - - General obligation bond capitalized indebtedness (32,335,000) - - - Capital loan note capitalized indebtedness (10,000,000) - - - Termination benefits payable - (190,764) - - Accrued interest payable - - (1,057,131) - Compensated absences - - - (67,837) Net OPEB liability - - - (1,290,658) Pension related deferred outflows - - - 7,619,511 Pension related deferred inflows - - - (2,960,116) Net pension liability - - - (34,519,523) Assigned for specific purposes - - - 445,301 Net position (page 28) $ 48,606,036 1,822,806 7,990,931 (22,456,176)

56
LINN-MAR COMMUNITY SCHOOL DISTRICT

57
REQUIRED SUPPLEMENTARY INFORMATION
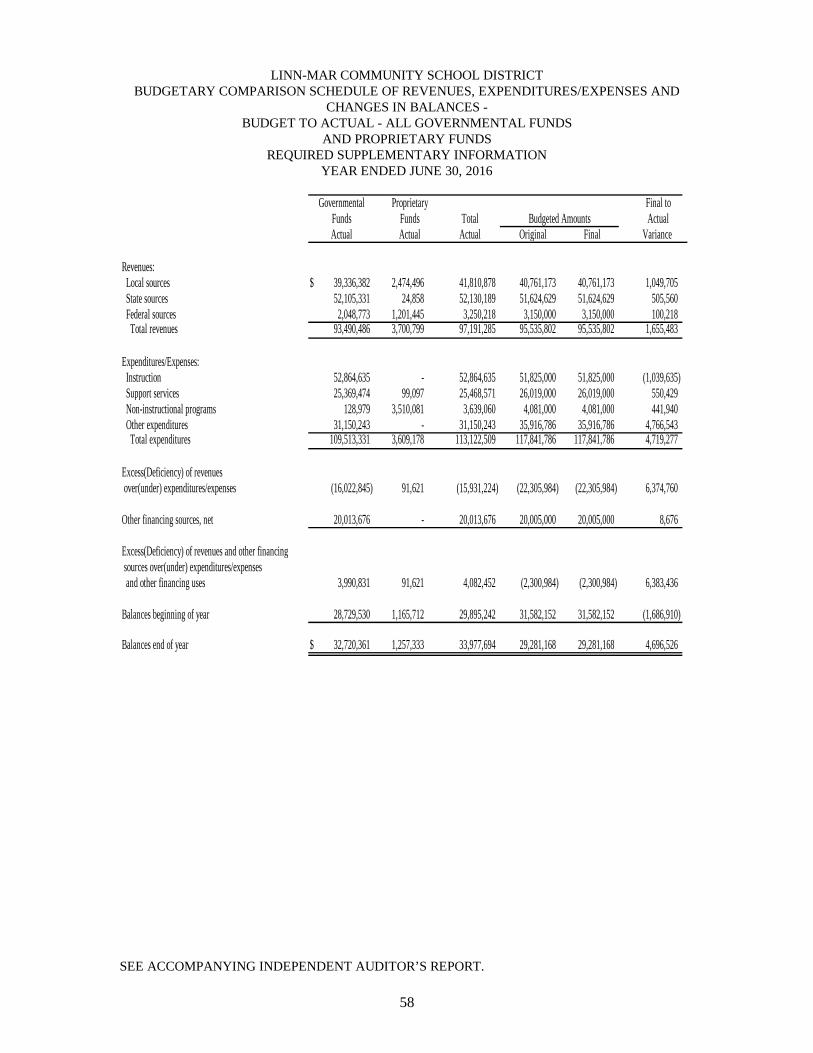
58
LINN-MAR COMMUNITY SCHOOL DISTRICT BUDGETARY COMPARISON SCHEDULE OF REVENUES, EXPENDITURES/EXPENSES AND
CHANGES IN BALANCES - BUDGET TO ACTUAL - ALL GOVERNMENTAL FUNDS
AND PROPRIETARY FUNDS REQUIRED SUPPLEMENTARY INFORMATION
YEAR ENDED JUNE 30, 2016
Governmental Final toFunds Funds Total Budgeted Amounts ActualActual Actual Actual Original Final Variance
Revenues: Local sources $ 39,336,382 2,474,496 41,810,878 40,761,173 40,761,173 1,049,705 State sources 52,105,331 24,858 52,130,189 51,624,629 51,624,629 505,560 Federal sources 2,048,773 1,201,445 3,250,218 3,150,000 3,150,000 100,218 Total revenues 93,490,486 3,700,799 97,191,285 95,535,802 95,535,802 1,655,483
Expenditures/Expenses: Instruction 52,864,635 - 52,864,635 51,825,000 51,825,000 (1,039,635) Support services 25,369,474 99,097 25,468,571 26,019,000 26,019,000 550,429 Non-instructional programs 128,979 3,510,081 3,639,060 4,081,000 4,081,000 441,940 Other expenditures 31,150,243 - 31,150,243 35,916,786 35,916,786 4,766,543 Total expenditures 109,513,331 3,609,178 113,122,509 117,841,786 117,841,786 4,719,277
Excess(Deficiency) of revenues over(under) expenditures/expenses (16,022,845) 91,621 (15,931,224) (22,305,984) (22,305,984) 6,374,760
Other financing sources, net 20,013,676 - 20,013,676 20,005,000 20,005,000 8,676
Excess(Deficiency) of revenues and other financing sources over(under) expenditures/expenses and other financing uses 3,990,831 91,621 4,082,452 (2,300,984) (2,300,984) 6,383,436
Balances beginning of year 28,729,530 1,165,712 29,895,242 31,582,152 31,582,152 (1,686,910)
Balances end of year $ 32,720,361 1,257,333 33,977,694 29,281,168 29,281,168 4,696,526
Proprietary
SEE ACCOMPANYING INDEPENDENT AUDITOR’S REPORT.
59
LINN-MAR COMMUNITY SCHOOL DISTRICT NOTES TO REQUIRED SUPPLEMENTARY INFORMATION - BUDGETARY REPORTING
YEAR ENDED JUNE 30, 2016
This budgetary comparison is presented as Required Supplementary Information in accordance with Government Accounting Standards Board Statement No. 41 for governments with significant budgetary perspective differences resulting from not being able to present budgetary comparisons for the General Fund and each major Special Revenue Fund.
In accordance with the Code of Iowa, the Board of Education annually adopts a budget following required public notice and hearing for all funds except Private Purpose Trust and Agency Funds. The budget may be amended during the year utilizing similar statutorily prescribed procedures. The District’s budget is prepared on the GAAP basis. Formal and legal budgetary control for the certified budget is based upon four major classes of expenditures known as functional areas, not by fund or fund type. These four functional areas are instruction, support services, non-instructional programs and other expenditures. Although the budget document presents functional area expenditures or expenses by fund, the legal level of control is at the aggregated functional level, not at the fund or fund type level. The Code of Iowa also provides that District expenditures in the General Fund may not exceed the amount authorized by the school finance formula. During the year ended June 30, 2016, expenditures in the instruction functional area exceeded the amount budgeted.

60
LINN-MAR COMMUNITY SCHOOL DISTRICT SCHEDULE OF THE DISTRICT’S PROPORTIONATE SHARE OF THE NET PENSION LIABILITY
IOWA PUBLIC EMPLOYEES’ RETIREMENT SYSTEM LAST TWO FISCAL YEARS*
REQUIRED SUPPLEMENTARY INFORMATION
2016 2015
District's proportion of the net pension liability 0.717733% 0.689442%
District's proportionate share of the net pension liability $ 35,459,499 27,342,634
District's covered-employee payroll $ 49,198,902 45,121,232
District's proportionate share of the net pension liability as a percentage of its covered-employee payroll 72.07% 60.60%
IPERS net position as a percentage of the total pension liability 85.19% 87.61%
* In accordance with GASB Statement No. 68, the amount presented for each fiscal year were determined as of June 30 of the preceding year.
Note: GASB Statement No. 68 requires ten years of information to be presentedin this table. However, until a full 10-year trend is compiled the District willpresent information for those years for which information is available.
SEE ACCOMPANYING INDEPENDENT AUDITOR’S REPORT.
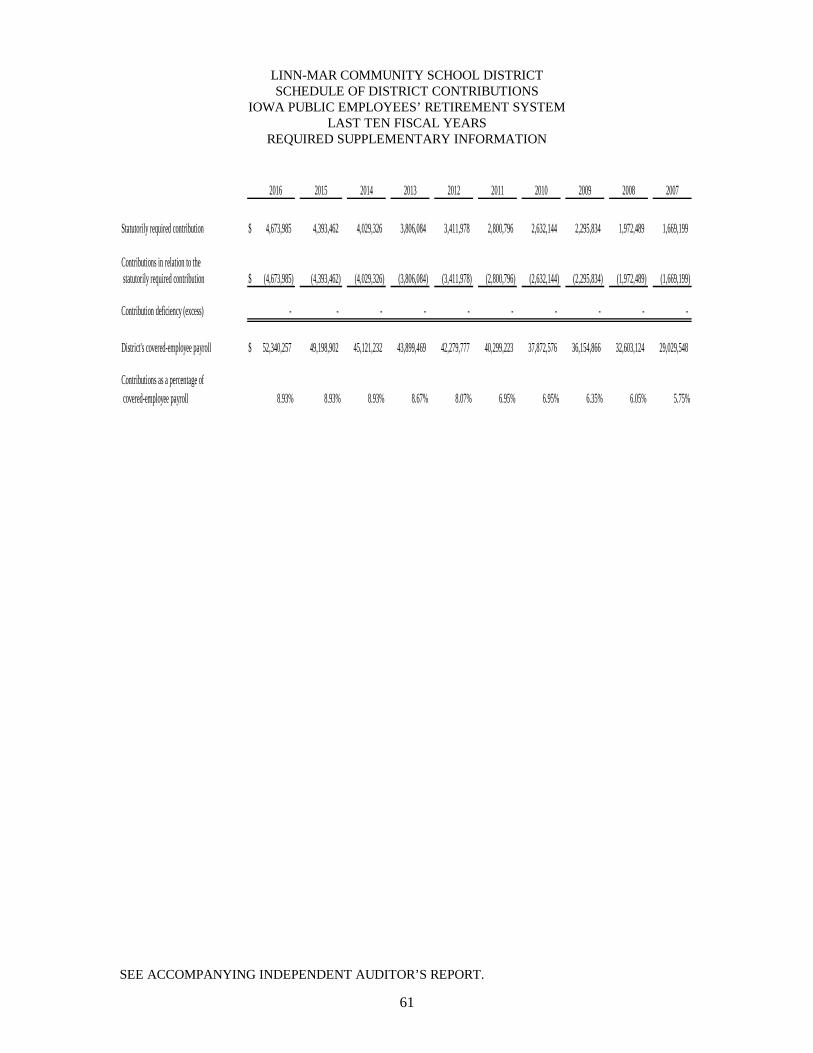
61
LINN-MAR COMMUNITY SCHOOL DISTRICT SCHEDULE OF DISTRICT CONTRIBUTIONS
IOWA PUBLIC EMPLOYEES’ RETIREMENT SYSTEM LAST TEN FISCAL YEARS
REQUIRED SUPPLEMENTARY INFORMATION
2016 2015 2014 2013 2012 2011 2010 2009 2008 2007
Statutorily required contribution $ 4,673,985 4,393,462 4,029,326 3,806,084 3,411,978 2,800,796 2,632,144 2,295,834 1,972,489 1,669,199
Contributions in relation to the statutorily required contribution $ (4,673,985) (4,393,462) (4,029,326) (3,806,084) (3,411,978) (2,800,796) (2,632,144) (2,295,834) (1,972,489) (1,669,199)
Contribution deficiency (excess) - - - - - - - - - -
District's covered-employee payroll $ 52,340,257 49,198,902 45,121,232 43,899,469 42,279,777 40,299,223 37,872,576 36,154,866 32,603,124 29,029,548
Contributions as a percentage of covered-employee payroll 8.93% 8.93% 8.93% 8.67% 8.07% 6.95% 6.95% 6.35% 6.05% 5.75%
SEE ACCOMPANYING INDEPENDENT AUDITOR’S REPORT.
62
LINN-MAR COMMUNITY SCHOOL DISTRICT NOTES TO REQUIRED SUPPLEMENTARY INFORMATION - PENSION LIABILITY
YEAR ENDED JUNE 30, 2016
Changes of benefit terms:
Legislation passed in 2010 modified benefit terms for current Regular members. The definition of final average salary changed from the highest three to the highest five years of covered wages. The vesting requirement changed from four years of service to seven years. The early retirement reduction increased from 3 percent per year measured from the member’s first unreduced retirement age to a 6 percent reduction for each year of retirement before age 65.
In 2008, legislative action transferred four groups – emergency medical service providers, county
jailers, county attorney investigators, and National Guard installation security officers – from Regular membership to the protection occupation group for future service only. Changes of assumptions:
The 2014 valuation implemented the following refinements as a result of a quadrennial experience study:
• Decreased the inflation assumption from 3.25 percent to 3.00 percent • Decreased the assumed rate of interest on member accounts from 4.00 percent to 3.75 percent
per year. • Adjusted male mortality rates for retirees in the Regular membership group. • Reduced retirement rates for sheriffs and deputies between the ages of 55 and 64. • Moved from an open 30 year amortization period to a closed 30 year amortization period for
the UAL beginning June 30, 2014. Each year thereafter, changes in the UAL from plan experience will be amortized on a separate closed 20 year period.
The 2010 valuation implemented the following refinements as a result of a quadrennial
experience study: • Adjusted retiree mortality assumptions. • Modified retirement rates to reflect fewer retirements. • Lowered disability rates at most ages. • Lowered employment termination rates • Generally increased the probability of terminating members receiving a deferred retirement benefit. • Modified salary increase assumptions based on various service duration.
The 2007 valuation adjusted the application of the entry age normal cost method to better match
projected contributions to the projected salary stream in the future years. It also included the one-year lag between the valuation date and the effective date of the annual actuarial contribution rate in the calculation of the UAL payments.

63
LINN-MAR COMMUNITY SCHOOL DISTRICT SCHEDULE OF FUNDING PROGRESS FOR THE RETIREE HEALTH PLAN
REQUIRED SUPPLEMENTARY INFORMATION (IN THOUSANDS)
Annual Contributions Actuarial UAAL as aRequired Contributions Made By Actuarial Accrued Unfunded Percentage
Year Actuarial Contributions Made By District as a Value of Liability AAL Funded Covered of CoveredEnded Valuation (ARC) District Percentage of ARC Assets (AAL) (UAAL) Ratio Payroll Payroll
June 30, Date (a) (b) (b/a) (c) (d) (d-e) (c/d) (e) ((d-c)/e)
2009 July 1, 2008 0.245$ -$ 0.0% -$ 1,761$ 1,761$ 0.0% 39,747$ 4.4%2010 July 1, 2009 0.245$ 0.044$ 18.0% -$ 1,290$ 1,290$ 0.0% 41,783$ 4.4%2011 July 1, 2009 0.245$ 0.050$ 20.4% -$ 1,290$ 1,290$ 0.0% 42,567$ 3.0%2012 July 1, 2011 0.294$ 0.049$ 16.7% -$ 1,717$ 1,717$ 0.0% 21,284$ 8.1%2013 July 1, 2011 0.294$ 0.048$ 16.3% -$ 1,717$ 1,717$ 0.0% 22,174$ 7.7%2014 July 1, 2013 0.293$ 0.055$ 18.8% -$ 1,911$ 1,911$ 0.0% 29,466$ 6.5%2015 July 1, 2013 0.297$ 0.044$ 14.8% -$ 1,865$ 1,865$ 0.0% 31,328$ 6.0%2016 July 1, 2015 0.260$ 0.026$ 10.0% -$ 1,742$ 1,742$ 0.0% 32,423$ 5.4%
Employer Contributions for Retiree Health Plan Schedule of Funding Progress for Retiree Health Plan
See Note 8 in the accompanying Notes to Financial Statements for the plan description, funding policy, annual OPEB Cost and Net OPEB Obligation, funded status and funding progress.
No information available prior to June 30, 2009. SEE ACCOMPANYING INDEPENDENT AUDTIOR’S REPORT.

64
LINN-MAR COMMUNITY SCHOOL DISTRICT

65
SUPPLEMENTARY INFORMATION

66
LINN-MAR COMMUNITY SCHOOL DISTRICT COMBINING BALANCE SHEET
NONMAJOR GOVERNMENTAL FUNDS JUNE 30, 2016
Public EducationManagement Student and Recreation
Fund Activity Levy TotalASSETS Cash and pooled investments $ 2,012,173 609,809 331,231 2,953,213 Receivables: Property tax: Delinquent 3,319 - 826 4,145 Succeeding year 879,997 - 252,362 1,132,359 Accounts - 1,233 - 1,233
TOTAL ASSETS $ 2,895,489 611,042 584,419 4,090,950
LIABILITIES, DEFERRED INFLOWS OF RESOURCES AND FUND BALANCES Liabilities: Due to other funds $ - 1,749 - 1,749 Accounts payable 1,922 38,994 8,354 49,270 Salaries and benefits payable - 14,500 2,927 17,427 Total liabilities 1,922 55,243 11,281 68,446
Deferred inflows of resources: Property taxes levies for subsequent fiscal year 879,997 - 252,362 1,132,359
Fund balances: Restricted for: Management levy purposes 2,013,570 - - 2,013,570 Student activities - 555,799 - 555,799 Public education and recreation levy purposes - - 320,776 320,776 Total fund balances 2,013,570 555,799 320,776 2,890,145 TOTAL LIABILITIES, DEFERRED INFLOWS OF RESOURCES AND FUND BALANCES $ 2,895,489 611,042 584,419 4,090,950
Special Revenue
SEE ACCOMPANYING INDEPENDENT AUDITOR’S REPORT.
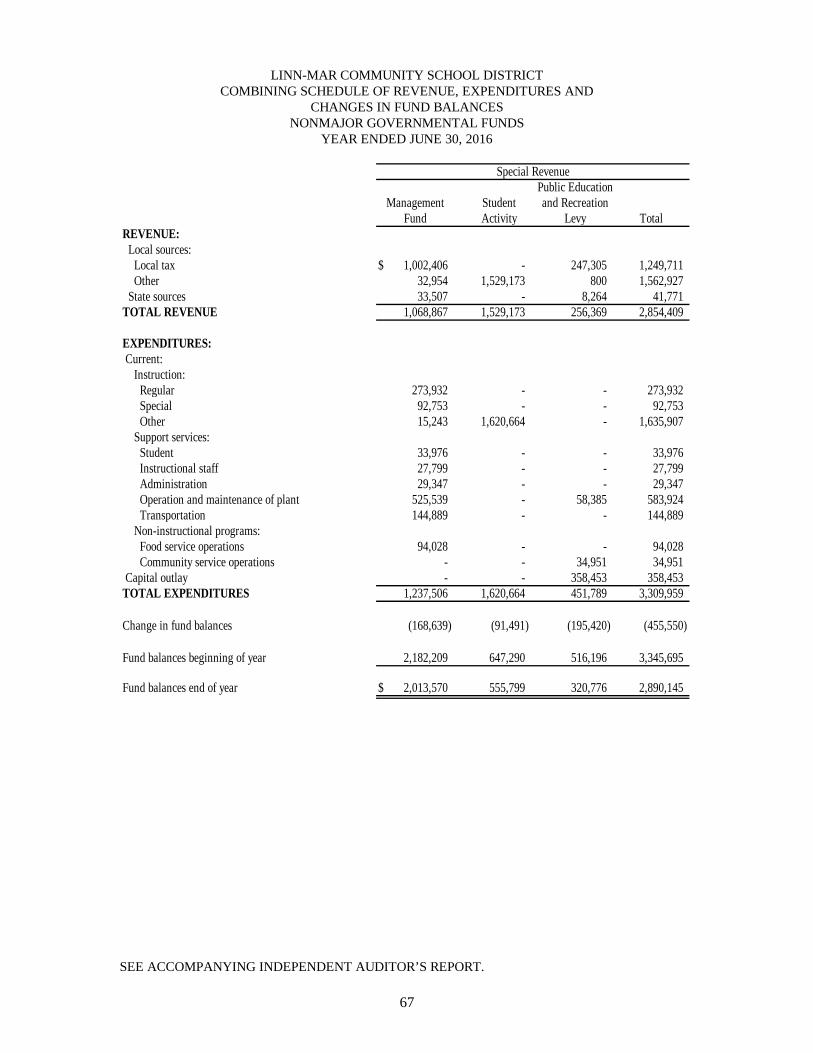
67
LINN-MAR COMMUNITY SCHOOL DISTRICT COMBINING SCHEDULE OF REVENUE, EXPENDITURES AND
CHANGES IN FUND BALANCES NONMAJOR GOVERNMENTAL FUNDS
YEAR ENDED JUNE 30, 2016
Public EducationManagement Student and Recreation
Fund Activity Levy TotalREVENUE: Local sources: Local tax $ 1,002,406 - 247,305 1,249,711 Other 32,954 1,529,173 800 1,562,927 State sources 33,507 - 8,264 41,771 TOTAL REVENUE 1,068,867 1,529,173 256,369 2,854,409
EXPENDITURES: Current: Instruction: Regular 273,932 - - 273,932 Special 92,753 - - 92,753 Other 15,243 1,620,664 - 1,635,907 Support services: Student 33,976 - - 33,976 Instructional staff 27,799 - - 27,799 Administration 29,347 - - 29,347 Operation and maintenance of plant 525,539 - 58,385 583,924 Transportation 144,889 - - 144,889 Non-instructional programs: Food service operations 94,028 - - 94,028 Community service operations - - 34,951 34,951 Capital outlay - - 358,453 358,453 TOTAL EXPENDITURES 1,237,506 1,620,664 451,789 3,309,959
Change in fund balances (168,639) (91,491) (195,420) (455,550)
Fund balances beginning of year 2,182,209 647,290 516,196 3,345,695
Fund balances end of year $ 2,013,570 555,799 320,776 2,890,145
Special Revenue
SEE ACCOMPANYING INDEPENDENT AUDITOR’S REPORT.
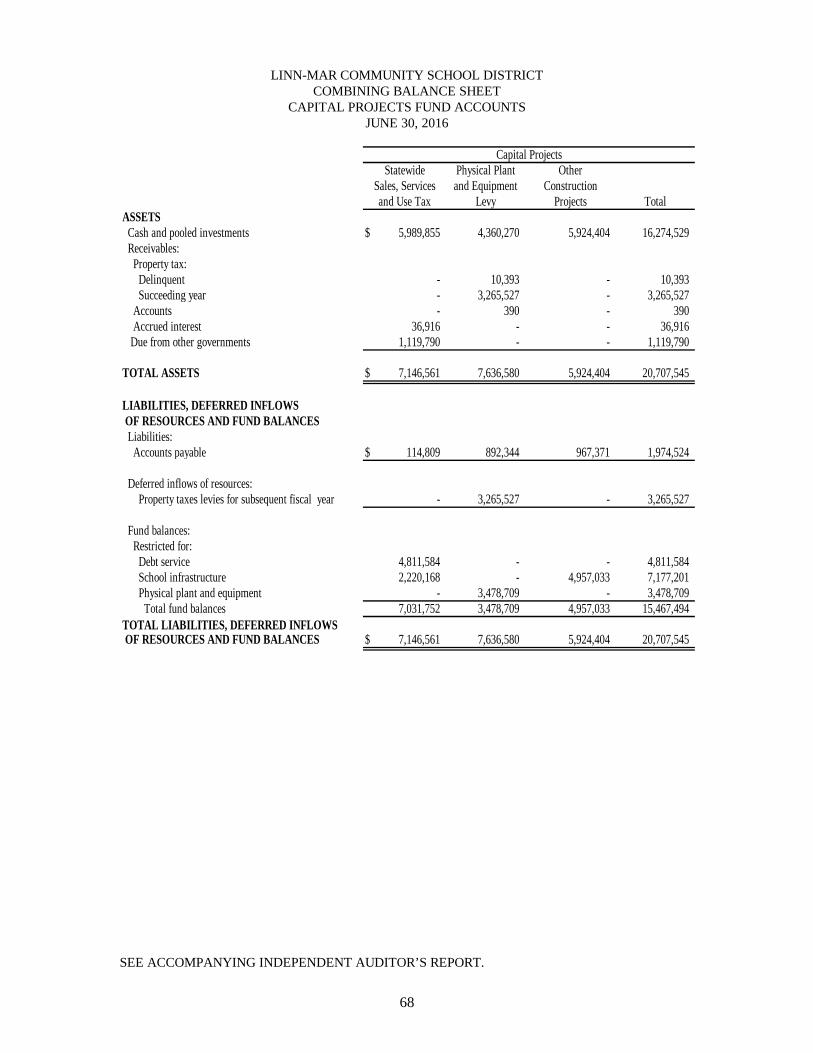
68
LINN-MAR COMMUNITY SCHOOL DISTRICT COMBINING BALANCE SHEET
CAPITAL PROJECTS FUND ACCOUNTS JUNE 30, 2016
Physical Plant Otherand Equipment Construction
Levy Projects TotalASSETS Cash and pooled investments $ 5,989,855 4,360,270 5,924,404 16,274,529 Receivables: Property tax: Delinquent - 10,393 - 10,393 Succeeding year - 3,265,527 - 3,265,527 Accounts - 390 - 390 Accrued interest 36,916 - - 36,916 Due from other governments 1,119,790 - - 1,119,790
TOTAL ASSETS $ 7,146,561 7,636,580 5,924,404 20,707,545
LIABILITIES, DEFERRED INFLOWS OF RESOURCES AND FUND BALANCES Liabilities: Accounts payable $ 114,809 892,344 967,371 1,974,524
Deferred inflows of resources: Property taxes levies for subsequent fiscal year - 3,265,527 - 3,265,527
Fund balances: Restricted for: Debt service 4,811,584 - - 4,811,584 School infrastructure 2,220,168 - 4,957,033 7,177,201 Physical plant and equipment - 3,478,709 - 3,478,709 Total fund balances 7,031,752 3,478,709 4,957,033 15,467,494 TOTAL LIABILITIES, DEFERRED INFLOWS OF RESOURCES AND FUND BALANCES $ 7,146,561 7,636,580 5,924,404 20,707,545
Capital Projects
and Use TaxSales, Services
Statewide
SEE ACCOMPANYING INDEPENDENT AUDITOR’S REPORT.
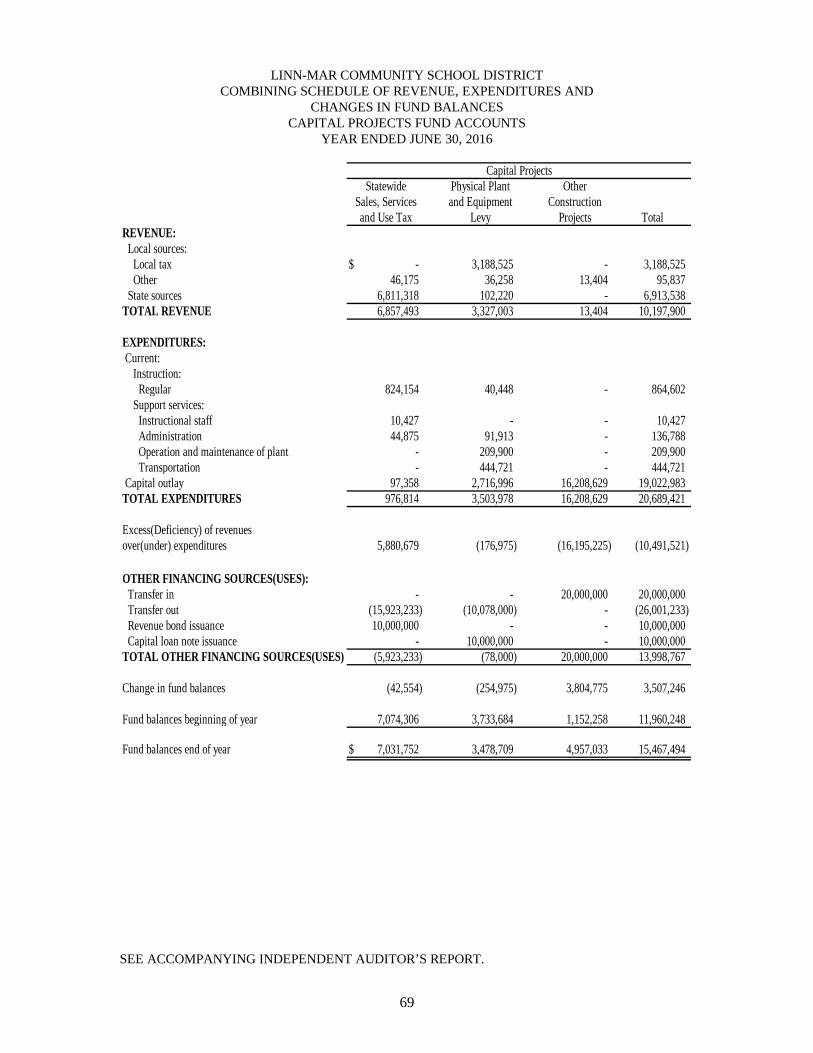
69
LINN-MAR COMMUNITY SCHOOL DISTRICT COMBINING SCHEDULE OF REVENUE, EXPENDITURES AND
CHANGES IN FUND BALANCES CAPITAL PROJECTS FUND ACCOUNTS
YEAR ENDED JUNE 30, 2016
Physical Plant Otherand Equipment Construction
Levy Projects TotalREVENUE: Local sources: Local tax $ - 3,188,525 - 3,188,525 Other 46,175 36,258 13,404 95,837 State sources 6,811,318 102,220 - 6,913,538 TOTAL REVENUE 6,857,493 3,327,003 13,404 10,197,900
EXPENDITURES: Current: Instruction: Regular 824,154 40,448 - 864,602 Support services: Instructional staff 10,427 - - 10,427 Administration 44,875 91,913 - 136,788 Operation and maintenance of plant - 209,900 - 209,900 Transportation - 444,721 - 444,721 Capital outlay 97,358 2,716,996 16,208,629 19,022,983 TOTAL EXPENDITURES 976,814 3,503,978 16,208,629 20,689,421
Excess(Deficiency) of revenuesover(under) expenditures 5,880,679 (176,975) (16,195,225) (10,491,521)
OTHER FINANCING SOURCES(USES): Transfer in - - 20,000,000 20,000,000 Transfer out (15,923,233) (10,078,000) - (26,001,233) Revenue bond issuance 10,000,000 - - 10,000,000 Capital loan note issuance - 10,000,000 - 10,000,000 TOTAL OTHER FINANCING SOURCES(USES) (5,923,233) (78,000) 20,000,000 13,998,767
Change in fund balances (42,554) (254,975) 3,804,775 3,507,246
Fund balances beginning of year 7,074,306 3,733,684 1,152,258 11,960,248
Fund balances end of year $ 7,031,752 3,478,709 4,957,033 15,467,494
StatewideSales, Servicesand Use Tax
Capital Projects
SEE ACCOMPANYING INDEPENDENT AUDITOR’S REPORT.

70
LINN-MAR COMMUNITY SCHOOL DISTRICT COMBINING SCHEDULE OF NET POSITION
NONMAJOR PROPRIETARY FUNDS JUNE 30, 2016
Aquatic ROARCenter Store Total
ASSETSCurrent assets: Cash and pooled investments $ 1,507,317 136,654 1,811 1,645,782 Accounts receivable 5,933 211 300 6,444 Inventories 26,047 - - 26,047 Total current assets 1,539,297 136,865 2,111 1,678,273
Non-current assets:Capital assets: Machinery and equipment, net of accumulated depreciation 541,797 - - 541,797 TOTAL ASSETS 2,081,094 136,865 2,111 2,220,070
DEFERRED OUTFLOWS OF RESOURCES Pension related deferred outflows 203,717 9,102 - 212,819
LIABILITIESCurrent liabilities: Accounts payable 1,188 1,003 - 2,191 Salaries and benefits payable 9,239 19,988 - 29,227 Unearned revenues 81,733 - - 81,733 Total current liabilities 92,160 20,991 - 113,151
Noncurrent liabilities: Net pension liability 928,014 11,962 - 939,976 Net OPEB liability 34,453 - - 34,453 Total long-term liabilities 962,467 11,962 - 974,429 TOTAL LIABILITIES 1,054,627 32,953 - 1,087,580
DEFERRED INFLOWS OF RESOURCES Pension related deferred inflows 87,975 1 - 87,976
NET POSITION Investment in capital assets 541,797 - - 541,797 Unrestricted 600,412 113,013 2,111 715,536 TOTAL NET POSITION $ 1,142,209 113,013 2,111 1,257,333
Business Type Activities:Nonmajor Enterprise Funds
SchoolNutrition
SEE ACCOMPANYING INDEPENDENT AUDITOR’S REPORT.
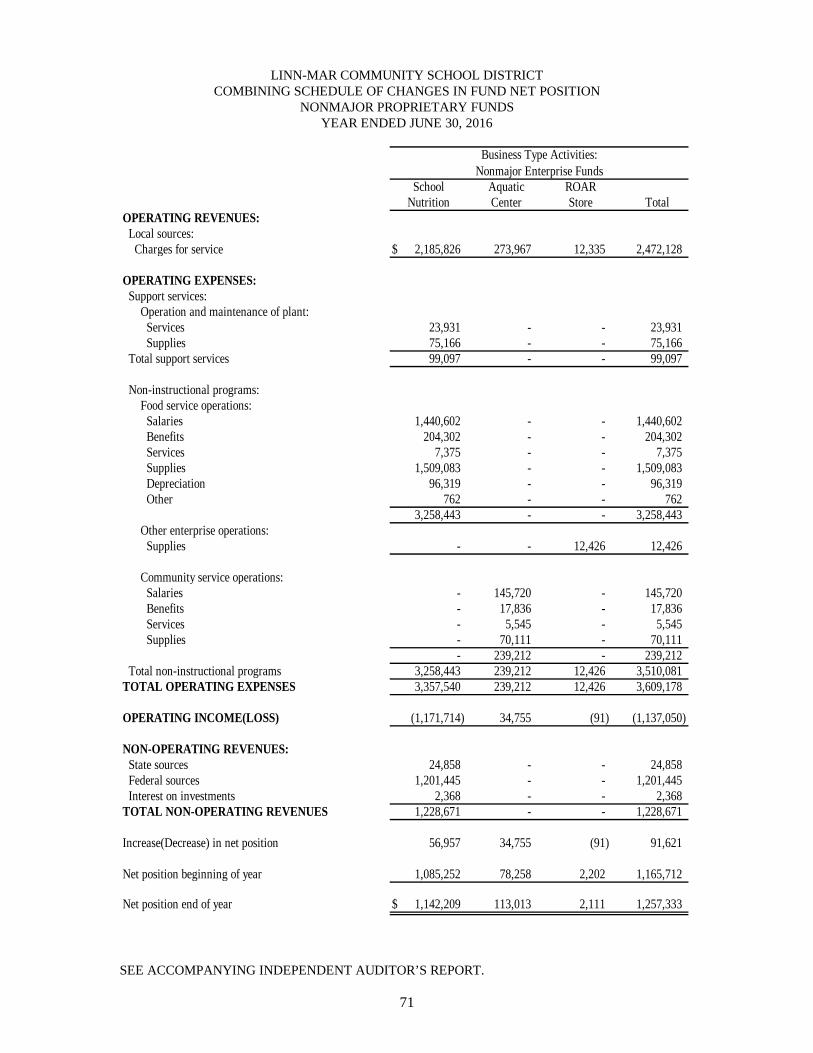
71
LINN-MAR COMMUNITY SCHOOL DISTRICT COMBINING SCHEDULE OF CHANGES IN FUND NET POSITION
NONMAJOR PROPRIETARY FUNDS YEAR ENDED JUNE 30, 2016
Aquatic ROARCenter Store Total
OPERATING REVENUES: Local sources: Charges for service $ 2,185,826 273,967 12,335 2,472,128
OPERATING EXPENSES: Support services: Operation and maintenance of plant: Services 23,931 - - 23,931 Supplies 75,166 - - 75,166 Total support services 99,097 - - 99,097
Non-instructional programs: Food service operations: Salaries 1,440,602 - - 1,440,602 Benefits 204,302 - - 204,302 Services 7,375 - - 7,375 Supplies 1,509,083 - - 1,509,083 Depreciation 96,319 - - 96,319 Other 762 - - 762
3,258,443 - - 3,258,443 Other enterprise operations: Supplies - - 12,426 12,426
Community service operations: Salaries - 145,720 - 145,720 Benefits - 17,836 - 17,836 Services - 5,545 - 5,545 Supplies - 70,111 - 70,111
- 239,212 - 239,212 Total non-instructional programs 3,258,443 239,212 12,426 3,510,081 TOTAL OPERATING EXPENSES 3,357,540 239,212 12,426 3,609,178
OPERATING INCOME(LOSS) (1,171,714) 34,755 (91) (1,137,050)
NON-OPERATING REVENUES: State sources 24,858 - - 24,858 Federal sources 1,201,445 - - 1,201,445 Interest on investments 2,368 - - 2,368 TOTAL NON-OPERATING REVENUES 1,228,671 - - 1,228,671
Increase(Decrease) in net position 56,957 34,755 (91) 91,621
Net position beginning of year 1,085,252 78,258 2,202 1,165,712
Net position end of year $ 1,142,209 113,013 2,111 1,257,333
Business Type Activities:Nonmajor Enterprise Funds
SchoolNutrition
SEE ACCOMPANYING INDEPENDENT AUDITOR’S REPORT.

72
LINN-MAR COMMUNITY SCHOOL DISTRICT COMBINING SCHEDULE OF CASH FLOWS
NONMAJOR PROPRIETARY FUNDS YEAR ENDED JUNE 30, 2016
Aquatic ROARCenter Store Total
Cash flows from operating activities: Cash received from sale of lunches and breakfasts $ 2,185,486 - - 2,185,486 Cash received from aquatic center operations - 273,756 - 273,756 Cash received from ROAR store operations - - 12,035 12,035 Cash payments to employees for services (1,687,969) (159,221) - (1,847,190) Cash payments to suppliers for goods or services (1,387,752) (77,623) (12,426) (1,477,801) Net cash provided by(used by) operating activities (890,235) 36,912 (391) (853,714)
Cash flows from non-capital financing activities: Interfund repayments (5,585) - - (5,585) State grants received 24,858 - - 24,858 Federal grants received 967,117 - - 967,117 Net cash provided by non-capital financing activities 986,390 - - 986,390 Cash flows from capital and related financing activities: Acquisition of capital assets (34,747) - - (34,747)
Cash flows from investing activities: Interest on investments 2,368 - - 2,368
Net increase(decrease) in cash and cash equivalents 63,776 36,912 (391) 100,297
Cash and cash equivalents beginning of year 1,443,541 99,742 2,202 1,545,485
Cash and cash equivalents end of year $ 1,507,317 136,654 1,811 1,645,782
Reconciliation of operating income(loss) to net cash provided by(used by) operating activities: Operating income(loss) $ (1,171,714) 34,755 (91) (1,137,050) Adjustments to reconcile operating income(loss) to net cash provided by(used by) operating activities: Commodities consumed 234,328 - - 234,328 Depreciation 96,319 - - 96,319 Increase in inventories (5,262) - - (5,262) Increase in accounts receivable (5,933) (211) (300) (6,444) Decrease in accounts payable (501) (1,967) - (2,468) Increase(Decrease) in salaries and benefits payable (10,967) 5,240 - (5,727) Increase in other postemployment benefits 4,827 - - 4,827 Increase in net pension liability 206,168 6,493 - 212,661 Increase in deferred outflows of resources (52,438) (5,288) - (57,726) Decrease in deferred inflows of resources (190,655) (2,110) - (192,765) Increase in unearned revenue 5,593 - - 5,593 Net cash provided by (used by) operating activities $ (890,235) 36,912 (391) (853,714)
NON-CASH INVESTING, CAPITAL AND RELATED FINANCING ACTIVITIES:
During the year ended June 30, 2016, the District received Federal commodities valued at $234,328.
Nutrition
Business Type Activities:Nonmajor Enterprise Funds
School
SEE ACCOMPANYING INDEPENDENT AUDITOR’S REPORT.

73
LINN-MAR COMMUNITY SCHOOL DISTRICT
STATISTICAL SECTION
(UNAUDITED)
This part of the Linn-Mar Community School District’s comprehensive annual financial report presents detailed information as a context for understanding what the information in the financial statements, note disclosures, and required supplementary information says about the District’s overall financial health.
Contents Page
Financial Trends 74-89 These schedules contain trend information to help the reader understand how the District’s financial performance and well-being have changed over time. Revenue Capacity 90-96 These schedules contain trend information to help the reader assess the factors affecting the District’s ability to generate its property taxes. Debt Capacity 97-101 These schedules contain trend information to help the reader assess the affordability of the District’s current levels of outstanding debt and the District’s ability to issue additional debt in the future. Demographic and Economic Information 102-107 These schedules offer demographic and economic indicators to help the reader understand the environment within which the District’s financial activities take place and to help make comparisons over time and with other governments. Operating Information 108-114 These schedules contain information about the District’s operations and resources to help the reader understand how the District’s financial information relates to the services the District provides and the activities it performs.

74
LINN-MAR COMMUNITY SCHOOL DISTRICT NET POSITION BY COMPONENT,
Last Ten Fiscal Years (Accrual Basis of Accounting)
2016 2015 2014 2013Governmental activities: Net investment in capital assets $ 48,606,036 48,003,951 41,210,373 28,177,257 Restricted 22,710,019 18,775,506 21,066,774 29,254,906 Unrestricted (22,456,176) (23,819,849) 7,271,405 7,658,223 Business type activities: Net Investment in capital assets 541,797 603,369 609,640 707,568 Unrestricted 715,536 562,343 1,164,312 934,357 Total primary government net position $ 50,117,212 44,125,320 71,322,504 66,732,311
Note: District implemented GASB Statement No. 68 and No. 71 during fiscal year 2015. Note: District implemented GASB Statement No. 63 during fiscal year 2013. Prior to fiscal year 2013, the term "net assets" was used rather than "net position".
Source: School District financial records.
Fiscal Year
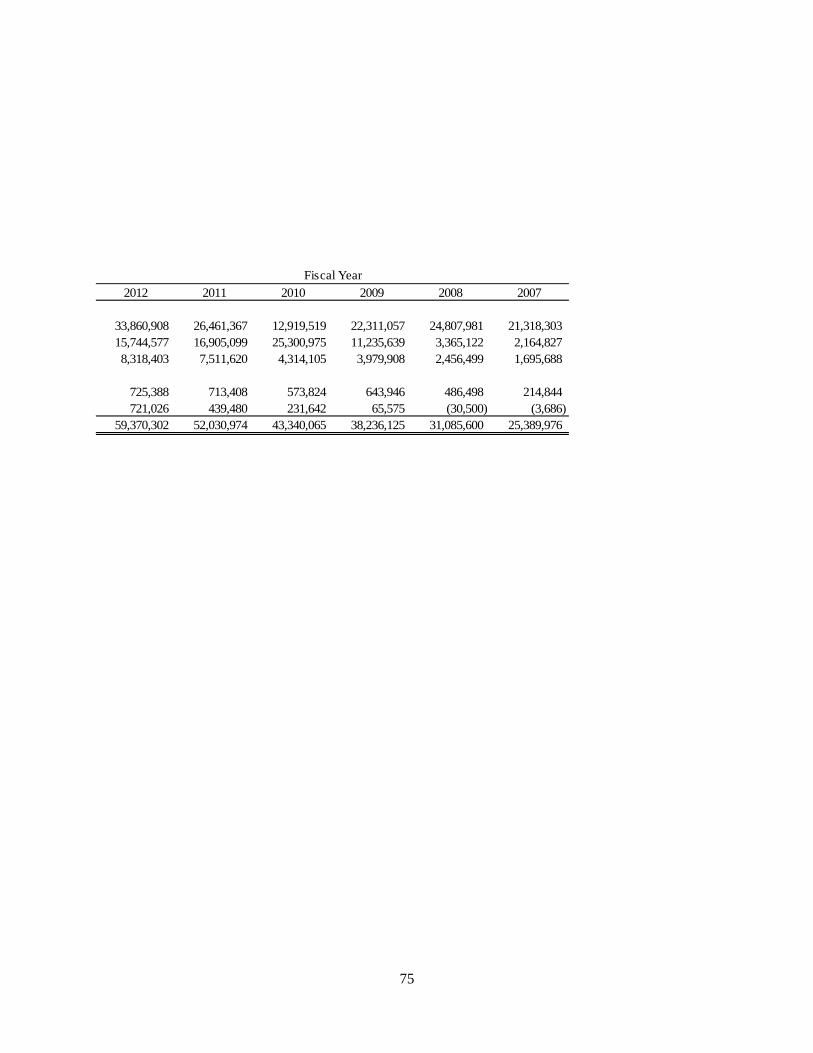
75
2012 2011 2010 2009 2008 2007
33,860,908 26,461,367 12,919,519 22,311,057 24,807,981 21,318,303 15,744,577 16,905,099 25,300,975 11,235,639 3,365,122 2,164,827 8,318,403 7,511,620 4,314,105 3,979,908 2,456,499 1,695,688
725,388 713,408 573,824 643,946 486,498 214,844 721,026 439,480 231,642 65,575 (30,500) (3,686)
59,370,302 52,030,974 43,340,065 38,236,125 31,085,600 25,389,976
Fiscal Year

76
LINN-MAR COMMUNITY SCHOOL DISTRICT EXPENSES, PROGRAM REVENUES AND NET (EXPENSE)/REVENUE,
Last Ten Fiscal Years (Accrual Basis of Accounting)
2016 2015 2014 2013Expenses:Governmental activities: Instruction: Regular $ 35,749,781 33,767,067 32,223,517 31,630,043 Special 8,969,801 8,164,001 8,918,859 7,647,660 Other 6,448,810 6,209,355 6,894,931 5,787,883 Support services: Student 3,677,997 3,663,955 3,542,985 3,456,656 Instructional staff 6,368,459 5,455,726 3,105,544 2,888,367 Administration 6,874,302 5,673,933 5,655,085 6,369,253 Operation and maintenance of plant 6,402,268 6,564,417 6,407,078 5,152,985 Transportation 2,749,936 2,754,810 2,615,258 2,000,716 Non-instructional programs 128,979 130,525 121,088 110,098 Capital outlay - - - - Interest on long-term debt and fiscal charges 3,031,161 2,802,823 3,131,174 3,212,643 Other expenses: AEA flowthrough 3,055,116 2,923,429 2,777,361 2,620,028 Depreciation(unallocated) 4,133,605 4,010,529 3,807,359 2,171,171 Total governmental activities 87,590,215 82,120,570 79,200,239 73,047,503 Business type activities: Nutrition services 3,357,540 3,113,499 3,084,733 2,900,675 Aquatic center 239,212 161,128 46,519 - ROAR store 12,426 7,353 - - Total business type activities 3,609,178 3,281,980 3,131,252 2,900,675 Total primary government expenses 91,199,393 85,402,550 82,331,491 75,948,178
Program RevenuesGovernmental activities: Charges for services: Instruction 6,407,571 5,516,329 4,735,812 4,514,187 Support services 12,868 93,335 18,181 12,607 Capital outlay - - - - Operating grants and contributions 6,047,560 5,991,216 10,866,887 9,439,571 Capital grants and contributions 18,989 10,000 - 49,058 Total governmental activities 12,486,988 11,610,880 15,620,880 14,015,423 Business type activities: Charges for services: Nutrition services 2,185,826 2,165,481 2,030,952 2,029,545 Aquatic center 273,967 239,569 53,211 - Roar Store 12,335 9,555 - - Operating grants and contributions 1,226,303 1,170,943 1,177,210 1,007,836 Capital grants and contributions - - - - Total business type activities 3,698,431 3,585,548 3,261,373 3,037,381 Total primary government revenues 16,185,419 15,196,428 18,882,253 17,052,804
Net (Expense)/RevenuesTotal governmental activities (75,103,227) (70,509,690) (63,579,359) (59,032,080) Total business type activities 89,253 303,568 130,121 136,706 Total primary government net expense $ (75,013,974) (70,206,122) (63,449,238) (58,895,374)
Source: School District financial records.
Fiscal Year

77
2012 2011 2010 2009 2008 2007
30,061,936 28,640,227 27,660,836 27,781,726 25,437,813 21,937,911 7,364,222 8,291,861 8,880,524 8,818,399 8,420,667 7,519,352 5,453,547 4,656,988 4,878,366 4,026,619 3,571,552 3,579,827
3,226,515 3,095,443 2,236,875 2,175,607 1,990,772 1,594,995 3,054,671 2,449,712 2,386,183 2,294,187 2,299,782 1,878,077 6,041,272 5,671,887 5,444,176 4,674,249 4,672,761 3,891,968 6,369,265 5,128,200 5,496,221 5,191,799 4,667,734 4,203,686 2,444,605 2,331,937 2,363,942 2,159,488 2,169,820 1,919,725
187,193 112,581 97,096 106,490 528,040 134,998 - 1,120,778 1,317,844 1,223,442 1,600,889 668,614
3,216,868 3,621,298 3,837,554 2,464,043 2,749,679 3,187,276
2,543,681 2,703,997 2,582,490 2,285,973 2,103,691 1,851,025 3,388,470 2,819,601 2,228,121 2,184,773 1,590,669 1,421,397
73,352,245 70,644,510 69,410,228 65,386,795 61,803,869 53,788,851
2,738,897 2,746,151 2,714,977 2,722,516 2,551,435 2,246,998 - - - - - - - - - - - -
2,738,897 2,746,151 2,714,977 2,722,516 2,551,435 2,246,998 76,091,142 73,390,661 72,125,205 68,109,311 64,355,304 56,035,849
4,218,399 4,301,403 4,191,449 3,631,198 3,369,306 3,135,249 13,688 1,424,420 1,210,650 642,461 378,260 268,695
- 64,537 24,664 515,733 463,025 31,801 5,119,276 9,100,509 8,149,292 7,239,896 5,967,312 4,863,775
47,975 - 37,419 24,030 606,055 32,471 9,399,338 14,890,869 13,613,474 12,053,318 10,783,958 8,331,991
2,024,234 2,003,376 1,997,621 1,991,245 1,781,217 1,636,219 - - - - - - - - - - - -
912,443 860,457 809,883 740,393 681,827 575,908 94,085 228,761 2,572 236,818 327,659 23,861
3,030,762 3,092,594 2,810,076 2,968,456 2,790,703 2,235,988 12,430,100 17,983,463 16,423,550 15,021,774 13,574,661 10,567,979
(63,952,907) (55,753,641) (55,796,754) (53,333,477) (51,019,911) (45,456,860) 291,865 346,443 95,099 245,940 239,268 (11,010)
(63,661,042) (55,407,198) (55,701,655) (53,087,537) (50,780,643) (45,467,870)
Fiscal Year

78
LINN-MAR COMMUNITY SCHOOL DISTRICT TOTAL PRIMARY GOVERNMENT NET EXPENSES
GENERAL REVENUES AND TOTAL CHANGE IN NET POSITION, Last Ten Fiscal Years
(Accrual Basis of Accounting)
2016 2015 2014 2013Net (Expense)/RevenuesTotal governmental activities $ (75,103,227) (70,509,690) (63,579,359) (59,032,080) Total business type activities 89,253 303,568 130,121 136,706 Total primary government net expense (75,013,974) (70,206,122) (63,449,238) (58,895,374)
General Revenues and Other Changes in Net PositionGovernmental activities: Property tax levied for:* General purposes 25,236,614 23,949,253 23,907,617 23,421,086 Capital outlay 3,188,525 3,105,578 3,285,473 3,133,993 Debt service 3,800,343 4,033,671 3,744,536 3,766,765 Sales tax 6,811,318 6,587,426 5,979,539 5,600,634 Unrestricted grants and contributions 41,329,762 39,054,690 29,979,713 28,870,083 Nonspecific program federal revenues - - - 187,358 Investment earnings 104,072 79,221 92,990 134,959 Miscellaneous 532,864 590,682 1,047,657 1,083,700 Total governmental activities 81,003,498 77,400,521 68,037,525 66,198,578 Business type activities: Investment earnings 2,368 2,180 1,892 1,839 Miscellaneous - 414 14 56,966 Total business type activities 2,368 2,594 1,906 58,805 Total primary government 81,005,866 77,403,115 68,039,431 66,257,383
Change in Net PositionTotal governmental activities 5,900,271 6,872,640 4,458,166 7,166,498 Total business type activities 91,621 306,162 132,027 195,511 Total primary government $ 5,991,892 7,178,802 4,590,193 7,362,009
Note: In February 2007, the patrons of Linn County passed the Local Option Sales Tax. During the 2008 legislative session, the Iowa Legislature passed a 1% statewide sales, services and use tax that replaced the local option sales tax.Note: District implemented GASB Statement No. 63 during fiscal year 2013. Prior to fiscal year 2013, the term "net assets" was used rather than "net position".
* Changes in property tax revenues are a product of underlying changes in property values and tax rates.See Pages 90-96.
Source: School District financial records.
Fiscal Year
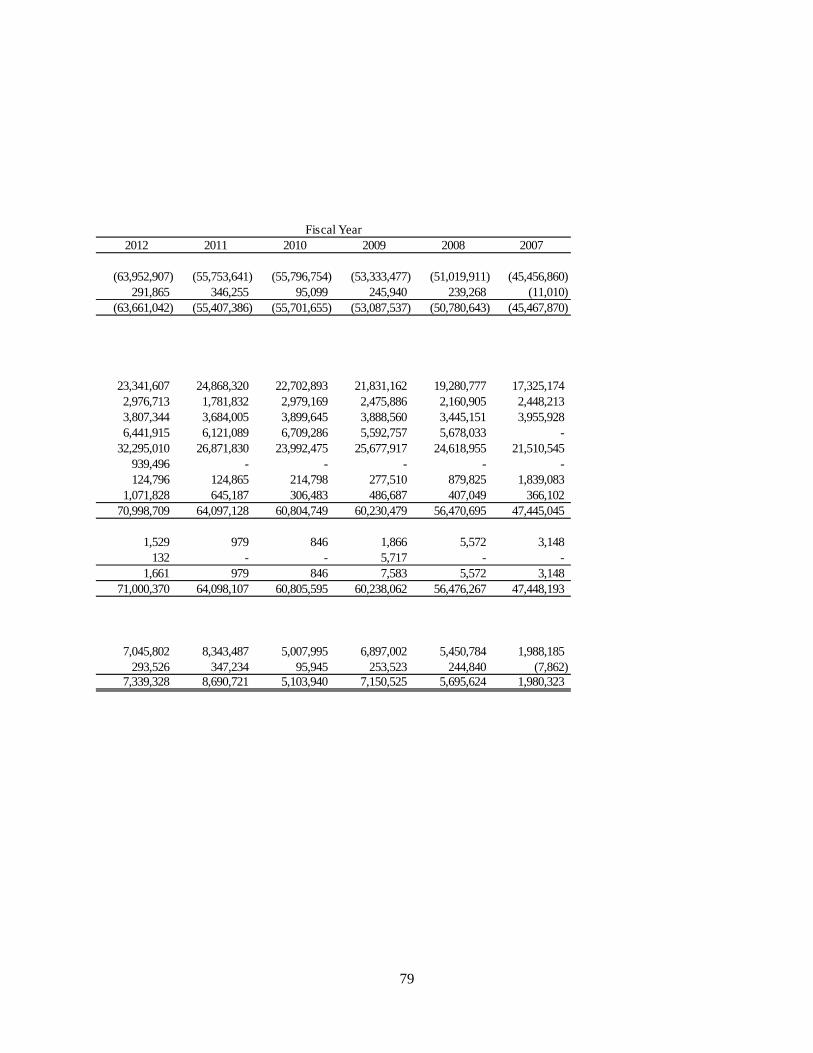
79
2012 2011 2010 2009 2008 2007
(63,952,907) (55,753,641) (55,796,754) (53,333,477) (51,019,911) (45,456,860) 291,865 346,255 95,099 245,940 239,268 (11,010)
(63,661,042) (55,407,386) (55,701,655) (53,087,537) (50,780,643) (45,467,870)
23,341,607 24,868,320 22,702,893 21,831,162 19,280,777 17,325,174 2,976,713 1,781,832 2,979,169 2,475,886 2,160,905 2,448,213 3,807,344 3,684,005 3,899,645 3,888,560 3,445,151 3,955,928 6,441,915 6,121,089 6,709,286 5,592,757 5,678,033 -
32,295,010 26,871,830 23,992,475 25,677,917 24,618,955 21,510,545 939,496 - - - - - 124,796 124,865 214,798 277,510 879,825 1,839,083
1,071,828 645,187 306,483 486,687 407,049 366,102 70,998,709 64,097,128 60,804,749 60,230,479 56,470,695 47,445,045
1,529 979 846 1,866 5,572 3,148 132 - - 5,717 - -
1,661 979 846 7,583 5,572 3,148 71,000,370 64,098,107 60,805,595 60,238,062 56,476,267 47,448,193
7,045,802 8,343,487 5,007,995 6,897,002 5,450,784 1,988,185 293,526 347,234 95,945 253,523 244,840 (7,862)
7,339,328 8,690,721 5,103,940 7,150,525 5,695,624 1,980,323
Fiscal Year
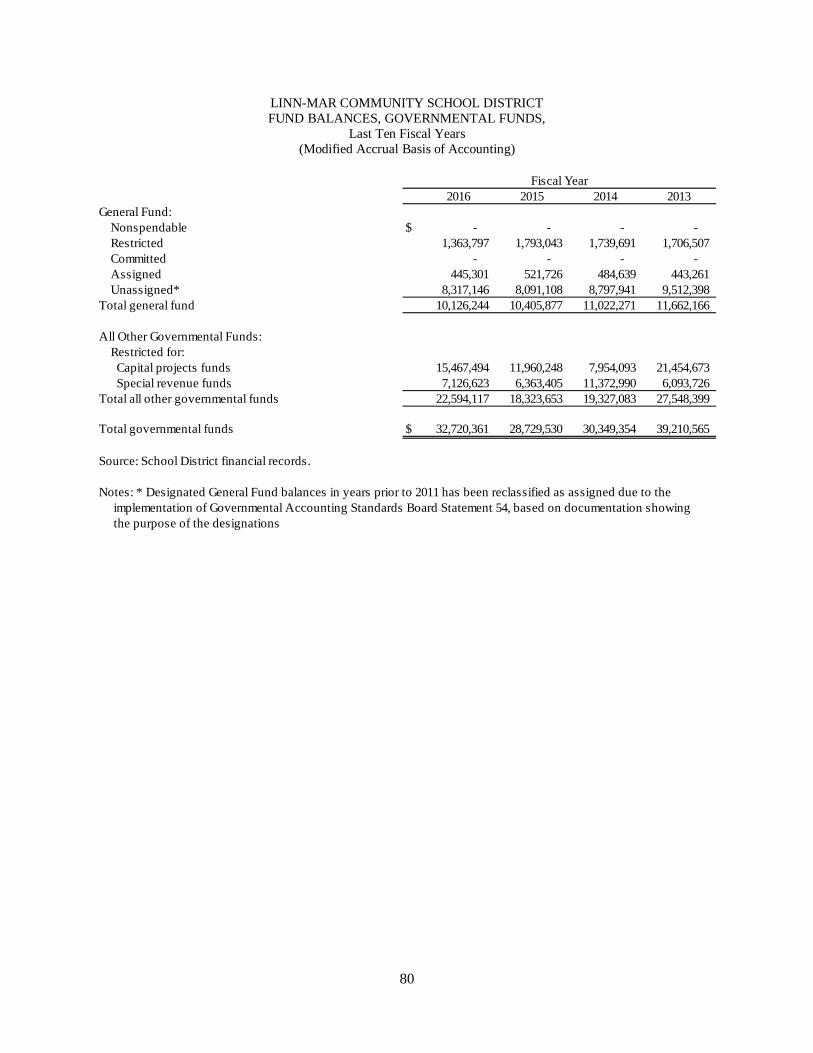
80
LINN-MAR COMMUNITY SCHOOL DISTRICT FUND BALANCES, GOVERNMENTAL FUNDS,
Last Ten Fiscal Years (Modified Accrual Basis of Accounting)
2016 2015 2014 2013General Fund: Nonspendable $ - - - - Restricted 1,363,797 1,793,043 1,739,691 1,706,507 Committed - - - - Assigned 445,301 521,726 484,639 443,261 Unassigned* 8,317,146 8,091,108 8,797,941 9,512,398 Total general fund 10,126,244 10,405,877 11,022,271 11,662,166
All Other Governmental Funds: Restricted for: Capital projects funds 15,467,494 11,960,248 7,954,093 21,454,673 Special revenue funds 7,126,623 6,363,405 11,372,990 6,093,726 Total all other governmental funds 22,594,117 18,323,653 19,327,083 27,548,399
Total governmental funds $ 32,720,361 28,729,530 30,349,354 39,210,565
Source: School District financial records.
Notes: * Designated General Fund balances in years prior to 2011 has been reclassified as assigned due to the implementation of Governmental Accounting Standards Board Statement 54, based on documentation showing the purpose of the designations
Fiscal Year

81
2012 2011 2010 2009 2008 2007
- 37,400 - - - - 1,536,821 1,487,025 943,448 462,658 323,383 247,809
- 285,459 - - - - - 110,941 - - - 56,121
10,234,148 7,889,075 5,172,927 4,663,394 2,953,846 2,323,217 11,770,969 9,809,900 6,116,375 5,126,052 3,277,229 2,627,147
3,749,121 6,251,625 15,430,146 7,026,156 1,765,430 9,575,282 10,561,734 10,537,482 10,490,979 5,332,590 2,623,576 11,916,369 14,310,855 16,789,107 25,921,125 12,358,746 4,389,006 21,491,651
26,081,824 26,599,007 32,037,500 17,484,798 7,666,235 24,118,798
Fiscal Year

82
LINN-MAR COMMUNITY SCHOOL DISTRICT GOVERNMENTAL FUNDS REVENUES,
Last Ten Fiscal Years (Modified Accrual Basis of Accounting)
2016 2015 2014 2013Local sources: Property taxes $ 32,225,482 31,088,502 30,937,626 30,321,844 Tuition 4,266,217 3,604,028 3,350,347 2,989,998 Other revenues 2,844,683 2,773,333 2,607,885 2,855,684 Total local sources 39,336,382 37,465,863 36,895,858 36,167,526
Intermediate sources: Other revenues - - - - Total intermediate sources - - - -
State sources: Statewide sales, services and use tax 6,811,318 6,587,426 5,979,539 5,600,634 State grants 45,294,013 42,737,570 44,565,250 36,219,406 Total state sources 52,105,331 49,324,996 50,544,789 41,820,040
Federal sources: Federal grants 2,048,773 2,220,542 2,197,297 2,277,606 Total federal sources 2,048,773 2,220,542 2,197,297 2,277,606
Total revenues $ 93,490,486 89,011,401 89,637,944 80,265,172
Source: School District financial records.
Fiscal Year

83
2012 2011 2010 2009 2008 2007
30,125,664 30,323,051 29,571,174 28,185,239 24,876,851 23,719,160 2,824,909 2,510,058 2,176,974 1,968,604 1,792,758 1,421,707 2,647,870 2,805,732 2,701,306 3,057,302 3,483,303 4,046,617
35,598,443 35,638,841 34,449,454 33,211,145 30,152,912 29,187,484
- - - - 1,892 - - - - - 1,892 -
6,441,915 6,121,089 6,709,286 5,592,757 5,678,033 - 35,327,946 33,473,648 27,767,019 31,357,360 29,653,682 25,415,872 41,769,861 39,594,737 34,476,305 36,950,117 35,331,715 25,415,872
3,029,743 3,752,150 5,484,986 2,108,874 1,837,335 1,099,201 3,029,743 3,752,150 5,484,986 2,108,874 1,837,335 1,099,201
80,398,047 78,985,728 74,410,745 72,270,136 67,323,854 55,702,557
Fiscal Year
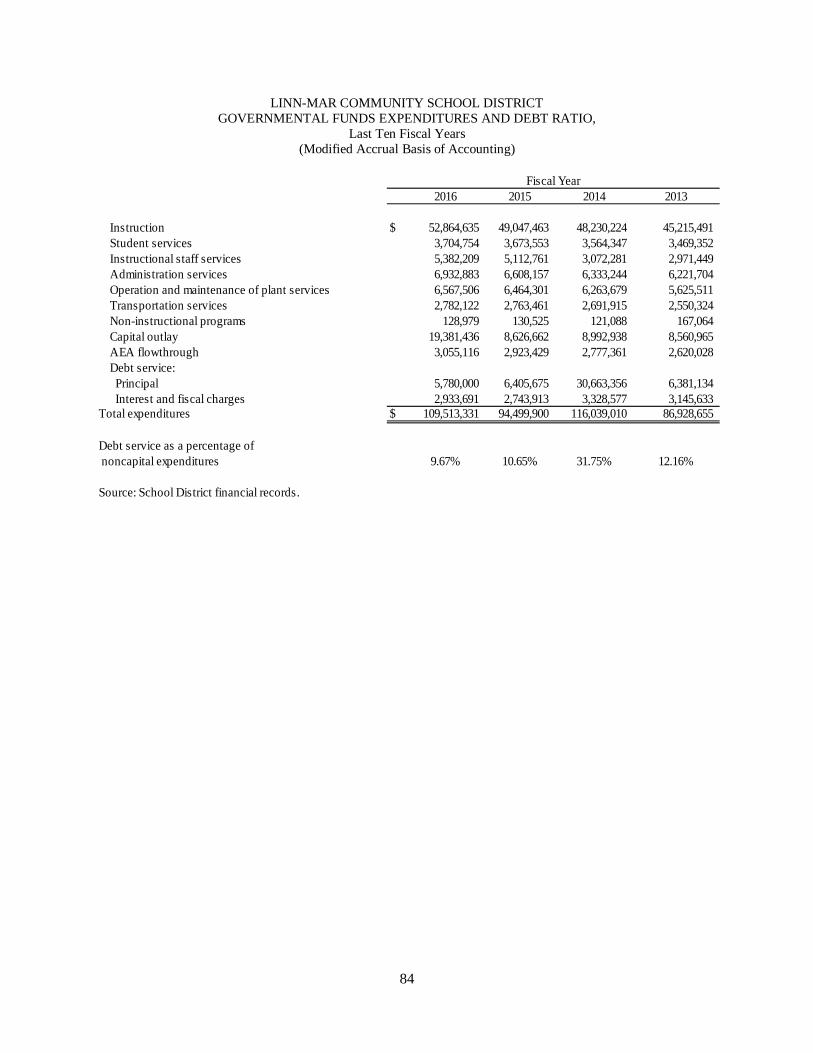
84
LINN-MAR COMMUNITY SCHOOL DISTRICT GOVERNMENTAL FUNDS EXPENDITURES AND DEBT RATIO,
Last Ten Fiscal Years (Modified Accrual Basis of Accounting)
2016 2015 2014 2013
Instruction $ 52,864,635 49,047,463 48,230,224 45,215,491 Student services 3,704,754 3,673,553 3,564,347 3,469,352 Instructional staff services 5,382,209 5,112,761 3,072,281 2,971,449 Administration services 6,932,883 6,608,157 6,333,244 6,221,704 Operation and maintenance of plant services 6,567,506 6,464,301 6,263,679 5,625,511 Transportation services 2,782,122 2,763,461 2,691,915 2,550,324 Non-instructional programs 128,979 130,525 121,088 167,064 Capital outlay 19,381,436 8,626,662 8,992,938 8,560,965 AEA flowthrough 3,055,116 2,923,429 2,777,361 2,620,028 Debt service: Principal 5,780,000 6,405,675 30,663,356 6,381,134 Interest and fiscal charges 2,933,691 2,743,913 3,328,577 3,145,633 Total expenditures $ 109,513,331 94,499,900 116,039,010 86,928,655
Debt service as a percentage of noncapital expenditures 9.67% 10.65% 31.75% 12.16%
Source: School District financial records.
Fiscal Year

85
2012 2011 2010 2009 2008 2007
42,714,244 41,480,379 41,092,354 40,272,400 37,737,920 33,157,396 3,226,515 3,095,442 2,236,875 2,175,608 2,012,520 1,611,377 3,038,724 2,514,172 2,369,786 2,356,883 2,202,437 1,881,262 6,086,374 5,821,026 5,432,534 4,766,021 4,599,765 3,888,547 5,088,137 5,179,501 5,165,727 5,144,794 4,703,119 4,179,156 2,506,679 2,095,187 2,477,945 2,373,708 2,281,106 2,011,478
187,193 112,581 97,096 106,490 108,086 134,998 5,946,332 11,932,534 25,726,426 7,635,006 13,889,914 18,135,936 2,543,681 2,703,997 2,582,490 2,285,973 2,103,691 1,851,025
6,327,396 17,676,750 10,729,432 2,683,424 11,462,161 1,990,000 3,266,476 3,569,922 3,409,086 2,304,355 3,075,404 2,730,336
80,931,751 96,181,491 101,319,751 72,104,662 84,176,123 71,571,511
12.59% 25.24% 7.69% 20.59% 8.85% 9.45%
Fiscal Year

86
LINN-MAR COMMUNITY SCHOOL DISTRICT OTHER FINANCING SOURCES AND USES AND NET CHANGE IN
FUND BALANCES, GOVERNMENTAL FUNDS, Last Ten Fiscal Years
(Modified Accrual Basis of Accounting)
2016 2015 2014 2013
Excess(Deficiency) of revenues over(under) expenditures $ (16,022,845) (5,488,499) (32,380,605) (6,663,483)
Other financing sources(uses) Capital lease proceeds - - - - Transfer in 6,001,233 8,246,454 16,099,513 16,193,578 Transfer out (6,001,233) (8,246,454) (16,099,513) (16,193,578) Sale of equipment 13,676 - 53,819 5,795 Sale of real property - 203,675 - - Capital loan note issuance 10,000,000 - - - Revenue bond issuance 10,000,000 3,665,000 22,800,000 20,000,000 General obligation refunding bonds issued - - - - General obligation bonds issued - - - - General obligation bonds refunded - - - - Net premium/discounts on bond issuances - - 665,575 (213,571) Total other financing sources (uses) 20,013,676 3,868,675 23,519,394 19,792,224
Change in fund balances $ 3,990,831 (1,619,824) (8,861,211) 13,128,741
Source: School District financial records.
Fiscal Year

87
2012 2011 2010 2009 2008 2007
(533,704) (17,195,763) (26,909,006) 165,474 (16,852,269) (15,868,954)
- - 314,228 - 399,706 - 6,009,968 5,462,810 4,753,458 2,573,335 1,622,661 9,090
(6,009,968) (5,462,810) (4,753,458) (2,573,335) (1,622,661) (9,090) 16,521 1,769 7,481 1,119 - 215
- 500 - 19,300 - - - - - - - - - - 34,400,000 9,632,670 - - - - 6,740,000 - - 6,939,931 - 11,755,000 - - - 17,330,611 - - - - - (16,960,000) - - - - - -
16,521 11,757,269 41,461,709 9,653,089 399,706 7,310,757
(517,183) (5,438,494) 14,552,703 9,818,563 (16,452,563) (8,558,197)
Fiscal Year
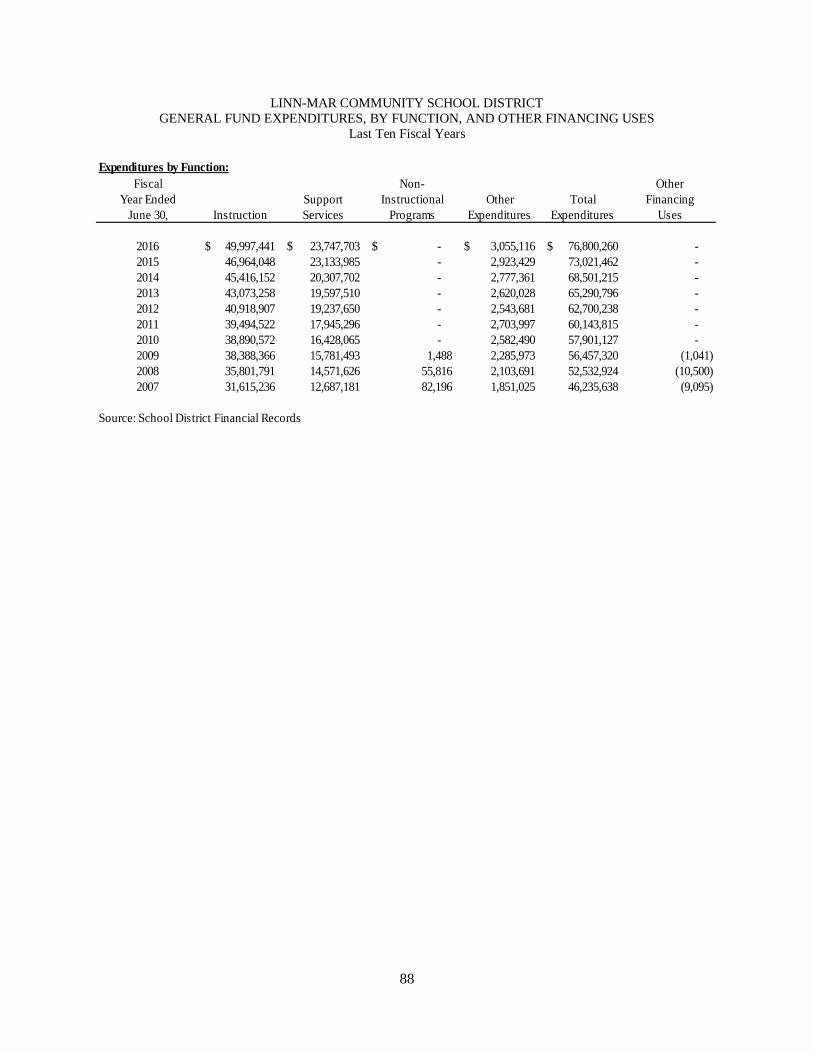
88
LINN-MAR COMMUNITY SCHOOL DISTRICT GENERAL FUND EXPENDITURES, BY FUNCTION, AND OTHER FINANCING USES
Last Ten Fiscal Years Expenditures by Function:
FiscalYear Ended Support Other Total
June 30, Instruction Services Expenditures Expenditures
2016 49,997,441$ 23,747,703$ $ - 3,055,116$ 76,800,260$ - 2015 46,964,048 23,133,985 - 2,923,429 73,021,462 - 2014 45,416,152 20,307,702 - 2,777,361 68,501,215 - 2013 43,073,258 19,597,510 - 2,620,028 65,290,796 - 2012 40,918,907 19,237,650 - 2,543,681 62,700,238 - 2011 39,494,522 17,945,296 - 2,703,997 60,143,815 - 2010 38,890,572 16,428,065 - 2,582,490 57,901,127 - 2009 38,388,366 15,781,493 1,488 2,285,973 56,457,320 (1,041) 2008 35,801,791 14,571,626 55,816 2,103,691 52,532,924 (10,500) 2007 31,615,236 12,687,181 82,196 1,851,025 46,235,638 (9,095)
Source: School District Financial Records
Non-Instructional
Programs UsesFinancing
Other

89
LINN-MAR COMMUNITY SCHOOL DISTRICT GENERAL FUND REVENUES, BY SOURCE, AND OTHER FINANCING SOURCES
Last Ten Fiscal Years
Fiscal OtherYear Ended Financing
June 30, Local Tax State Federal Miscellaneous Total Sources
2016 23,986,903$ 45,028,110$ 2,048,773$ 5,443,165$ 76,506,951$ 13,676$ 2015 22,754,909 42,577,642 2,220,542 4,843,746 72,396,839 8,2292014 22,705,206 38,582,952 2,197,297 4,367,577 67,853,032 8,2882013 22,570,032 36,216,767 2,277,606 4,058,710 65,123,115 58,8782012 22,532,908 35,325,267 3,029,743 3,756,868 64,644,786 16,521 2011 23,106,617 33,471,036 3,752,150 3,505,767 63,835,570 1,769 2010 22,681,230 27,764,454 5,484,986 2,953,300 58,883,970 7,481 2009 21,808,516 31,352,545 2,087,217 3,057,787 58,306,065 1,119 2008 19,259,497 29,651,322 1,256,369 3,026,318 53,193,506 - 2007 17,317,744 25,409,145 1,070,730 2,666,485 46,464,104 -
Source: School District Financial Records

90
LINN-MAR COMMUNITY SCHOOL DISTRICT ASSESSED VALUE AND ACTUAL VALUE OF TAXABLE PROPERTY,
Last Ten Fiscal Years
Actual ValueAssessment Collection Residential Commercial Other Less Total Total
Year Year Property Property Property Exemptions Taxable Value Direct Rate
2014 2015-16 2,353,842,868 548,360,758 183,971,846 1,182,203,330 1,903,972,142 17.378612013 2014-15 2,284,210,354 548,493,780 169,642,588 1,139,926,871 1,862,419,851 17.004112012 2013-14 2,238,748,147 537,214,072 139,152,794 1,096,153,062 1,818,961,951 17.267802011 2012-13 2,204,092,586 520,222,182 135,423,932 1,125,070,806 1,734,667,894 17.730992010 2011-12 2,153,396,178 503,990,676 125,663,342 1,136,730,855 1,646,319,341 20.229512009 2010-11 2,073,971,062 500,753,652 125,978,973 1,129,135,324 1,571,568,363 20.401332008 2009-10 1,990,858,611 477,986,759 106,310,922 1,095,573,208 1,479,583,084 19.395882007 2008-09 1,893,497,108 483,513,198 98,623,115 1,070,565,207 1,405,068,214 18.816572006 2007-08 1,730,138,471 450,605,377 100,148,071 949,477,920 1,331,413,999 17.999312005 2006-07 1,613,286,865 443,260,340 99,459,863 881,950,290 1,274,056,778 17.76825
Source: Linn County Auditor
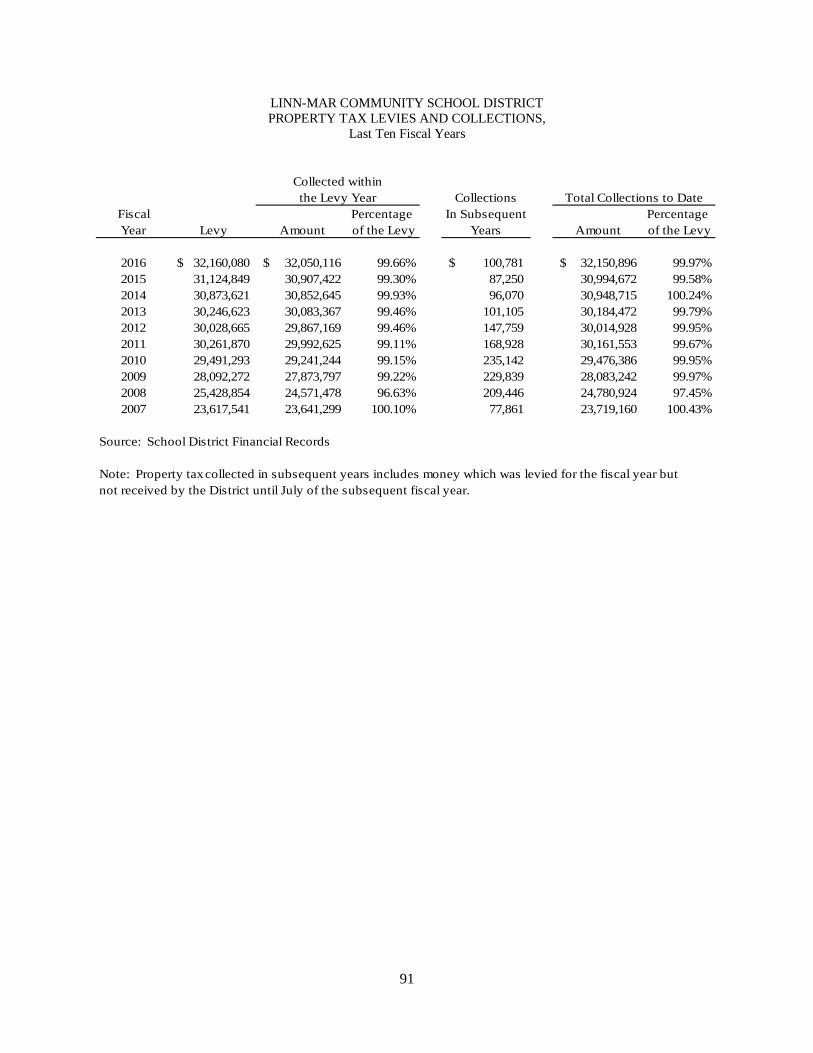
91
LINN-MAR COMMUNITY SCHOOL DISTRICT PROPERTY TAX LEVIES AND COLLECTIONS,
Last Ten Fiscal Years
Collected within the Levy Year Collections Total Collections to Date
Fiscal Percentage In Subsequent Percentage Year Levy Amount of the Levy Years Amount of the Levy
2016 32,160,080$ 32,050,116$ 99.66% 100,781$ 32,150,896$ 99.97%2015 31,124,849 30,907,422 99.30% 87,250 30,994,672 99.58%2014 30,873,621 30,852,645 99.93% 96,070 30,948,715 100.24%2013 30,246,623 30,083,367 99.46% 101,105 30,184,472 99.79%2012 30,028,665 29,867,169 99.46% 147,759 30,014,928 99.95%2011 30,261,870 29,992,625 99.11% 168,928 30,161,553 99.67%2010 29,491,293 29,241,244 99.15% 235,142 29,476,386 99.95%2009 28,092,272 27,873,797 99.22% 229,839 28,083,242 99.97%2008 25,428,854 24,571,478 96.63% 209,446 24,780,924 97.45%2007 23,617,541 23,641,299 100.10% 77,861 23,719,160 100.43%
Source: School District Financial Records
Note: Property tax collected in subsequent years includes money which was levied for the fiscal year butnot received by the District until July of the subsequent fiscal year.

92
LINN-MAR COMMUNITY SCHOOL DISTRICT PROPERTY TAX RATES PER $1,000 ASSESSED VALUATION ALL
DIRECT AND OVERLAPPING GOVERNMENTS Last Ten Years
Levy Collection City of City of City of Year Year Cedar Rapids Marion Robbins
2014 2015-16County 6.14225 6.14225 6.14225Schools 17.37861 17.37861 17.37861City 15.21621 13.58625 7.97127Miscellaneous 1.44038 1.47354 1.47354 Total Levy 40.17745 38.58065 32.96567
Ratio of Linn-Mar Community School District to Total 43.25% 45.04% 52.72%
2013 2014-15County 6.14191 6.14191 6.14191Schools 17.00411 17.00411 17.00411City 15.21621 13.12953 7.9306Miscellaneous 1.43456 1.47869 1.47869 Total Levy 39.79679 37.75424 32.55531
Ratio of Linn-Mar Community School District to Total 42.73% 45.04% 52.23%
2012 2013-14County 6.11191 6.11191 6.11191Schools 17.2678 17.2678 17.2678City 15.21621 13.15637 7.77881Miscellaneous 1.46096 1.32167 1.32167 Total Levy 40.05688 37.85775 32.48019
Ratio of Linn-Mar Community School District to Total 43.11% 45.61% 53.16%
2011 2012-13County 6.11191 6.11191 6.11191Schools 17.73099 17.73099 17.73099City 15.21621 13.62416 8.02375Miscellaneous 1.35108 1.64296 1.64296 Total Levy 40.41019 39.11002 33.50961
Ratio of Linn-Mar Community School District to Total 43.88% 45.34% 52.91%
Source: Linn County Auditor

93
Levy Collection City of City of City of Year Year Cedar Rapids Marion Robbins
2010 2011-2012County 6.11117 6.11117 6.11117Schools 18.54161 18.54161 18.54161City 15.21621 13.5098 8.60023Miscellaneous 1.29745 1.59012 1.59012 Total Levy 41.16644 39.7527 34.84313
Ratio of Linn-Mar Community School District to Total 45.04% 46.64% 53.21%
2009 2010-2011County 6.06829 6.06829 6.06829Schools 19.73839 19.73839 19.73839City 15.21621 13.63603 9.01063Miscellaneous 1.26511 1.26511 1.26511 Total Levy 42.288 40.70782 36.08242
Ratio of Linn-Mar Community School District to Total 46.68% 48.49% 54.70%
2008 2009-2010County 5.95245 5.95245 5.95245Schools 20.22951 20.22951 20.22951City 15.21621 13.86482 9.28024Miscellaneous 1.22581 1.22581 1.22581 Total Levy 42.62398 41.27259 36.68801
Ratio of Linn-Mar Community School District to Total 47.46% 49.01% 55.14%
2007 2008-2009County 6.14971 6.14971 6.14971Schools 20.40133 20.40133 20.40133City 15.07076 14.1385 9.1834Miscellaneous 1.25457 1.47989 1.47989 Total Levy 42.87637 42.16943 37.21433
Ratio of Linn-Mar Community School District to Total 47.58% 48.38% 54.82%

94
LINN-MAR COMMUNITY SCHOOL DISTRICT PROPERTY TAX RATES PER $1,000 ASSESSED VALUATION ALL
DIRECT AND OVERLAPPING GOVERNMENTS (CONTINUED) Last Ten Years
Levy Collection City of City of City of Year Year Cedar Rapids Marion Robbins
2006 2007-2008County 5.88629 5.88629 5.88629Schools 19.39588 19.39588 19.39588City 14.6161 13.78572 9.33124Miscellaneous 1.26327 1.23029 1.23029 Total Levy 41.16154 40.29818 35.8437
Ratio of Linn-Mar Community School District to Total 47.12% 48.13% 54.11%
2005 2006-2007County 5.69014 5.69014 5.69014Schools 18.81657 18.81657 18.81657City 14.38608 13.95525 9.32643Miscellaneous 1.288 1.23853 1.23853 Total Levy 40.18079 39.70049 35.07167
Ratio of Linn-Mar Community School District to Total 46.83% 47.40% 53.65%
Source: Linn County Auditor

95
LINN-MAR COMMUNITY SCHOOL DISTRICT PROPERTY TAX RATES BY FUND PER $1,000 ASSESSED VALUATION
Last Ten Fiscal Years
Fiscal YearEndingJune 30,
2016 $ 13.03448 $ 0.54742 $ 0.33000 $ 0.13500 $ 1.34000 $ 1.99171 $ 17.378612015 12.50639 0.52341 0.33000 0.13500 1.34000 2.16931 17.004112014 12.73201 0.67647 0.33000 0.13500 1.34000 2.05432 17.267802013 13.26000 0.50000 0.33000 0.13500 1.34000 2.16599 17.730992012 13.93153 0.50000 0.33000 0.13500 1.34000 2.30508 18.541612011 15.11830 1.14668 0.33000 0.13500 0.67000 2.33841 19.738392010 15.56715 0.90000 0.33000 0.13500 0.67000 2.62736 20.229512009 15.86000 0.65000 0.33000 0.13500 0.67000 2.75633 20.401332008 15.07172 0.65068 0.33000 0.03062 0.67000 2.64286 19.395882007 13.79463 0.79637 0.33000 0.13500 0.67000 3.09057 18.81657
Source: School District Financial Records
General and EquipmentPlayground
BoardPhysical Plantand EquipmentManagement Total
DebtService
VotedPhysical Plant

96
LINN-MAR COMMUNITY SCHOOL DISTRICT PRINCIPAL PROPERTY TAX PAYERS,
CURRENT YEAR AND NINE YEARS AGO
Percentage Percentage2014 of Total 2005 Taxable of TotalValue Taxable Value Value Taxable Value
Taxpayer 1-1-14 Valuation Valuation * 1-1-05 Valuation Valuation *
SDG Macerich Properties $ 34,422,085 1.81 % 33,567,403 2.63 %Wal-Mart Real Estate Business Trust 12,341,790 0.65 25,827,181 2.03 Rockwell Collins Inc. 10,660,698 0.56 - - Collins Square LLC 10,607,940 0.56 - - Apple Ten Hospitality Ownership, Inc. 9,210,726 0.48 - - Atrium Finance 8,191,230 0.43 - - Marion Senior Development LLC 8,115,930 0.43 - - Target Corporation 7,577,776 0.40 8,419,751 0.66 Timberland Partners 7,329,722 0.38 9,132,517 0.72 Keystone Place LLC 7,150,481 0.38 - - Azure Corp 6,698,163 0.35 - - Midwest Centers 6,525,000 0.34 - - National Retail Properties LP 6,458,671 0.34 - - DDR Northland Square LLC 5,619,585 0.30 - - MAP Realty Co LLC 5,530,127 0.29 - - OPM LC - - 15,430,634 1.21 Developers Diversified Realty Corp - - 11,552,641 0.91 Davis Realty - - 10,457,343 0.82 Hammons John Q Hotels - - 9,675,466 0.76 Qwest - - 7,427,050 0.58 Atlas Chapel Ridge LLC - - 7,059,832 0.55
Total 146,439,924$ 7.70 % 138,549,818$ 10.87 %
* 2014 Total District Taxable Valuation is $1,903,972,142 2005 Total District Taxable Valuation was $1,274,056,778
Note: The 2014 valuation was reported because the taxes collected during the 2016 fiscal year were based on the 2014 valuation.
Note: The 2005 valuation was reported because the taxes collected during the 2007 fiscal year were based on the 2005 valuation.
Source: Linn County Auditor
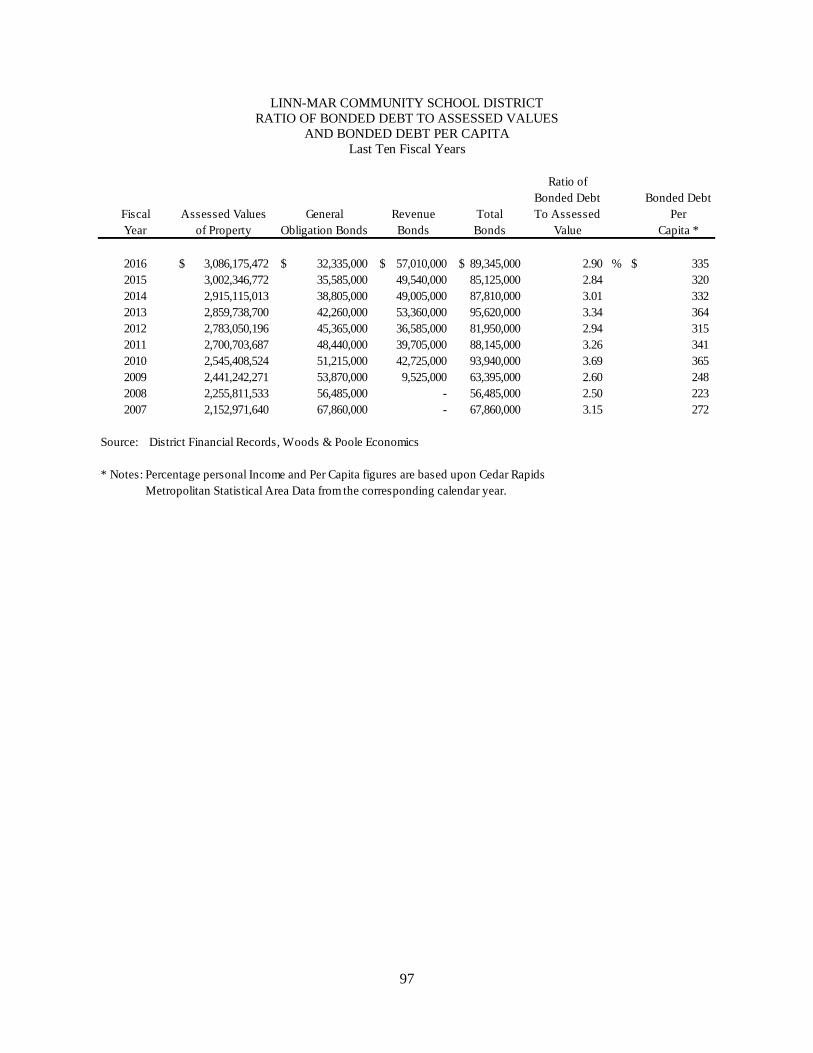
97
LINN-MAR COMMUNITY SCHOOL DISTRICT RATIO OF BONDED DEBT TO ASSESSED VALUES
AND BONDED DEBT PER CAPITA Last Ten Fiscal Years
Ratio of
Bonded Debt Bonded DebtFiscal Assessed Values General Revenue Total To Assessed PerYear of Property Obligation Bonds Bonds Bonds Value Capita *
2016 3,086,175,472$ 32,335,000$ 57,010,000$ 89,345,000$ 2.90 % $ 335 2015 3,002,346,772 35,585,000 49,540,000 85,125,000 2.84 320 2014 2,915,115,013 38,805,000 49,005,000 87,810,000 3.01 332 2013 2,859,738,700 42,260,000 53,360,000 95,620,000 3.34 364 2012 2,783,050,196 45,365,000 36,585,000 81,950,000 2.94 315 2011 2,700,703,687 48,440,000 39,705,000 88,145,000 3.26 341 2010 2,545,408,524 51,215,000 42,725,000 93,940,000 3.69 365 2009 2,441,242,271 53,870,000 9,525,000 63,395,000 2.60 248 2008 2,255,811,533 56,485,000 - 56,485,000 2.50 223 2007 2,152,971,640 67,860,000 - 67,860,000 3.15 272
Source: District Financial Records, Woods & Poole Economics
* Notes: Percentage personal Income and Per Capita figures are based upon Cedar Rapids Metropolitan Statistical Area Data from the corresponding calendar year.

98
LINN-MAR COMMUNITY SCHOOL DISTRICT OUTSTANDING DEBT BY TYPE
Last Ten Fiscal Years
Ratio OfTotal Bonded Debt
Fiscal General Revenue Capital Capital Primary To PersonalYear Obligation Bonds Bonds Loan Notes Leases Government Income *
2016 32,335,000$ 57,010,000$ 10,000,000$ -$ 99,345,000$ 0.81 %2015 35,585,000 49,540,000 - - 85,125,000 0.75 2014 38,805,000 49,005,000 - 55,675 87,865,675 0.80 2013 42,260,000 53,360,000 - 109,031 95,729,031 0.88 2012 45,365,000 36,585,000 - 160,165 82,110,165 0.77 2011 48,440,000 39,705,000 - 292,561 88,437,561 0.87 2010 51,215,000 42,725,000 - 419,310 94,359,310 0.95 2009 53,870,000 9,525,000 - 239,512 63,634,512 0.62 2008 56,485,000 - - - 56,485,000 0.58 2007 67,860,000 - - - 67,860,000 0.73
Source: School District financial records.
Notes: * See Miscellaneous Demographic Statistics on page 102. These ratios are calculated using personal income and population for the prior calendar year.
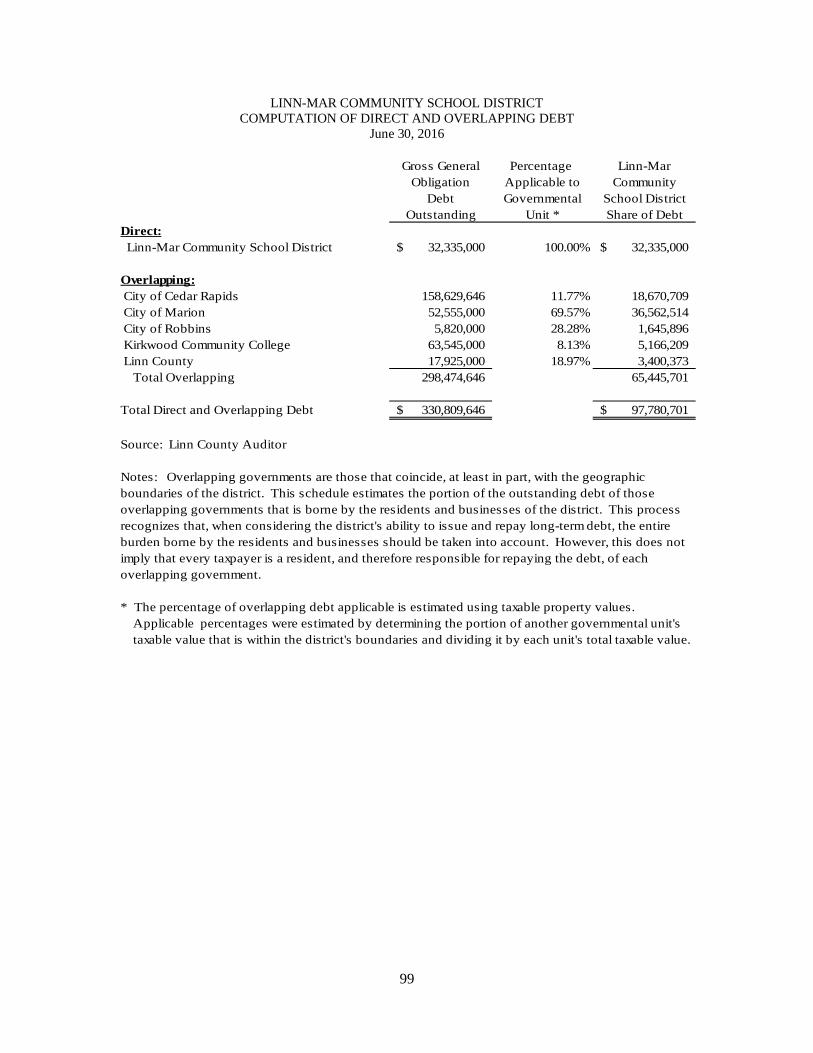
99
LINN-MAR COMMUNITY SCHOOL DISTRICT COMPUTATION OF DIRECT AND OVERLAPPING DEBT
June 30, 2016
Gross General Percentage Linn-MarObligation Applicable to Community
Debt Governmental School DistrictOutstanding Unit * Share of Debt
Direct: Linn-Mar Community School District 32,335,000$ 100.00% 32,335,000$
Overlapping: City of Cedar Rapids 158,629,646 11.77% 18,670,709 City of Marion 52,555,000 69.57% 36,562,514 City of Robbins 5,820,000 28.28% 1,645,896 Kirkwood Community College 63,545,000 8.13% 5,166,209 Linn County 17,925,000 18.97% 3,400,373 Total Overlapping 298,474,646 65,445,701
Total Direct and Overlapping Debt 330,809,646$ 97,780,701$
Source: Linn County Auditor
Notes: Overlapping governments are those that coincide, at least in part, with the geographic boundaries of the district. This schedule estimates the portion of the outstanding debt of those overlapping governments that is borne by the residents and businesses of the district. This process recognizes that, when considering the district's ability to issue and repay long-term debt, the entire burden borne by the residents and businesses should be taken into account. However, this does not imply that every taxpayer is a resident, and therefore responsible for repaying the debt, of each overlapping government.
* The percentage of overlapping debt applicable is estimated using taxable property values. Applicable percentages were estimated by determining the portion of another governmental unit's taxable value that is within the district's boundaries and dividing it by each unit's total taxable value.
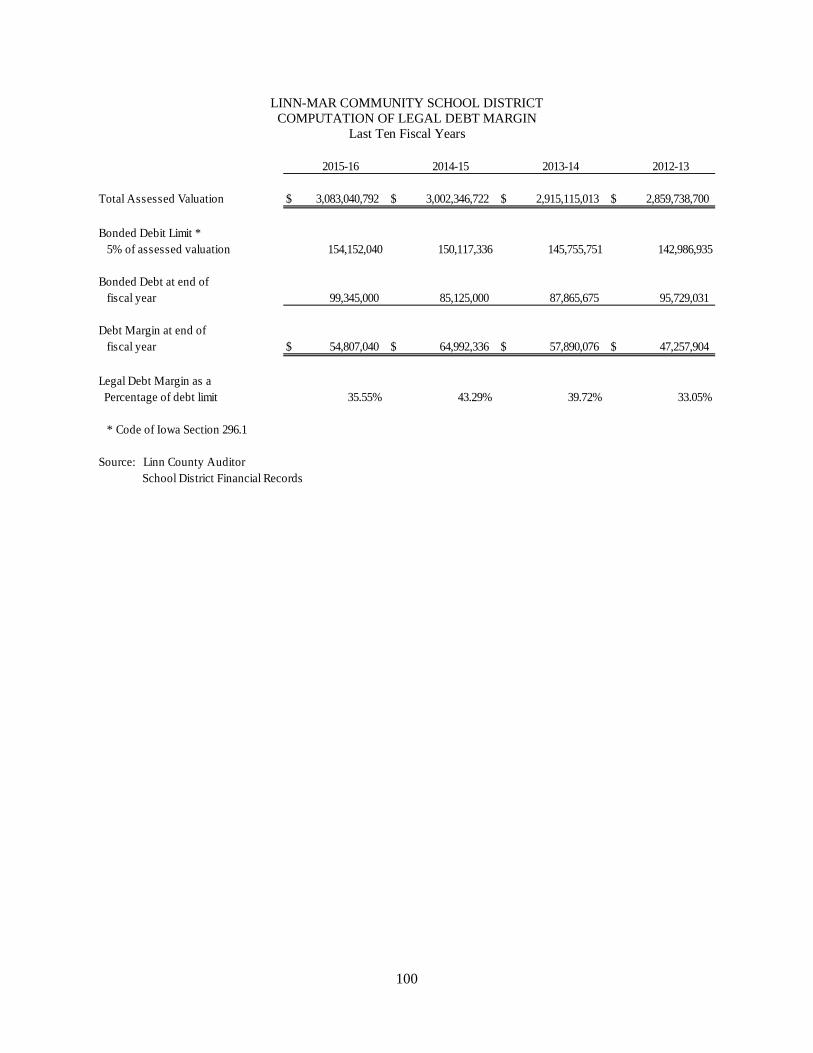
100
LINN-MAR COMMUNITY SCHOOL DISTRICT COMPUTATION OF LEGAL DEBT MARGIN
Last Ten Fiscal Years
2015-16 2014-15 2013-14 2012-13
Total Assessed Valuation $ 3,083,040,792 $ 3,002,346,722 $ 2,915,115,013 $ 2,859,738,700
Bonded Debit Limit * 5% of assessed valuation 154,152,040 150,117,336 145,755,751 142,986,935
Bonded Debt at end of fiscal year 99,345,000 85,125,000 87,865,675 95,729,031
Debt Margin at end of fiscal year $ 54,807,040 $ 64,992,336 $ 57,890,076 $ 47,257,904
Legal Debt Margin as a Percentage of debt limit 35.55% 43.29% 39.72% 33.05%
* Code of Iowa Section 296.1
Source: Linn County Auditor School District Financial Records

101
2011-2012 2010-2011 2009-2010 2008-2009 2007-2008 2006-2007
$ 2,783,050,196 $ 2,700,703,687 $ 2,545,408,524 $ 2,441,242,271 $ 2,255,811,533 $ 2,152,971,640
139,152,510 135,035,184 127,270,426 122,062,114 112,790,577 107,648,582
82,110,165 88,437,561 94,359,310 63,634,512 56,485,000 67,860,000
$ 57,042,345 $ 46,597,623 $ 32,911,116 $ 58,427,602 $ 56,305,577 $ 39,788,582
40.99% 34.51% 25.86% 47.87% 49.92% 36.96%

102
LINN-MAR COMMUNITY SCHOOL DISTRICT MISCELLANEOUS DEMOGRAPHIC STATISTICS
Last Ten Years
CalendarYear Population
2015 266,998 $ 12,232,532,000 $ 46,356 $ 3,147.2 $ 361.3 4.10 % 4.10 %2014 265,624 11,321,010,000 46,803 3,044.2 351.2 4.60 4.40 2013 264,346 11,014,807,000 45,085 2,972.5 339.7 5.00 4.80 2012 262,534 9,748,004,000 37,130 2,931.3 341.0 5.30 5.20 2011 259,828 9,657,823,000 37,170 2,862.1 328.9 6.00 5.90 2010 258,467 9,280,075,000 35,904 2,645.4 333.3 6.50 6.70 2009 257,530 9,162,172,000 35,577 2,894.8 351.8 5.70 6.00 2008 255,452 9,248,958,000 36,206 2,576.7 315.6 4.00 4.10 2007 252,780 9,001,524,000 35,610 2,444.5 344.5 3.80 3.80 2006 249,790 8,594,374,000 34,406 2,389.9 337.1 3.70 3.70
Per Capita(In Millions)Retail Sales
Source : Cedar Rapids Chamber of Commerce, Woods & Poole Economics Iowa Department of Employment Services, Iowa Retail Sales & Use Tax Report
Note: The information provided in this chart is collected on a calendar year basis, so data for 2016 is not yet available.
(In Millions)Retail Sales
Cedar Rapids
RateUnemploymentLinn-CountyMarion State
UnemploymentRateIncome
PersonalIncome
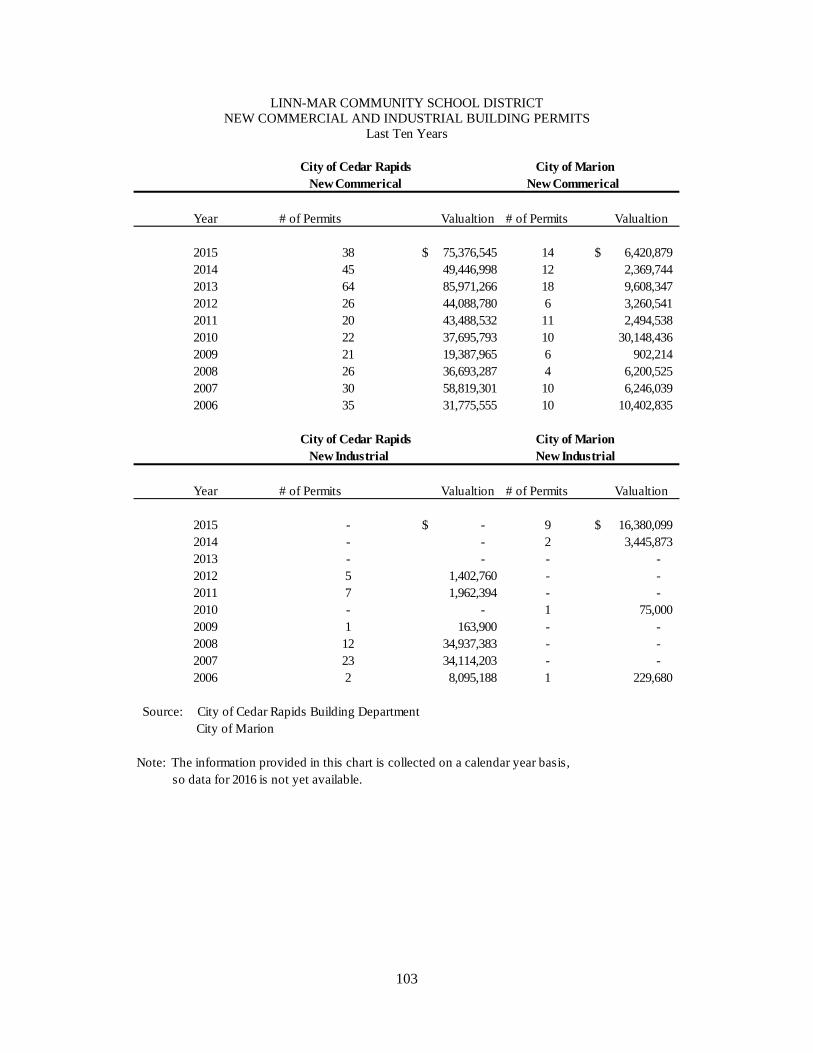
103
LINN-MAR COMMUNITY SCHOOL DISTRICT NEW COMMERCIAL AND INDUSTRIAL BUILDING PERMITS
Last Ten Years
City of Cedar Rapids City of Marion New Commerical New Commerical
Year # of Permits Valualtion # of Permits Valualtion
2015 38 $ 75,376,545 14 $ 6,420,879 2014 45 49,446,998 12 2,369,744 2013 64 85,971,266 18 9,608,347 2012 26 44,088,780 6 3,260,541 2011 20 43,488,532 11 2,494,5382010 22 37,695,793 10 30,148,4362009 21 19,387,965 6 902,2142008 26 36,693,287 4 6,200,5252007 30 58,819,301 10 6,246,0392006 35 31,775,555 10 10,402,835
City of Cedar Rapids City of Marion New Industrial New Industrial
Year # of Permits Valualtion # of Permits Valualtion
2015 - $ - 9 $ 16,380,099 2014 - - 2 3,445,873 2013 - - - - 2012 5 1,402,760 - - 2011 7 1,962,394 - - 2010 - - 1 75,000 2009 1 163,900 - - 2008 12 34,937,383 - - 2007 23 34,114,203 - - 2006 2 8,095,188 1 229,680
Source: City of Cedar Rapids Building Department City of Marion
Note: The information provided in this chart is collected on a calendar year basis, so data for 2016 is not yet available.
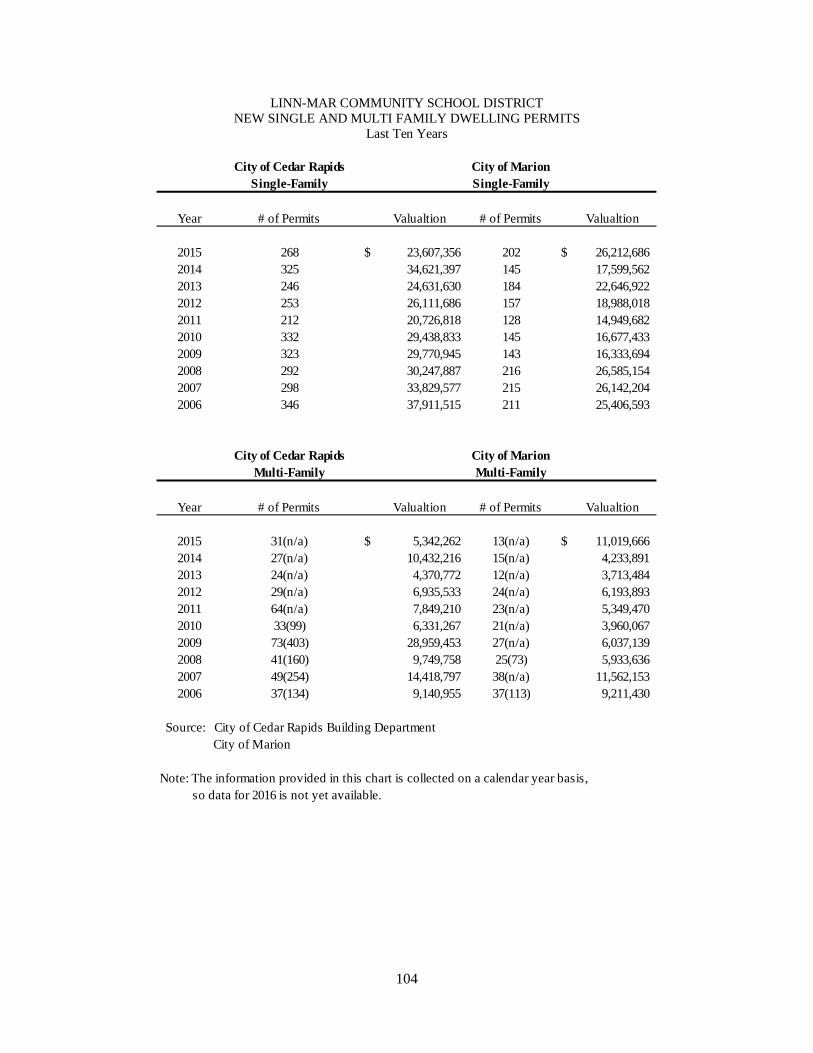
104
LINN-MAR COMMUNITY SCHOOL DISTRICT NEW SINGLE AND MULTI FAMILY DWELLING PERMITS
Last Ten Years
City of Cedar Rapids City of MarionSingle-Family Single-Family
Year # of Permits Valualtion # of Permits Valualtion
2015 268 $ 23,607,356 202 $ 26,212,686 2014 325 34,621,397 145 17,599,562 2013 246 24,631,630 184 22,646,922 2012 253 26,111,686 157 18,988,018 2011 212 20,726,818 128 14,949,682 2010 332 29,438,833 145 16,677,433 2009 323 29,770,945 143 16,333,694 2008 292 30,247,887 216 26,585,1542007 298 33,829,577 215 26,142,204 2006 346 37,911,515 211 25,406,593
City of Cedar Rapids City of MarionMulti-Family Multi-Family
Year # of Permits Valualtion # of Permits Valualtion
2015 31(n/a) $ 5,342,262 13(n/a) $ 11,019,666 2014 27(n/a) 10,432,216 15(n/a) 4,233,891 2013 24(n/a) 4,370,772 12(n/a) 3,713,484 2012 29(n/a) 6,935,533 24(n/a) 6,193,893 2011 64(n/a) 7,849,210 23(n/a) 5,349,470 2010 33(99) 6,331,267 21(n/a) 3,960,067 2009 73(403) 28,959,453 27(n/a) 6,037,139 2008 41(160) 9,749,758 25(73) 5,933,636 2007 49(254) 14,418,797 38(n/a) 11,562,153 2006 37(134) 9,140,955 37(113) 9,211,430
Source: City of Cedar Rapids Building Department City of Marion
Note: The information provided in this chart is collected on a calendar year basis, so data for 2016 is not yet available.

105
LINN-MAR COMMUNITY SCHOOL DISTRICT PRINCIPAL EMPLOYERS
Current Year and Nine Years Ago
Percentage Percentageof Total of Total
Employer Employees Employment Employees Employment
State University of IA/Hospital 34,378 19.05 % 22,623 13.65 %Rockwell-Avionics 8,700 4.82 9,000 5.43 Area Schools/AEA 6,416 3.55 5,256 3.17 TransAmerica 3,800 2.11 - - St. Luke's Hospital 2,979 1.65 2,800 1.69 Mercy Medical Center 2,140 1.19 2,498 1.51 Whirlpool Corporation 2,500 1.39 2,650 1.60 Kirkwood Comm. College 810 0.45 - - Veterans Health Administration 1,562 0.87 - - Pearson 1,756 0.97 1,929 1.16 Mercy Iowa City 900 0.50 - - Hy-Vee Stores 2,425 1.34 2,971 1.79 Aegon USA - - 3,500 2.11 Wal-mart Stores, Inc. 1,048 0.58 1,530 0.92 Total 69,414 38.46 % 54,757 33.04 %
Source: Cedar Rapids Area Chamber of Commerce Woods and Poole Economics, Inc.
Note: These numbers are prepared on a calender year basis so 2016 information would be unavailable at this time.In addtion, we have provided the 2006 data to retain a ten year reference from the 2015 data presented in the table above.
2015 2006
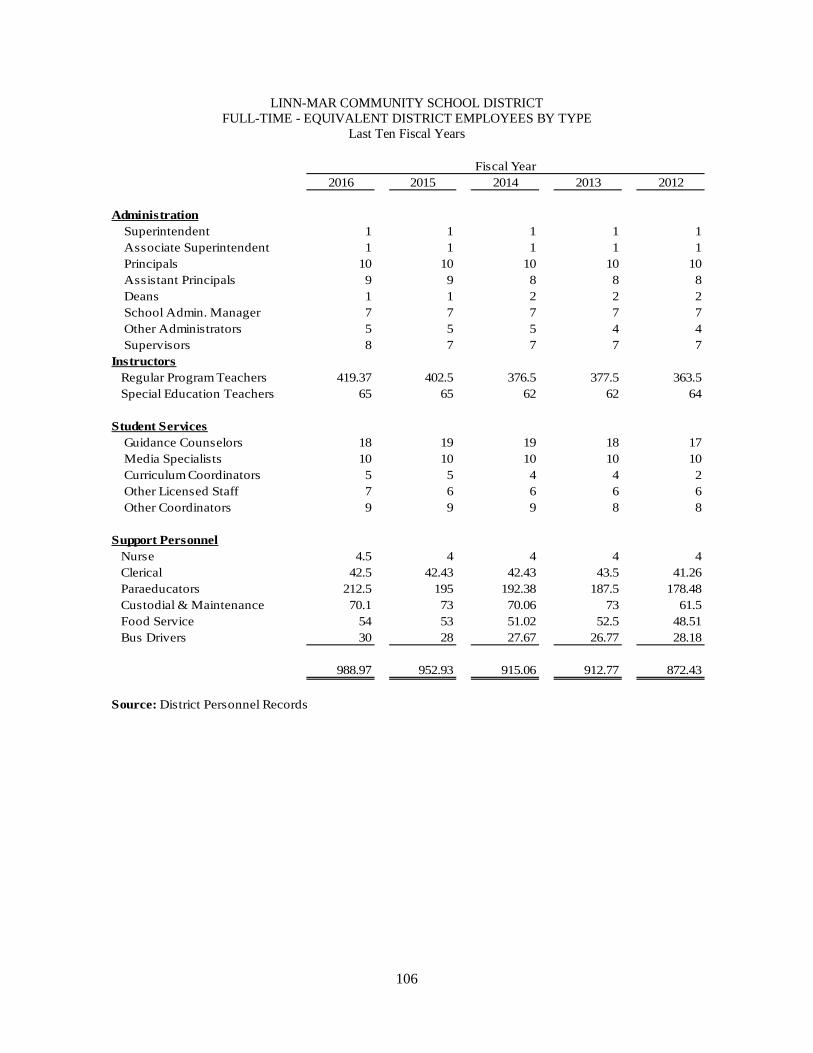
106
LINN-MAR COMMUNITY SCHOOL DISTRICT FULL-TIME - EQUIVALENT DISTRICT EMPLOYEES BY TYPE
Last Ten Fiscal Years
2016 2015 2014 2013 2012
Administration Superintendent 1 1 1 1 1 Associate Superintendent 1 1 1 1 1 Principals 10 10 10 10 10 Assistant Principals 9 9 8 8 8 Deans 1 1 2 2 2 School Admin. Manager 7 7 7 7 7 Other Administrators 5 5 5 4 4 Supervisors 8 7 7 7 7Instructors Regular Program Teachers 419.37 402.5 376.5 377.5 363.5 Special Education Teachers 65 65 62 62 64
Student Services Guidance Counselors 18 19 19 18 17 Media Specialists 10 10 10 10 10 Curriculum Coordinators 5 5 4 4 2 Other Licensed Staff 7 6 6 6 6 Other Coordinators 9 9 9 8 8
Support Personnel Nurse 4.5 4 4 4 4 Clerical 42.5 42.43 42.43 43.5 41.26 Paraeducators 212.5 195 192.38 187.5 178.48 Custodial & Maintenance 70.1 73 70.06 73 61.5 Food Service 54 53 51.02 52.5 48.51 Bus Drivers 30 28 27.67 26.77 28.18
988.97 952.93 915.06 912.77 872.43
Source: District Personnel Records
Fiscal Year

107
2011 2010 2009 2008 2007
1 1 1 1 11 1 1 1 1
10 10 10 10 98 6 6 5 52 2 2 2 - 7 5 3 2 24 4 4 4 38 7 7 4.5 4
367.33 366.6 362.6 356.92 327.5954.27 56 55 54 52
17 17 17 17 1510 10 10 9 82 2 2 2 26 5 5 5 56 4 4 4 3
4 4 4 4 3.7543.56 43.5 43.4 40.36 36.15
144.95 154.9 149 144.27 133.1358 63 63 63.06 62.46
51.57 49.82 48.16 48.07 41.5926.9 28.19 27.09 21.53 22.03
832.58 840.01 824.25 798.71 736.7
Fiscal Year
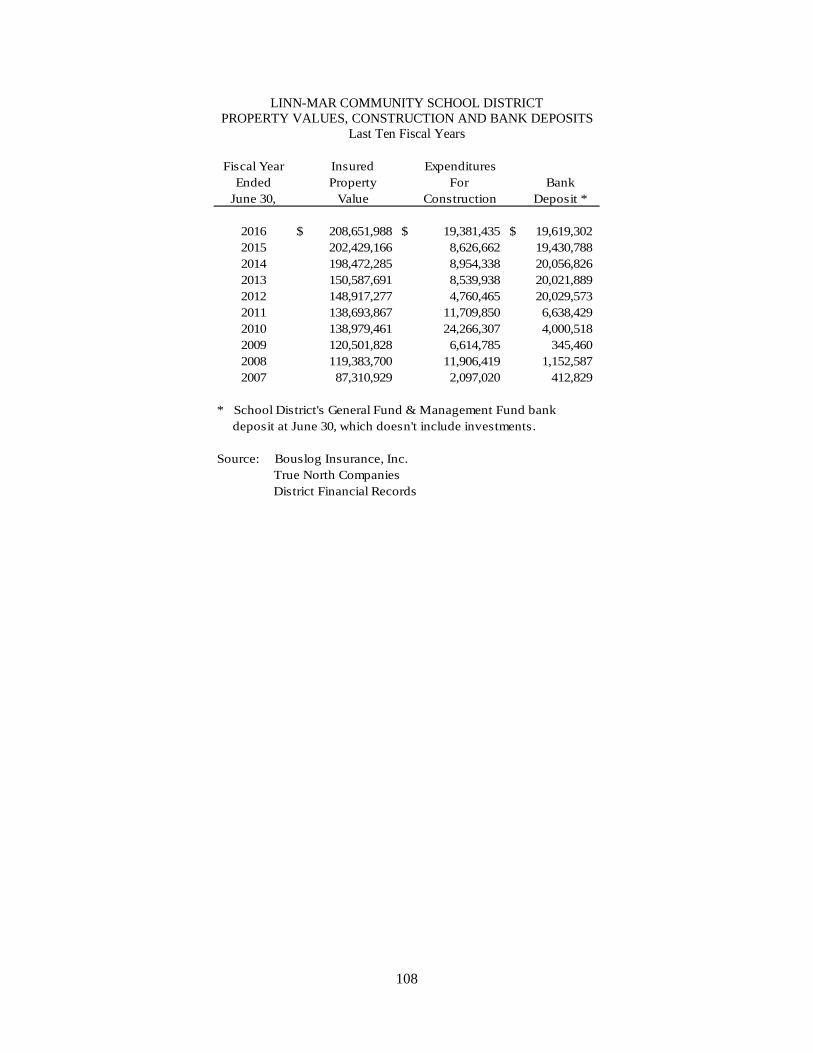
108
LINN-MAR COMMUNITY SCHOOL DISTRICT PROPERTY VALUES, CONSTRUCTION AND BANK DEPOSITS
Last Ten Fiscal Years
Fiscal Year Insured ExpendituresEnded Property For Bank
June 30, Value Construction Deposit *
2016 $ 208,651,988 $ 19,381,435 $ 19,619,302 2015 202,429,166 8,626,662 19,430,788 2014 198,472,285 8,954,338 20,056,826 2013 150,587,691 8,539,938 20,021,889 2012 148,917,277 4,760,465 20,029,573 2011 138,693,867 11,709,850 6,638,429 2010 138,979,461 24,266,307 4,000,518 2009 120,501,828 6,614,785 345,460 2008 119,383,700 11,906,419 1,152,587 2007 87,310,929 2,097,020 412,829
* School District's General Fund & Management Fund bank deposit at June 30, which doesn't include investments.
Source: Bouslog Insurance, Inc. True North Companies District Financial Records

109
LINN-MAR COMMUNITY SCHOOL DISTRICT OPERATING COST PER PUPIL
Last Ten Fiscal Years
Average Operating CostsFiscal Year Total Costs * Daily Attendance Per Pupil
2015-2016 76,800,260$ 6,931 11,081$ 2014-2015 73,021,462 6,845 10,668 2013-2014 68,501,215 6,714 10,203 2012-2013 65,290,796 6,695 9,752 2011-2012 62,700,238 6,419 9,768 2010-2011 60,143,815 6,252 9,620 2009-2010 57,901,127 5,963 9,710 2008-2009 56,457,320 5,759 9,803 2007-2008 52,532,924 5,491 9,567 2006-2007 46,235,638 5,299 8,725
* Includes all General Fund Expenditures
Source: School District Financial and attendance reports

110
LINN-MAR COMMUNITY SCHOOL DISTRICT SCHOOL BUILDING INFORMATION
Last Ten Fiscal Years
School 2007 2008 2009 2010
ElementaryBowman Woods Square Feet 50,906 50,906 50,906 50,906 Capacity 500 500 500 500 Enrollment 537 474 437 429 Echo Hill Square Feet - - 78,000 78,000 Capacity - - 600 600 Enrollment - - 511 542 Indian Creek Square Feet 49,200 49,200 49,200 49,200 Capacity 450 450 450 450 Enrollment 525 366 385 430 Linn Grove Square Feet - 78,000 78,000 78,000 Capacity - 600 600 600 Enrollment - 374 379 392 Novak Square Feet 57,300 57,300 57,300 57,300 Capacity 400 400 400 400 Enrollment 381 345 357 351 Westfield Square Feet 58,000 58,000 58,000 58,000 Capacity 500 500 500 500 Enrollment 443 472 427 457 Wilkins Square Feet 48,800 48,800 48,800 48,800 Capacity 500 500 500 500 Enrollment 508 411 442 436 PreK-8 Building c
Oak Ridge Square Feet 105,383 105,383 - - Capacity 750 750 - - Enrollment 781 925 - - Middle School/Intermediate a
Excelsior Square Feet 126,700 126,700 126,700 126,700 Capacity 1,100 1,100 1,100 1,100 Enrollment 823 785 767 738 Oak Ridge c
Square Feet - - 105,383 105,383 Capacity - - 750 750 Enrollment - - 599 659 High School/Junior High b
Square Feet 305,000 305,000 305,000 305,000 Capacity 1,800 1,800 1,800 1,800 Enrollment 1,642 1,694 1,761 1,806
Notes: Overtime some of the buildings capacity have actually decreased due to the inclusion of additonal special programs.a Excelsior Middle School opened in 1995 as an intermediate school and was added on to 1999 and converted into a middle school.b The high school started out as two separate buildings; the high school and junior high. Over time they were both added onto and are now one large building.c With the opening of Echo Hill elementary school at the start of the 2008-2009 school year, Oak Ridge school was converted from a PreK-8 school to a middle school.
Source: School District financial records.
Fiscal Year

111
2011 2012 2013 2014 2015 2016
50,906 50,906 50,906 50,906 50,906 50,906 500 500 500 550 550 550 417 436 408 419 484 484
78,000 78,000 78,000 78,000 78,000 78,000 600 600 600 600 600 600 458 432 502 512 567 612
49,200 49,200 49,200 49,200 49,200 49,200 450 450 450 500 500 500 452 447 502 502 509 516
78,000 78,000 78,000 78,000 78,000 78,000 600 600 600 600 600 600 440 460 454 466 491 562
57,300 57,300 78,000 78,000 78,000 78,000 400 400 600 600 600 600 484 485 504 518 454 529
58,000 58,000 58,000 58,000 58,000 58,000 500 500 500 500 500 500 459 446 453 452 426 437
48,800 48,800 48,800 48,800 48,800 48,800 500 500 500 500 500 500 447 458 432 440 479 465
- - - - - - - - - - - - - - - - - -
126,700 126,700 126,700 126,700 126,700 126,700 1,100 1,100 1,100 1,000 1,000 1,000
761 849 927 938 928 947
105,383 105,383 105,383 105,383 105,383 117,013 750 750 750 750 750 800 700 670 678 681 713 756
305,000 305,000 305,000 315,478 315,478 315,478 1,800 1,800 1,800 2,200 2,200 2,200 1,708 1,776 1,928 1,934 1,979 2,012
Fiscal Year
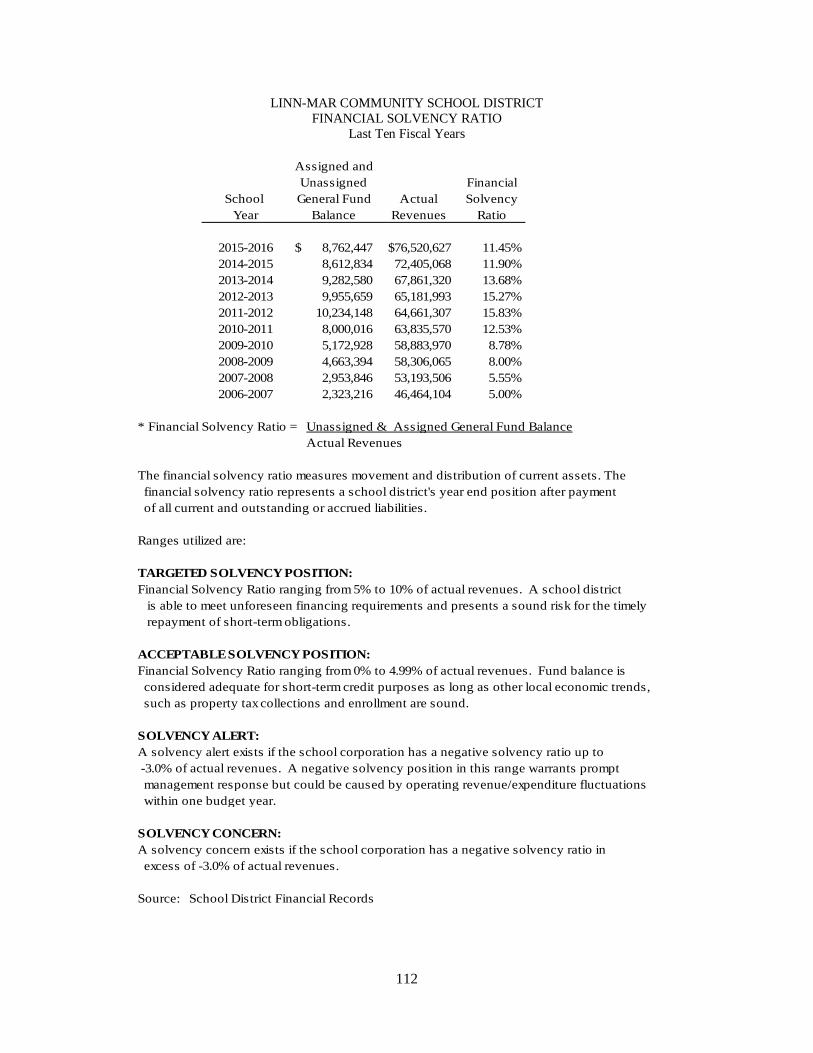
112
LINN-MAR COMMUNITY SCHOOL DISTRICT FINANCIAL SOLVENCY RATIO
Last Ten Fiscal Years
Assigned andUnassigned Financial
School General Fund Actual SolvencyYear Balance Revenues Ratio
2015-2016 8,762,447$ 76,520,627$ 11.45%2014-2015 8,612,834 72,405,068 11.90%2013-2014 9,282,580 67,861,320 13.68%2012-2013 9,955,659 65,181,993 15.27%2011-2012 10,234,148 64,661,307 15.83%2010-2011 8,000,016 63,835,570 12.53%2009-2010 5,172,928 58,883,970 8.78%2008-2009 4,663,394 58,306,065 8.00%2007-2008 2,953,846 53,193,506 5.55%2006-2007 2,323,216 46,464,104 5.00%
* Financial Solvency Ratio = Unassigned & Assigned General Fund Balance Actual Revenues
financial solvency ratio represents a school district's year end position after payment of all current and outstanding or accrued liabilities.
Ranges utilized are:
TARGETED SOLVENCY POSITION:Financial Solvency Ratio ranging from 5% to 10% of actual revenues. A school district is able to meet unforeseen financing requirements and presents a sound risk for the timely repayment of short-term obligations. ACCEPTABLE SOLVENCY POSITION:Financial Solvency Ratio ranging from 0% to 4.99% of actual revenues. Fund balance is considered adequate for short-term credit purposes as long as other local economic trends, such as property tax collections and enrollment are sound.
SOLVENCY ALERT:
SOLVENCY CONCERN:A solvency concern exists if the school corporation has a negative solvency ratio in excess of -3.0% of actual revenues.
Source: School District Financial Records
within one budget year. management response but could be caused by operating revenue/expenditure fluctuations -3.0% of actual revenues. A negative solvency position in this range warrants prompt A solvency alert exists if the school corporation has a negative solvency ratio up to
The financial solvency ratio measures movement and distribution of current assets. The

113
LINN-MAR COMMUNITY SCHOOL DISTRICT SCHEDULE OF AVERAGE DAILY MEMBERSHIP(ADM), AVERAGE DAILY
ATTENDANCE (ADA) AND RATIO OF ADA TO ADM Last Ten Fiscal Years
Average Average
Fiscal Year Daily DailyEnding Membership AttendanceJune 30, (ADM) (ADA)
2016 7,241 6,931 95.72 %2015 7,146 6,845 95.792014 6,986 6,714 96.112013 6,985 6,695 95.852012 6,687 6,419 95.992011 6,534 6,252 95.682010 6,308 5,963 94.532009 6,069 5,759 94.892008 5,814 5,491 94.442007 5,602 5,299 94.59
Source: District Enrollment Records
Ratio ofADA to ADM
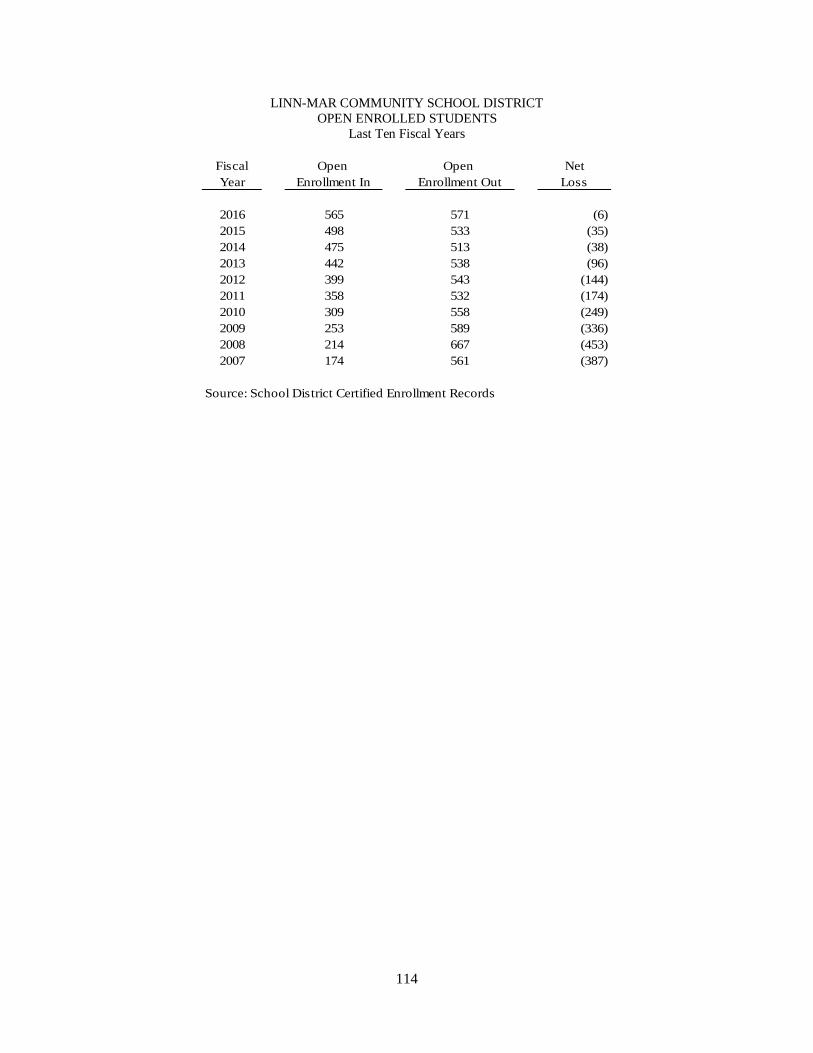
114
LINN-MAR COMMUNITY SCHOOL DISTRICT OPEN ENROLLED STUDENTS
Last Ten Fiscal Years
Fiscal Open Open NetYear Enrollment In Enrollment Out Loss
2016 565 571 (6)2015 498 533 (35)2014 475 513 (38)2013 442 538 (96)2012 399 543 (144)2011 358 532 (174)2010 309 558 (249)2009 253 589 (336)2008 214 667 (453)2007 174 561 (387)
Source: School District Certified Enrollment Records

115
SINGLE AUDIT SECTION
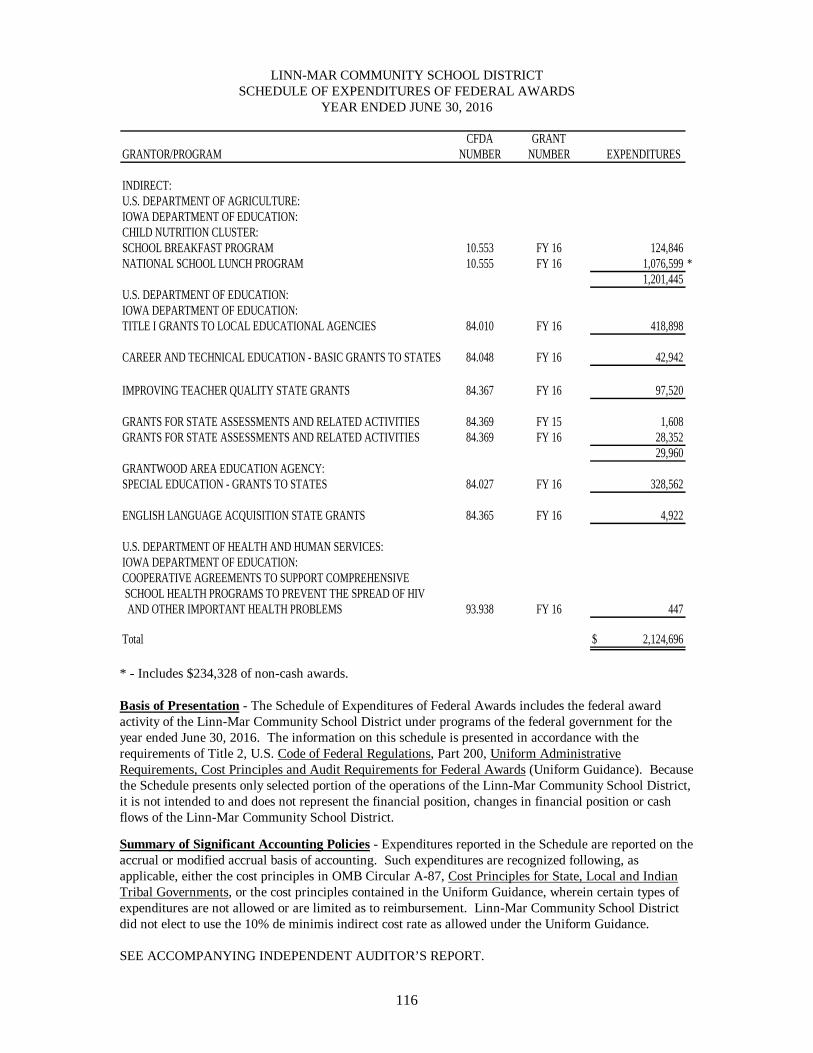
116
LINN-MAR COMMUNITY SCHOOL DISTRICT SCHEDULE OF EXPENDITURES OF FEDERAL AWARDS
YEAR ENDED JUNE 30, 2016
CFDA GRANTGRANTOR/PROGRAM NUMBER NUMBER EXPENDITURES
INDIRECT:U.S. DEPARTMENT OF AGRICULTURE:IOWA DEPARTMENT OF EDUCATION:CHILD NUTRITION CLUSTER:SCHOOL BREAKFAST PROGRAM 10.553 FY 16 124,846NATIONAL SCHOOL LUNCH PROGRAM 10.555 FY 16 1,076,599 *
1,201,445U.S. DEPARTMENT OF EDUCATION:IOWA DEPARTMENT OF EDUCATION:TITLE I GRANTS TO LOCAL EDUCATIONAL AGENCIES 84.010 FY 16 418,898
CAREER AND TECHNICAL EDUCATION - BASIC GRANTS TO STATES 84.048 FY 16 42,942
IMPROVING TEACHER QUALITY STATE GRANTS 84.367 FY 16 97,520
GRANTS FOR STATE ASSESSMENTS AND RELATED ACTIVITIES 84.369 FY 15 1,608GRANTS FOR STATE ASSESSMENTS AND RELATED ACTIVITIES 84.369 FY 16 28,352
29,960GRANTWOOD AREA EDUCATION AGENCY:SPECIAL EDUCATION - GRANTS TO STATES 84.027 FY 16 328,562
ENGLISH LANGUAGE ACQUISITION STATE GRANTS 84.365 FY 16 4,922
U.S. DEPARTMENT OF HEALTH AND HUMAN SERVICES:IOWA DEPARTMENT OF EDUCATION:COOPERATIVE AGREEMENTS TO SUPPORT COMPREHENSIVE SCHOOL HEALTH PROGRAMS TO PREVENT THE SPREAD OF HIV AND OTHER IMPORTANT HEALTH PROBLEMS 93.938 FY 16 447
Total $ 2,124,696
* - Includes $234,328 of non-cash awards. Basis of Presentation - The Schedule of Expenditures of Federal Awards includes the federal award activity of the Linn-Mar Community School District under programs of the federal government for the year ended June 30, 2016. The information on this schedule is presented in accordance with the requirements of Title 2, U.S. Code of Federal Regulations, Part 200, Uniform Administrative Requirements, Cost Principles and Audit Requirements for Federal Awards (Uniform Guidance). Because the Schedule presents only selected portion of the operations of the Linn-Mar Community School District, it is not intended to and does not represent the financial position, changes in financial position or cash flows of the Linn-Mar Community School District. Summary of Significant Accounting Policies - Expenditures reported in the Schedule are reported on the accrual or modified accrual basis of accounting. Such expenditures are recognized following, as applicable, either the cost principles in OMB Circular A-87, Cost Principles for State, Local and Indian Tribal Governments, or the cost principles contained in the Uniform Guidance, wherein certain types of expenditures are not allowed or are limited as to reimbursement. Linn-Mar Community School District did not elect to use the 10% de minimis indirect cost rate as allowed under the Uniform Guidance. SEE ACCOMPANYING INDEPENDENT AUDITOR’S REPORT.
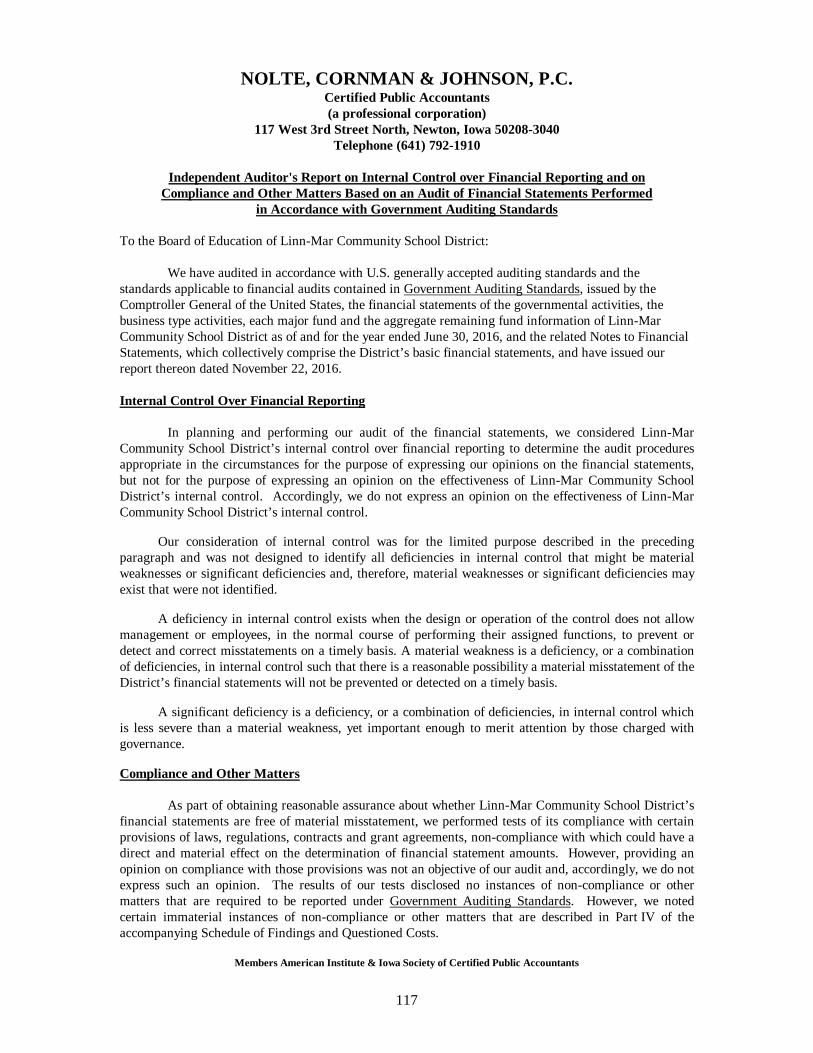
117
NOLTE, CORNMAN & JOHNSON, P.C. Certified Public Accountants (a professional corporation)
117 West 3rd Street North, Newton, Iowa 50208-3040 Telephone (641) 792-1910
Independent Auditor's Report on Internal Control over Financial Reporting and on
Compliance and Other Matters Based on an Audit of Financial Statements Performed in Accordance with Government Auditing Standards
To the Board of Education of Linn-Mar Community School District: We have audited in accordance with U.S. generally accepted auditing standards and the standards applicable to financial audits contained in Government Auditing Standards, issued by the Comptroller General of the United States, the financial statements of the governmental activities, the business type activities, each major fund and the aggregate remaining fund information of Linn-Mar Community School District as of and for the year ended June 30, 2016, and the related Notes to Financial Statements, which collectively comprise the District’s basic financial statements, and have issued our report thereon dated November 22, 2016. Internal Control Over Financial Reporting
In planning and performing our audit of the financial statements, we considered Linn-Mar Community School District’s internal control over financial reporting to determine the audit procedures appropriate in the circumstances for the purpose of expressing our opinions on the financial statements, but not for the purpose of expressing an opinion on the effectiveness of Linn-Mar Community School District’s internal control. Accordingly, we do not express an opinion on the effectiveness of Linn-Mar Community School District’s internal control.
Our consideration of internal control was for the limited purpose described in the preceding paragraph and was not designed to identify all deficiencies in internal control that might be material weaknesses or significant deficiencies and, therefore, material weaknesses or significant deficiencies may exist that were not identified.
A deficiency in internal control exists when the design or operation of the control does not allow management or employees, in the normal course of performing their assigned functions, to prevent or detect and correct misstatements on a timely basis. A material weakness is a deficiency, or a combination of deficiencies, in internal control such that there is a reasonable possibility a material misstatement of the District’s financial statements will not be prevented or detected on a timely basis.
A significant deficiency is a deficiency, or a combination of deficiencies, in internal control which is less severe than a material weakness, yet important enough to merit attention by those charged with governance.
Compliance and Other Matters As part of obtaining reasonable assurance about whether Linn-Mar Community School District’s financial statements are free of material misstatement, we performed tests of its compliance with certain provisions of laws, regulations, contracts and grant agreements, non-compliance with which could have a direct and material effect on the determination of financial statement amounts. However, providing an opinion on compliance with those provisions was not an objective of our audit and, accordingly, we do not express such an opinion. The results of our tests disclosed no instances of non-compliance or other matters that are required to be reported under Government Auditing Standards. However, we noted certain immaterial instances of non-compliance or other matters that are described in Part IV of the accompanying Schedule of Findings and Questioned Costs.
Members American Institute & Iowa Society of Certified Public Accountants
118
Comments involving statutory and other legal matters about the District’s operations for the year ended June 30, 2016 are based exclusively on knowledge obtained from procedures performed during our audit of the financial statements of the District. Since our audit was based on tests and samples, not all transactions that might have had an impact on the comments were necessarily audited. The comments involving statutory and other legal matters are not intended to constitute legal interpretations of those statutes. Linn-Mar Community School District’s Responses to Findings Linn-Mar Community School District’s responses to findings identified in our audit are described in the accompanying Schedule of Findings and Questioned Costs. Linn-Mar Community School District’s responses were not subjected to the auditing procedures applied in the audit or the financial statements and, accordingly, we express no opinion on them. Purpose of this Report The purpose of this report is solely to describe the scope of our testing of internal control and compliance and the result of that testing, and not to provide an opinion on the effectiveness of the District’s internal control or on compliance. This report is an integral part of an audit performed in accordance with Government Auditing Standards in considering the District’s internal control and compliance. Accordingly, this communication is not suitable for any other purpose. We would like to acknowledge the many courtesies and assistance extended to us by personnel of Linn-Mar Community School District during the course of our audit. Should you have any questions concerning any of the above matters, we shall be pleased to discuss them with you at your convenience.
NOLTE, CORNMAN & JOHNSON, P.C. November 22, 2016 Newton, Iowa
5
Other Matters Required Supplementary Information U.S. generally accepted accounting principles require Management’s Discussion and Analysis, the Budgetary Comparison Information and the Schedule of Funding Progress for Retiree Health Plan on pages 7 through 15 and 40 through 42 be presented to supplement the basic financial statements. Such information, although not a part of the basic financial statements, is required by the Governmental Accounting Standards Board which considers it to be an essential part of financial reporting for placing the basic financial statements in an appropriate operational, economic or historical context. We have applied certain limited procedures to the required supplementary information of management about the methods of preparing the information and comparing the information for consistency with management’s responses to our inquiries, the basic financial statements and other knowledge we obtained during our audit of the basic financial statements. We do not express an opinion or provide any assurance on the information because the limited procedures do not provide us with sufficient evidence to express an opinion or provide any assurance. Supplementary Information Our audit was conducted for the purpose of forming opinions on the financial statements that collectively comprise Wayne Community School District’s basic financial statements. We previously audited, in accordance with the standards referred to in the third paragraph of this report, the financial statements for the year ended June 30, 2012 (which is not presented herein) and expressed an unqualified opinion on those financial statements. The supplementary information included in Schedules 1 through 4, is present for purposes of additional analysis and is not a required part of the basic financial statements. The supplementary information is the responsibility of management and was derived from and relates directly to the underlying accounting and other records used to prepare the basic financial statements. Such information has been subjected to the auditing procedures applied in the audit of the basic financial statements and certain additional procedures, including comparing and reconciling such information directly to the underlying accounting and other records used to prepare the basic financial statements or to the basic financial statements themselves, and other additional procedures in accordance with U.S. generally accepted auditing standards. In our opinion, the supplementary information is fairly stated in all material respects in relation to the basic financial statements taken as a whole. Other Reporting Required by Government Auditing Standards In accordance with Government Auditing Standards, we have also issued our report dated January 3, 2014 on our consideration so Wayne Community School District’s internal control over financial reporting and on our tests of its compliance with certain provisions of laws, regulations, contracts and grant agreements and other matters. The purpose of that report is to describe the scope of our testing of internal control over financial reporting and compliance and the results of that testing and not to provide an opinion on the internal control over financial reporting or on compliance. That report is an integral part of an audit per formed accordance with Government Auditing Standards in considering Wayne Community School District’s internal control over financial reporting and compliance. NOLTE, CORNMAN & JOHNSON, P.C. January 3, 2014 Newton, Iowa
119
NOLTE, CORNMAN & JOHNSON, P.C. Certified Public Accountants (a professional corporation)
117 West 3rd Street North, Newton, Iowa 50208-3040 Telephone (641) 792-1910
Independent Auditor’s Report on Compliance for Each Major Federal Program and on Internal Control Over Compliance
Required by the Uniform Guidance To the Board of Education of Linn-Mar Community School District: Report on Compliance for Each Major Federal Program We have audited Linn-Mar Community School District’s compliance with the types of compliance requirements described in U.S. Office of Management and Budget (OMB) Compliance Supplement that could have a direct and material effect on each of its major federal programs for the year ended June 30, 2016. Linn-Mar Community School District’s major federal programs are identified in Part I of the accompanying Schedule of Findings and Questioned Costs. Management’s Responsibility Management is responsible for compliance with federal statues, regulations, and the terms and conditions of its federal awards applicable to its federal programs. Auditor’s Responsibility Our responsibility is to express an opinion on compliance for each of Linn-Mar Community School District’s major federal programs based on our audit of the types of compliance requirements referred to above. We conducted our audit of compliance in accordance with U.S. generally accepted auditing standards, the standards applicable to financial audits contained in Government Auditing Standards, issued by the Comptroller General of the United States, and the audit requirements of Title 2, U.S. Code of Federal Regulations, Part 200, Uniform Administrative Requirements, Cost Principles and Audit Requirements for Federal Awards (Uniform Guidance). Those standards and the Uniform Guidance require that we plan and perform the audit to obtain reasonable assurance about whether non-compliance with the types of compliance requirements referred to above that could have a direct and material effect on a major federal program occurred. An audit includes examining, on a test basis, evidence about Linn-Mar Community School District’s compliance with those requirements and performing such other procedures as we considered necessary in the circumstances. We believe our audit provides a reasonable basis for our opinion on compliance for each of the major federal programs. However, our audit does not provide a legal determination of Linn-Mar Community School District’s compliance. Opinion on Each Major Federal Program In our opinion, Linn-Mar Community School District complied, in all material respects, with the types of compliance requirements referred to above that could have a direct and material effect on each of its major federal programs for the year ended June 30, 2016.
Members American Institute & Iowa Society of Certified Public Accountants

120
Report on Internal Control Over Compliance The management of Linn-Mar Community School District is responsible for establishing and maintaining effective internal control over compliance with the types of compliance requirements referred to above. In planning and performing our audit of compliance, we considered Linn-Mar Community School District’s internal control over compliance with the types of requirements that could have a direct and material effect on each major federal program to determine the auditing procedures appropriate in the circumstances for the purpose of expressing an opinion on compliance for each major federal program and to test and report on internal control over compliance in accordance with the Uniform Guidance, but not for the purpose of expressing an opinion on the effectiveness of internal control over compliance. Accordingly, we do not express an opinion on the effectiveness of Linn-Mar Community School District’s internal control over compliance.
A deficiency in the District’s internal control over compliance exists when the design or operation of a control does not allow management or employees, in the normal course of performing their assigned functions, to prevent or detect and correct noncompliance with a type of compliance requirement of a federal program on a timely basis. A material weakness in internal control over compliance is a deficiency, or combination of deficiencies, in internal control over compliance such that there is a reasonable possibility that material noncompliance with a type of compliance requirement of a federal program will not be prevented or detected and corrected on a timely basis. A significant deficiency in internal control over compliance is a deficiency, or a combination of deficiencies, in internal control over compliance with a type of compliance requirement of a federal program that is less severe than a material weakness in internal control over compliance, yet important enough to merit attention by those charged with governance.
Our consideration of internal control over compliance was for the limited purpose described in
the first paragraph and was not designed to identify all deficiencies in internal control over compliance that might be significant deficiencies or material weaknesses. We did not identify any deficiencies in internal control over compliance that we consider to be material weakness. However, material weaknesses may exist that have not been identified.
The purpose of this report on internal control over compliance is solely to describe the scope of our testing of internal control over compliance and the results of that testing based on the requirements of the Uniform Guidance. Accordingly, this report is not suitable for any other purpose. NOLTE, CORNMAN & JOHNSON, P.C. November 22, 2016 Newton, Iowa
5
Other Matters Required Supplementary Information U.S. generally accepted accounting principles require Management’s Discussion and Analysis, the Budgetary Comparison Information and the Schedule of Funding Progress for Retiree Health Plan on pages 7 through 15 and 40 through 42 be presented to supplement the basic financial statements. Such information, although not a part of the basic financial statements, is required by the Governmental Accounting Standards Board which considers it to be an essential part of financial reporting for placing the basic financial statements in an appropriate operational, economic or historical context. We have applied certain limited procedures to the required supplementary information of management about the methods of preparing the information and comparing the information for consistency with management’s responses to our inquiries, the basic financial statements and other knowledge we obtained during our audit of the basic financial statements. We do not express an opinion or provide any assurance on the information because the limited procedures do not provide us with sufficient evidence to express an opinion or provide any assurance. Supplementary Information Our audit was conducted for the purpose of forming opinions on the financial statements that collectively comprise Wayne Community School District’s basic financial statements. We previously audited, in accordance with the standards referred to in the third paragraph of this report, the financial statements for the year ended June 30, 2012 (which is not presented herein) and expressed an unqualified opinion on those financial statements. The supplementary information included in Schedules 1 through 4, is present for purposes of additional analysis and is not a required part of the basic financial statements. The supplementary information is the responsibility of management and was derived from and relates directly to the underlying accounting and other records used to prepare the basic financial statements. Such information has been subjected to the auditing procedures applied in the audit of the basic financial statements and certain additional procedures, including comparing and reconciling such information directly to the underlying accounting and other records used to prepare the basic financial statements or to the basic financial statements themselves, and other additional procedures in accordance with U.S. generally accepted auditing standards. In our opinion, the supplementary information is fairly stated in all material respects in relation to the basic financial statements taken as a whole. Other Reporting Required by Government Auditing Standards In accordance with Government Auditing Standards, we have also issued our report dated January 3, 2014 on our consideration so Wayne Community School District’s internal control over financial reporting and on our tests of its compliance with certain provisions of laws, regulations, contracts and grant agreements and other matters. The purpose of that report is to describe the scope of our testing of internal control over financial reporting and compliance and the results of that testing and not to provide an opinion on the internal control over financial reporting or on compliance. That report is an integral part of an audit per formed accordance with Government Auditing Standards in considering Wayne Community School District’s internal control over financial reporting and compliance. NOLTE, CORNMAN & JOHNSON, P.C. January 3, 2014 Newton, Iowa

121
LINN-MAR COMMUNITY SCHOOL DISTRICT SCHEDULE OF FINDINGS AND QUESTIONED COSTS
YEAR ENDED JUNE 30, 2016 Part I: Summary of the Independent Auditor’s Results: (a) Unmodified opinions were issued on the financial statements. (b) No material weaknesses in internal control over financial reporting was disclosed by the audit of the
financial statements. (c) The audit did not disclose any non-compliance which is material to the financial statements. (d) No material weaknesses in internal control over major programs were noted. (e) An unmodified opinion was issued on compliance with requirements applicable to each major
program. (f) The audit disclosed no audit finding which were required to be reported in accordance with the
Uniform Guidance, Section 200.515. (g) Major programs were as follows:
• Child Nutrition Cluster
(h) The dollar threshold used to distinguish between Type A and Type B programs was $750,000. (i) Linn-Mar Community School District qualified as a low-risk auditee.
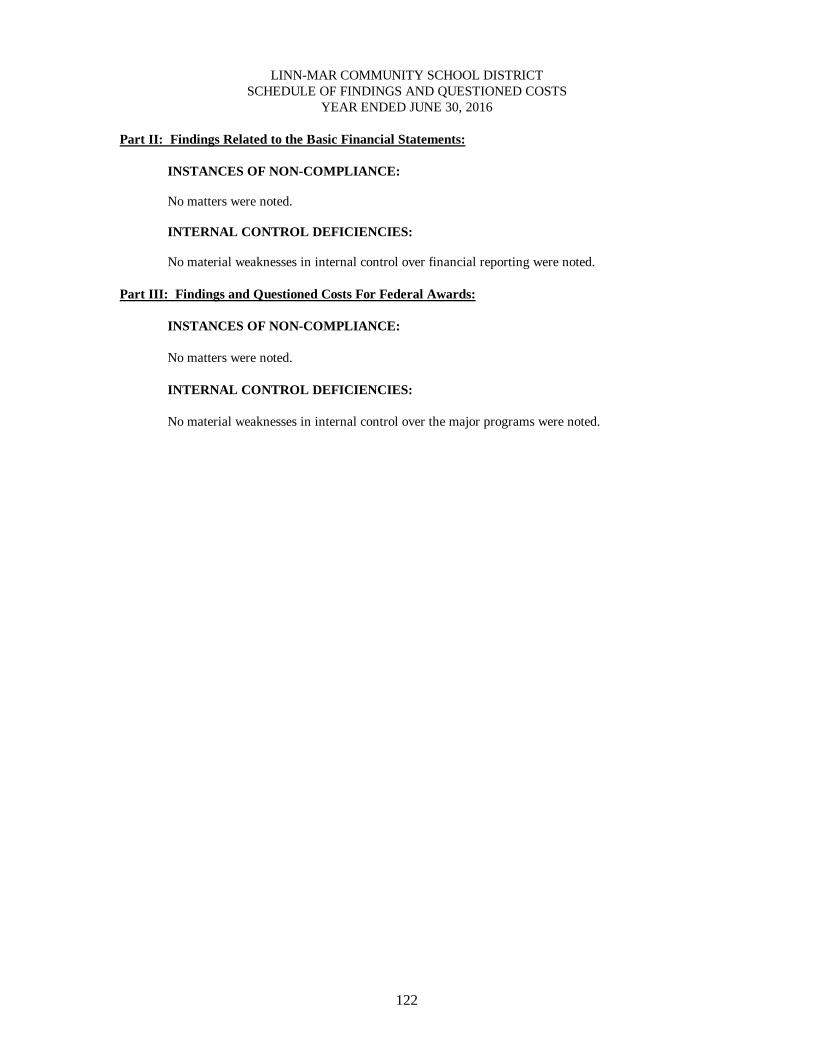
122
LINN-MAR COMMUNITY SCHOOL DISTRICT SCHEDULE OF FINDINGS AND QUESTIONED COSTS
YEAR ENDED JUNE 30, 2016 Part II: Findings Related to the Basic Financial Statements: INSTANCES OF NON-COMPLIANCE: No matters were noted. INTERNAL CONTROL DEFICIENCIES:
No material weaknesses in internal control over financial reporting were noted. Part III: Findings and Questioned Costs For Federal Awards:
INSTANCES OF NON-COMPLIANCE: No matters were noted. INTERNAL CONTROL DEFICIENCIES: No material weaknesses in internal control over the major programs were noted.

123
LINN-MAR COMMUNITY SCHOOL DISTRICT SCHEDULE OF FINDINGS AND QUESTIONED COSTS
YEAR ENDED JUNE 30, 2016 Part IV: Other Findings Related to Required Statutory Reporting:
IV-A-16 Certified Budget - District expenditures for the year ended June 30, 2016, exceeded the certified budgeted amount in the instruction functional area. Recommendation - The certified budget should have been amended in accordance with Chapter 24.9 of the Code of Iowa before expenditures were allowed to exceed the budget. Response - The District will closely monitor line items in future certified budgets and if necessary amend by May 31st as prescribed by Chapter 24.9 of the Code of Iowa. Conclusion - Response accepted.
IV-B-16 Questionable Expenditures - No expenditures we believe may not meet the requirements of public purpose as defined in the Attorney General’s opinion dated April 25, 1979, were noted.
IV-C-16 Travel Expense - No expenditures of District money for travel expenses of spouses of District officials or employees were noted. No travel advances to District officials or
employees were noted.
IV-D-16 Business Transactions - Business transactions between the District and District officials or employees are detailed as follows:
Name, Title andBusiness Connection Amount
Clark Weaver, Board Member Substitute Teaching 112$
DescriptionTransaction
The above transactions with a District board member do not appear to represent a conflict of interest per Chapter 279.7A of the Code of Iowa.
IV-E-16 Bond Coverage - Surety bond coverage of district officials and employees is in
accordance with statutory provisions. The amount of coverage should be reviewed annually to ensure that the coverage is adequate for current operations.
IV-F-16 Board Minutes - We noted no transactions requiring Board approval which have not been approved by the Board.
IV-G-16 Certified Enrollment - We noted variances in the basic enrollment data certified to the
Iowa Department of Education. The number certified to the Iowa Department of Education was overstated by 0.22 students for the Fall 2015 count date.
Recommendation - The District should contact the Iowa Department of Education and the Department of Management to resolve this matter. Response - The District’s auditor will contact the Iowa Department of Education and Department of Management to resolve this matter.
Conclusion - Response accepted.
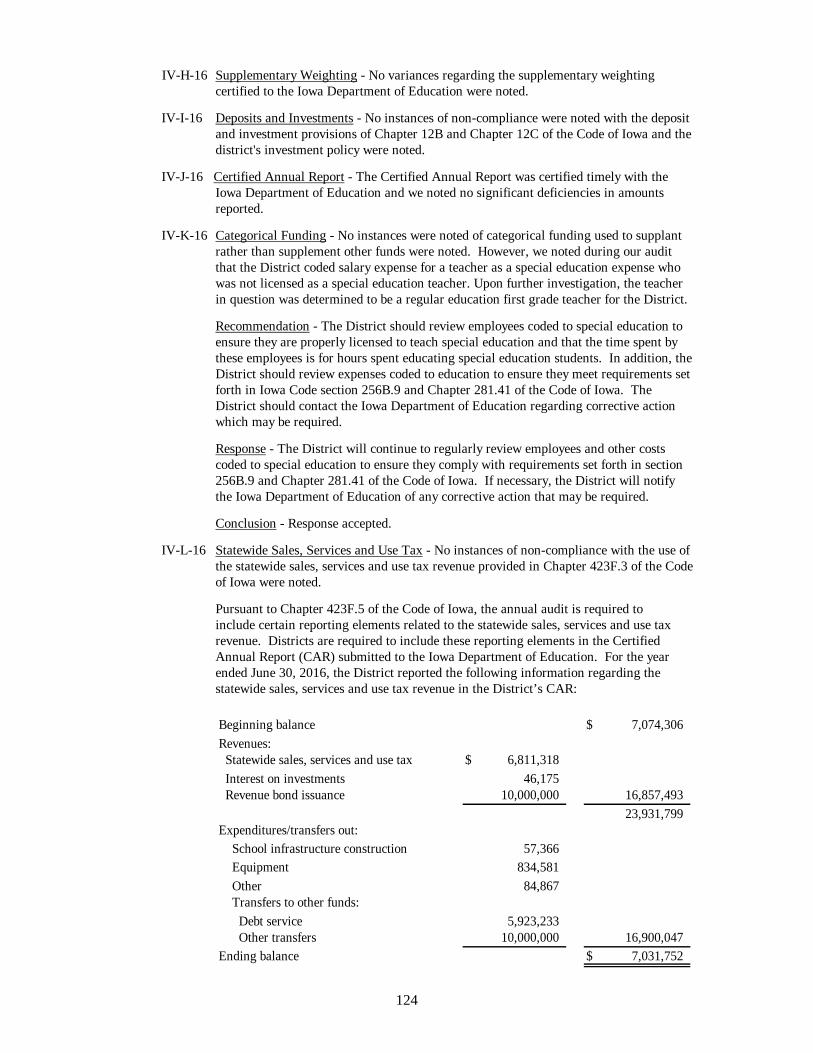
124
IV-H-16 Supplementary Weighting - No variances regarding the supplementary weighting certified to the Iowa Department of Education were noted.
IV-I-16 Deposits and Investments - No instances of non-compliance were noted with the deposit and investment provisions of Chapter 12B and Chapter 12C of the Code of Iowa and the district's investment policy were noted.
IV-J-16 Certified Annual Report - The Certified Annual Report was certified timely with the
Iowa Department of Education and we noted no significant deficiencies in amounts reported.
IV-K-16 Categorical Funding - No instances were noted of categorical funding used to supplant
rather than supplement other funds were noted. However, we noted during our audit that the District coded salary expense for a teacher as a special education expense who was not licensed as a special education teacher. Upon further investigation, the teacher in question was determined to be a regular education first grade teacher for the District.
Recommendation - The District should review employees coded to special education to ensure they are properly licensed to teach special education and that the time spent by these employees is for hours spent educating special education students. In addition, the District should review expenses coded to education to ensure they meet requirements set forth in Iowa Code section 256B.9 and Chapter 281.41 of the Code of Iowa. The District should contact the Iowa Department of Education regarding corrective action which may be required. Response - The District will continue to regularly review employees and other costs coded to special education to ensure they comply with requirements set forth in section 256B.9 and Chapter 281.41 of the Code of Iowa. If necessary, the District will notify the Iowa Department of Education of any corrective action that may be required. Conclusion - Response accepted.
IV-L-16 Statewide Sales, Services and Use Tax - No instances of non-compliance with the use of
the statewide sales, services and use tax revenue provided in Chapter 423F.3 of the Code of Iowa were noted.
Pursuant to Chapter 423F.5 of the Code of Iowa, the annual audit is required to
include certain reporting elements related to the statewide sales, services and use tax revenue. Districts are required to include these reporting elements in the Certified Annual Report (CAR) submitted to the Iowa Department of Education. For the year ended June 30, 2016, the District reported the following information regarding the statewide sales, services and use tax revenue in the District’s CAR:
Beginning balance $ 7,074,306 Revenues: Statewide sales, services and use tax $ 6,811,318 Interest on investments 46,175 Revenue bond issuance 10,000,000 16,857,493
23,931,799 Expenditures/transfers out: School infrastructure construction 57,366 Equipment 834,581 Other 84,867 Transfers to other funds: Debt service 5,923,233 Other transfers 10,000,000 16,900,047 Ending balance $ 7,031,752

125
For the year ended June 30, 2016, the District reduced the following levies as a result of the monies received under Chapter 423E or 423F of the Code of Iowa:
Rate of LevyReduction PropertyPer $1,000 Taxof Taxable DollarsValuation Reduced
Debt service 0.26000$ 500,000$