comprehensive agrarian reform program (carp) and the
TRANSCRIPT

For comments, suggestions or further inquiries please contact:
Philippine Institute for Development Studies
The PIDS Discussion Paper Seriesconstitutes studies that are preliminary andsubject to further revisions. They are be-ing circulated in a limited number of cop-ies only for purposes of soliciting com-ments and suggestions for further refine-ments. The studies under the Series areunedited and unreviewed.
The views and opinions expressedare those of the author(s) and do not neces-sarily reflect those of the Institute.
Not for quotation without permissionfrom the author(s) and the Institute.
The Research Information Staff, Philippine Institute for Development Studies3rd Floor, NEDA sa Makati Building, 106 Amorsolo Street, Legaspi Village, Makati City, PhilippinesTel Nos: 8924059 and 8935705; Fax No: 8939589; E-mail: [email protected]
Or visit our website at http://www.pids.gov.ph
August 1994
Comprehensive Agrarian Reform Program(CARP) and the Fisheries, Livestock
and Crop Sectors: Adjustmentsin the Pasture Leases
DISCUSSION PAPER SERIES NO. 94-16
Achilles Costales

COMPREHENSIVE AGRARIAN REFORM PROGRAM.AND THE FISHERIES, LIVESTOCK AND-CROP SECTORS: ADJUSTMENTS IN THE
PASTURE LEASES
Achilles Costales
The paper is part of the Dynamics of Rural Development (DRD)Project of the Philippine Institute for Development Studies.

ABSTRACT
The study focuses on how the pasture leaseshad been responding to the
_u_gesti.ons that the lands are to be subject to agrarian reform. As part of the public
domain, the pasture lease areas were initially (but not formally) considered for inclusion in
the splrit.ofthe Comprehensive Agrarian Reform Program (CAP,P) of 1988.
.The study-involved a survey of _!45 p_tsture leases in three regions in_the ......
Philippines where the pasture leases were concentrated, represented by the provinces of
Masbate, Bukidnon, and South Cotabato. The survey instrument was designed to obtain
information on the leases' history of bwestments; land use and carrying Capacities; herd'
eomposltion and transactions over a one-year period; as well as employment, variable
inputs, and revenue patterns. The instrument also obtained information on pasture
leaseholders' asset holdings and income patterns outside the pasture lease, their investment
responses to reported major sources of uncertainties in the pasture leases , namely: the
CAR.P, contending claims to their leases, and peace-and-order (insurgency) problems.
The study relies mainly on the descriptive method of analysis. The frequency
distribution of pasture lease characteristics were analyzed and the patterns were compared
.among the three regions (provinces) selected. From these, inferences about the pasture
lease performance in terms of investments designed to make the pasture leases productive
were made.
The study has determined that over an average of a 15-year period, investments in
improved pasture grass area expansion, maintenance, and management had remained
insignificant. For this reason, the average carrying capaelty of the leases have remained
exceedingly low relative to minimum targets. Investments in the improvement of the
genetic material of the breeding stock had also been minimal. The resulting calving rates
by the breeding cows was deemed to be less than half of the normal rates.

TABLE OF CONTENTS
PageCHAPTER I
Introduction IObjectives 9
CHAPTER II
Conceptual Framework 11•. .... Analytical Framework 14
CHAPTER Ill
Results and Discussion 22
CHAPTER IV
Summary, Conclusions and
Recommendations 57
Tables
Figures
Appendix A
Appendix B

CHAPTER I
I. Introduction
At first glance, the cattle industry seems to occupy a natural niche in Philippine
agriculture in general, and the livestock industry in particular. Roughly 90 percent of
the cattle population is raised under backyard-farm conditions where, on the average,
two heads of cattle are raised and fed with residues from crop farming activities
(Bureau of Agricultural Statisties,(BAS), t990). Backyard raising appears to bu a
natural sideline activity where free labor hours are put to productive use. In cases
.where the children do the rearing, a productive economic activity is realized with
minimal opportunity cost. Cattle coul(l also be made to perform some light draft before
finally being sold.
The apparent natural integration of cattle raising into the smallholder farms,
however, has not led to such expected consequences as expansion of the cattle
inventory and production of beef. Amid the rapid growth of economic activity in the
swine and poultry business, which has propelled the livestock industry to its stature as
the fastest-developing and most consistent growth sector in agriculture through the
second half of the last decade, the cattle population exhibited, in contrast, a continuous
decline in population during the same period.
Significant reductions in the cattle inventory had been taking place in the
commercial sector of the industry, with a depletion rate of close to 20 percent of the
standing stock every year (BAS, 1991). In the backyard sector, a consistent reduction
in the population was also observed, although at a much slower pace. The commercial
and backyard systems, in fact, are not independent of each other. The general case is

2
that the breeding and reproduction of cattle take place in the commercial farms, while
fattening and a host of other cattle-raising activities are subsequently performed at the
backyard level (Yazman, 1991). Thus, under a closed system, unless the depletion of
reprodt,ctive stocks in the commercial ranches is arrested, concomitant reduction in
backyard cattle-r',fising activities would be expected to continue.
1. The Backyard Cattle Raising Sector
. The backyard sector comprises_the bulk of cattle:fattening activity. The gradu-al
decline in the stocks which this sector has been working with through the years has
generated a lot of concern to industry planners. A survey of the literature of the
problems that beset the backyard sector reveals that among others, the critical
bottlenecks have been (i) the shortage _:r,_ithe high prices of feeder cattle from
domestic sources (Winrock International, 1991); (ii) low level of technology in cattle
raising (Molina, 1990); and Off) lack of availability and high cost of credit, and the
dependence in government credit for the acquisition of cattle to raise (Mangum, 1991;
Molina, 1990; Dimaano, 1990; Department of Agriculture, 1990; Perilla, 1984; De
Mesa, 1983; Medei, 1983).
2. The Commercial Ranching Sector
The observed rapid reduction in economic activity and cattle stock in the
commercial sector has been often attributed to the uncertainties imposed on commercial
ranching activities by, among others, the Comprehensive Agrarian Reform Law (CARL
or R.A. 6657 of 1988). Such uncertainties are also said to be compounded by the
adverse peace-and-order conditions in the cot,ntryside. The extent to which these

3
claims have in fact contributed to the rapid reduction in the cattle population in the
commercial sector, however, has yet to established.
The uncertainty over the privately-owned commercial ranches, however, has
temporarily been diffused. On the seventh of March 1991, the Supreme Court of the
Philippines declared as final and executory its December 4, 1990 decision of declaring
Sections 30a), 11, 13 and 32 of RA No. 6657 null and void for being unconstitutional.
These particular sections of the,Comprehensive Agrarian Reform Law (CARL) of 1988
referred to the inclusion of the raising of livestock, poultry and swine in the Law's
coverage. The Court Ruling therefore exempts, among others livestock activities,
commercial cattle raising on private lands exceeding five (5) hectares.
•3. The Pasture Leases.
Apart from the private commercial ranches, the more significant magnitude of
cattle ranching activity is undertaken under government lands classified as pasture
leases.
Pasture leases are covered by long-term Pasture Lease or Forest Land Grazing
Lease Agreements (PLAs or FLGLAs) granted by the Department of Environment and
Natural Resources (DENR).
To date not much is known about the current state of the pasture leases in the
Philippines. A systematic account of the performance of the pasture leases is
•unavailable. Holders of pasture lease agreements (PLAs) are required by the terms of
the contract to submit a pasture development plan as well as annual reports on stocks
and investments on improvements to the Department of Environment and Natural

Resources (DENR). The DENR in recent years, however, has experienced a secular
decline in the submission of PLA reports. Less than 40 percent of PLA holders
actually submit records, with reliability open to question. Furthermore, not all the
reports reach the central office. As a result, reported investments account for less than
five percent of all PLA holders (Yazman, 1990).
Pasture leases proliferate mostly in the main islands of Luzon and Mindanao.
As of May 1991,. Reg-i _ns!I, I.V.and V a_.count for 70.percent total _tiumbef 0f PLAs _
and 72 percent of total lease area in the island of Luzon. In Mindanao, Regions X and
XI lead the rest, combining for a total of 88 percent of all PLAs and about 75 percent
of leasedarea in the island. The average size of pastui:e leases is close to 400 hectares,
with higher averag,_r _ Mindanao at 540 hectares, and least in Luzon at around 350
hectares (DENR, 1992).
The rate at which the pasture leases are currently stocked is not exactly known.
Previous conjectures about the average stocking rate in the pasture leases are put at
around 0.2 animal units (a.u.) per hectare (Quisumbing, 1987). Under improved
pasture conditions, the stocking rate can be technically raised to 2.0 au. per hectare
(PCARRD, 1985). Well managed pastures can carry up to 5.0 au. per hectare
(Yazman, 1991).
As of 1991, the remaining active PLAs/FLGLASs was posted at 973 leases, a
decline by 1,036 from its 1980 figure Of 2,009 leases. In terms of area, the remaininng
PLAs/FLGLAs covered 377,400 hectares, a reduction of 504,600 hectares from its
1980 level of 882,000 hectares. Exit from the pasture lease is registered as cancellation

5
of lease by the DENR. From the viewpoint of the DENR, the cancellation of lease
agreements were mainly due to failure of payment of rental fees and other charges,
abandonment of the area by the lease holder, and failure to submit Annual Grazing
•Reports (AGRs).
In the originally targetted (i.e. regions IV,V,X and XI) study regions alone, a
total of 241 leases covering 131,044 hectares were cancelled between 1980 to 1991.
....On the other hand,-187-leaseswere granted- covering 37,65f-hectares Ove_-the gan'ie :"
period. From the perspective of the commercial ranchers, the poor performance of the
pasture leases which lead to either poor compliance of the conditions attached to them
agreements or abandonment of the lease, were traced to the unstable peace and order
conditions in the countryside _n.d the h_" _7:y to control illegal evcroachment
("squatting") inside the lease areas (ADB-Winrock, 1991).
As of 1991, the remaining active PLAs/FLGLASs was posted at 973 leases, ai
decline by 1,036 from its 1980 figure Of 2,009 leases. In terms of area, the remaininng
PLAs/FLGLAs covered 377,400 hectares, a redtlction of 504,600 hectares from its
1980 level of 882,000 hectares. Exit from the pasture lease is registered as cancellation
of lease by the DENR. From the viewpoint of the DENR, the cancellation of lease
agreements were mainly due to failure of payment of rental fees and other charges,
abandonment of the area by the lease holder, and failure to submit Annual Grazing
Reports (AGRs).
In the originally targetted (i.e. regions IV,V,X and XI) study regions alone, a
total of 241 leases covering 131,044 hectares were cancelled between 1980 to 1991.

6
'On the other hand, 187 leases were granted, covering 37,656 hectares over the same
period. From the perspective of the commercial ranchers, the poor performance of the
pasture leases which lead to either poor compliance of the conditions attached to the
agreements or abandonment of the lease, were traced to the unstable peace and order
conditions in the countryside and the inability to control illegal encroachment
("squatting") inside the lease areas (ADB-Winrock, 1991).
•, ...-Doeumentsgathered-from,cattle.canchers_romRegions Iil, IV and X pr0vide- :-
some indications to the existence of serious problems that beset the pasture, lease sector.
Among others, the problems identified and ranked according to the order of importance
•were said to be (i) intrusion into the pasture lands by illegal occupants (squatters); (ii)
tmfavorable peace-and-order_,_tuation; (iii) lack of long term loans, high interest rates,
and stringent collateral conditions; (iv) high cost of materials for investments in pasture
lease improvements; and (v) high cost of animal health maintenance 0Ninrock
International, 1991).
A more recent object of blame has been the uncertainty of tenure brought about
by the Comprehensive Agrarian Reform Program (CARP) of 1988 (ADB-Winrock,
1991),
While the matter of security of tenure with respect to the privately-owned cattle
.ranches has been resolved by the Supreme Court in its March 1991 ruling, the same
could not be said of the status of the pasture leases. The remaining areas affecting the
livestock industry to which the CARL obtains effectivity are in the alienable and
disposable public lands under pasture leases as provided for tinder Phase Two in

7
Section 7 of RA 6657 defining the priorities for acquisition and distribution of lands
subjected to the CARP. Included in this section, among others, are all alienable and
disposable public agricultural lands, all arable public agricultural lands under agro-
forest, pasture and agricultural leases already planted to crops in accordance with
Section 6, Article III of the Constitution. The Constitution declares that the state
"shall apply the principles of agrarian reform or stewardship, whenever.applicable in accordance with the law, in the disposition or utilization of naturalresources including lands of the-public domain under lease or concession suitable foragriculture, subject to prior rights..."
The extension of the CARP to the public lands opens up to the access to pasture
and agricultural leases to farmers interested in cattle raising or agro-livestock forestry
farming.
The main objectic,a to subjecting the cattle ranches to agrarian reform is the
claim of the existence of economies of scale in cattle ranching (Abad, 1990; Alo, 1990;
and Abellada, 1988). Taiwan is said to laave exempted the cattle ranches from land
reform (Abellada and Castasus, 1989).
The intrusion of illegal occupants into the pasture lands may arise from the
inability of the DENR personnel to enforce property rights over an extremely vast area
under its jurisdiction. The Department also administers and is supposed to enforce
property rights over all forest lands, far wider in area than those covered by pasture
leases. In some areas, there are other forestry programs of the DENR with designated
areas which overlap existing pasture lease agreements. One such program cited has
been the Integrated Social Forestry Program (ISFP) for landless upland dwellers.
Where judicial cases of such conflicts drag on in the Courts, the ranchers involved

8
often prefer to liquidate their herd and give up their rights than wait for the resolutions
of the cases (Yazman, 1991).
The peace-and-order condition in the countryside, as related to pasture
operations, has often been linked with the insurgency problem. When the
ranchers are unable to cope up with the pressures, the pasture lease rights are
given up. Where the rancher decides to stay, he often is able to establish a
modus vivendl gtith the insurgents which involves somekind of "taxeS".
At the regional level, there has been at least one attempt to identify
problems and issues confronting the PLA holders, the sources of these problems,
and possible courses of action. Such was undertaken by the Federation of Cattle
Ranche_. _F_'DCAR, Co.) of Region X, in a July 1991 Ranchers Consultative
Workshop, participated in by the DENR, DAR, and other government agencies.
The Workshop results identified three major problem areas from the viewpoint
of PLA holders: (i) proliferation of illegal squatters inside the existing pasture
lease areas; (ii) uncertainty of tenure due to the CARP; and (iii) prevailing peace
and order condition in their respective localities.
Interesting to notein the Workshop proceedings was the conviction that
the problems associated poor compliance with pasture lease regulations and
production targets would naturally be resolved as long as the three major problem
areas identified were dealt with. Moreover, although problems related to credit
(insufficiency of credit extended by banks, high collateral requirements, and high
interest rates and penalty charges) were expressed, no clamor for strong

9
government measures or assistance were requested or recommended by the
pasture lease holders. This may stress the primacy of the environment of
uncertainty as a more crucial factor in the viability of the pasture leases.
II. Objectives
The study aims to describe and analyze how the pasture lease holders have been
adjusting in response to the perceivedapplicability of the provisions of the
2omprehensive.Agrarian Reform:.Trogram (CARP)--to the pasture leases.
In particular, the study aims:
I. to provide a profile of the pasture lease holdings, their locational concentration and
size distribution;
2. to describe the patterns of ir_ estments in the pasture" leases at the initial start of
operations, obtain a profile of pasture lease holders and relate general lease holder
attributes to investment behavior in the pasture leases, and to determine how the
character of investments have shifted over time;
3. determine the extent to which the pasture lease holders have undertaken investments
in pasture land improvement and improved breeding stocks, and relate these with
achieved carrying capacities and pasture livestock productivity parameters;
4. determine the pattern of labor and material resource allocation in all activities
within these pasture lease to obtain indications of shifts in relative importance of
livestock activities vis-_.-vis non-livestock (e.g. cropping) activities;

10
5. to provide a profile of the herd structure and composition of the pasture leases, their
movement over a one year period, and relate these to the production and revenue
generation potentials of the pasture leases;
6. determine current patterns of pasture lease holder investment decisions in response
to circumstances that challenge their rights over the pasture leases; in particular, the
CARP, the existence of contending claims on the pasture leases, and the experience
of peace_d-order problems in the pasttrre lease sites;
7. to determine the profitability of pasture leasing activities and relate this to the
achieved productivity parameters and patterns of resource allocation between
livestock and non-livestock activities;
8. obtain alternative measures of the magnitude of economic rents being obtaiv.e_
pasture lease holders in maintaining lease rights over the pasture; and
9. provide recommendations pertaining to access to the pasture leases which would
pave the path towards making them more productive for the interest of both the
cattle industry and beef consumers.
II
CHAPTER IIMETHODOLOGY
I. Conceptual Framework
The rationale for introducing a reform in the holding of lands ct, rrently
used as pasture leases involves both equity and efficiency grounds. From the
• distributional viewpoint, it is asked whether or not it is justified that holding
large tracts of land (in some cases extending tip to areas larger than 2,000
hectares), validated by 25 year lease rights sold by government at a rate of
P1.00 per hectare per year, be in the control of the current holders. From the
efficiency perspective, it is likewise asked whether the current lease
•arrat_gements induce a productive use of the pasture lands in terms of generating
the "_lat!,:_ly high. sustainable rates o;' retarn from them.
The pasture leases, as pasture lands, can increase in productivity only in
as far as investments in improved pastures - i.e., expansion in area devoted to
the production of improved grasses (e.g., stylosanthus, stargrass, parafrass,
etc.) - are undertaken. The pasture lands, left as natural pastures, are
constrained to their natural carrying capacities in supporting the maximum
number of cattle that can be grazed per hectare of pastureland. Investments in
improved pastures will be undertaken by leaseholders if rates of return from
higher stocking rates (per hectare) and higher livestock productivity are greater
relative to non-livestock investment alternatives.
Given the respective carrying capacities of the pasture leases, the
productivity of the pasture leasing activity would depend on the management of

12
the production processes. Productivity would vary depending on the intensity
by which the variable inputsare used over the herd and the given pasture lease
area. The relationshipbetween inputs and output are depicted in Chart I. It
has to be noted that where non-livestock activities are also undertaken in the
pasture leases, income may also be derived from them. It is to be expected that
in the activities where the higher rates of return lie, pasture lease resources
would flow towards:thatdirection. ....
The acquisition of rights to holding grazing lands through PLAs or
FLGLAs is an indication that at the time of application for rights, the pasture
leasing activity must have been attractiveenough to yield acceptablepositive net
returns. That such is possible rests partly on the rather low cost of rightsr
acquisition, pegged at PI.00 per hectare per year, among others. It is,
however, in the subsequent investmentsfor improving the pasturegrazing lands
where investment behavior may respond to the prevailing economic
environment.
Where investments in improved grazingareas are deemed attractive, the
financing of such investments come into play. At the initial investment stage,
the financial market may be utilizedto bridge the gap between current demand
for investment spending and future income. If the effective cost of borrowing,
however, is deemed to be relativelyhigh, the pasturelease holder would draw
from his own resources. In the case where own resources are also limited, the
desired magnitude of investments to be undertaken in pasture improvement

13
would not materialize. And as long as the pasture leases could still turn out
acceptable positive net returnsunder a regime of pure natural pasture grazing,
then the pasture lease would still be maintained, but with relatively low realized
carrying capacities.
The schema for relating the size of initial investments in the pasture lease
with financing from the loans marketand/or from own resources is presented in
.Chart 2_ _Ceteris _paribus,-.:the+area-granted, under+the pasture lease conti_ct
would positively be related to the absolute size of investments made.
Over time, the investments in the pasture leases are expected to grow.
From the administrative viewpoint, the non-improvement of the pasture leases -
in terms of increasing the hectarage for improved grasses and increasing the
carrying capacity of the land, among others - provides ground for cancellation
•of lease rights. Whether of not such rules are enforced, however, is +an
empirical matter. It is claimed that the unfavorable environment in the pasture
lease areas, is the main reason why pasture leases are not as productive as they
could be. In particular, the proliferation of contending claims to the pasture
leases, the uncertainties provoked by the CARP, and the unstable peace-and-
order conditions in the countryside, are claimed to have been deterring
investments that would normally have been undertaken. If such indeed were the
case, a diversion of investible resources into non-pasture activities would be
expected to be observed. As a consequence, income from these other activities
may emerge to be significant as a proportion to total leaseholder household

14
income. And as long as incomes from other sources are relatively higher, then
the pressure to make the pasture productive may, in fact, be reduced.
The relationship between the existence of an unfavorable environment in
the pasture lease areas and investments for pasture lease improvements is
depicted in Chart 3. It may, however, be difficult to distinguish the
independent effects of the three identified contributory factors to the unfavorable
environment in the pastt,re leases.
It has to be recognized, however, that decisions to defer investment in
improving the pasture leases may be traced to other reasons (economic,
financial, weather-related, etc.) than those commonly cited in the literature.
2. Analytical Framework
2.1. Sources of Data and Sampling Framework
The primary data used by the study were obtained from he pasture lease
survey enacted from February 8 to May 15, 1993. The set of pasture
leaseh01ders were obtained from the master list of the Bureau of Forest
Development (BFD) of the DENR as of 1991. The top five (5) regions in the
Philippines in terms of the number of PLAs granted and area covered were
initially considered as research areas, namely, Regions II, IV and V in Luzon,
and Regions X and XI in Mindanao. Region II was eliminated from
consideration due to relative difficulty of access. Region IV was also dropped
due to additional information from the ocular inspection and pretesting stage
that majority of the ranches in the sarnple province (Occidental Mindoro) had

15
temporarily ceased operations due to the unfavorable peace-and-order
conditions.
The provinces with the highest concentration of pasture leases in each of
the remaining regions were chosen as the study areas. These were Masbate of
Region V, Bukidnon of Region X, and South Cotabato of Region XI. Ther
'relative positions of the study sites in their respective regions with reference to
the number of pasture leases and area-covered are given in Table la.
From the chosen study sites, stratified sampling was applied. At the
provincial level, a random sampling was employed using the validated
provincial list. The structure of the sample is given in Table lb.
2.2 Method of Analysis
The major objective of the study was to establish how the pasture leases
had been adjusting to the propositions that as part of the public domain, thei
pasture leases, barring exceptions to the general rule, would be under the scope
of the Comprehensive Agrarian Reform Program (CARP). The study also
wanted to determine whether livestock production is on efficient use of the land
relative to other uses. Also, the study also aimed to establish whether or not
significant investments had been and were being made to make the pasture
leases productive. Lastly, the study attempted to establish the connection
between the economic environment induced by the CARP and the level of
investments that the pasture leaseholders wereundertaking within their lease
areas.

16
2.2.1 Efficiency of Land Use in the Pasture Leases
In essence, one measure of efficiency of the pasture leasing activity is
profitability, lneome from the pasture lease as an entity may, however, not be
limited to income from livestock activity, but from non-livestock production
activities as well The value of output from livestock activities would be
defined by revenue from sales of cattle plus the value of the change in
inventory, prieed-_at.the respective market value-of cattle •according to m_tj0r......
classification and age (or weight).
Income from non-livestock revenue would be given by the value of sales
of non livestock output, priced at the farmgate level. Total pasture lease income
'.: thus given by
5 5 5
(I) Y = X PiLi+ X Pl INVI+ E PjNji =l i =1 j =l
where
Y - total pasture lease income;Pi - farmgate price of livestock category i;Li - heads of cattle of category i sold;INV i - change in inventory of livestock category ii = 1, 2,...,5, where
1 = breeding bulls2 -- breeding cows3 = heifers4 = steers5 = calves
•Nj - quantity of output of non-livestock output jPj - price of non-livestock output jj -- 1,2, ..., 5, where
I = palay2 = corn
3 = sugarcane4 = copra5 = others

17
The significance of income from cattle production is revealed from the
ratio of livestock to non-livestock income. Similarly, the relative importance of
cattle raising as an activity would also be checked in the manner in which inputs
are allocated between cattle and non-livestock activities. Thus, the structure of
land use, allocation of material inputs, and allocation of labor inputs would give
indications on the relative importance given to livestock production.
An indicatio_ of relative importance to various activities would begiven
.the structure of variable costs. On the material inputs side, the items of
expenditures for livestock and non-livestock production are to be identified.
For cattle production, the structure o(costs would reveal whether expenditures
are geared towards simply maintaining the cattle stock or are also geared to
increasing productivity of the stock. For all activities, magnitude of
expenditures on material inputs for livestock and non-livestock operations could
be compared. A similar analysis could be done for the distribution of labor
inputs. The division of labor between livestock and non-livestock activities
would reveal the relative importance of both activities.
It may, however, be the case that joint use of inputs between livestock
and non-livestock activities would be a feature of pasture leases where function
are not specialized. In such an event, a rough estimation of the division of
material and labor inputs would be undertaken.

18
2.2.2 The Structure and Financing of initial Pasture LeaseInvestments
This section established the significance of the role of the financial
market at the initial investment stage. The proportion of the value of the initial
investments made financed through borrowing would be the indicator used to
describe the relative importance of the financial market at the initial investment
stage, The proportion of investment expenditures financed through the loans
market in the last three years would indicate the growing or declining role of the
financial market in the pasture lease business.
The structure of initial investments would indicate concentration of
investment expenditures at the initial stage of the pasture lease. The relative
impor:ar.c_ of herd build-up, of establishing an improved pasture area, of
securing the pasture lease by fencing, among others, would be revealed by the
structure of initial investments.
2.2.3 The CARP, Conlending Claims, Peace-and-Order Problemsand Subsequent lnvestmenls in the Pasture Lease
The pattern of subsequent investments in the pasture lease would provide
information on which specific investment _ategories were given importance.
The direction of change in the structure of investments would be obtained by
comparing the pattern of subsequent investments with that of initial investments.
The direction of investments may move towards herd build-up, expansion of
improved pasture areas, purchase of capital equipment, purchase of vehicles,
among others.

19
The pattern of subsequent investments are to be related with the current
productivity of the pasture lease in terms of carrying capacity, cattle production
per year, and profits from livestock production. In as much as subsequent
investments would also have bearing on non-livestock production, income from
non-livestock operations would also be related to the pattern of subsequent
investments.
The relationship between the cited factors negatively affecting
investments in the pasture lease and current investments are approached from
the viewpoint of the pasture leaseholder. The instrument determines on whether
or not, the often-cited factors (CARP, contending claims, peace-and-order
_"_+_ems) had independently or jointly made the pasture leaseholder defer
particular items of investment. In the cases where none of the cited problems
were a factor in deferring investments in the pasture lease, it is asked whether
some other factor was a major determinant in deferring some investments in the
pasture lease. Where none is identified, then the current pattern of investments,
and the subsequent productivity of the pasture lease are deemed to be governed
by the differential rates of return from all investments of the pasture
leaseholder, i.e., including those outside the pasture lease.
The existence of investment in non-pasture ventures, and the deriving of
income from the same, indicates the decision of the pasture leaseholder to
spread his assets between pasture and non-pasture undertakings. The relative
importance of the pasture leasing activity is to be obtained from the relative size

20
of investments placed in the pasture lease and the magnitude of income derived
from it compared to size of assets held in some other forms and the magnitude
of income derived from them.
In the final analysis, the gravity of the negative impacts of the often-
cited factors as deterrents to investments, has to be revealed in the preferences
of the pasture leaseholder to retain or let go off the pasture lease once the
_expiratio,,of the contcact _arrrves:_A.decision:of _ao-lo:'-.ge_"renewing tFe pasture
lease agreement is an indication that holding the pasture lease is no longer
profitable at all. This has to be reconciled with level of profits obtained formm
pasture and non-pasture operations. The preference to renew the lease
agreement after the expiration of current contrac_ t: :_;.,,_atesthat the evrrent l_a._
rates (Pl.00/ha per year), the expected net grains are positive even with the
current atmosphere created by the CARP, contending claims, and peace-and-
order problems.
Finally, the preference to renew lease agreements, even at a higher rate
of P20/ha. per year, would reveal that the economic rents currently obtained
from the pasture leases, even in an "adverse" climate described by them, are
still rather significant.
Two measures of the rental value of the pasture lease are obtained. One
is the maximum rate which the leaseholders are willing to pay for the privilege
to renew the exercise of rights over the pasture lease after expiration of the
contract. The second is the difference between the market value of the assets

21
within the pasture lease and the price at which the leaseholder is willing to sell
the ranch. The computed difference between the two is taken to be the estimate
of the size of economic rent obtainable from the pasture lease over the
remaining lifespan of the lease contract.
Finally, the level of profits obtained the pasture lease as recorded in the
observations by the ranch manager, is to be cross-checked with the reported
.intT_o,ne_fIom-.the:pasture:-lease as .zepor'__.xl:-hy_the:-:leasehoider. :Con_stent
relations are to be established between the level of farm profits from all
activities, farm income, estimates of rental value, and willingness-to-pay
various rates for the rights to return the pasture lease after expiration of
contracts.
The detailed description of the set of information to be obtained and the
relationships to be established are provided in Appendix B (Design of the
Instrument).

22
CHAPTER III
RESULTS AND DISCUSSION
I. The Pasture Lease
A. Characteristics of Pasture Lease Holders.
1. Educational background
The average pasture lease holder, in general, is rather highly educated. More
" .t,har 60 percent _i'e hol'Jers of ae_'li2g'__degree: - ;_I...e_t_in-80 percen( haVe finished at
the very least a high school education, as could be observed in Table l. Looking at
regional differences, the pasture lease holders of Masbate and Bukidnon have the
highest educational attainment, where at least 70 percent finished college. In contrast,
in South Cotabato, those with only a high school education were a little greater than
th,,sz, wb _{_'ai:w.d,_ _c_';!e_ a,._;ree. The compar_so= 6f e6_tcatit,,ia_ attainment of
leaseholders among the three locatiofis is shown in Figure 1.
2. Sizes of Pasture Leases of Leaseholders
The average size of pasture leases is 363 hectares. Among the regional
locations, South Cotabato has the highest average size at 474 hectares. Masbate and
Bukidnon are about even at 313 and 320 hectares, respectively. Pasture lease sizes
range from 50 hectares (Bukidnon) to 2,708 hectares (South Cotabato ) as shown in
Table 2.
The pattern of distribution of pasture lease area is skewed to the left, as shown
in Figure 2. Lease sizes cluster around the 100 to 300 hectare range, with 50 percent
of pasture leases falling in this.category. The distribution, however, is more skewed in
Masbate, where close to 60 percent of the leases are less than 200 hectares.
3. Start of Operations
Pasture leases have an effectivity of 25 years, renewable for another 25 years.
Around a quarter of the leases are old contracts which had been renewed. Most of the

23
pasture leases were granted in the last two decades, with 35 percent obtained in the
1980s, and around 20 percent secured in the 1970s. The distribution of the start of
operations is given in Table 3, and depicted in Figure 3. In contrast to Masbate, the
Mindanao groups have more older leases.
The pasture leases started with an average carrying capacity of 0.2 (head of
cattle per hectare), or around one head of cattle in every five (5) hectares leased. Most
of the farms (about 60 percent) started with not more than 50 heads (Table 4). As
_ould be ,:ibser_ecl i_ Figt/re 4, _he greater: con'centration of the farms which started
with 10 to 50 heads were found in Masbate, consistent with the clustering of relatively
smaller farms (less than 200 hectares) in the area.
At the initial investment phase', the loan market was not much utilized. Less
than a quarter (23 percent) of the leaseholders avail_,;! of loans to finance investments
_r t_ zst_blis!n,.en'_. _f the-l_-.:::t_:-eTM (Table 5)..'!_,¢_'e 5 shows the relative use'0f the
loan market to finance investments to star pasture lease operations. In the last three
years prior to 1992, the loan market has become even less resorted to, with only. five
(5) percent borrowing for financing pasture lease activities (Table 6).
These results were quite unexpected. The investment was not designed to
capture what lay behind the non-utilization of the financial market. External sources of
information are thus resorted to partly lend intelligibility to a rather puzzling result. In
the literature, as well as from confirmations by officials of the Development Bank of
the Philippines, pasture leases are not acceptable as collateral for loans obtainable from
the formal sector. The pasture leases being government lands, the banks cannot obtain
possession of the leases, nor the rights to them, in case the lease holder fails to repay
his loan according to the terms.
A question arises on whether the pasture leases could have continued operations
over time without the benefit of external financing in general. On this matter.
information generated from other sections of the instrument may shed more light. The

24
pasture lease holder, as would be shown in the later sections, in general, also possess
holdings of significant value (other agricultural lands, real estates) and/or are engaged
in other business enterprises. While the instrument was unable to show this, external
financing for certain operations in the pasture leasing activity could indirectly be
generated from loans obtained in the name of other agricultural or business
undertakings outside the pasture lease, with non-pasture assets used as collateral.
Where no such "detours" are resorted to, the only way the financing needs of the
pasturelease operations c6uld be met wouldbe for the leasehoiders to use income from
non-pasture agricultural and business activities for such purposes. The magnitude of
such declared incomes from other sources, as would be shown in the later sections,
indicate that such manner of financing"is not far-fetched.
The drastic decline in the use of the financial mark-_ts could also be seen from a
different perspective. As the later zeetions would show, the insignificance of more
recent investments in pasture land improvements may in fact, signify the extent to
which resources are infused into the pasture leasing activity. The ability to manage to
subsist through an extensive mode of natural pasture grazing diffuses the pressure for
need for external financing.
B. The Patterns of Investments in the Pasture Leases.
Investments in the pasture lease, valued at 1992 prices, total to around P325.1
million for all farms. In absolute terms, investments were largest in South Cotabato,
accounting for about 43 percent of the total, and least in Masbate (26 percent). This is
shown on Table 7. On the average, investments made was put at P2.2 million per
farm. On a per hectare basis, P6,180 worth of investments were infused.
At mean values per farm, the highest investment value is recorded for Masbate,
at P7.7 million. The values at the farm level do not radically diverge, as could be
observed in Figure 6. The pattern of investments more or less follow the aggregate.


26
There are, however, legal constraints with respect to the extent to which the
area leased for pasture activities may be used for other economic activities. At most,
only 10 percent of the area may be devoted to producing food crops.
Table 9 shows the distribution of land use of the pasture leases across locations.
In general, more than half of the pasture leases have remained as natural pastures. The
undeveloped portions occupy another quarter of the areas. To this classification may
be included the even less productive natural pasture areas.• . ..__. -
Note that the area devoted to food crops, posted at ar_nd two percent, does not
even approach the legal maximum allowable portion. This is rather surprising, as
would be discussed in the later sections. It is possible that the proportion devoted to
food crops may be underdeelared for reasons of demonstrating compliance with the
legal stipulations.
__n,_i_ure-_ is shcwn the re_ti_._ l;,sitions Of various land uses of the pasture.
lease. Noteworthy is the information that in the aggregate, the area devoted to
.improved pastures is extremely small - less than 10 percent of the total pasture area.
This is consistent with the information in .investments where only two percent of
investments were devoted to pasture grass establishment
B. The Ranch Manager
The day-to-day activities of the pasture lease is run by a ranch manager who, in
most cases, is hired by the leaseholder. In certain cases, the leaseholder himself is the
ranch manager. When the leaseholder decides to let his farm be run by manager,
often, a relative (close or distant) is chosen.
On the whole, around 70 percent of the farms are run by a hired manager, not
by the leaseholder himself. Forty-two (42) percent of the farms are managed by a
relative of the leaseholder, while only 26 percent of all the farms are done so by a non-
relative,

27
Across regions, the South Cotabato farms deviate from the common
management structure of the other two (Figure 11). Half of the farms are run by the
leaseholders themselves, while the rest is split evenly between a relative and non-
related managers.
Most of the ranch managers (60 percent) fall in the age range between 30 and
50 years. The ranch managers in Masbate and Bukidnon are relatively younger with
four-fifths and two-thirds of the ranch managers, respectively, falling in the 30-50 age
range. In contrast, aeound 70 percent fall within the age range beiween 50 and '70
years in South Cotabato (See Table 10).
The ranch manager, like the leaseholder, is also likely to have finished a high
•level of education, with about two-thirds of the ranch managers having finished some
kind of a college degree. The educational background of tL-_rar_ch managers across
:_gioos !. s_'3wn in Figure 12. Thus, one can say t_mt ra_,ch "_anagers are aiso a
generally highly educated group.
The monthly compensation of the ranch managers could not readily be
obtained. Two thirds of the ranch managers refused to disclose monthly compensation
(Table I1). For those declaring monthly compensation, +the mean rates were close to
each other in the Mindanao sites, placed at P4,310 and P3,567/month, respectively, in
Bukidnon and South Cotabato. Relatively high rates occur almost only in these two
locations (see Figure 13). If the Mindanao mean figures are indicative of the monthly
compensation of a ranch manager, the reported compensation in Masbate may be seen
to be grossly understated at P834/month.
Adjusting the monthly compensation by size of operations, the monthly
compensation per head of cattle managed was derived. Compensation rates are now
comparable between Masbate and South Cotabato, with Bukidnon paying the highest
monthly rates per head of cattle managed. Average monthly rates are put at P27/head
of cattle raised per month.

28
Asidefrom monthly salaries, ranch managers may also derive compensation
from stipulated share of net sales. Most managers, however, do not get a share of net
sales. Only 28 percent of them do. For those receiving such compensation, the mean
share is put at around 23 percent of net sales (Table 12).
There are regional differences in the incidence of compensation by shares. This
mode of compensation is least practiced in South Cotabato, and in cases where it is at
all practiced, the percentage share is the lowest, with a value about half th_ average.
C. The Herd Composition of the Pasture Leases.
The herd composition gives a picture of the relative importance of the categories
of the stock, either as investment or as livestock for sale. Figure 14 provides the
aggregate picture of the distribution of animal types age and sex, in the pasture lease.
The most important stock kept is the breeding cow, comprising almost half of the herd.
The heifers, the fuiure breeding cows are the next most widely held. The proportion of
calves provide an indicator of the productivity of the breeders (cows and bulls). The
steers are those expected to be normally disposed for sale in the market. Figure 1.5
shows the relative composition of the stock, by location. In general, the patterns of
composition are similar, with some deviations occurring in the proportion of breeding
bulls and steers.
On the whole, a minor net decrease of 0.4 percent in livestock was registered
over the period of one year in 1992. The sources of decrease were from significant
reduction in heifers (-26 percent) and steers (-17 percent), (Table 13 and Figure 16).
For heifers, gross reductions arise either from promotion to breeding cows or disposal
for the market. These movements were tempered by an increase in calves.
On the regional levels, the general pattern of changes in herd composition is
duplicated in Masbate (Table 14 and Figure 17), but with a greater proportional decline
in heifers and steers, and in the whole herd. In Bukidnon, a different pattern for
heifers and steers is observed, where a net increase was registered (Table 15 and Figure

30
2. Change in Stock
The average opening stock for all farms was 159 heads of cattle per lease. On
relative terms, the deviation from this figure across regions was not very great (Table
18).
In the aggregate, the rate of birth of calves is rather low at 11.3 percent per
annum. Furthermore, death/loss rate of three (3) percent reduces a net increase of onl',
8.3 percent by natural means. Infusions to the stock by new blood from the outside i_::
very insignificant at 3.8 percent. Sales Of 13.2 percent of stock plus a slaughter rate e
0.6 yields an extraction rate greater than net additions to stock. In general, the averag,:
farm ended up with a lower stock level for the next period.
Again, the contrasting performances across locations are apparent. South
Cotabato had the highest percentage of calves born at almost 18 percent of the -initial
stock, with Bukidnon following closely at about 15 percent. Fresh infusiods from ihe
outside is most significant for Bukidnon at about 7 percent of stock. Both Mindanao
provinces realized relatively high sales rates 06 - 17 percent). Bukidnon realized a 1.7
percent increase in inventory.
Almost all indicators point out to a rather poor performance by the Masbate
farms, Birth rates are lowest at 2.1 percent, negated by a death rate of equal
magnitude. The sales rate is relatively low at 7 percent of the herd. Even with an
external infusion rate of 2. I percent, the stock falls by a large 8.4 percent for the next
period.
3. Infusion of Herd with'Stock from Outside.
The introduction of livestock from external sources is designed to arrest
inbreeding, thereby, preventing decline in productivity. For the production year in
question, only 47 percent of the farms made a purchase of livestock from external
sources. Of all farms, only 21 percent made a purchase of a breeding bull, and only 17 ' -
percent made a purchase of either a breeding cow or a heifer (Table 19).

Across regions, a significant proportion of the Bukidnon farms made a purchase
of livestock from external sources. About a quarterpurchased breeding bulls, while a
fifth obtained either a breeding cow or a heifer. The lowest incidence of livestoc;,c
purchases from external sources is registered in South Cotabato. The comparative
purchasing behavior is depicted in Figure 21.
Most of the purchases for infusion of new stock into the herd is in the form c :
the breeding bull. For all purchases, breeding bulls comprised about 46 percent. Thi!:
followed by new infusion in the form of breeding cows or heifers (Table 20)i _Ti_er:i
are some regional idiosyncracies in the structure of purchases as shown in Figure 22
The South Cotabato farms appear to give premium to breeding bulls. The Masbate
farms give a high importance also to breeding cows and heifers. The Bukidnon farms,
on the other hand, also give attention to calves and steers. Although steers have no
breedir:g -.due,_ theymay be purchased for rapid fattening purposes, for resale in the
market.
The most popular breeds sought for stock improvement is definitely the
Brahman in the Mindanao farms. Most of the Masbate farms appear to have settled for
non-exotic breeds (Figure 23).
The sources of new stock appear to be most varied for the Masbate farms, being
able to obtain cattle from another ranch, via direct importation, or from the livestock
attction market (LAM). The South Cotabato farms appear to have been the most
limited in source (from another ranch). The Bukidnon rely mostly on traders for new
stock. The regional differences are depicted in Figure 24. It appears that direct
importation has been a remote possibility in Mindanao, except for an isolated case.
In all, 961 new livestock were purchased. The Bukidnon farms made the most
purchases of new livestock, accounting for more than half (56.2 percent) of total
livestock purchased (Table 21). South Cotabato made the least number of purchases.
On a per farm basis, new additions were 12 he'ads per pasture lease in Bukidnon, more


33
Cotabato, a relatively high share of calves stands out in contrast to a low share of
breeding bulls.
Most of the transactions are done at the ranch level. In almost 90 percent of the
cases, the buyer fetches livestock at the farm and shoulders transportation cost (Table
24). Thus, no significant transport expenses arehidden in the prices of cattle sold.
Average prices for various categories of livestock are shown in Table 25. On
the whole, breeding bulls are most expensive at around P19,553 per head. Next comes-. . . ,'...
the breeding Cow at an average ot' P14,364 per head. Across regi0ns, the Masbate
livestock are, in general, less expensive than the Mindanao cattle (see Figure 26). The
mature breeding bull and cow, and the full grown steer are most expensive in South
Cotabato. This may probably be tracod to the almost 100 percent Brahman breeds in
South Cotabato.
4.2 Pasture Lease Revenue from Sales
Sales of cattle obtained a total revenue of P3.38 million for the whole sample.
More than 83 percent of total revenue were generated in Mindanao, almost evenly split
between the two locations (Table 26). The average revenue per farm was P234,839.
Bukidnon and South Cotabato realized a little higher than average farm revenues from
sales. At P132,230, the average farm revenue in Masbate was way below the norm.
The sources of potentially large revenue could also be seen in Table 26 and
Figure 27. On the whole, the largest single revenue was generated by sales of breeding
cows. Second is the sales of fully matured breeding bulls. Across regions, the highest
revenue earner in Bukidnon is the fully matured breeding bull. In South Cotabato,
male calves have also been an important source.
Joining all categories of animals of all ages, the structure of revenue is
summarized in Table 27. Breeding bulls and breeding cows dominate as major sources
of revenue. Across regions, breeding bulls stand out as main revenue earner in
Bukidnon (Figure 28). Steers also stand out. In South Cotabato, breeding cows

34
outperforms breeding bulls as source of revenue.
D. Employment Generating Capacity of the Pasture Leases
1. Workload
The capacity of the pasture leases to generate employment would be measured
by the number of workers hired per unit area or the number of workers hired per uni:.
output.
The 145 pasture leases employed a total of 1,290 workersl The average farm of 363
-hectares with 152 heads of cattle employs abod, 9 Workers. O'a the average, a Worke:
is employed for every 40 hectares and 17 heads of cattle (Table 28). Across locations,
almost all workers are externally hired (96 percent), not family members,
Across regions, the Bukidnon-farms are relatively the most labor intensive,
accounting for almost half of the employment in the sample. Although the average
farm size it, Bukid-'en lies midway b._w,..:.n those of the two otKc_r locations, the
Bukidnon ranches employ twice more workers than the two others.
The Bukidnon average worker operates on an area roughly half that of the
average Masbate ranch worker, and an area less than a third of that of the average
South Cotabato ranch worker. On the basis of the number of heads of cattle per
worker, those in the South Cotabato ranches handle more than twice (27 heads) the
number worked upon by the Bukidnon ranch workers (11 heads).
The mean values may not be reflective of the ordinary pasture lease employment
behavior. A fifth of all ranches employ just a worker or two, and a large proportion
(40 percent) employs only four workers or less. A large majority (60 percent) do not
employ more than six workers (Table 29). Across regions, the South Cotabato ranches
employ the least with 30 percent of the farms employing not more than two workers;
almost half, not more than four, and 70 percent, not more than six workers.
In Figure 29, it could be observed that the Bukidnon farms generate the most
employment per farm, having the lowest cumulative percentage at lower levels of

35
e.mployment per farm. In terms of the area operated on per worker, Table 30 shows
.that about a quarter of the workers operate on an area greater than 125 hectares. Mor_:
than a third works on areas greater than 75 hectares.
Locationwise, each worker covers a relatively wider area in the South Cotabat_
farms. More than a quarter cover an effective area greater than 150 hectares. Mor_
than a third cover an area greater than 125 hectares, and, more than half of the worker_:
cover an .area larger than 75 hectares (Figure 30). As could be seen, the Bukidnor_-L,
workers have smaller effective areas to cover. ....
The workload of hired workers in terms of the number of cattle handles pe::
worker, is shown in Table 31. Almost two-thirds of the workers handle more than 1(_
heads of cattle; close to 40 percent work on more than 20 heads each, and a quarte_:
work on more than 30 each.
Acro_ _egions, a fifth of the wc_"..er.;in South Cota_ato work no more than 50 ":
heads each, and close to half handle more than 30 heads of cattle each. In contrast,
more than three-fourths of the workers in Bukidnon handle less than 21 heads of cattle
each, with a large portion (40 percent) working on about 10 or less heads of cattle each
(Figure 31).
2. Worker Functions
Of the total 1,290 workers, only about 20 percent are employed for purely
livestock-related functions (Table 32). A little more than a quarter are engaged in
mainly livestock-related fimctions but also do some other functions part of the time.
About a third of the entire workforce are employed for non-livestock elated work in the
pasture lease. Another 20 percent perform mainly non-livestock related functions.
.This relative proportion of mainly non-livestock workers is almost duplicated across the
three locations. Thus, overall, a greater majority (53 percent) of the workforce are
either purely or mainly for non-livestock matters.


37
Total cash and kind compensation for 1992 amounted to P10.27 million (Table
37). Across regions higher expenditures were made in the Mindanao locations (Figure
37)
On the average, worker cash compensation per farm amounted to P120,164 for
the year 1992 (Table 38). •Across regions, worker compensation per farm in Masbate
was only half those made in the Mindanao ranches (Figure 38).
Average compensation-in-kind for all workers amounted to P61,983 per farm,
•about half the amount of cash compensation (Table 39). In i:ontrast to the distribution
of cash compensation, the highest amount of in-kind compensation per farm was
registered in Masbate, more than five times than incurred in the Mindanao pasture
leases. For Masbate, a disproportionate amount of the compensation in-kind went to
the family workers (Figure 39).
_0 n a per worker basis, cash cgmpensation varied according to classification.
On the whole, regular hired workers and family workers received disproportionately
greater rates (almost 10 times) than contractual workers (Table 40). Locational
differences are significant. Very high compensation rates for family and regular hired
workers (greater than P20,000 per worker for 1992) were registered in South Cotabato,
while lowest rates for the same category were recorded in Masbate (Figure 40).
Compensation-in-kind per worker for 1992 was very minimal. They were
relatively significant only in Masbate, again with the family workers getting
disproportionately higher rates than non-family workers (Table 41). Contractuals
seemed to have received just tokens, not compens_,tion (Figure 41).
5. Fringe Benefits for Workers
Most of the pasture leases (65 percent) provide fringe benefits to the workers
(Table 42). Fringe benefits are mostly in the form of meals, housing, and others,
either singly or in combination. Fringebenefits, valued at P1o34, million was paid to
the workforce (Table 43 and Figure 42). On the average, the value of fringe benefits

38
"provided amounted to P18,348 per farm.
E. Stnlcture of Variable Expenditures for Ranch Operations , 1992.
The structure of expenditures on variable inputs would indicate the inputs which
the leaseholders or managers give relative importance to. TaMe 44 itemizes the
components of variable inputs and the respective expenditures into them, by location.
The list of expenditures excludes those incurred by the pasture leases for the purchase
of livestock for replacements for deaths, losses, and/or culls. A separate section and
...... - discussion for livestock purchases has been provided. ' .... ': ..........
Expenditures were classified into general categories such as: (i) pasture
improvements; (ii) livestock care; (iii) equipment and facilities repairs and
maintenance; (iv) rentals; and (v) others.
The pasture leases incurred a total of P8.99 million expenditures on variable
.inputs va!ued at 1992 prices. .Expenditures on variable inputs were.highest in:"
Bukidnon, accounting for 50.7 percent of all expenditures (Table 45).
The bulk of expenditures went into livestock care, accounting for a large 45.6
percent of total expenditures, amounting to P4.1 million. Next comes expenditures on
pasture improvement, valued at P2.54 million (28.3 percent of the total), then followed
closely by expenses on repairs and maintenance on equipment's and facilities (21.4
percent). Across regions, the rather high relative position of expenditures on livestock
care is maintained, except in Masbate, where expenditures on pasture improvement
were also comparatively significant (Figure 43).
Table 44 shows that the main expenditures on pasture improvement were on
repair and maintenance of fences, except in Bukidnon where expenditures on fertilizers
__ were relatively significant. On livestock care, the major expenditures were'on feed and
concentrates, and veterinary items. Under the heading of equipment, facilities repairs
and maintenance, expenditures of such on transport vehicles and on farm machineries

i
39
uuminate. Under rentals, machine and vehicle .rentals accounted for the bulk of
expenditures.
The summary of expenditure shares by major category of variable inputs is
shown on Table 46. On the whole, expenditures on livestock care is the most dominant
single entry, accounting for 46 percent of all expenditures. Expenditures on pasture
improvement and on repairs and maintenance of facilities come in with 28 percent and
21 percent of total expenditures, respectively. Both rentals and other expenditures have
a rather insignificant share.
Variations across regions occur on the relative share of pasture improvement
and repairs and maintenance (See Figure 44). Only in Masbate is pasture improvement
also prominent (44 percen0. For South Cotabato, repairs and maintenance costs are
relatively high at 31 percent.
The composition-of the various major expenditure categories are shown on
Table 47. On the whole, it could be observed that the bulk of expenditures under
pasture improvement were absorbed by repairs and maintenance of fences, especially in
Masbate and South Cotabato (Figure 45). Only in Bukidnon are expenditures on
fertilizers significant. Note that expenditures on planting material for grasses is
negligible.
Under expenditures on livestock care, feeding materials and veterinary items
dominate. The share of veterinary items in Masbate is rather extraordinary (Figure
46), raising the overall average share significantly. Expenditures on external
professional service is very negligible in all locations.
Across locations, expenditures on the upkeep of machineries and transport
vehicles eat up the bulk (90 percent) of expenditures on repairs and maintenance
(Figure 47). This is consistent with the observation on the pattern of investments over
time where the share of investments on farm machineries and vehicle were rather "
relatively significant. The figure also suggests that on the whole, buildings and

;facilities for pasture lease operations are of such nature that their repairs a_d
maintenance costs are very low.
F. Income from Other Activities in the Pasture Leases
Some areas within the pasture lease can, in fact, be used for some agricultur_
productive activities other than as pasturelands, where suitable. As a rule, howeve
the leasehold operators can only devote a maximum of I0 percent in the area
foodcrops, as stipulated in the contract. The declared land-use pattern in the pastu:
leases shows, however,-that the maximum allowable •seem not to have been expioited.
The main agricultural commodities where income was realized were con
palay, copra, and sugarcane. In all, close to 48 percent of the respondents were able
realize income from non-pasture activities within the pasture lease. The most prevale_
activity was corn growing, engaged upon by about 23 percent of the respondents (Tabi
48).
Across locations, the highest incidence of deriving income from other activities
within the lease was highest in Bukidnon, where about 78 percent of the farms wer:_l
able to do so. The most prevalent activity was corn production, with income realized
by 44 percent of the Bukidnon farms.
In Masbate, the incidence of deriving income from =otheractivities in the pastur,_
was around 38 percent, with palay production the more popular activity. In Sout?_
Cotabato, corn production is most resorted to.
The highest income from other activities were derived from corn. Most of tla_:._
output (87 percent) were produced in Bukidnon (Table 49).
The next most important source of other income was copra. Masbate practicall?
generated all the copra output in the sample (Table 50). On the other hands, sugarcan_
was practically produced only in Bukidnon (Table 51). Palay was produced in Masbate
and Bukidnon, with roughly similar share of the output (Table 52). Incomes from
other sources were generated in Bukidnon and South Cotabato (Table 53).

41
A total of P3,925 million was generated by the f,arms which engage in ot!_er
production activities within the pasture leases. Corn production turned at the larg_:'st
share of total income at around 46 percent (Table 54). Copra production contfibu_:d
the next-highest, with around 26 percent of total income. The relative contributions of
these non-pasture activities are shown in Figure 48.
On a per farm basis, highest absolute incomes were obtained in sugarc_ _e
production and copra production, generating P142,160 and Pl12,883 per far_,
respectively. The weighted mean of"incomes from other activities in the pasture le_
was P56,882 per farm in 1992.
iII Pasture Lease Holders Perceptions on CARP and the Pasture Leases.
A. Wealth Holdings and Sources of Income
A.1 Wealth Holdings
The pasture lease holders, in general, own other assets of significance.
More than .80 percent own a residential house and lot, and close to 70 percent own at
least a parcel of agricultural land. A third own assets in a business enterprise, and
about a quarter own son': real estate property (Fable 55). On Figure 49, the
ownership of non-pasture assets have an almost similar structure across locations, with
the Masbate leaseholders mostly holding the first three types of"assets.
The average value of assets held by households by each type of non-pasture
asset is shown in Figure 50. The highest average value were those related to real
estate property. Second are those related to the business enterprises of the
average leaseholder. The locational variations in wealth holdings is also very
noticeable. In almost all types of assets outside the lease, the holdings of the
average South Cotabato leaseholder are significantly higher in value than the
rest. Furthermore, the valt,e of wealtholdings of the average Masbate leascholder poles
".ncomparison to the other two.

42
A.I.1 Agricultural Land
The total value of agricultural land holdings amounted to P122.4 million,
most of which were held by the Mindanao pasture lease holders, accounting for
about 83 percent of the total, almost evenly distributed between Bukidnon and
South Cotabato.(Table 56). The mean value of agricultural land holdings is about
P1.9 million per lease holder. The South Cotabato leaseholders have the highest
average.value at about P2.0 million, followed by those of Bukidnon with about
PI.5 million,:both higher than the average. Figure 51 gives the average size_ _0f the ....
value of agricultural wealth holdings, by location.t
The distribution of wealth from agricultural land across locations is shown on
Figure 52. The distribution is. highly skewed to the left, with 66 percent of
leaseholders owning a value not greater than P510,000-worth of agricultural land.
•South Cotabato, however, has almost a third of its !easeholders owning large
•properties between P500,000 and a million pesos.
A.I.2 Business Enterprises
The value of assets in business enterprises of the leaseholders amounted to
P101.4 million, at 1992 market prices. Most of these were held by the South
Cotabato leaseholders, accounting for three-fourths of the whole wealth (Table 57).
On a per leaseholder basis, the average wealth in business enterprises was P2.3
million. Across locations, the South Cotabato leaseholders had an average value of
P4.8 million, dwarfing those of leaseholders in the other two locations (Figure 53).
,The distribution of business wealth holdings vary across locations, being most
skewed to the left in Masbate and most evenly distributed in South Cotabato (Figure
54).

43
A.I.3 Real Estate Property
Total wealtholdings in the real estate property had a total of P128.5
million. Most of the amount (71 percent) was again held by the South Cotabato
leaseholders (Table 58). On the average, the value per leaseholder was about P3.8
million. Leaseholders in South Cotabato held an average of P5.7 million worth or real
estate property. (For comparisons, Figure 55 is presented).
The distribution of wealth holdings in real estate property is highly skewed to
the left, with the South C'otabat0leaseholders as the sole ones holding business assets
greater than P7.5 million (Figure 56).
A.1.4 Residential Property
The total value of assets An residential properties is about P88.5 million
(Table 59). The wealth in terms of residential properties, this time, more or less
evenly distributed among the locations. On the average, residential property per
leaseholder was valued at P797,015. Again, the average value of holdings of this
form of asset was higher in South Cotabato (Figure 57). •P
The distribution according to value of wealtholdings reveals some bi-
modalities (Figure 58).
A.I.5 Total Value of Weallh Holdings
The total value of non-pasture wealth holdings of the ieaseholders
amounted to P457.7 million (Table 60). A huge proportion of this wealth (88.5
'percent) was held in the Mindanao, with more than half (55 percent) of this wealth
was held by the South Cotabato pasture leaseholders The proportion held in
Masbate amounted to only P I !.5 percent of the total.
The non-pasture wealth holding of the average leaseholder was about P3.5
million. The South Cotabato leaseholders had a significantly higher average value of
wealth at P6.3 million (Figure 59). Figure 60 shows the distribution of non-
pasture wealth within and across locations. The distribution is most skewed to the

44
:left in Masbate. In contrast, wealth is relatively more evenly distributed among
South Cotabato pasture lease holders.
A.2 Sources of Household Income, 1992
Aside from deriving income from the pasture lease, two other sources of income
are important to a significant proportion of the leaseholders. Close to two-thirds of the
leaseholders derive income also from their business enterprises. In addition, more than
half derive income from wages and salaries (Table 6l). Locational differences exist.
While more deriveincome from business enterprises in South Cotabato and Bukidnon;
extra income derived from wages and salaries is relatively more widespread in Masbate
(Figure 61. The structure and sizes of incomes from other sources, for the average
household, vary among locations as shown in Figure 62. At once, the incomes of the
South Cotabato leaseholders from all sources stand out.
_.2.1 Income from the Pasture Lease
For 1992, total income accruing to the leases' households amounted to
P30.5 million (Table 62). Almost 80 percent of this income was generated in the
Mindanao pasture leases, with 42 percent made in South Cotabato.
Mean pasture lease incomes were computed to amount to about P254,000 per
lessee household. The Mindanao households had mean pasture lease incomes above
this average (Figure 63).
The distribution of pasture lease income shows that a large portion (40
percent) generated incomes not more than P50,000 in 1992. Majority had incomes not
more than P100,000 (Figure 64). Incomes were more skewed to the left in
Masbate. Relative to Masbate, the more Mindanao leaseholders were able to
obtain pasture lease incomes at or above the overall average.
A.2.2 Income from Business Enterprises, 1992.
Total income of lease households from their bt,siness enterprises for 1992
amounted to P49.7 million (Table 63). Most of this amount were generated by the

:South Cotabato pasture lease holders, accounting for 71 percent of the business
income.
Mean household income from business enterprises was put at about
P534,000. The average South Cotabato leaseholders had about twice this amount at
PI.04 million (Figure 65). On the other hand, the Masbate leaseholders
generated business incomes 10 times smaller.
The distribution of business income is also skewed to the left, with
two-thirds of the respondents-eai'ning not more_harfP200;000 in business income. The
distribution is even more skewed in Masbate where close to 80 percent did not earn
more than P100,000 in 1992. Again, it is in South Cotabato where the
distribution is not so skewed, with a significant portion of the respondents (18
percent) earning more than PI million in 1992 from their business.
A:2.3 Salaries and Wag_
Total salary and wage income of the households amounted to P10.1 million in
1992. It is only in the salaries and wages as source of income that the Masbate
pasture lease households obtain an advantage over their Mindanao counterparts,
obtaining 46 percent of incomes from this source (Table 64). Computed
mean income over reporting households reveal, however, that the advantage did
not necessarily hold on the average household level, where the Masbate mean income
from this source was still slightly below the overall mean to P130,000 per
household in 1992 (Figure 66). The distribution of income from salaries and
wages in Figure 67 is shown to be more or less evenly distributed, for all locations.
A.2.4 Various Other Sources of Income
There were a few respondents who still had some sources of income other than
those cited. Most of this income (90 percent) was generated in South Cotabato.
Total income from these other sources was P2.7 million (Table 65).

46
A.2.5 Income from all Sources
Total reported income of the pasture lease households from all sources
amounted to P92.9 million for 1992. Most of this income (58 percent) accrued -to the
South Cotabato pasture lease holders. On the other hand, the share of the Masbate
pasture lease households was only 14 percent.
The average household income was about P664,000 (Table 66). The
average. household income of the lessee households in South Cotabato was about
_,vjce this .figure at P1.25 million (Figure 68).
Figure 69 shows contrasting distribution from income from all sources
among the three locations. Masbate has the most skewed distribution, and South
Cotabato the lease. Bukidnon follows the average pattern.
The relative importance of the various sources of income, according to the
magnitude of total income generated, is shown in Table 67.
On the whole, income from business enterprises dominated all other
sources, accounting for more than half (53 percent) of total incomes generated.i
Income from the pasture lease was just one-third of total incomes.
Locational differences exists in terms of relative importance of various
"sources of income for the lessee households. As could be observed in Figure 60,
pasture lease income is most important in Masbate, and still relatively important in
Bukidnon, where it is almost at far with business income. For Masbate,
pasture lease incomes are supplemented mainly by wages and salaries. In South
Cotabato, income from business enterprises towers above all other sources,
including the pasture lease.
B. Contending Claims and Peace & Order Problems in the Pasture Leases and
Lessee Investment Decisions
The floating of ideas suggesting the pasture leases to be "CARPable" has been
said to have encouraged other interested parties to stake their own claims on portions of


48
any of the often-cited problems above, with the highest incidence of deferment in South
• Cotabato, placed at 36 percent ,(Figure 74).
The deferment of investments were also checked for other reasons (e.g.
weather, financial constraints, etc.) but the incidence for such was significant only for
South Cotabato,-with a quarter of the respondents deciding not to invest due to
prolonged conditions• of drought.
The activities where the incidence of deferment were rather significant were
:-investment in breeding cows(32 pereen0 and in pasture improvement (25 percent), as
seen in Table 69. A more detailed inspection regional variations reveals that the
incidence of deferred investments in breeding cows was most acute in South Cotabato
(52 percent), as shown in Table 70.- Total declared value of deferred investment in
breeding cows put at P43.2 million. On a per lease basis, the value is around
P.940,000. In absolute magnitudes, the defe_ed investments in number of heads of
breeding cows corresponding to the deferred investments were highest in South•
Cotabato. Computed, however, at investment values per hectare, the deferred
investments do not diverge very much among locations, with an overall average of
deferred investments around P2,800 per hectare.
For declared investments in improved pasture, the relative area coverage was
highest for South Cotabato, put at 41 percent of leased area (Table 71). In absolute
-terms, as well as per hectare equivalents, the value of deferred investments were lowest
in South Cotabato. In the aggregate, the value of deferred investments in improved
pastures is just around P280,000. This just redounds to P240 per hectare, and an
average of P7,000 per lease.
The value of deferred investments in breeding bulls are rather similar across
regions, with an average value of P117,000 per lease, and about P372 per hectare of
land occupied Total value of deferred investments in breeding bulls was put at P3.4
million ('Fable 72).

49
The report on deferred investments in herd expansion seem to point out to rather
ambitious plans beyond the current capacity of the pasture lands, tn all, herds were to
have expanded by 50 percent, or an additional 0.78 animals per hectare, in addition to
current carrying capacity, at least for those leaseholders reporting. Total value of
deferred investment in herd expansion was put at P47.7 million, averaged at P1.8
million per reporting farm, or about P5,875 per hectare (Table 73).
For investments in fencing, the inclusion of an additional 10 percent of the area
of pasture leases=seems to be realistic targets. Total projected value is about P3.9
million, computed at P177,000 per farm, and P602 per hectare (Table 74).
The projected value of investment in equipment is also large at P8.8 million
(Table 75). This redounds to about P550,000 per lease, or PI,824 per hectare.
In summary, the declared value of deferred investments totaled to about P107
million. For pasture leases, reporting, the investment value per lease is about P3.6
million. On a per hectare basis, the figure is put at around Pl 1,700 per ha.
C. Expenditures on Pasture Lease Security
The security occurrence of expenditures for pasture lease security purposes may
be indicative of the necessity to privately enforce property rights over the pasture lease
against parties who try to challenge it by encroachment, or against parties who operate
outside the law (e.g. cattle rustlers, insurgents). The magnitude of expenditure may be
indicative of thegravity of the problem. Table 76 show the incidence of capital outlay
by farms on items used for security purposes of the pasture lease. Over 70 percent of
all the farms provided expenditures on any significant item for farm security. About
two-thirds of the farms incurred expenditures on horses and 29 percent on vehicles for
making rounds over the pasture lease area. One third made expenditures on guns,
ammunitions, and a fifth incurred expenditures on two-way radios.
Across locations, the farms in Bukidnon registered the highest incidence of
expenditures for farm security purposes, involving 84 percent of the farms. The

5O
Bukidnon farms also registered the highest incidenceof"expenditt,res on each of' the
•security expenditure items .(Figure 75).
Total outlay on farm security is significant at P16.16 million (Table 77) The
Bukidnon farms incurred the highest expenditures (P8.16 million), accounting for
roughly half of total expenditures. A third was accounted for by the South Cotabato
farms, the sizes of the exPenditure items are shown on Figure 76.
The major expenditure items were on patrol vehicles, at P9.6 million; on
horses, at P3.6 million; and guns and ammunitions, at PI.92 million.
On the average, capital outlay for security purposes amounted to P158,402 per
farm. The Bukidnon farms registered the highest average expenditures at P214,667
(Table 78).
D. Willingness to Renew Pasture Lease Contracts after Expiration.
1. Willingness to Pay Rental Rate.
Despite the many documented reports about the closing down of pasture leases
due to unstable peace and order conditions in the pasture lease areas, almost all of the
leaseholders (around 95 percent), have the intention of holding on to their lease
holdings, and renewing their contracts after the year of expiration. In fact, none in
Masbate, is willing to let go of their respective areas at the current rates of P 1.00 per
hectare per year (Table 79).
A figure of P20 per hectare per year has, in recent years, been floated around as
the new proposed rate for renewal of pasture lease contracts. The new rates have not
yet been imposed. "At such rates, more than 80 percent of the leaseholders would still
be willing to renew their contracts. Masbate, again, leads with more than 90 percent• of
holders willing to renew contracts at P20/ha. per year (Table 80 and Figure 77).
For those willing-to-pay at least P20 per hectare per year, the maximum rates
they were willing to pay for the privilege of renewing their contracts after expiration
were tested. The results may have been influenced by the starting value of P20. Table

51
:81 shows the cumulative percentage of the distribution of willingness-to-pay at various
rates.
On the average, only 28 percent remained to be willing _o pay at least
P30/ha./year. With a minimum of P50/ha./year rental rates, there are still about 20
percent willing to renew their pasture leases at those rates. Across regional locations, it
•appears that the Bukidnon leaseholders are willing to pay higher rates. The least
willing are those from Masbate.
• ..... 2. Value of Ranch
2.1 Value of Assets Within the Pasture Lease
On the average, the value of assets invested in the farm, excluding lease rights,
is put at around P2.25 million per farm, in 1992 prices. The distribution is skewed to
the left, with two-thirds of the leases having asset values not more than P2 million
(Table 82). Consistent with the prev_ence of relatively smaller lease sizes in Masbate,
close to 60 percent of the leases have asset value of not more than P1 million (Figure
78). In contrast, half of the leases in South Cotabato have asset values ranging from
PI - 3 million.
2.2. Estimated market value of the pasture lease.
The estimated market value of the lease does not only include the value of assets
invested within the ranch but also the perceived value of the lease in its capacity of
generating a stream of future incomes. Consistent with skewness of the distribution of
lease sizes, most (56 percent) of the leases have a market value of not more than P3
million. In fact, more than 40 percent would have market value not greater than P2
million (Table 83).
There are noticeable regional differences, with Masbate ranches clustering about
the P2 million-or-less mark (56 percent), and the South Cotabato ranches bundled
around the PI - P3 million or less figure (66 percent).

52
2.3. Estimated Value of Lease Rights
The divergence between the market value of the pasture lease and value of
assets infused can be taken to indicate value of the rights to the lease from the
viewpoint of the leaseholder. The lease rights for most (64 percent) of the leaseholders
is put at a value no exceeding P1 million. Close to 40 percent would have rights values
_ot greater than P500,000 (Table 84). The distribution is also skewed to the left
iFigure79).
2.4. Assets,:Market and Rights Values:- per hectare basis.
On a per hectare basis, the value of assets cluster about the range of P2,000 -
P6,000 per hectare (Table 85). At the regional level, this pattern is observed in
Masbate and South Cotabato. For ]3ukidnon, the clustering is about the figure not
exceeding than P4,000 per hectare (Table 85).
Market values per hectare moves.the distribution to ,:;e 6ght, relat_.ve-to that of-
asset values. On the whole, market values greater than PI0,000 per hectare increase to
44 percent, compared to only about a quarter of the pasture leases, evaluated at asset
values (Table 86 and Figure 80). The pattern is repeated on the regional levels
(Figures 81, 82 and 83).
On a per hectare basis, the Bukidnon ranches emerge to be the most investment-
.intensive, with close to PI0,000 per hectare worth of investments. The farms in the
two other regions lag far behind. On the average, the value of assets is P6,347 per
hectare.
Rights value, evaluated on a per hectare basis was put at an average of P6,576
per hectare. This may be an indication of the present value of lease rights, excluding
the value of assets (Table 87). Comparing rights values across regions, the Bukidnon
farms registered the highest average, placed at P7,568 per hectare.

53
The distribution of the value of lease rights per hectare is skewed to the left, -but
there is a more dispersed distribution as rights values go beyond the Pl0,.000 per
hectare mark _Figure 84).
The rental value of the pasture lease may be obtained by evaluating the rights
value per hectare, over the remaining duration of the lease until its expiration date.
A straightforward averaging of the values yields the following results: the rights
value per hectare per year is about PS00/ha. per year. This value may be taken to
indicate that if this reflects the average net present value Of the rents obtainable per
year, then this must be, on the average the maximum "willingness-to-pay" for the
pasture lease holder to retain the lease after expiration date.
The highest registered average rights value per hectare per year is in Bukidnon,
place d at P966/ha per year. This result is consistent with the previous result that the
Bukidnon leaseho_,Jers had the relatively higher "willingness-to-pay" values in terms Of -
maximum rental fees to retain rights over the lease after expiration.
The results, however, are reversed for Masbate and South Cotabato. While the
Masbate leaseholders were the least willing to pay rental rates higher than P20/ha. per
year, they registered rights values rather close to that of Bukidnon, somewhat around
P900/ha. per year. South Cotabato yield a relatively low figure at about P510/ha. per
.year. Nonetheless, even this figure is high, relative to the highest rental fees willingly
offered for retention of lease rights.
The distribution of lease rights values per hectare per year is shown on Figure
85. In the aggregate, there is a skewed distribution of values off lease rights. A little
more than half (57 percent) of the respondents have lease rights values/ha, per year
between the P300/ha./year mark (Table 88). After the P400/ha/yr level, distribution
becomes very widely dispersed.

54
E. Leaseholder Perceptions about the Comprehensive Agrarian Reform Program.
By either indicator of the existence of economic rents in the pasture leases, i.e.
by willingness-to-pay rental rates or by present value of lease rights, there is sufficient
ground to state that there are significant interests to protect in the pasture leases over
and above the value of physical investments incurred and designed for the duration of
the leases.
The potential inclusion of the pasture leases in the CARP would in effect,
a'cduce the absolute sizes of economic rents to that to be obtainable from pasture lease
whose ceilings are to be stipulated by law. From the private interest viewpoint, the
extension of the CARP into the pasture lease would understandably be opposed by the
current leaseholders, except, of course, by those whose business have become non-
viable.
There are diverging perceptions about the inclusion of pasture leases in the
CARP. While on the average, 60 percent of the leaseholders are certain that the
pasture leases are not included in the Program, only nine percent of the leaseholders ini
South Cotabato have that conviction (Figure 86). The leaseholders of Masbate appear
robe the most unperturbed about the CARP. In Bukidnon and South Cotabato, the
level of uncertainty is put at about a quarter of the pasture lease holders.
All leaseholder comments on the effect of CARP on the pasture leases were
negative. Consistent with the higher degree of uncertainty in Bukidnon and South
Cotabato, a greater portion of the negative comments were obtained from them.
Observing Figure 87, a third of the leaseholders in Bukidnon perceive the CARP as
discouraging to investments and improvements in the pasture leases. On the other
hand, a quarter of the leaseholders in Sot, th Cotabato consider the CARP to be
destructive to the cattle industry and would cause a reduction in tile cattle population.
Furthermore, about a quarter of the leaseholders of Bukidnon and a fifth of those in "
South Cotabato consider the pasture lease areas as t,nsuitable for crop production

55
:activities-(by implication, subjecting them to CARP would make little sense).
[II. Profitability Of The Pasture Leases
A straightforward computation of the profits of the pasture leases reveals that in
all locations, the_pasture leases were on the average incurring substantial losses from
pure livestock operations. The magnitude of revenues from livestock sales contrasted
to the structure off costs of pasture lease operations as shown on Table 89. Reported
operating expenditures in all locations were substantially higher than revenues trom
cattle sales. Total losses from livestock operations run to P4.3 million in Masbate up
to P7.2 million in South Cotabato.
Livestock revenue, however, _as not the sole constitution of farm revenue by
the pasture lease holders as income was also generated from non-livestock activities
within the pasture Jeases. Focusing on revenue from cropping activities within the
farm (mainly corn, palay, sugarcane and coconut), it could be noted from row D1 of
Table 89 that in two locations, revenue from non-livestock operations surpassedt
reported income from livestock operations to an extremely significant degree. In
Masbate, non-livestock revenues was totaled 1'2.5 million as compared to P566,625
from livestock sales. In Bukidnon, non-livestock revenue reached P10.2 million
compared to P1.45 million from livestock operations. In Bukidnon, income from
cropping activities within the pasture leases was able to reverse the profitability position
'of the pasture leases in this location, registering a total profit of P3 million for 1992, or
an average profit of P66,657 per farm in 1992.
In Masbate, the extent of reported losses was greatly reduced. The same holds
true in the aggregate. Taking all locations, reported losses fall from P15.9 million to
just P29 million, or an average loss of P19,712 per farm, or an insignificant P0.37 loss
per hectare.
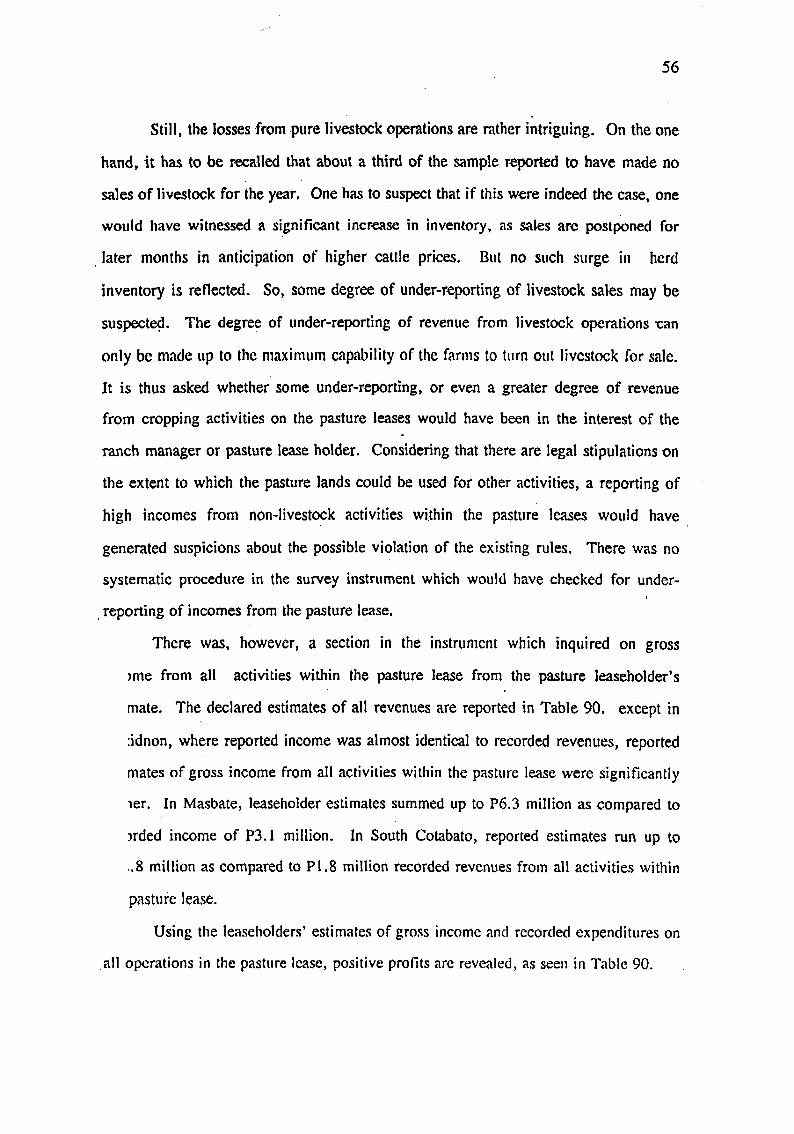
.."
56
Still, the losses frompure livestock operationsare rather intriguing. On the one
hand, it has to be recalled that about a third of the sample reported to have made no
sales of livestock for the year. One has to suspect that if this were indeed the case, one
would have witnessed a significant increase in inventory, as sales are postponed for
later months in anticipation of higher cattle prices. But no such surge in herd
inventory is reflected. So, some degree of under-reportingof livestock sales may be
suspecte.d. The degree of under-reporting of revenue from livestock operations lean
only be made up to the maximum capability of the farms to turn out livestock for sale.
It is thus asked whether some under-reporting, or even a greater degree of revenue
from cropping activities on the pasture leases would have been in the interest of the
ranch manager or pasture lease holder. Considering that there are legal stipulations on
the extent to which the pasture lands could be used for other activities, a reporting of
high incomes from non-livestock activities within the pasture leases would have
generated suspicions about the possible violation of the existing rules. There was no
systematic procedure in the survey instrument which would have checked for under-
.reporting of incomes from the pasture lease.
There was, however, a section in the instrument which inquired on gross
_me from all activities within the pasture lease from the pasture leaseholder's
mate. The declared estimates of all revenues are reported in Table 90. except in
:idnon, where reported income was almost identical to recorded revenues, reported
mates of gross income from all activities within the pasture lease were significantly
aer. In Masbate, leaseholder estimates summed up to P6.3 million as compared to
_rded income of P3.1 million. In South Cotabato, reported estimates run up to
;.8 million as compared to P1.8 million recorded revenues from all activities within
pasture lease.
Using the leaseholders' estimates of gross income and recorded expenditures on
all operations in the pasture lease, positive profits are revealed, as seen in Table 90.

57
In Masbate, estimated profits are placed at P1.4 million, with an average of
I'25.7 thousand per farm. In Bukidnon, the level is estimated at P2.7 million, with a
mean of 1:'49thousand per farm. Finally, for South Cotabato, estimated profits sum up
to P7 million, with a average of P125 thousand per farm.
In the aggregate, the estimated profit from the pasture leases is put at around
PI 1.2 million, with an average of P77,233 per farm.
CHAPTER IV
SUMMARY, CONCLUSIONS AND RECOMMENDATIONS
1. Profile of Pasture Lease Holdings
Pasture leases are, on the average, relatively large tracts of land, with a
mean area of about 360 hectares. The distribution of leases are, however, skewed,
with about 60 percent of the pasture leases smaller than 200 hectares in size. There
exists large leases ranging from 1,000 to 2,700 hectares. The larger-sized pasture
leases are mostly found in Mindanao, particularly South Cotabato. The smaller sized
leases mostly proliferate in Masbate, LUzon.
Lease contracts are effective for 25 years, renewable for another 25 years.
Most of the current leases in existence were those granted in the last two decades,
although about a quarter were very old pasture leases which had been constantly
renewed.
2. The Structure of Initial Investments, Pasture Lease Holder Attributes,
Financing of Investments, and the Character or Investment Shifts Over"Time
Initial investments in the pasture leases at the start of operations had rather
been disproportionately placed in the purchase of livestock (more than 80 percent).
The rest were minor expenditures on fencing the area, then developing some areas for
improved pastures. On the whole, the average farm started with about 70 heads of

58
cattle, utilizing about 5 hectares per head of-cattle, or about a starting carrying
capacity figure of about 0.20, unadjusted for cattle class group. Distributionwise,
about 60 percent held below 50 heads. _
Formal loans market almost did not directly play a part at all in the finance of
initial investments in the pasture leases, and even declined in incidence of use during
the operational phase. In part, this was because pasture leases are not eligible as
collateral for formal loans. The pasture leaseholders do not constitute the average
"farmer". He is highly schooled, owns various assets as agricultural land, business
enterprises, real estate property, and residential properties; repositories of wealth of
even greater value than the assets sunk in the pasture leases. Substantially higher
incomes also are earned from them than from the pasture lease activities.
That the loans market had little direct role in the finance of the initial
investments and almost none in the operating phase of the pasture leasing activity may
be understood in the light of the activity indirectly being financed from substantial
income from and/or ability to obtain loans for other business activities.
Over time, the pattern of investments in the pasture lease, for those with
recorded investments, deviated from the initial structure. The relative importance of
.the acquisition of livestock declined to just a third of subsequent investments.
Increasing rapidly were the investments in vehicle and large tractors (and implements),
until these two categories combined to about 40 percent of total investments.
For the establishment and expansion of areas for cultivating improved grass
species, the investment in large O-wheel) tractors would be understandable. Vehicles
(trucks and other utility vehicles) would normally be used for transporting animals.
The phenomenon, however, that over time, the area developed for improved pasture
grasses remained stagnant at only about I0 percent of total leased area, makes the
placing of heavy investments in large tractor implements rather puzzling.

59
Such behavior would have been a little better understood had it been generally
acknowledged that significant areas within the pasture lease were declared to be
cultivated for non-pasture activities. The land area declared to be in-use for food and
other crops, however, was extremely miniscule as a percentage for the .total area. On
the other hand, it was determined that in the disposal of marketable cattle, the livestock
was in general fetched by the buyer and shouldered-transport costs.
It was pointed out, however, that there were strong indications that there are
other significant non-livestock production activities taking place within the pasture
lease, not declared in survey instrument, for which large tractors, trucks, and other
utility vehicles would be rational to use. These indicators include (i) the
acknowledgment that half of the workforce have either nothing to do, or relatively little
to do, with livestock production; and (ii) the earning of a relatively substantial amount
of pasture lease income from non-livestock production activities.
3. The extent of Investments in Liv_toek Productivity Enhancement
The derived average stocking showed some improvement from the initial
investment phase carrying capacity of the pasture lease, from 0.20 to 0.45 heads per
hectare. The distribution, however, revealed that in fact, the larger majority had
realized carrying capacities lower than the mean (about 60 percent), after an average
period of 15 years.
A stipulation in every lease contact provides that within five (5) years after the
start of the operation, the farm must be able to reach a carrying capacity of at least
1.0 (1 head/ha.). The inability to improve stocking rates beyond the current levels can
thus, be traced to insignificant amounts of investment devoted to the expansion of areas
for improved pasture grass production, among others.
Improving the starting levels of the productivity of the stock also requires that
the breeding stock be genetically improved. This could be done by either purchasing
improved breeds of cows and bulls, or exotic breeds of bulls could be rented for mating

60
with the breeding cows. Since no signif'w.ant figures were obtained for expenditure on
mating services by breeding bulls, the remaining resource for improving the stock
would have been through the purchase of improved breeding stock. .
The incidence of the purchase of new breeding stock, however, was shown to
be very minimal, with only about 20 percent of the farms doing so. And among these,
only the Masbate farms had some access to acquiring some fresh breeding stock via
imports.
The relatively low incidence of purchase of breeding stock from the outside
reveals that the pasture leases do not, in general, undertake the specialized function of
cattle breeding, for which the use of large tracts of land would have been justified.
Cattle raising and/or production (as opposed to breeding) thrives even in small and
medium scale operations, using significantly smaller tracts of land.
4. Management, Labor and Material Resource Use
The pasture lease, in a certain sense, is labeled as an "extended family" of a
"clan" enterprise. Almost a third of the pasture leases are directly managed by thei
pasture leaseholder himself, and close' to half is managed by a relative of the
leaseholder. In all, about three-fourths of the pasture leases are managed by somebody
inside the extended family.
The ranch manager, like the ieaseholders, are also mostly highly schooled.
Most of the ranch managers were highly secretive about the amount of compensation
they receive as ranch managers. For the few declaring the value of their compensation,
the declared values are considered to be within the lower range of the time distribution.
Cattle production in the pasture lease, as currently managed, was found to be
definitely not a labor intensive activity. Even the employment indicators at the mean,
already in themselves not labor intensive - nine (9) worker per farm; an effective area
of 40 hectares to a worker; or 17 heads of cattle to a worker - are rather deceptive.
Distributionwise, a large majority of the farms employ no more than 6 workers.
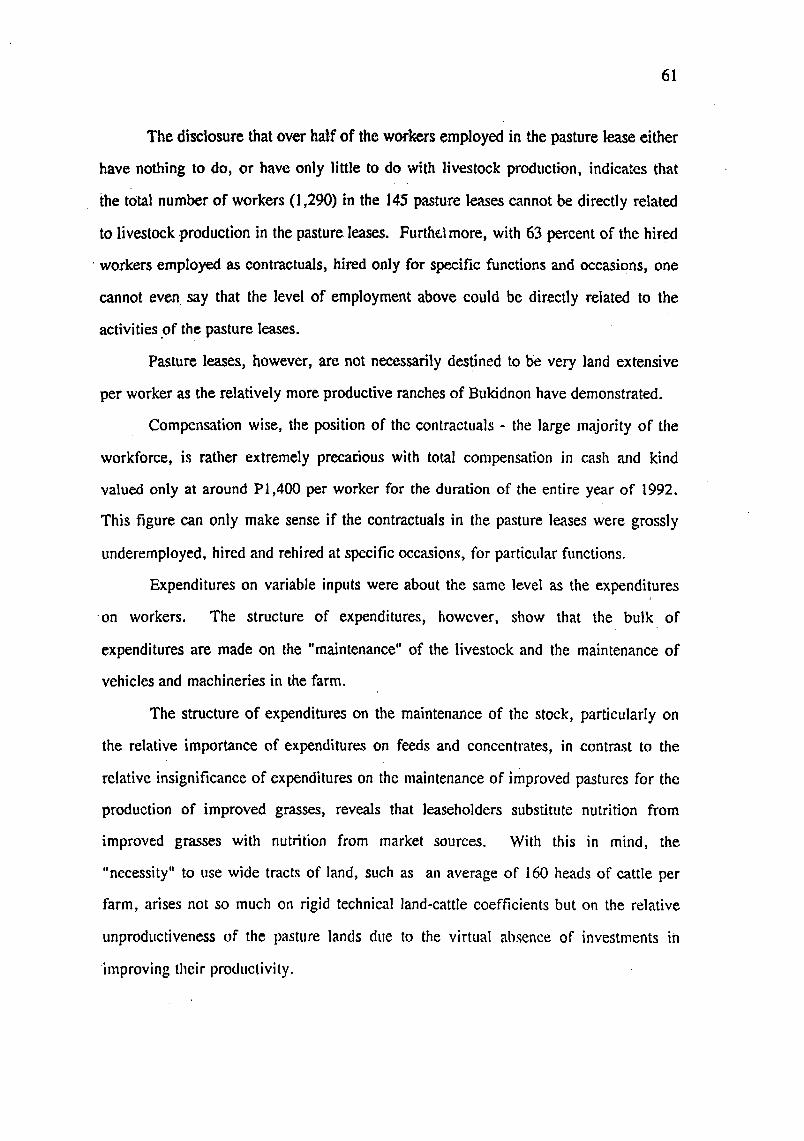
61
The disclosure that over half of the workers employed in the pasture lease either
have nothing to do, or have only little to do with livestock production, indicates that
the total number of workers (1,290) in the 145 pasture leases cannot be directly related
to livestock production in the pasture leases. Furth¢.lmore, with 63 percent of the hired
'workers employed as eontractuals, hired only for specific functions and occasions, one
cannot even say that the level of employment above could be directly related to the
activities of the pasture leases.
Pasture leases, however, are not necessarily destined to be very land extensive
per worker as the relatively more productive ranches of Bukidnon have demonstrated.
Compensation wise, the position of the contractuals - the large majority of the
workforce, is rather extremely precarious with total compensation in cash and kind
valued only at around PI,400 per worker for the duration of the entire year of 1992.
This figure can only make sense if the contractuals in the pasture leases were grossly
underemployed, hired and rehired at specific occasions, for particular functions.
Expenditures on variable inputs were about the same level as the expenditures1
•on workers. The structure of expenditures, however, show that the bulk of
expenditures are made on the "maintenance" of the livestock and the maintenance of
vehicles and machineries in the farm.
The structure of expenditures on the maintenance of the stock, particularly on
the relative importance of expenditures on feeds and concentrates, in contrast to the
relative insignificance of expenditures on the maintenance of improved pastures for the
production of improved grasses, reveals that leaseholders substitute nutrition from
improved grasses with nutrition from market sources. With this in mind, the
"necessity" to use wide tracts of land, such as an average of 160 heads of cattle per
farm, arises not so much on rigid technical land-cattle coefficients but on the relative
unproductiveness of the pasture lands due to the virtual absence of investments in
i mprovi ng their prod uctivity.

The relatively large share of repair and maintenance of vehicles and machineries
is seen as a natural offshoot of the relatively rapid growth investments of the same in
proportion to other investment alternatives in the farm.
5. Herd Composition, Produetlvity and Livestock Revenue Streams
The incidence of the absence of sales of livestock for the year, put at about one
third of the pasture leases, is rather high. This phenomenon would have been
intelligib!e had it been the ease that a significant' increase in livestock inventory
occurred over end of the one-year period. But with the occurrence of a decline in total
inventory of around four percent, the foregoing of positive revenue by a third of farms
becomes puzzling. The only conclusions that could be made are either (i) no activity
was taking place in faet; (ii) the leaseholder was just maintaining a token stock of
•cattle; (iii) a gross underreporting and/or unreporting of sales was being practiced; or
(iv) the phenomenon is a fact, but the pasture leases are being used for other more
productive activities, but not captured by the instrument.
The rate of sales of livestock in proportion to the opening of stock is directly
related to the rate of birth of calve. The birth rate was put at around 11 percent while
the sales rate was about 13 percent of the opening stock. This birth rate was an
offshoot of a calving rate of around 30 percent, i.e., only 30 percent of the breeding
cows were able to deliver a calf over the one-year period. On technical efficiency
grounds, one should expect not less than two-thirds of the breeding cows to be giving a
calf at any given year. Thus, even in the function providing cattle for the market, the
pasture leases, it appears, had not exactly been very productive.
While the bulk of sales in terms of number of heads sold were a little more less
proportional to the ratio of each cattle class to entire stock, the main revenue earners
were the breeding bulls and breeding cows. This follows more from the fact that these
classes commanded the highest prices.

63
On the criteria of volume, with relatively low calving rates, the pasture leases to
had been relatively unproductive sources of feeder or breeding stock for the industry.
On the basis of quality, the low incidence of infusion of new blood lines from external
sources through purchases of new breeding cows and bulls point to a high probability
that the genetic stock obtained from the pasture leases for livestock production
purposes, may have less than desirable qualities, not immediately discernible by ocular
inspection.
6. Leaseholder Investment Behavior in the Face of the CARP and
Contending Claims, and Peace and Order Problems
. The reported problems associated with the CARP, contending claims to the
pasture leases by other parties (legal or illegal), and peace-and-order were documented
to exist in the areas covered. The impact on investments, however, have not been
shown to be general or systematic. Though these may have caused the deferment of
significant amount of investment by particular segments of the pasture leaseholders,
they did not point to the hypothesized strong adverse effect on the majority of thei
leaseholders. In particular, only a fourth of the respondents claimed to have deferred
investments in improved pastures. In the aggregate, the amount of deferred
investments in pasture improvements was put at a mere P280,000. This translates to
•P7,000 per lease, or P240 per hectare. -It appears, therefore, that with or without these
often-cited problems, there would have still been very little investments in the
development of the pasture leases into veritable improved pasture lands.
For the segment of the pasture leaseholders who declared experiences with the
above problems to have contended with the "irritants" to pasture leasing activities by
majority of them investing in private security, with about one-third also investing in
guns and ammunitions. Total investments on security matters, at about P16 million,
were mostly in Mindanao, where about 80 percent of the whole was spent.

64
7. Profitability of Operating and Maintaining Rights Over the Pasture Leases
Total (reported) revenue from the sales ofcattle, in general, and in all locations,
were shown as not able to cover for total variable costs in operating the pasture lease
over the one year period covered. Taking into account, however, revenues from other
activities (cropping) within the pasture lease, losses are substantially reduced for two
locations, and in one location (Bukidnon) profits turned positive.
The results presented a rather intriguing picture. First, in all locations, the
pasture leasing activity, by itself, emerged as an entirely losing venture, whichever way
it is looked upon. Second, in two locations, the income from non-pasture activities
greatly dwarfed revenue from cattle sales. In the aggregate, non-livestock income
outperformed livestock revenue by 4-io-I. Barring underreporting of cattle sales and
over inflation of expenditures, it strikes one why the pasture leases are being kept at
all.
A counter check of information using leaseholder estimates of pasture lease
gross income from all activities provided the result that the average farm, in allJ
locations was obtaining positive net income. Both results point a common conclusion:
non-livestock activities in the pasture leases generate substantial amount of income.
8. Alternative Measures of Economic Rent from the Pasture Leases
Despite the reported losses in operating the pasture leases, and despite the
existence of external problems associated with the activity, almost all the leaseholders
want to continue with their operations, and even 80 percent will renew their lease
contracts at a higher rate of P20/ha. per year than the current PI.00/ha. per year. One
only has to look at the revenue from cattle sales and losses in the pasture lease (without
income from other activities), and one wonders why the pasture leases are kept at all,
much less, to be renewed for another 25-year lease.
The proportion of non-livestock to livestock income indicates that the value of
the pasture lease may not already lie on the potential income from livestock operations,

65
but from the use of the land for other agricultural activities such as sugarcane, copra,
corn, and palay production. The substantial income obtain obtained from these could
even be the reason enough to maintain a security force for keeping out, not mainly
cattle rustlers or insurgents, but rather potential claimant by virtue of speculation on
whether or not the pasture leases are to be subject to the CARP.
The worth of the pasture leases may be reflected in the value that the
leaseholders have placed on just maintaining their present rights to the pasture lease for
the duration of the remaining years of their contract.
While livestock production, by itself, appears to be a losing proposition, it
cannot be discounted that many of the pasture leaseholders may simply be maintaining
a token number of heads of cattle, just enough to ensure that the pasture lease does not
appear "abandoned" - a reason for the DENR to cancel the lease - to be able to
maintain activities in non-livestock operations which provide for greater net income
than cattle raising. Furthermore, such non-livestock are effectively undertaken on an
extensive scale, not subject to land ceilings by the CARP. The larger the size of the
lease, the larger the absolute size of the economic rents obtained, with the financial cost
of land placed at an insignificant PI.00/ha. per year.
Thus, it does indeed, make sense not to put investments in the expansion of
improved pastures. Rather, investments would be better placed in non-livestock
operations, but within the pasture lease. This may partly explain why about half of the
•pasture lease workers are reported to be neither partly, nor fully, involved at all in
livestock production.
9. Recommendations
From the preceding discussions, it can be stated that f_e current arrangement for
access and maintaining the use of the pasture leases, the?e"l'bre,grossly distorts the
scarcity values of the pasture leases. Definitely, the pasture Jeases are not just worth
PI.00/ha. per year. Not even the floated rate of P20/ha. lSe'ryear would approximate

66
the true economic value of the pasture leases. The current intensity of investment and
use of the pasture leases are perpetuated because of the exclusivity of franchise given to
pasture leaseholder, with validity that lasts for about a generation..
The granting of extremely scarce franchises to applicants, obtainable at
artificially low rates, generates incentives to rent-seeking behavior on both sides -
applicant and grantees - and would have as consequence the misallocation and
maldistri.bution of land resources.
9.1.
It is recommended that the system of granting pasture lease rights be thoroughly
reviewed to in&ice a more rational, more productive, and more transparent access to
use of government property. Since.the economic rents obtainable from the pasture
leases appear to be substantial, a system of lease granting must be designed to obtain
maximum government revenue from them. This implies that the lease rates be raised
significantly, and that a systematic rates indexing be devised to reflect the growing
scarcity value of land from year to year.
9.2.
It is also recommended that the pasture lands be opened for bidding to all
interested parties, for all possible types of productive uses - provided only that they are
economically and ecologically sustainable. It is also recommended that the current rule
which limits non-livestock use to 10 percent of the area be recalled. As a rule which
applies to all pasture leases regardless of topography and productive potentials, it has
no scientific nor economic basis.

0
II
o
;i; 00
_0
0,d",_"c_
0
_-
•_
__0
""
•=_
Ez
'_0
?M,M


0
,z=00

0C

L'__
0

__
o°

_0
0_
00
0_
_0
__
0
00
00
00
00
00
0_
_0
_0
00
00
__
0_
__
_oo_oo_o_o_
_o_om_
__
_0
_0
__
__
__
_0
__
__
__
__
__
_0
0_
00
0_
00
__
_____o_
___
0_
__
0_
__
__
_"-0
0w
00
00
000
0o0
_n0%
00
0_4"_
00
on00
0C
-.¢_
t--e._
cqo
_ocq
,.--_
0v',
P--
0cq
0okO
'-4
0;--,
¢)_
0
-_
.__
.o_
o_
o_,
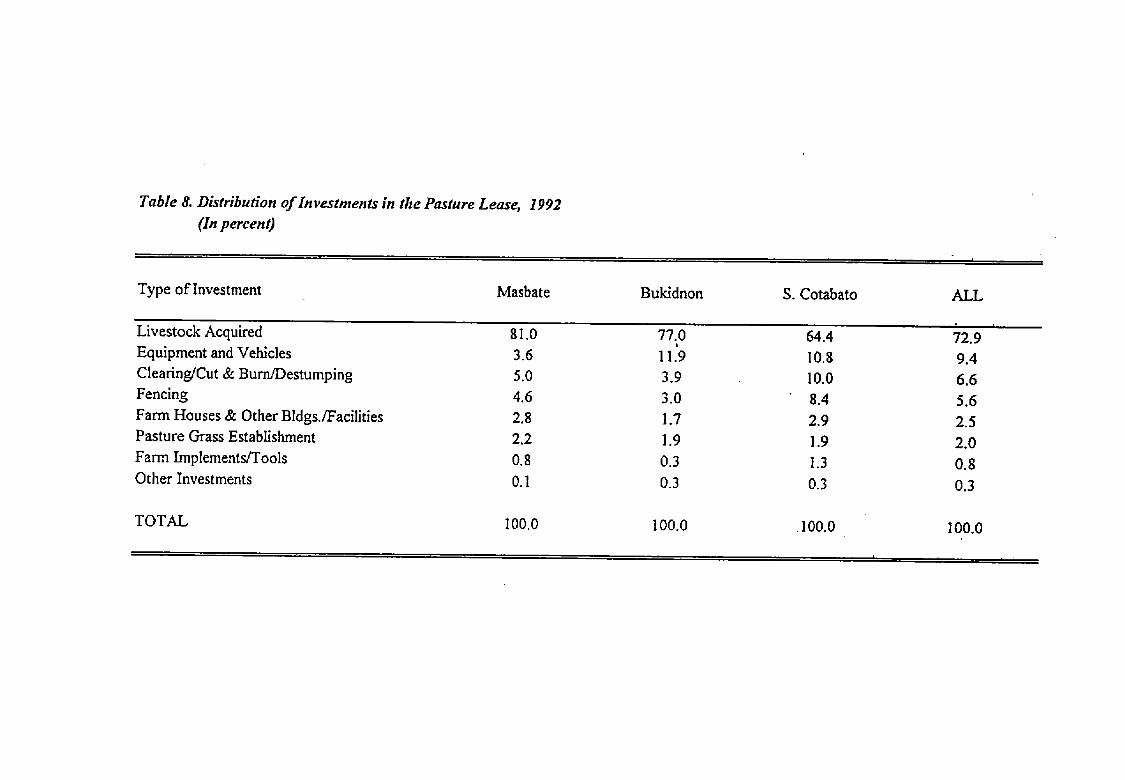
_a_,d
_r4oid
do
0
_"°°°
'_"c_o__.r_
c_
00
00_
o_
0t,._O_
¢_
_"I0
"-
•C_
_,.__
_.__
c_c_
o
e,i
o
_"_.°_,,__
-0
__o
__o
•,__
__,-_
•__
"__'_
_'="
_F_


m,-'_M
[_
"_'I
(_I
_'i
,--_.--__
__"
0
_i,_I
___
_'_I_"
__
0
II
_"-_
¢_(_
_0
°°°°°°o

_'_'_
r'__"
O_
'q_"I_
"d"_
•0
e_0
_o
N
__
o_
•_
__
-.,
"--"
_(_
00

_l'_
_I¢_
ErJ
_¢_
CtJ
¢0*-,
_'qi=--6,.DC
/30_3-di_
I_
O0
C_

o
0_-
_G
0c_
_.'-'_
0
"__'_
_0"_r
,--*cq
.
____
°_
_u
m
._=_
_.._=

_oO
oo_
0
0
o_4dddd_
_e..__
_
•-_._
__'_

,_v'_
C',1
_,_l"_-
_0
0"_"
.0
_"
_dod_dd
e,to
___
___
"_,__m
[0

_o
oCcs¢soC
cs
ox
t.¢,n
¢xlL
,.xl,._
,.._O
x
_o
"_
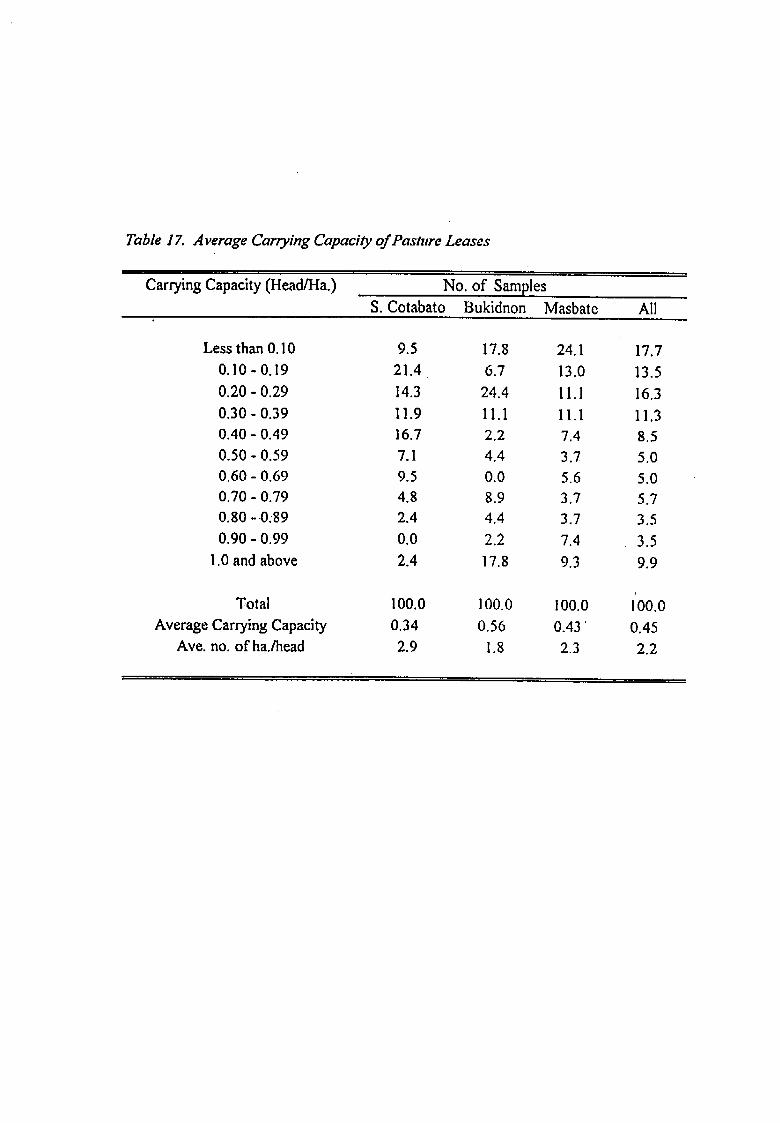
Table 17. Average Carrying Capacity of Pasture Leases
Carrying Capacity (Head/Ha.) No. of SamplesS. Cotabato Bukidnon Masbate All
Less than 0.10 9.5 17.8 24.1 17.7
0.10 - 0.19 21.4 6.7 13.0 13.5
0.20 - 0.29 14.3 24.4 1I. 1 16.3
0.30- 0.39 11.9 11.1 11.1 11.3
0.40 - 0.49 16.7 2.2 7.4 8.50.50-0.59 7.1 4.4 3.7 5.0
0.60 - 0.69 9.5 0.0 5.6 5.0
0.70 - 0.79 4.8 8.9 3.7 5.70.80 - 0..89 2.4 4.4 3.7 3.5
0.90 - 0.99 0.0 2.2 7.4 3.5
1.0 and above 2.4 17.8 9.3 9.9
i
Total 100.0 100.0 100.0 100.0
Average Carrying Capacity 0.34 0.56 0.43' 0.45Ave. no. of ha./head 2.9 1.8 2.3 2.2

00
_,{o-
_'-o
__.
_'.
•oo_
"_o!
_o
_d

___
_0
L'__t__-_
__o

"__"
_"0
r._e_
_0

_qq_
•o_
0

r._
_"_
00
0o"_
00
0_'_
_r'_0
0o
::no
o0
"q:x_"
-:_-0
,--,O
x_0
_'---._0
GO
0
_'-_C
'l¢_
'_r"_
_'-w
'__"_
cxl,-_
_'_0
t...)"_
_0
_"_on
0e_
00
00
0O
x
_b_09
.-__C
,tO
_¢q
oO,_"
.-_¢q
00
00
O_

•-_--_
o•._
."_¢',1C
'_C
_l,--_
0
__
__
00
__
__
0
__
__
__
0
.:NN__o_
__
_e
_0

,-_
_'_
I_0
_0
Ox
0
oo
.-_
0
¢q
OX
0_
o'--4
0
_o
_o
0
o_
=0
_-
__
=oo
_g
,.o
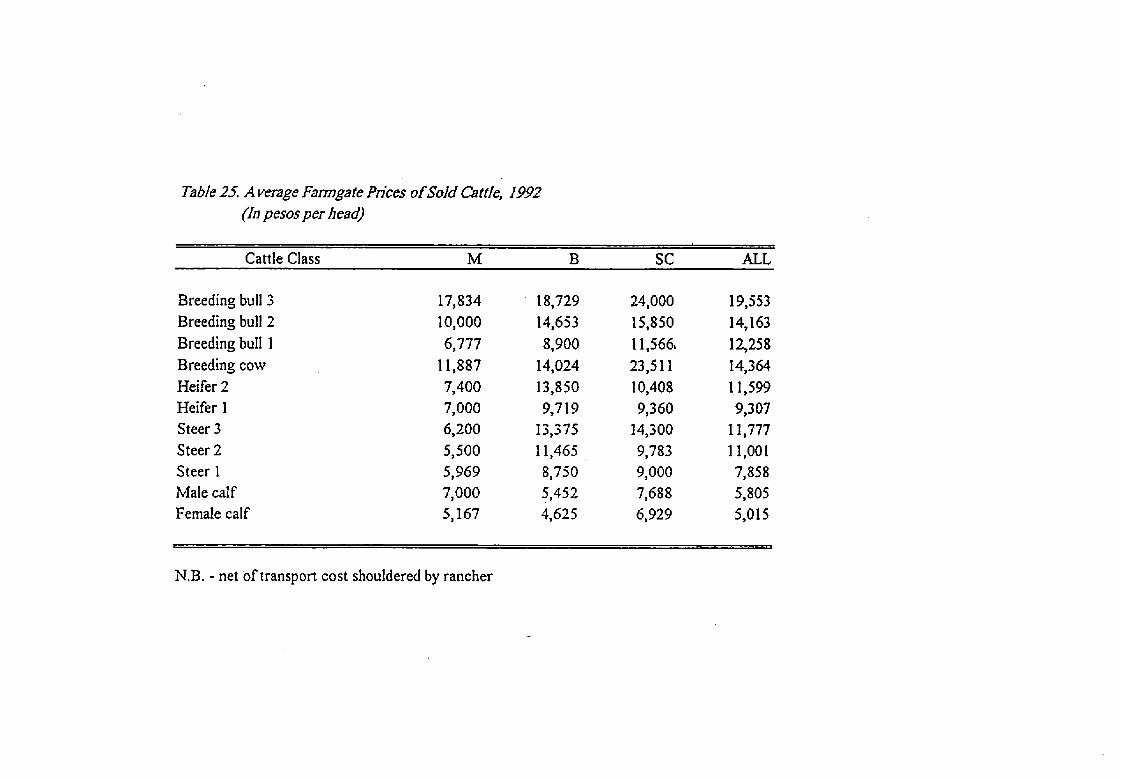
_"
__
e,n
00_
"_"
(_
(:_
t'--_0
el
---
_(',I,-_
-e._
',<1"
0I"-.
r".0
00
00'_
0_'-
_"_,_
e,%0
_"--O
00
00
0kO
0kO
U%-,
0e-,

_'_
%O
Oun
OO
O(D
OO
OO
_(_
v%
c,Ic,_o0
-_"
C,_('4--
.-.C,I_
on
c_
..
(,,%
oO
OO
OO
OO
Oo
OO
__
OO
__
OO
Oo
OO
_
_O
OO
OO
OO
(_
Oo
O%o
%0
_,O_
_O
OO
_v%
oO
O%o
ko
o'_'o_'_-
_..'_-'c__r.-
--"
__
"_"
_o
o_,n
oO
oo
oo
c)
ov_
o_._
o(D
_--(D
c)
o<D
(D
_,_C)
Oc4
e,%
_0
........•_.
__
__
"_._
__
_"_
_

¢_
_'_r-_v.__
0
__
__
0_
0
__
__
0
g-
__
__
o_
__
_0
__
o

Q

0_
_l-,q"oo
_,--,"_'-('q
Ox
0
"_
__'q"4"
_'_°°
°0
°°
°°
OX
Ox
0_.
0
"_
_(J
_t.,___
0"
_-,,._
_.1_1..
_r_
_r.i,_o
_0i._
0
S'o
_eJ_.
,_-_
_0,--,.
CO
¢_
_-
w'_
0o

0_
__
__
__
0
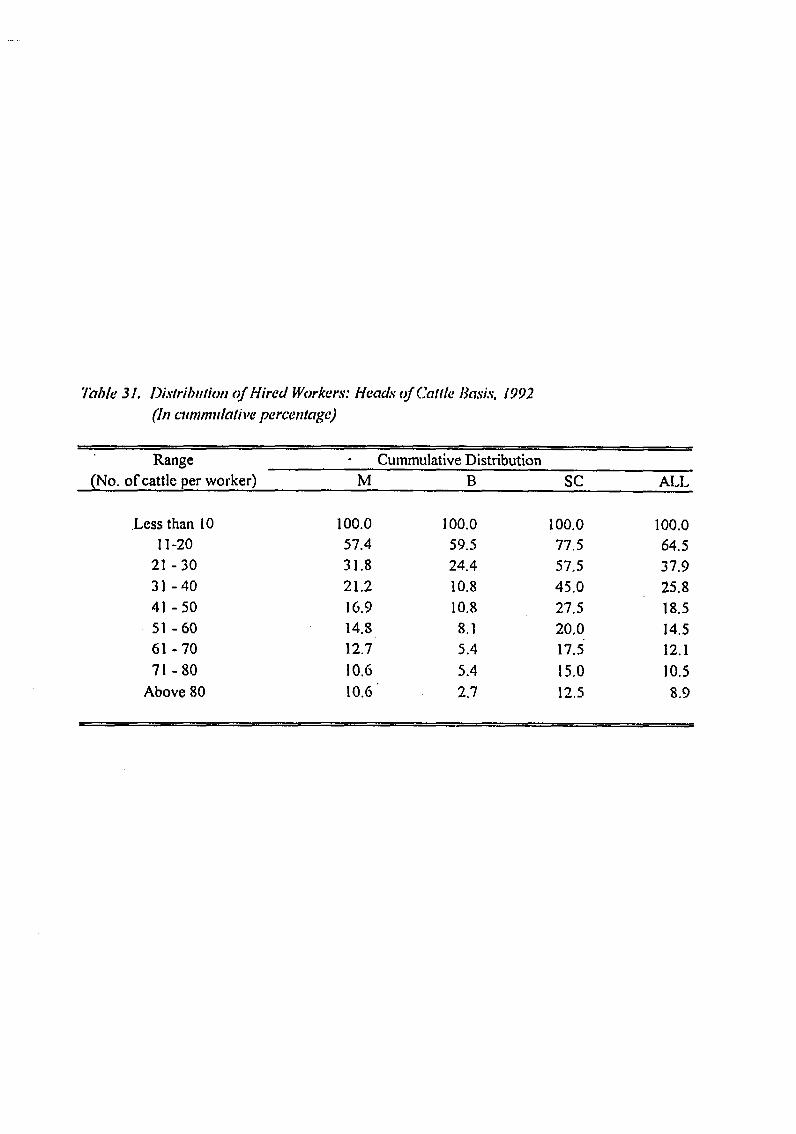
7"able31. Distribution of Hired Workers: Head_"of Cattle Basis. 1992
(In cummulative percentage)
Range Cummulative Distribution(No. of cattle per worker) M B SC ALL
Less than 10 100.0 100.0 100.0 100.011-20 57.4 59.5 77.5 64.5
21 - 30 31.8 24.4 57.5 37.9
31 - 40 21.2 10.8 45.0 25.8
41 - 50 16.9 10.8 27.5 18.5
51 - 60 14.8 8.1 20.0 14.561 - 70 12.7 5.4 17.5 12.1
71 - 80 10.6 5.4 15.0 10.5Above 80 10.6 2.7 12.5 8.9

__
__
_0

Eo____
Eo
oo

_C
O0
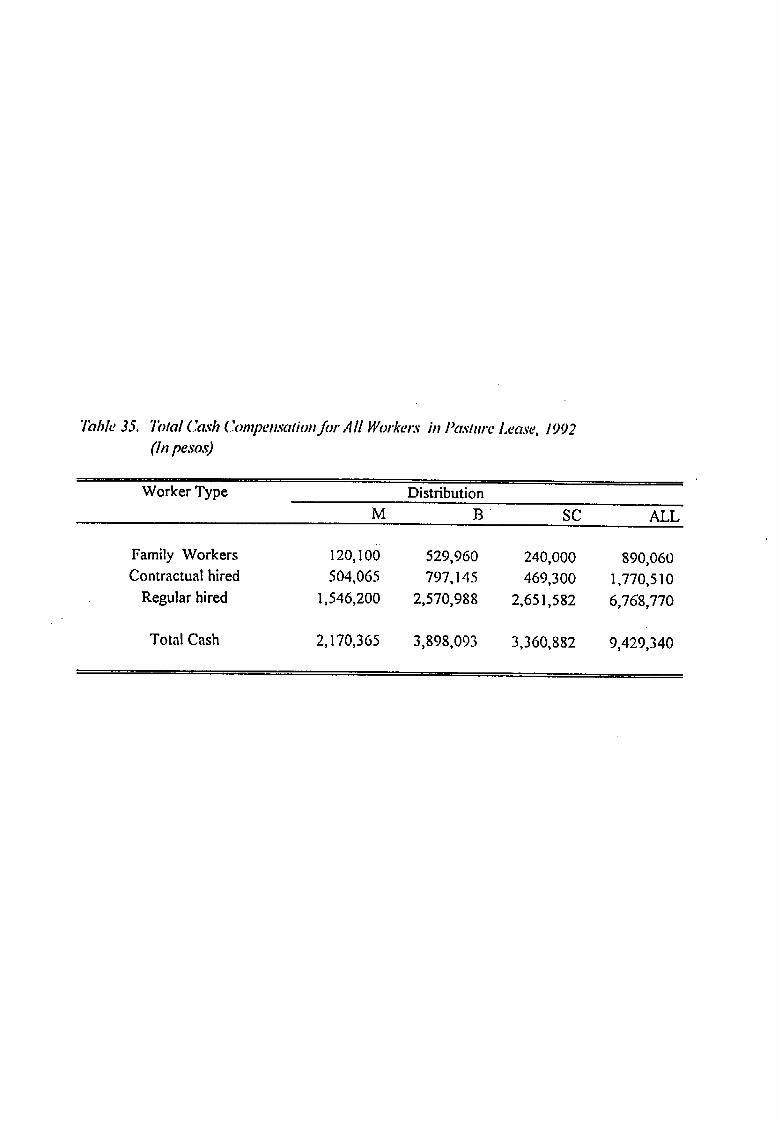
Table 35. "lblal Cash C_ompetL_alioltfor All Workc,t:_"hi I>aslttre Lease. 1992
(111pesos)
Worker Type Distribution
M B SC ALL
Family Workers 120,100 529,960 240,000 890,060
Contractual hired 504,065 797,145 469,300 1,770,510
Regular hired 1,546,200 2,570,988 2,651,582 6,768,770
Total Cash 2,170,365 3,898,093 3,360,882 9,429,340

!_0
00
0
oooO
o,_0


II
r_o"_1o
oo
o_
_0
.0o_
>_Z
o

"_
00
00
0
kO
,--,0
_,'%
('4
u'_u'*_
0,q"
o_"rir__,_"
o,"
0_)
oo
00
v_
_0
0(',IC)
_'%
0•q"
---oo
I'_

Tablo44. SLructurcof E._'pcndilurc_"oa Variable/npuL_
(Inpesos)
ExpenditureType DistributionM B SC ALL
A. On pastth'e improvement 930,898 I,I 71,692 435,580 2,538,170
i. Planting materials 21,945 I 18,720 17,730 158,3952. Fertilizers 92,130 478,455 17,500 588,085
3. Rclxairlmaintainanee l_nces 805,185 483,077 400,350 1,688,6 i2
4. Pesticides 11,638 91,440 0 103,078
B. On Livestock care 1,085,669 1,976,484 1,040,842 4,102,995
5. Veterinary items 794,039 668,865 i92,888 1,655,7926. Feeds/concentrates 290.030 946,869 536,785 1,773,684
7. Roughages i,100 317,300 267,394 585,794
8. External prol_ssionul servit:es 500 43,450 43,775 87,725
C. Equipment repairs/maintenance 78,440 1,136,169 706,287 1,920,896
9. On farm machines/equipment 59,250 390,917 287,398 737,565
10. On transport vehicles 11,510 588,672 375,685 975,867
I I. On building,s/lheilities 7,680 156.580 43,204 207,464
D. Rentals 17,788 152,314 22,859 192,961
12. Pasture le=lse 17.338 14.414 20,859 52,61 I
13. Machine/vehicles 450 137,900 2,000 140,350
E. Others 19,865 122,375 90,600 232,840
TOTAl, 2,132,660 4,559,034 2,296,168 8,987,862

Table 45. So'ucturc of l3xpendilure8 on VariableInputs, 1992(As perccnzagcof Total F,_'pcadilures)
........... i ,llii
Expenditure Type M B SC ALL
A. On pnsture improvement 43.6 25.7 19.0 28.2
I. l'Imlting materials 1.0 2.6 0.8 1.82. Fertilizers 4.3 10.5 0.8 6.5
3. Repair/maintainnnce of fences 37.8 10.6 17.4 18.84. Pesticides 0.5 2.0 0.0 !. I
B. On Livestock care 50.9 43.4 45.3 45.7
5. Veterinary items 37.2 14.7 8.4 18.46. Feeds/concentrates 13.6 20.8 23.4 !9.7
7. Roughages 0. I 7.0 11.6 6.5
8. External professional services 0.0 1.0 1.9 1:0
C. Equil_mcnt rcpair_lnaintcnance 3.7 24.9 30.8 ' 21.4
9. On l'anu machinc.s/cquil)nlent 2.8 8.6 12.5 8.2
i 0. On transport vehicles 0.5 12.9 16.4 !0.91I. On buildings/facilities 0.4 3.4 1.9 2.3
D. Rentals 0.8 3.3 1.0 2. i
i2. Pasture lease 0.8 0.3 0.9 0.6
13. Machine/vehicles 0.0 3.0 0.1 1.6
E. Others 0.9 2.7 3.9 2.6
TOTAl_, 23.7 50.7 25.6 100.0

,_,(_,1E
"-",_1",.'-,
%0
0e,l
"_"e,I
0
_i0
e'%O
000x
t"-'W
"O
_tn
t"-t_.
,...,
_o
_o
o

Table 4Z Composi/ion o£/hc Major _pcndi/urc Ca/cgorics
Expenditure Type Distribution ..............M B SC ALL
A. On pastureih_provcmcnt 100.00 ! 00.00 100.00 100.00
1. Planting materials 2.36 10.13 4.07 6.242. Fertilizers 9.90 40.83 4.02 23.17
3. Repaidmaintainance fences 86.50 41.23 91.91 66.53
4. Pesticides 1.25 7.80 0.00 4,06
B. On Livestock care 100.00 100.00 100.00 100.00
5. Veterinary items 73.14 33.84 18.53 ;40.36
6. Feeds/concentrates 26.71 47.91 51.57 43.23
7. Roughages 0. !0 16.05 25.69 14.28
8. External professional services 0.05 2.20 4.2-1 2.14
C. Equipment repairs/maintenance 100.00 100.00 100.00 100.00
9. On faro) machines/equipment 75.54 34.41 40.69 38.40
10. On transport vehicles 14.67 51.81 53.19 50.80
11. On buildings/facilities 9.79 13.78 6.12 10.80
D. Rentals 100.00 100.00 100.00 100.00
12. Pasture lease 97.47 9.46 91.25 27.27
13. Machine/vehicles 2.53 90.54 8.75 72.73
E. Ofllers 100.00 100.00 100.00 100.00

Table 48. l_istence of lncome from Other l,'arm Activities Withbt Pasture Lease, 1992(As percent of farm.s)
Other Activities/Commodities Percent Distribution" M B SC ALL
Corn 10.7 44.4 15.9 22.8
Palay 14.3 11.1 0.0 9.0
Copra 10.7 0.0 6.8 6.2
Sugarcane 0.0 8.9 0.0 2:3Others 1.8 13.3 6.8 6.9
Total 37.5 77.8 29.5 47.6

¢',1

0P".
_'_0
oo
0Uo'1

'_00
,--.--.-.
_o"
_."04_
_°E
t_

Table 52. Palay Output from Pasture Leases, 1992
(In metric tons).
Entry .Distribution
M B ALL
Total 32.2 39.8 71.9
Highest Value 15.0 27.0 27.0Lowest Value 0.8 0.3 0.3'
Mean 4.0 8.0 5.5

Tablc 53. Oulpul and/ncomc from Odwr SourccsBukidnon and South Cotabato, 19P2
Activities Volume (m.t.) Income (Pesos)
Cotton 2.5 75,000
Sorghum 3.5 14,000Banana 0.2 1,150
Vegetables 1.6 5,790
Coffee 0.8 62,500
Peanuts 0.5 1,000


"_
--.°
oo__
R
_c4.4e46
6_4
66
"_
%0
.00
_,_-,o
oo
=o
oo
oo
O0
_0
.--'.
,--,
-_- q
ioOoOoOoO_
_oooo
00
00
,,-,g'o
'o'g-g_
o':"

0
1"'-Q
0""
o"t'_
_o
00
0_
00
00
0
00
00
•c:_o
_o"
_o
_0
00
0

Table 58. Market Value of Real F_'tare Property, 1992
........ • T,
Range Percent DistributionM B SC ALL
0 - 2,000,000 100.0 62.5 68.8 67.6
2,000,001- 4,000,000 " 0.0 18.8 12.5 14.74,000,001 - 6,000,000 0.0 12.5 0.0 5.9
6,000,001 - 7,500;000 0.0 6.3 6.3 5.9
7,500,001 - 24,000,000 0.0 0.0 6.3 2.9
24,000,001 - 50,000,000 0.0 0.0 6.3 2.9
Total 100.0 100.0 100.0 100.0
Total 1,110,000 35,950,000 91,431,000 128,494,000
Percent Share (%) 0.9 28.0 71.1 t 00.0
Mean 555,000 2,246,875 5,714,625 3,779,235

Table 59. Market Value of Residential Property, 1992
- " ,,r, ..........
Range Percent DistributionM B SC ALL
0- 500,000 67.4 56.4 44.8 27.7
500,001- 800,000 4.7 17.9 10.3 10.8
800,001 - 1,000,000 , 11.6 2.6 10.3 8.1
1,000,001- 1,500,000 4.7 2.6 20.7 8.I
1,500,001-2,000,000 2.3 7.7 3.4 4.5
2,000,001-2,500,000 7.0 2.6 3.4 4.5
2,500,001-3,000,000 2.3 5.I 0.0 2.7
3,000,001-6,000,000 0.0 5.I 6.9 3.6
Total 100.0 I00.0 100.0 100.0
Total 24,59 i ,680 32,383,000 3i ,494,000 88,468,680
Perecnt Share 27.8 36.6 35.6 !00.0
Mean 571,900 830,333 1,086,000 797,015

Table 60. Market Value of Non-l'asture Major Assets o/'l,easeholders; 1992
IH ' I I m p,i i
Range Percent Distribution
M B SC ALL
1,500,000 or less 83.7 48.8 40.0 59.2
1,500,001 - 2,900,000 ,12.2 19.5 15.0 15.4
2,900,001- 5,520,000 2.0 7.3 15.0 7.7
5,520,001- 9,000,000 0.0 9.8 10.0 6.2
9,000,001 - 10,404,000 2.0 2.4 7.5 3.8
10,404,001 - 20,140,000 0.0 12.2 7.5 6.2
20,140,001 - 76,000,000 0.0 0.0 5.0 1.5
Total 100.0 100.0 100.0 100.0
Total 52,493,070 152,270,000 252,959,000 457,722,070Percent Share (%) 11.5 33.2 55.0 100.0
Mean 1,071,287 3,713,902 6,323,975 3,520,939


o_
("_c',l"_-",_-00
,wO
',o
0',_r
(>
U_
__0
_0.-,
O0
_0,--
O0
__
o
N
__
_0
,'--"_
__
("40
(','I0
0o
_r--.._
0
r.,.
_(-,i
o
O_oO°_
_o°
oO_-8_oo-
oo,._
_"
o_,,,,
__o
o
ooo
_

,_.
.o""-",-"
--
_J_'_
O_
..--_¢_
¢_1_0
_0
QO
_0
II_'J
,--,¢q
¢_10
_--0
_.__
_'_"_
_0
__
__
__
0_
0
__
_,_-
_0,-4
,--_00
_¢xl¢.h
0
'b
0ooooo
00
0
°o°°
'_o_r
__
_

_-_(_-
l__
_t_
oor_c_
__
_oo
v_

oo

"__
_o
__
o
o_
_m
_2_
_,_,

?bble 68. Number _Security ?'earnMembers
Range Percent Distribution
M : B SC ALL
1- 2 "38 39 59 45
3- 4 13 23 18 20
5- 6 25 23 18 21
7- 8 13 6 0 5
9-10 0 6 6 511- 15 13 3 0 4
Total 100 100 100 100Mean 1 3 1 2


__-
_o_
oo

\
_0
l_lC
_O
O0
Lci_
0

¢.0o,I
,._,._
_,._
_0_.-
_'_0
o_1
_0_
_e_
0

_o__
d
.0
o_
__

•_,"4
O0
_
°
C_
o°o-__

00
I_-.
¢'|
O
o
,f,
I"-
"I"
r_._tt
j
LC_
kt....
r2)eo
c2_._
-
_o
"
-.-i
,._.3

Table 76. lucidence of l,2cpenditures Related to Pasture Lease Security(Percent of farms)
Expenditure Item DistributionM B SC ALL
Horses 64 82 63 66.0
Guns 27 40 . 34 33.1
Vehicles 13 40 39 29.0
Radio 2 42 25 21.0Others 2 4 2 3.0
Any of the above 57 84 73 70.3
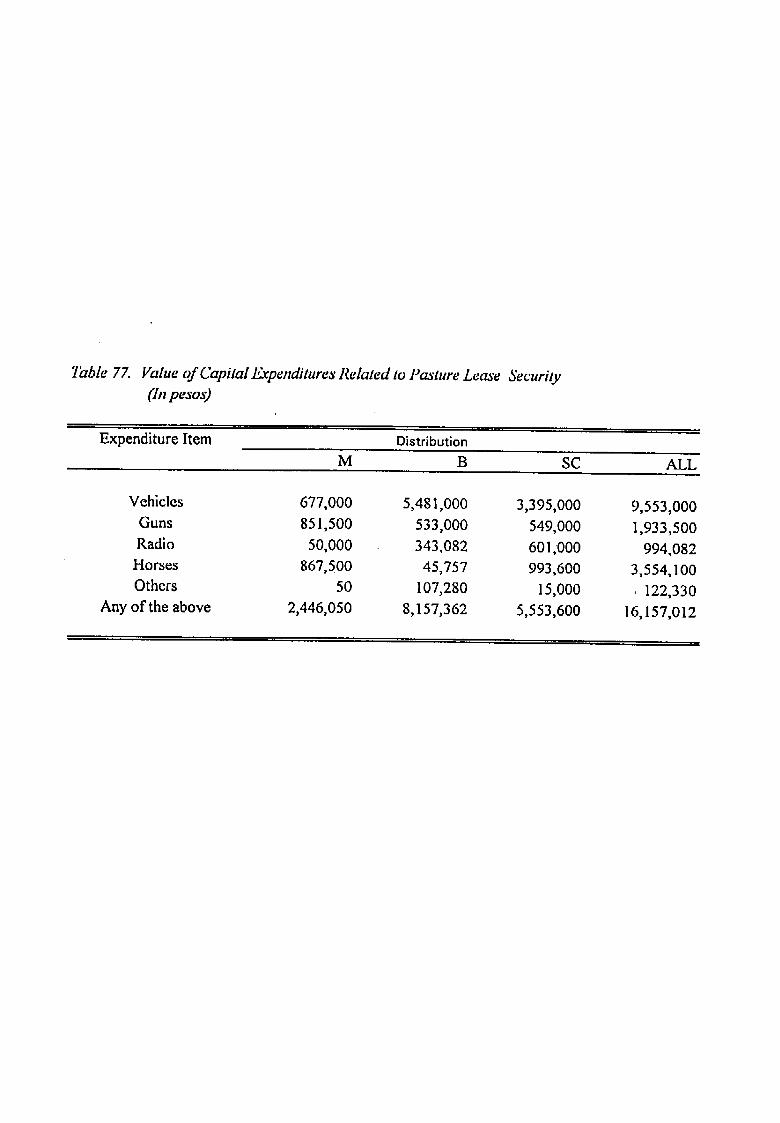
Table 77. Value of Capital Expenditures l¢elated to Pasture Lease Security
(In peso_9
Expenditure Item DistributionM B SC ALL
Vehicles 677,000 5,481,000 3,395,000 9,553,000Guns 851,500 533,000 549,000 1,933,500
Radio 50,000 343,082 601,000 994,082
Horses 867,500 45,757 993,600 3,554,100Others 50 107,280 15,000 , 122,330
Any of the above 2,446,050 8,157,362 5,553,600 16,157,012

Table 78. Average Expenditures Per Farm on Security Items
Expenditure Item Distribution
M B SC ALL
Guns 56,767 296,611 36,600 40,281
Radio 50,000 18,057 54,636 32,067
Vehicles 96,714 304,500 199,706 227,452.
Horses 28,917 45,757 35,486 37,412
Others 50 53,640 15,000 30,583

_L
rbL
_O
C_
_Ir_
O
"r--
__
c_o
oO
O
q_

('__
0_-'
0
_r...)
_r-.o
0_
r'-.¢,1
0
t_..'
4)I_
_0
Vl
e_Z
o4,)

Tabie 81. Willingness to Renew Lease Rights at Various Rental Rates
Rental rate Percent of Sampl_(P/ha./yr.)
M B SC Total
500 and above 0 3 3 2
150 - 449 0 3 0 1
100- 149 0 6 13 5
50- 99 12 17 6 12
40- 49 2 3 0 230 = 39 5 8 3 6
20 - 29 34 36 19 3110- 19 10 8 10 9
5 - 9 27 8 30 21
1 - 4 10 8 16 11
Total 100 100 100 100
• ,t , , : •

Table 82. E_timated Value of Assets Within The Ranch, 1992.
Range Percent Distribution(In '000 pesos) M B SC ALL
Less than 501 30 24 7 21
501- 1,000 28 19 18 22
1,001 - 2,000 20 19 33 24
2,001- 3,000 6 13 18 12
3,001- 4,000 8 3 5 54,001- 5,000 2 3 7 45,001 - 10,000 6 1 i 7 8
Above 10,000 0 8 5 ' 4
Total 100 100 100 100
Mean 1,596,852 3,685,729 2,739,058 2,504,253

Table 83. l'_2_'timatedMarket Vahte of the Pasture Lease, 1992.
Range _ _ Percent Distribution
(In '000 pesos) M B SC ALL
Less than 501 i 8 8 2 I0
501 - 1,000 ° 18 13 7 131,001 - 2,000 20 18 22 20
2,001- 3,000 10 13 17 13
3,001- 4,000 10 13 27 164,001- 5,000 10 5 2 6
5,001- 6,000 6 8 5 6
6,001 - 10,000 2 8 7 5Above 10,000 8 13 10 ' i0
Total 100 100 100 100
Mean 2,743,149 5,400,052 4,015,056 3,871,929

Table 84. FA'timated Rights Value of the Pasture I/ease, 1992.
Range Percent Distribution
(In '000 pesos) M B SC ALL
Less than 101 16 11 3 11
101- 500 "25 34 26 28
501- 1,000 27 17 29 251,001 - 2,000 14 14 29 18
2,001 - 3,000 5 6 6 5
3,001 - 4,000 2 3 3 3
4,001 - 5,000 5 6 3 4
5,000- 10,000 5 6 3 4
Above 10,000 2 3 0 2
Total 100 100 100 100
Mean 1,396,698 1,966,571 1,573,000 1,627,814

Table 85. Value of Assets Per Hectare, 1992.
Range Percent Distribution
(P/ha) M B SC ALL
2,000 and less 10 19 10 13
2,001 - 4,000 36 24 23 284,001 - 6,000 22 6 23 17
6,001 - 8,000 10 8 18 12
8,001- 10,000 8 6 8 710,001 - 15,000 8 19 8 11 •
15,001 - 20,000 2 5 7 5
20,001 - 30,000 2 8 3 4
> 30,000 2 5 3 3
Mean 6,707.28 12,349.62 8,381.80 8,878.52Total 100 100 100 100

l'able 85. Total Asscts and Market Value per Hectarein the Pasture Lease, 1992
-, , J, i
Range (P/ha.) Asset Value Market Value
Less than 2,000 13 7
2,001 - 4,000 28 15
4,001 - 6,000 17 136,001- 8,000 12 12
8,00 ! - 10,000 7 8
10,001 - 15,000 11 1415,001 - 20,000 5 820,001 - 30,000 4 1I
> 30,000 3 I 1
N.A. 0 I
Total 100 100
Mean 8,878.52 i4,389.96

0""
'-'_
""4"_
_0
o_
0'--'
-_o6
""
N'--
oOO
oOO
O:_
jo
°oO
o8
NNA
.0
o_

p._
t_-
0_
--"0
_"
_"
¢_
__
C_i_
__
.-_e'__
._.
0
0
,_
0.1_
_0.-,_5_D
[,
'-''--'--'--
0•
__
ooooooooo
o_O
OO
oO
e__
-_,_
__-
_0o
_o
,_,-_
e_V
i
_oo
oo
oo
oo
_oooo
_e"__
__
__
00
00

_M
M_
V
g
__
__
.

e_
o_
__
_•
__
_•
r__
__
_•

fri
•|
fill_
c_c_li_
_imm
milm
lmbm_m
_Zg_

f14
4fw
'.
t_E°_,_
N°

II
o_m•N.N
t•
_
Q

Figure 1. Educational Attainment of the Pasture Lease Holder

BA
oqe
pue
000
L
666-006
668-
008II
Ci
0
66L-
00/r-._
..0_o
¢_669
-009
_)®
|
66_-
00_...I
r.-cac
n.-o
66_-
0017E
:L,-n
"_66_
-00E
ee
I,.!.
66_-
00_
661,-
OO
L
OO
LueqJ,
sse'l
_.ueo._ed


t,o0
t.o0
_0
L_
0
_,uao_ad

•II
0
00
00
00
00
00
e_
e_


15u!d
uJm
seo/uJn
8_'lno/13u
!Jeal3
SelO
!qaAp
uelU
eLU
d!nb3
E
oo
oo
oo
o_
¢q
0cO
_'_"
¢_I
0e->
/.-..

00
00
00
00
0
•_¢0
cO¢xl
¢xl,--
v--
:l.UO
OJad

o.,Q'-3


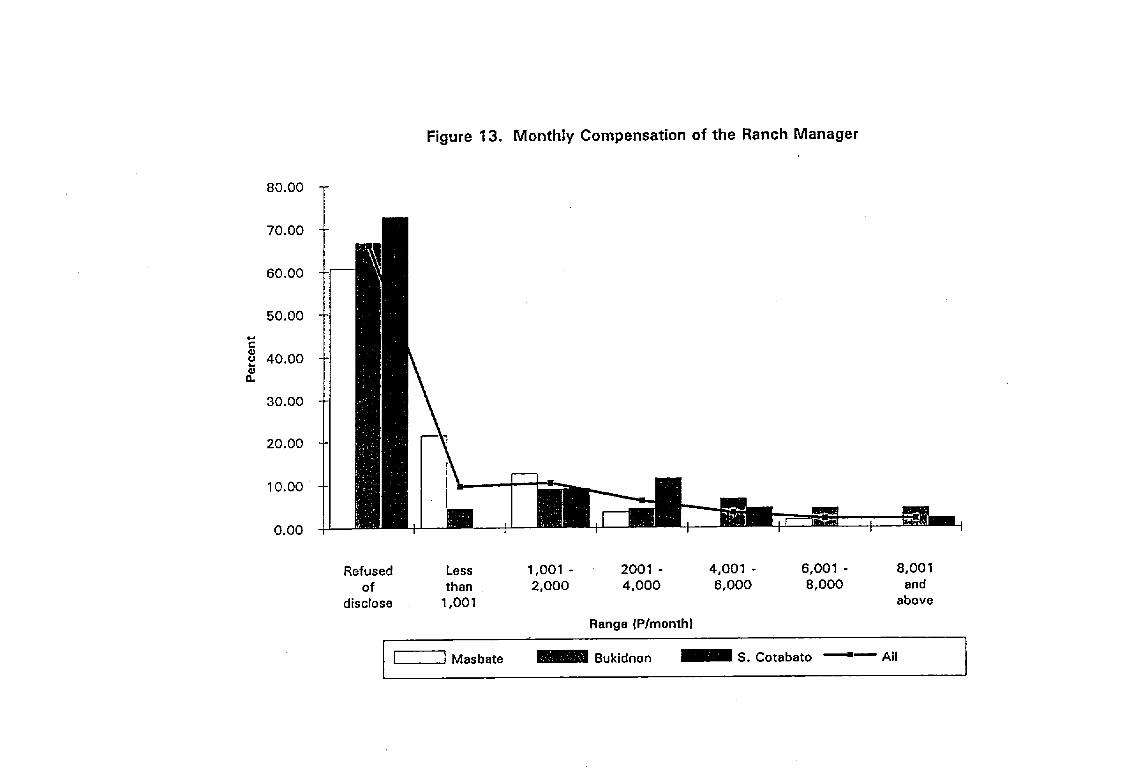
00
00
00
00
00
00
00
00
C)
0o
6o
o6
oo
oc5
_u002ed


-r


"1:3
\° "l-
g)
\°
C0m
c
-i.,
=-_
\•.
r'._.N
'_.__
o°,_
\-_°
°\
"_,
-c-
O.___
_
O3
o
-._
\\
_\
..........\_
00
00
00
0
•.
dd
oo
od
d

0e-*oen
00
00
00
00
00
00
00
od
od
_°m
°o_
•-'r
-i
i

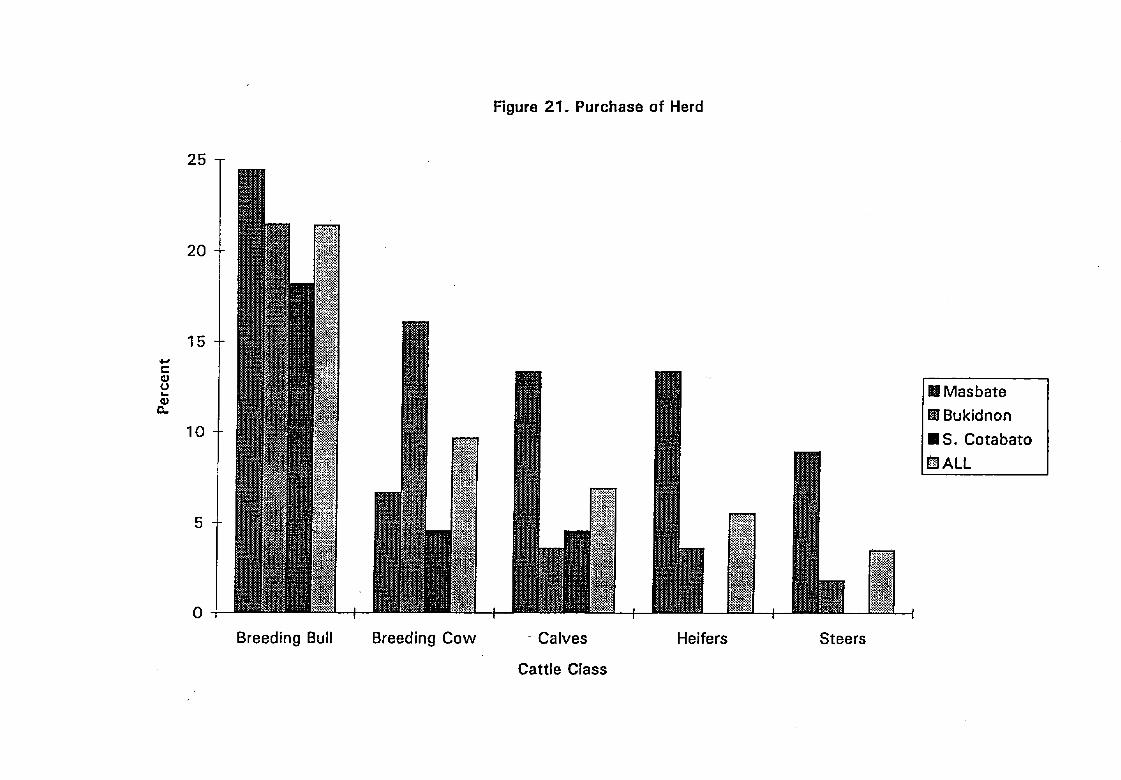
_.
T
m° CO


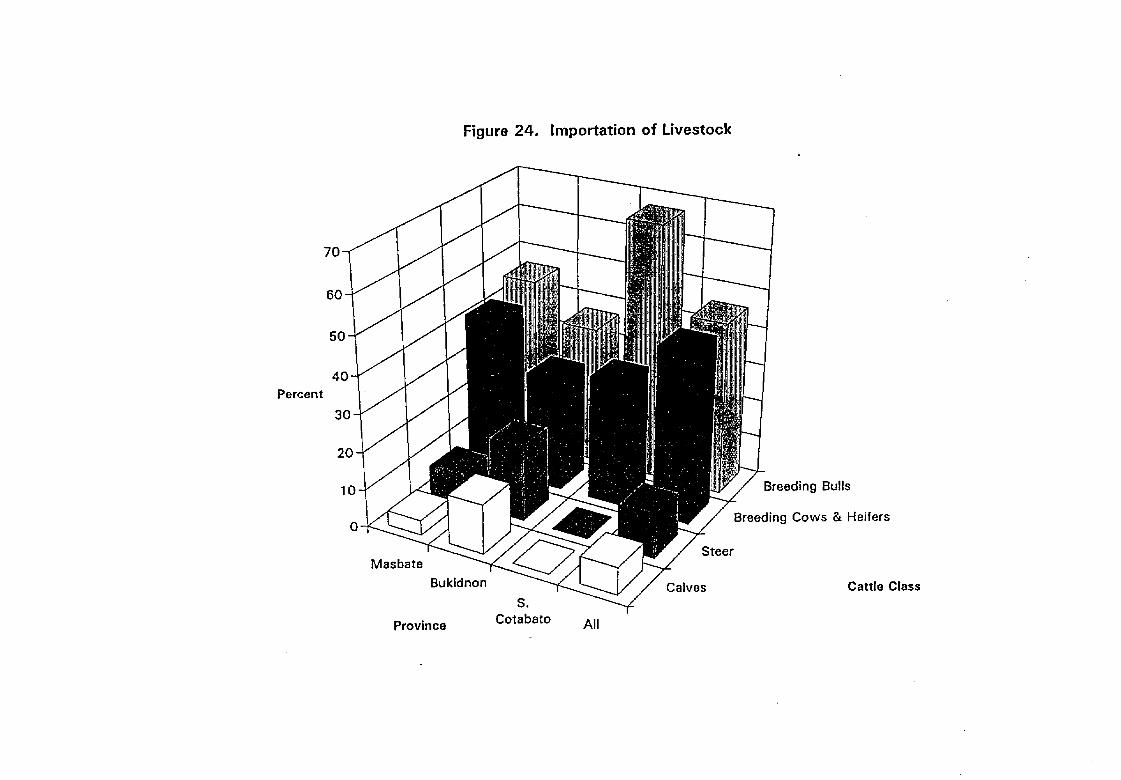
00
00
00
00
ID

UV)
w-
_-.
e-I
Rml
00
_0
C)
00
0
0_
00
00
00
C}
_,Ug
OJad
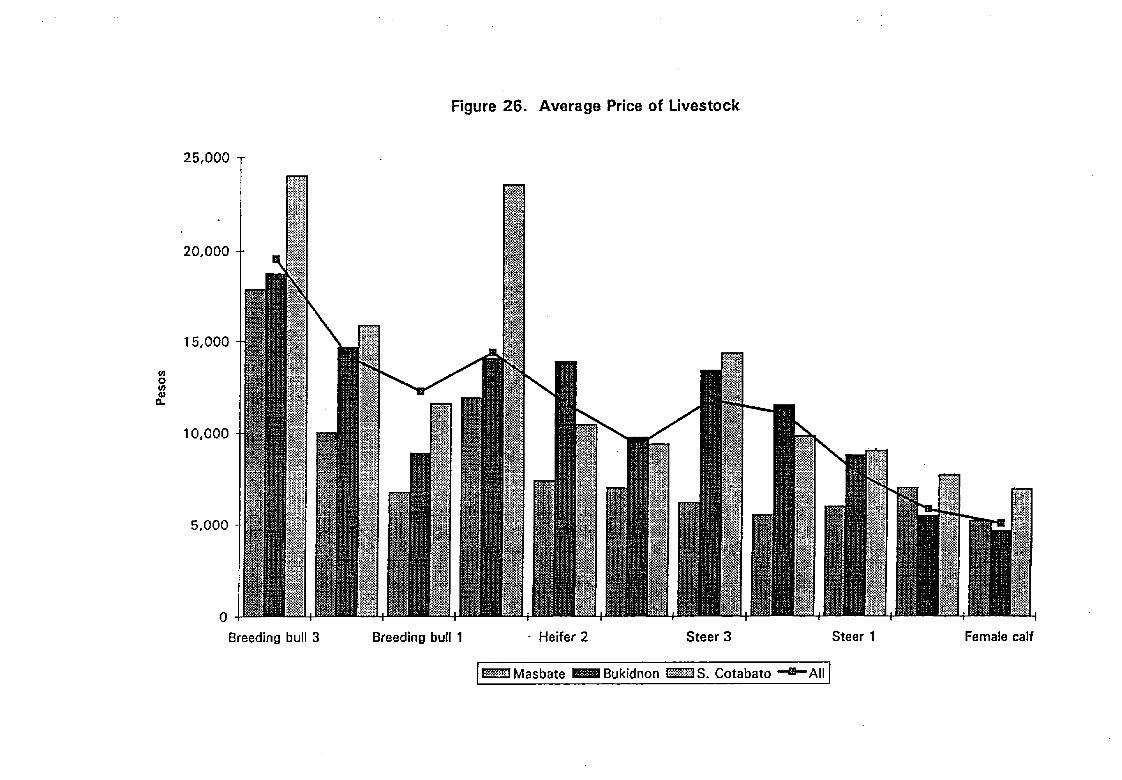
IJ
ID
EIJ_


00
00
00
00
00
00
00
00
00
00
00
00
00
00
dd
dd
od
d,5
d0
00
00
00
00
sosed

_,ug
oJg
d

I._"0
3>
t:1
;;1
/;I
,I
B_e¢_
/f
/",
<_
ri!
/--
,o
i_
JI
J0
0/
_o
__
_1
o._
o,
_!,I
.o,
'og
!tt"
--_-j
e-i
0ii
_u'i
t._
/_r-
,!_
j°
iI_
/,
/q_
/.,
/
//"
I
_-/
,"I""
_I
I_.x:_
00
00
00
00
00
00
03O
0I'_
t,,,O_
__
_'N,--
_.ua0_ed


oo
00
0o
o0
00
00
0o
oo
oo
od
od
do
o0
00
o0
o


It
II
_I
"t
'
00
00
00
00
00
00
00
00
00
00
00
od
dd
od
c_
00
00
00
0
sosa
d

00
00
00
00
00
00
00
00
00
00
00
00
00
00
c_c_
dc_
c_c_
c_c_
<S
00
00
00
00
00
_0
_0
_0
sosed


t-O
'<oo..
x
0o
>_
e.-m
_
_e-
rr
•__
[]0x
_o
0"u
c
._m
o
0"_
0
_,>.
00
00
00
00
0[]
00
00
00
00
0o
oo
oc_
oo
do
¢..1t,.111

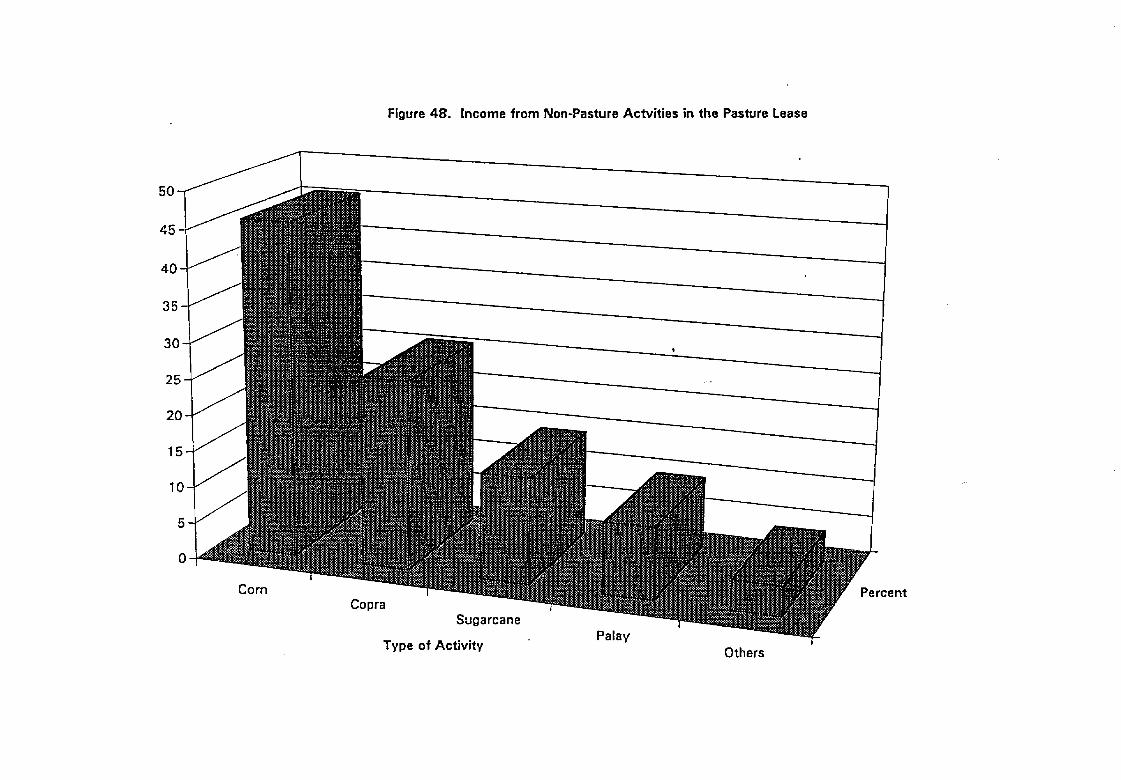


00
00
00
C)
00
00
00
0
t_OI_
_tO
C_I
,--0
soseclu
o!ll!lA
I

{sosad
)anleA
},a)lJalNueB
IN

UC>0D,.
a=to
._13(.1•=
000'0#9'8L-
LO0'O
0#'OI,
<o000'00"9'01.
-I00'00£'£
"_O
00'OO
E:'q
-LO
0'O0£'_
>
000'00£'_-
tOO
'OC
JZ';_
000'0£;_'_-
1,00'000'1,
In000'000'1.
-L
OO
'OL£
"_SSelJo
O00'O
L£
u..._
00
00
00
00
00
0
cn
"--
8ee


.c>oD.r,
G)
mO
c_
<(z
C.Mf_000'000'
LZ
"L
00'000'0L
W,.,
o000'000'0L
-L
00'000'9
000'000'9"
LO
0'O00'S
(1)
O00'O00'S-
L00'000'_
000'000'_,-
LO
O'O
O-q
'E
m}
000'00q'_-0
*mU.
OO
"_
oooooOO°°
°O
(L.
_C
_ee"
¢1


0.c>
o.o
oo
_.D
=..Q
_C
mm
.,0
ee:_
o>O00'O00'OS-LO0'O00'i,_
>-e_
O00'O
00't,_-LOO'OOS'L
i=,
{D
-{3
oO00'OOS'L-LO0'O00'9
g}_0_3
,--I
w,-.
000'000'9-
L00'000'17
0C:
o,000'000'_
-1,00'000'_
m_
"E,-.000'000"_
"0
m_
oo
oo
oooo.ooo
u.g.


a,1>
.uc-
o
o9
,i,._
o
_"
,<
m•
,..,z"J
"I_
t.O
_t.,)
"N
mm
0
000'000'9-L
O0'O
00'8-I
>O
00'O00'E
:-1.00'009';_
>.
..(2'-000'00_'_-
LO
0'O00';_
"00000'000';_
-I,O
0'OO
g'L(I,}
_JO
00'OO
g'!.-L
O0'O
00'I.
0cO00'O00'L-
LO0'OO8
0""
"G
000'008
LO0'O0_
_-,
(I.
O00'O
OS
-0
(,.,
00
0rr
1.00
00
00
_,_.
]im_

o
0z_
00°G'I
,_
00
00
00
00
00
00
00
00
00
00
00
dd
dd
dd
d0
00
00
00
on

¢1>0
o,..
0,.
--"0
O
tA_
b,.
0
•O00'O
00'9L-
LO
0'OI7
I,'0;_"
C/)
000'0_'I.'0_
-1.00'_'01_'0
I.iI=0
000'_0"¢'01.-
LO
0'O00'6
Z0t-.000'000'6
-L
OO
'O;_S
'90J_"_
O00'O
;_g'g-
1.00'006'_.-,•_
000'006';_-
LO
0'O0_'I,
SS
_lJOO
00'O0_;'L
(O
oo
"_r_
oo
oo
oo
oo
o
o')""
E_
8_

_-¢C
\
m
oo
uo
-ou
0O_
0_
_"_"
t3
_,.3,
O0
oo
_1i
°_
°03
e-"0
,II1
x-m
o.
0_ilJ
t![]
00
00
00
00
0co
I'__
I._'_"
cO¢xl
,.--


O0
00
0O
O0
00
00
00
00
00
00
00
00
0o
od
_d
od
d0
Lo
0to
0t_
0Lo
0

L
0_o_o
r,_(0
I__
_)g
_;_'___-_:
0
e,I_,r4
:,0
0o
OJ
_--0
•"JC
OLO
0I
=I_
""o
c_i
'_'0
0Im
l_IIIIII
tcso
=_
II
O.
_c_,co
.0T
-_
,
0'_:.-_................
__
!
E•
-o,___
=0
_--
\_
--_
00
.03
£')
_L
t-
(N
_=
'R0
i-0_-
0-0
o_d
_"_
..........O0
__li
_1_1_i
_l__:_.."_.
:_-_-
_.-.:-_............_......_
,___
o
[]° _)
:_":..........
_N_:if_
-,,,._s.,_,:._:_:_:_:,--0
'0
•-_"__
o
00
00
00
00
dI.o
o_
0,.o
o

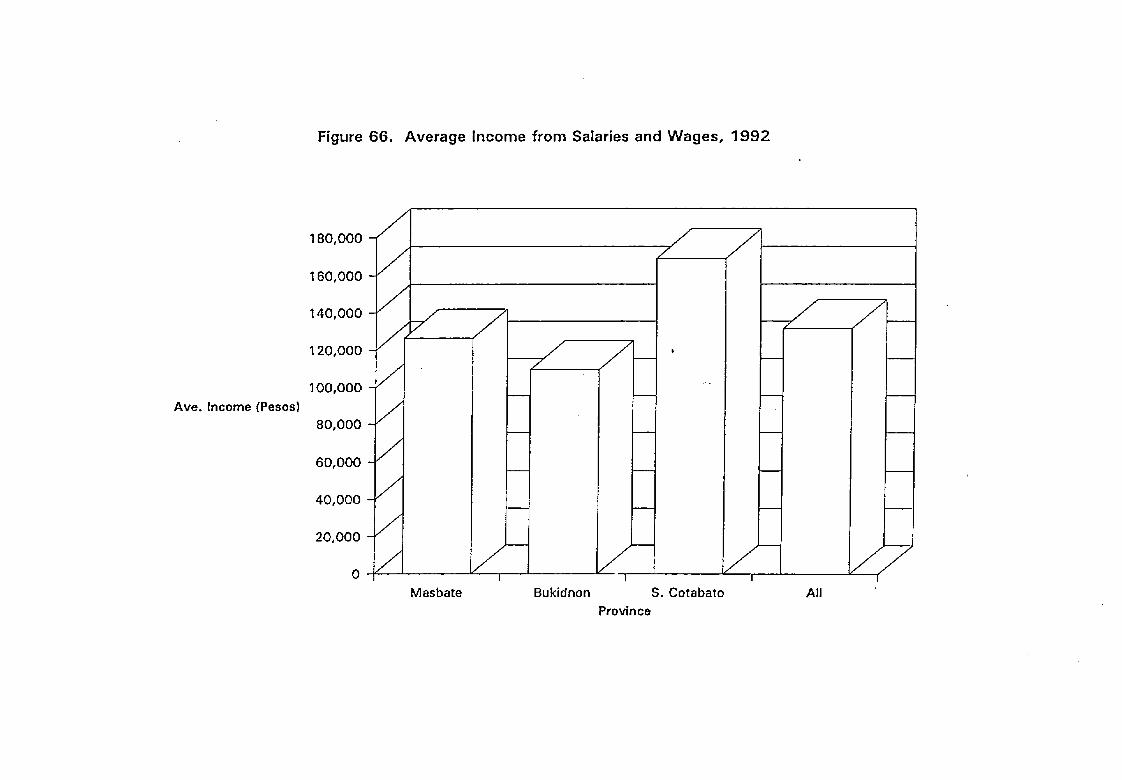
°\\
°
i\
.o
":-
13.
f.O
_"
E_.
.....
cn
oJ
Ii
tEo
\\
0r"
00
00
00
00
00
•-0
00
00
00
00
00
00
00
00
0
.-_6
dd
do
6d
dc_
IJ.
00
co
_"
e_
0co
co
_e_
oo.EoP

.-_...•,.
:..=..
,"_
,.";'.,"."
.._.:
.-
....-..,
\i
00
00
00
00
0
0_
0L
_0
_0
mi
I

\<
\
o\
\0o
\_
°_,
__
C
Eo b.
0_"
•m
Eo
0r-
e"m
°__
N¢.00tL;
_
\i\, ii\
\\
\\
00
00
00
00
00
00
00
00
00
00
00
dd
dd
dd
d0
00
00
00
o

Figure 69. Distribution of Pasture Lease Household Income fromAll Sources, 1992
70.0_
60"0 T_" L'_ .._.__
-._..
40-0-_1 ---._....
Percent 30"0-'_1
20.0"-'_i --...
0.0-Fo Alloo o o S. Cotabatoo o oo o o o o -.2 Bukidn0n
¢9 ¢; o o o "Io o c9 o o o Masbate Province, '¢ © o d o o o
0 co 0 0 0 0, , o o d o >•-- .-- , ,-- LO 0 (_ 00 0 .- , .- 0 0 ¢_0 0 0 ¢,_ 0o d o _ ' , _ -oo o d o _ , '-
_ o d o S '_(,,O _ v-"o ,:9 o o o
Income Range (P} co 0 d 0 oo o (9 d.-- tgJ 0 0
,-- O 0


0_
0LO
0LO
0tO
0tO
0

\!
00
00
00
00
uEl.


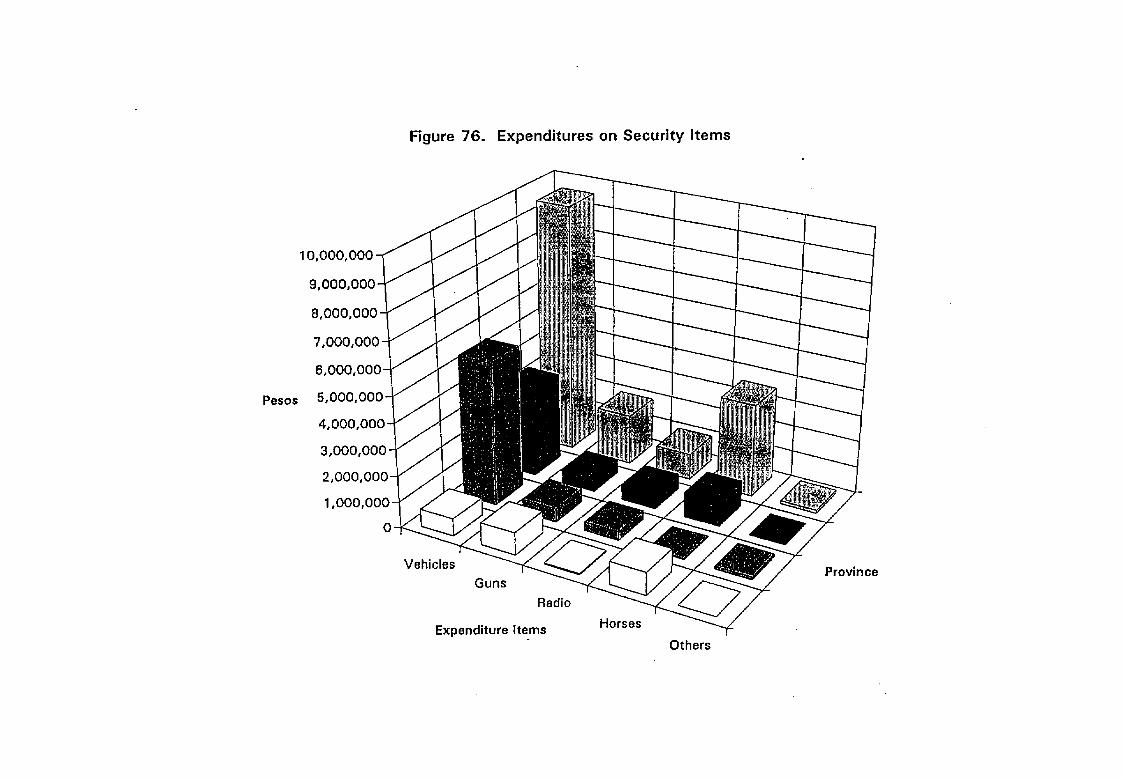
o


oO
0L
t_0
_0
L_
0

h
000'-01_)A
oq
v
in
0u,_
0Ln
0Lo
0(',9-
C_J
(_i
C',,I
,,--
r,-


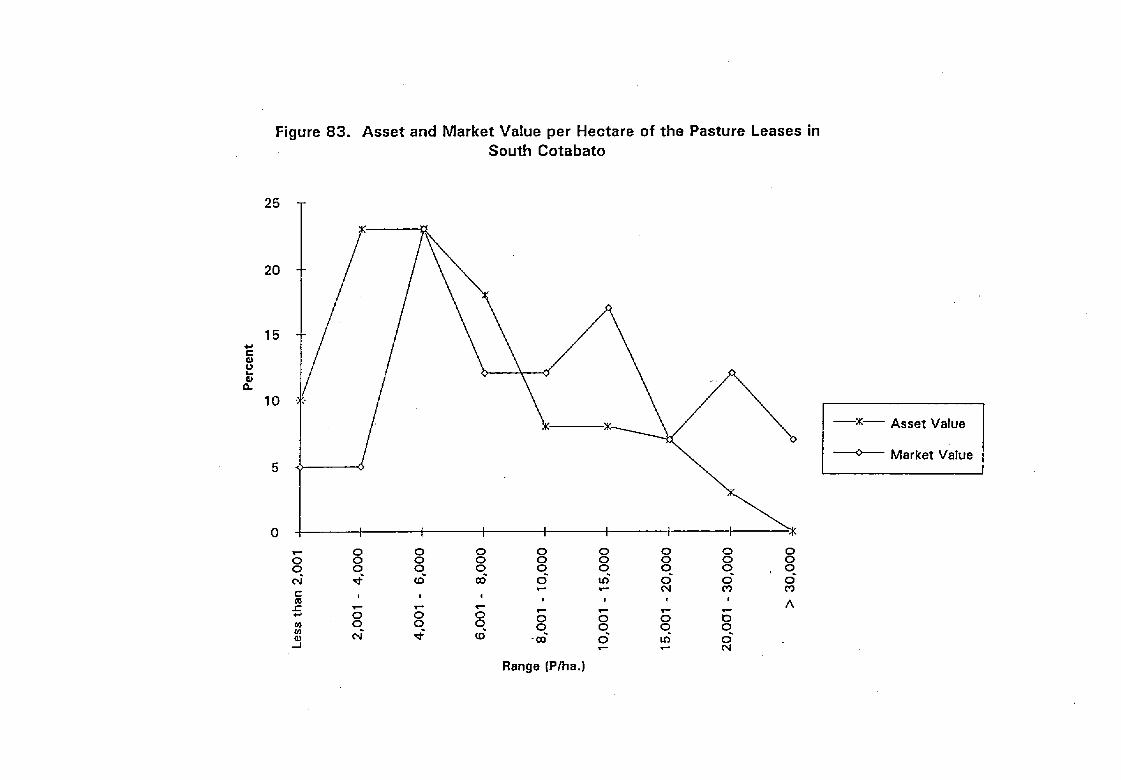
G)
,i
O00'OE
<
..I
m000'0£-
tOO'OE
,_O
00'OZ
"1,00'£
L
0oo
O00'£t
-L
OO
'OL
_1w
-J-r"
m._"-:
0..0
I_
0O00'Ot-
LO0'8
3_"
tm
c
000'8-
1.00"9l,,.,
"0=000'9
-L
OO
'lz
(Ul/}
000"17-
LO
0'_
r_}
LO
0'_ueq
),ssa-I
¢33
tL
U')
0L_
0UO
0C_l
C_I
,-"
,--
_uaoJad

000'0_<
O00'OE-Loo'oL
=
mi
._i
i.
iG)
u
._
O00'OL-LO0'8
'"
0
•-,
o
o000'8
-L
O0'9
09...-:
,_000'9
-L
O0'_
i'_e'L
r"e"
0
ee'"o
>000'_-LO0'_
=rn(n
mm
I_C
mmm_
m
000'_-1.00'L
CO
,mt,_
M.
mO
00'L-
LO
£_:
SS
alpue
00£
0u,%
0u%
0u_
0
),ueo
.Jed

O00S
<
O00S
-O00_
O00_-tO0_
O00g-LO0_
<ID
O00_-L
OO
L
0
O00L
'L.06
oo006
-LOS
008-L
OL
_
OO
L"L
09_
co
009-tO
_m
>m
00_
-LO
_[]
-
00_
LOg
m
OO
g-L
O_
.,.._
II
00_
-L
Ot
,II
001.-
LS


\
oa.
sJaqJ'o
03
J_°u
,poJd
[]d
oJo
JO_
_lqe_,!n
s3,o
useseg-I
t_°IIIIll-
°o
_J=
suJalq
oJd
=_¢_
I_JepJo
_eoead
seonpul
EEm
_
t-U
lsJ,u
euJe^o
JdU
Jl/S_U
euJ],S
e^Uco
•t_
seSeJnoosK]
_
E
u,po
Jd_lL
_eos_o
np
eJ
I_'
"/_J_,snpu
!el_eOo
_,eA!_,o
nJ_.S{)C
]C
O(9103
LO
0t_
0W_
0t_
003
O*J
._1¢_1
_--r-
J_M=

APPENDIX A
SAMPLING DESIGN
The universe of pasture leases for the whole Philippines was obtained from the
records of the Department of Environment and Natural Resources (DENR) on the
updated list of holders of Pasture Lease Agreements (PLAs) and Forest Land Grazing
Lease Agreements (FLGLAs) as of 1991. The list provided information on the number
of leases and area covered by municipality, province, and region. The distribution of
PLAs and FLGLAs across regions was generated to obtain a sense of the structure of
the leases in terms of their incidence and average lease sizes. The resulting distribution
of leases across regions and major island groups is shown in Appendix A: Table 1.
The identification of possible survey areas where the samples were to be taken
made use of the information given by the population distribution. The regions where
pasture leases were relatively prevalent in terms of the number of existing leases were
'identified. The initial choices were Regions II, IV, V, X and XI. Region II was taken
out from the possible sample set with the information that the access to the region was
hampered the destruction of the main arterial highway due to the 1991 earthquake.
With the remaining regions identified, the structure of lease distribution by province
was generated. In each region, the province where pasture leases were most prevalent
were identified and chosen to be the set of sample provinces. The provinces chosen
were Occidental Mindoro for Region IV, Masbate for Region V, Bukidnon for Region
X, and South Cotabato for Region XI. Having chosen the provinces from which to

Appendix Table 1. Distribution of Pasture Leases by Region, Philipines, 1991
Region Number of Area Average Size
Pasture Leases ('000 ha) (ha)
CAR 86 26.4 307.0
I 56 14.0 250.0
II 201 69.5 345.8
III 75 31.0 413.3
IV 204 76.7 376.0
V 110 37.6 341.8
Luzon 732 255. 2 348. 6
VI 28 8.3 296.4
VII 13 7.1 546.2
VIII 2 0.8 400:0
Visayas 43 16.2 3 76. 7
IX 2 2.8 1,400.0
X 88 30.2 343.2
XI 86 49.0 569.8
XII 22 24.1 1,095.5
Mindanao 198 106.1 535.9
PHILIPPINES 973 377.5 388.0
Source: Department of Environment and Natural Resources, 1991
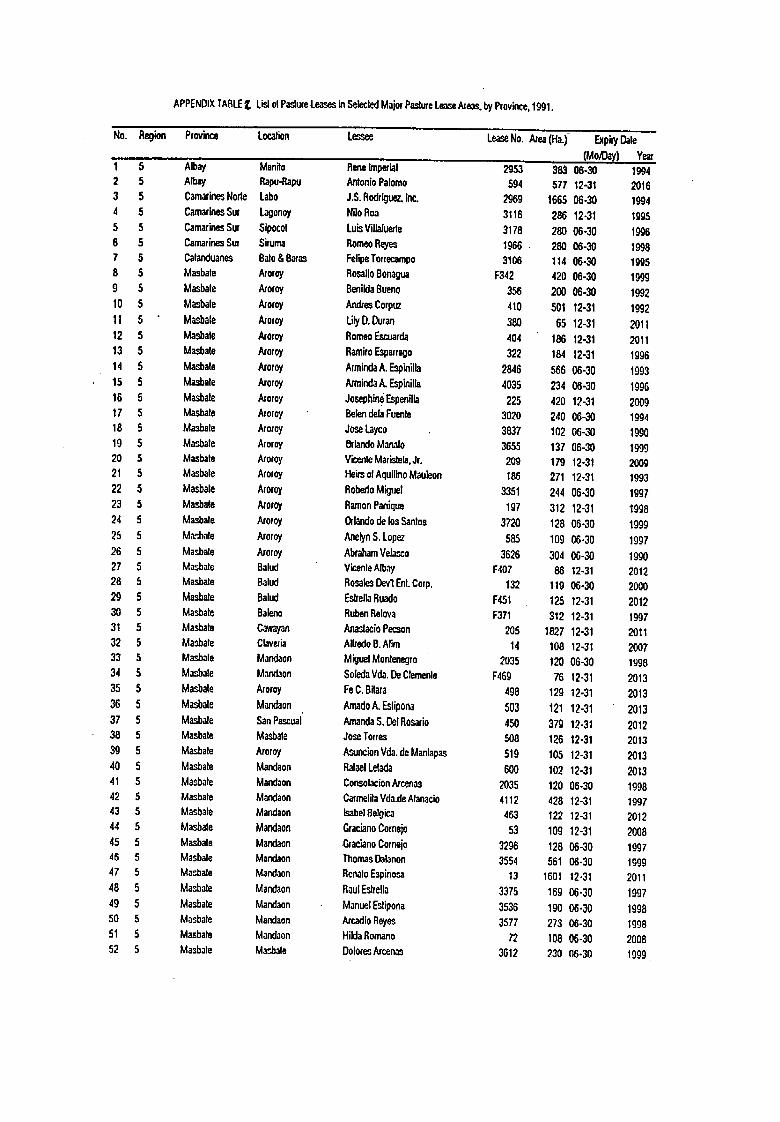
APPENDIXTABLEZ. LislolPaslufet_l_ inSelectedMajorPastureLeaseAreas.byProvince.1991.
No. Region Pzovince Localion Lessee LeaseNo. Area{Ha.) Expi_/Date(MoJl_ay) Y.r
1 5 Albay Man,to ReneImperial 2953 383 06-30 19942 5 Albay Rapu-Rapu AntonioPalomo 594 577 12-31 20163 5 C_madnesNode Labo J.$.Boddguez.lnc. 2969 1665 06-30 1994
4 5 CamarinesSot Lagonoy Ni]oRoa 3116 286 12-31 199.5
5 5 Cama_inesSur Sipocot LuisVillaluezte 3178 280 06-30 19966 5 CamarinesSuf Sirurna RomeoRejes 1966 280 06-30 1998
7 5 Calanduane_ Balo&8aras FelipeTorrecampo 3106 114 06-30 19956 5 Masbate _oroy RosalioBonagua F342 420 06-30 1999
9 5 Masbale .,euoroy BenildaBuena 356 200 06-30 1992
10 5 Masbale Armoy AndresCorpLB 410 601 12-31 1992
11 5 Masbale Arofoy LilyD.Ouran 380 65 12-31 201112 5 Masbale AIoroy RomeoEscuarda 404 186 12-31 2011
13 5 Masbate Axoroy RamiroEsparrego 322 184 12-31 1996
14 5 Ma_ale Aroroy ArmindaAEspinilla 2846 566 06-30 199315 5 Masbate horoy AtmindaA.Espinilla 4035 234 06-30 1996
16 5 Masbate Aroroy Josephin_Espenilla 225 420 12-31 200917 5 Masbate Aroroy BelendelaFuenle 3020 240 06-30 1994
18 5 Masbate Aroroy JoseLayco 3837 102 06-30 199019 5 Masbale Aroroy OrlandoManalo 3655 137 06-30 1999
20 5 Masbate Arofoy VicenteMaristela.J_. 209 179 12-31 200921 5 Masbale Aroroy HeirsofAquilinoMauleon 186 271 12-31 1993
22 5 Maslbate ,'_oroy RobedoMigud 3351 244 06-30 199723 5 Masbate /Umoy RamonPanique 197 312 12-31 1998
24 5 Masbate Aroroy OdanclodelosSantos 3720 128 06-30 1999
25 5 M_J_ale Aroroy AnelynS Lopez 585 109 06-30 1997
26 5 Masbale Armoy AbrahamVela_o 3626 304 06-30 199027 5 Ma.sbate Balud VicenleAlbay F407 86 12-31 201228 5 Mast)ate 8alud RosalesDavlEnt.Corp. 132 119 06-30 200029 5 Masbate Balud Esb'ellaRuado F451 125 12-31 2012
30 5 Masbate Baleno RubenRelova F371 312 12-31 1997
31 5 Masbate Cawayan AnaslacioPecson 205 1827 12-31 201132 5 Morale Clavuia AlfredoB.Afire 14 108 12-31 2007
33 5 Masbaie Mandaon MiguelMontenegro 2035 120 06-30 199834 5 Mz,bale Mandaon SoledaVdo.DeClemenle 1:469 76 12-31 2013
35 5 Ma._ate AJoroy FeC,Bitata 498 129 12-31 2013
36 5 Mat,bole M_ndaon J_adoA.Eslipona 503 121 12-31 201337 5 Marinate SonPa_:ual Amanda.S.OelRosario 450 379 12-31 201238 5 Mad)ale Masbale JoseTorres 508 126 12-31 2013
39 5 Mar,bate Aroroy Asu_ionVda.deManlapas 519 105 12-31 201340 5 Masbate Mandaon RafaelLetada 600 102 12-31 201341 5 Ma,_bale Mendaon Consobcion.a,zcenas 2035 120 06-30 1998
42 5 Masbate Mandaon CarmelitaVda.deAlanacio 4112 428 12-31 199743 5 Masbate Mandaon IsabelBefgica 463 122 12-31 2012
44 5 Masbate Mandaon GracianoCornejo 53 109 12-31 2008
45 5 Masbate Mandaon GracianoCornejo 3296 128 06-30 199746 5 Masbale Mandaon ThomasDalanon 3554 561 06-30 1999
47 5 Ma,_bate Mandaon RcnatoEspino,:,a 13 1601 12-31 201148 5 Ma.sbate Mandaon RaulEstrella 3375 169 06-30 1997
49 5 Ma,:bate Mandaon ManuelEstipona 3536 190 06°30 199850 5 Masbate Mandaon ArcadiaReyes 3577 273 06-30 199851 5 Masbale Mandaon HildaRomano 72 108 06-30 200652 5 Masbate Ma_ale Dolores,_cenas 3612 230 (]6°30 1999

Conl'd
No. Region Province Location Lessee Lea_No.._ (Ha.) ExpiryOate_o/Day) y_
53 5 Marinate Masbale JoseMolila 417 102 12-31 2013
54 5 M_,balo Ma.s_le EmilioEspinosa 3487 385 06-30 199855 5 Masbate Masbale BenjaminMagallanes 3413 686 06-30 199956 5 Masbale Milagros NormsVde.deBajar 44 196 12-31 1998
57 5 Mad>ale Milagros LuzBasunawa 2899 582 06*30 199458 5 Masbale Milagros HeirsolJeorgeE.Bartolabac
59 5 Masbate Milagros ConsueloCaballes 57 322 12-31 200960 5 Masbale - Milagros Ma.FeCarandang 405 220 12-31 2011
61 5 Masbate Milagros CatanduanesAgr.&IndlCorp.62 5 Masbate Milagms NormanK.Codeza.Jr. 382 376 12-3i 199763 5" Masbate Milagros EmilianoEspinosa 2847 629 06-30 1995
64 5 Ma._ale MiCros AlbedoFloresea 3378 271 06-30 1998
65 5 Masbate Milagros JoseAvelinoAgri.Farms,Inc.66 5 Ma.sbate Mibg_'os LudivinaKafigbak 3284 671 06-30 1907
67 5 Ma,sbate Milagros CapitalinaVda.deLegaspi 101 285 12-31 1995
68 5 M,zsbole Milogros M_isleloDevlEnl.Corp. 328 883 12-31 1997
69 5 Ma_afe MiCros JohnMiller 2340 567 06-30 199270 5 Masbate Milagros JovancioT.Revil F467 132 12-31 2013
71 5 Ma.sbale Milagros . JovencioT.Revil F468 140 12-31 201372 5 Masbate Milagms OscarEligario 1865 160 06-30 1993
73 5 Masbale MiCros AnlonioPusing 3196 355 06-30 1995
74 5 Mn_ate Milooros AnlonioRosero 3350 104 06-30 1997
75 5 Madoate MiCros LudivinaKalighak 220 925 12-31 199876 5 Masbale Milagros 7REnterprises(Royalties) 3438 1173 06-30 199377 5 Masbate Mobo Su,'.,,anaV.Lim 126 117 12-31 1993
78 5 Masbale Mobo V'centeLim 127 265 12-31 20IX)79 5 Masbate Mobo EdencioNunez 275 112 12-31 2010
80 5 M_bale SanPascual BenitoChua 4065 323 06-30 199881 5 Masbate SanPascual SenenA,Cleole 2671 112 12-31 201082 5 M_ba/e SanPascJJal JuanCojuangco 60 370 06-30 1992
83 5 Ma_ale SanPascual Jo_ La_'go 345 75 12-31 2011
84 5 Masbate SanPascual AmeliaVda.deLazaro 3808 609 06-30 200485 5 Masbale Uson Juan_oLorena 564 140 06-30 1095
86 5 Ma.,sbate SanPascual BokTiaoOng 3510 504 06-30 199887 5 Ma_ate SanPascual LeopoldoPadilla 3167 158 06-30 199688 5 Masbate SanPascual LeopoldoPadilla 266 174 12-31 2010
89 5 Ma_ale SanP_a.saJal GelacioRivua 3747 344 06-30 1999
90 5 Mast)ate SanPa.,_:ual VicenledelRosario 2665 380 06-30 1998
91 5 Masbate SanPascual CeferinoSanPascual F426 164 12-31 201292 5 Ma.sbate SanPascual FelicitasVda.deSta.Aria 141 198 12-31 200993 5 Masb.',le SanPascuol BlaulioSi,_._ 2944 160 06-30 1994
94 5 Masbale SanPa.._cual HonedodeVua 195 660 06-30 200095 5 Masbale Uson JoseSanchez 3624 257 06-30 1995
96 5 M_bale Milagros FelimonAbelilaIII 490 128 12-31 2013
97 5 Masbale Mandeon SalvedorVda.deArcinas 514 188 12-31 201398 5 Masbate Mandaon LindaR,Al/arejos 517 77 12-31 201499 5 Masbale Mandaon FefminAsilum 416 88 12-31 2014
100 5 Masbate SanPascual BenjaminLucena 236 233 12-31 2014
101 5 Masbale Aforey JoseMedina 565 565 12-31 2015102 5 Masbate Balud PedectaVda.doLopez 570 435 12-31 2012
103 5 Masbale Mandann ManuelEslipona 580 105 12-31 2015
104 5 Masbale Balud RenaloFajardo 591 123 12-31 2015
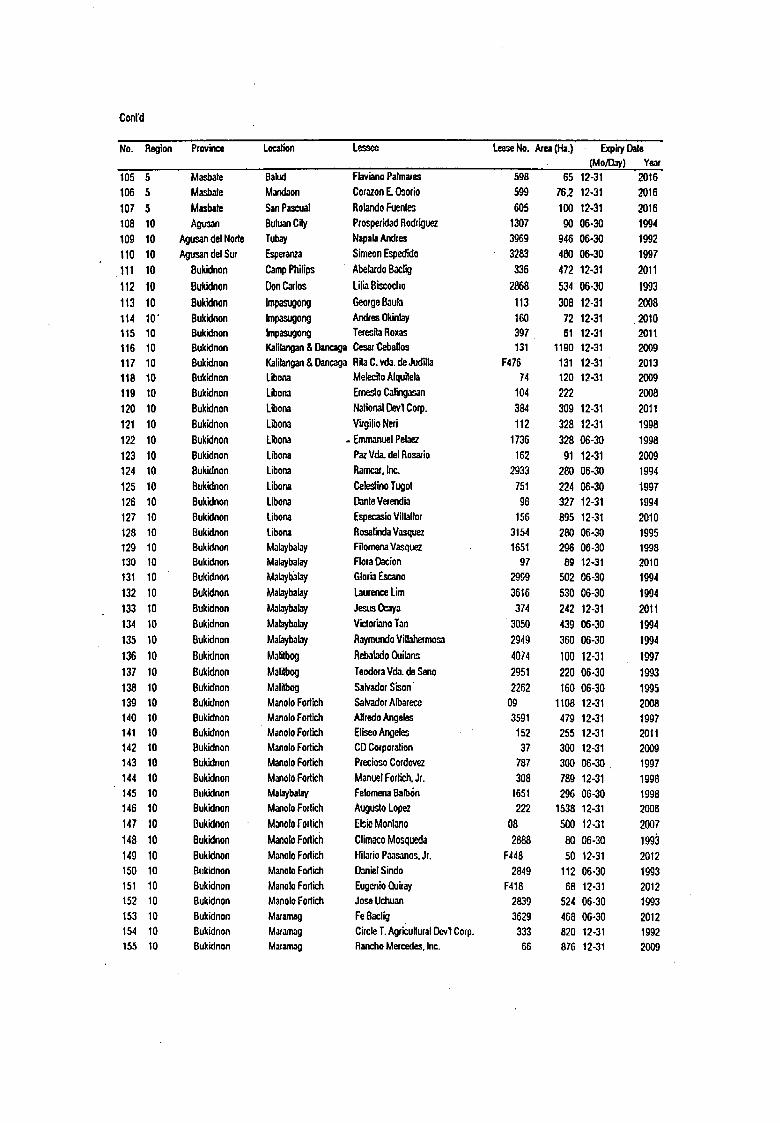
Conl'd
No. Region Province Loc_ion L_ LeaseNo.Area(Ha,) ExpiryDate(Mo/Day) Year
105 5 Masbale Balud FlavbnoPalmares 598 65 12-31 2016106 5 M,z._e M_daon CorazonE.O_mio 599 76,2 12-31 2016
107 5 Masbafe SanPascual RolandoFuenles 605 100 12o31 2016
108 10 Agusan BuluanCity PtospexidadRodriguez 1307 90 06°30 1994109 10 AgusandelNode Tubw NapalaAndres 3969 946 06-30 1992
110 10 AgusandelSur Esperanza SimeonEspedido 3283 480 06-30 1997
,111 10 Bukidnon CampPhilips " Abe_doBaclig 336 472 12-31 2011112 10 Bukidnon OonCados LiliaBE,cocho 2868 534 06-30 1993
113 10 Bukidnon Impasugong GeorgeB_ula 113 308 12-31 2008
114 10" Bukidnon Impasugong AndresOkinlay 160 72 12-31 2010115 10 Bukidnon Impasugong Te_esitaRoxas 397 61 12-31 2011116 10 Bukidnon Kalilangan&DancagaCesarCeballos 131 t190 12-31 2009117 10 Bukidnon Kalilangan& OancagaRitaC.vda.deJudilla F476 131 12-31 2013118 10 Bukidnon Libona MelecitoAIquitela 74 120 12-31 2009
119 10 Bukidnon L_ona EmestoCalingasan 104 222 2008
120 10 Bukidnon L_ona NationalOevlCorp, 384 309 12-31 2011
121 10 Bukidnon Libona VirgilioNeri 112 328 12-31 1998122 10 Bukidnon Libona . EmmanuelPelae,z 1736 328 06-30 1998
123 10 8ukiclnon Libona PazVda.delRosalio 162 91 12-31 2009124 10 Bukidnon Libona Ramc=,Inc. 2933 280 06-30 1994
125 10 Bukidnon Libona Celedinofugot 751 224 06-30 1997126 10 Bukidnon Libona OonteVe_er_lia 96 327 12-31 1994
127 10 8ukidnon Libona Espe_:_sioVillafler 156 895 12-31 2010
128 10 Bukidnon Libona RosalindaVasquez 3154 280 06-30 1995129 10 Bukidnon Malaybalay FilomenaV_que_ 1651 296 06-30 1998130 10 Bukiclnon Malaybalay FloraDacion 97 89 12-31 2010
131 10 Bukidnon Malaybalay GloriaEscano 2999 502 06-30 1994
132 10 8ukidnon Malaybalay LaurenceLira 3616 530 06-30 1994133 10 Bukidnon Mal,,_ybaby J_usOcaya 374 242 12-31 2011
134 10 8ukidnon Malaybalay VictorianoT.',n 3050 439 06-30 1994
135 10 8ukidnon Malaybalay RaymundoVilbhefmosa 2949 360 06-30 1994
136 10 Bukidnon Malilbog RebaladoOJilam, 4074 100 12-31 1997
137 10 Bukidnon Malitbog TeodoraVda.deSeno 2951 220 06-30 1993
138 10 Bukidnon Malltbog SalvadorSison 2262 160 06-30 1995139 10 Bukidnon ManoloFodich SalvadorAIbarece 09 1108 12-31 2008140 10 Bukidnon ManoleFodich AlfredoAngeles 3591 479 12-31 1997141 10 Bukidnon ManoloFodich EliseoAngeles 152 255 12-31 2011
142 10 Bukidnon ManoloFodich CDCmporation 37 300 12-31 2009143 10 Bukidnon ManoloFodich PceciosoCordovez 787 300 06-30 1997144 10 Bukidnon ManoloFodich ManuelFodich.Jr. 308 780 12-31 1998
145 10 Bukidnon Malaybalay FelomenaBalb6n 1651 296 06-30 1998146 10 Bukidnon ManoleFodich AugustoLopez 222 1538 12-31 2006
147 10 Oukidnon ManoloFodich EIc,ieMonlano 08 _0 12-31 2007
148 10 Bukidnon ManoloFortich ClimacoMosqueda 2888 80 06-30 1993
149 10 Bukidnon MonoloFodich HilmioPoasanos,jr. F448 50 12-31 2012150 10 Bukidnon ManoloFodich DanlelSindo 2849 112 06-30 1993
151 10 Bukidnon ManoleFedich EugenioQukay F418 68 12-31 2012152 10 Rukidnon ManoloFodich jo_Uchuan 2839 524 06-30 1993
153 10 Bukidnon Maramag FeBaclig 3629 468 06-30 2012154 10 Bukidnon Mafa_ag CircleT.AgriculturalDe,v'tCorp. 333 820 12-31 1992
155 10 Bukidnon Mar,vnag RanchoMefcedes.Inc, 66 876 12-31 2009

Cent'd
No. Region Province Location ,Lessee LeaseNo.Area(Ha.) ExpiryDate
(io_.) _J__=r.156 10 8ukidnon Maramag TeodmoIsrael 819 87 12-31 2009157 10 Bukidnon Maramag VicenteGarda 2964 518 06-30 1994158 10 Bukidnon Quezon CesarFodich.lnc 122 958 12-31 1994
159 10 Bukidnon Quezon MichaelFodich 285 277 12-31 1994
160 10 Bukidnon Ta_kag RamonAbetasluri 618 420 06-30 1998
161 10 Bukidnon Taiakag EntiqueDy 3836 396 06-30 2000162 10 Bukidnon Talakag JamesFriae 1716 165 06-30 1998
163 10 Bukidnon Talakag JesusLocsin 2387 504 06-30 1994
164 10 Bukidnon Valencia CandAgrieulturalCorp. 192 510 06-30 1995165 10" Bukidnon Valencia LeonilaGamboa 3818 204 06-30 2000
166 10 Bukidnon Valencia DamelrJoFlechanova,Jr. 115 108 12-31 2001167 10 Bukidnon Valencia SofiaVda.deJavier 42 115 12-31 2008168 10 Bukidnon L_ona JulionaGamba 479 108 12-31 2008
169 10 Bukidnon Valencia DemetrioCalva 492 68 12-31 2013
170 10 Bukidnon Maramag FeBaclig 569 456 06-30 1999171 10 Bukidnon Malitbog DatioYap 595 645 12-31 2016
172 10 Bukidnon CagayandeOro ManuelRoa 417 281 12-31 2012
173 10 Bukidnon Taiakag .8eflySoteloMunoz 601 140
174 10 MisamisOriental Cagayande0reCity ConstantineJarauia 3749 113 06-30 1999175 10 Mi.'-',misorienlalCagwandeOroCity FedefieodelPuedo 1635 452 06-30 1999
176 10 Misamisoriental CegayandeoroCity PedroN.Roa F417 350 12-31 2012177 10 Misamisorienlal Claveria Ramcar.lnc, 2919 1000 06-30 1994
178 10 Misamisoriental EISalvador AntonioDongollo 165 88 12-31 1995179 10 Misamisoriental EISalvodor AureoCastrence 1813 260 06-30 1994
180 10 MisamisOriental ElSalwdor CeciliaLiluanas 3506 100 06-30 1998
181 10 M_misOriental Opel BJSOevlCorp. 3247 360 12-31 1996182 10 MisamisOriental Opel BJSDevlCorp. 4096 620 12-31 2007183 10 Misamisoriental Opel EllaY.Denosla F367 74 12-31 2012184 10 MisamisOriental Opel AzucenaEIIoso 239 144 12-31 1998
185 10 MisamisOriental Opel Ma_celinoMaagad 259 95 12-31 1996
186 10 Mi_misO_iental Opel Roma_V_'_es F367 192 06-30 1998
187 10 MisamisOrienlal Opel AmadoVeiez 4098 232 12-31 1997188 10 M_mP_Orienlal Opel RaymundoYanez F402 67 12-31 2011
189 10 MisamisOrienlal Tagoloan MabiniAchas F356 96 12-31 2011190 10 Misam_.Oriental Tagoloan LizadoYap F413 92 12-31 2012
191 10 Misamisoriental CagayandeOro AngeiaVda,deCarmelo 4100 121 12-31 1997192 10 MisamisOrienlal CagayandeOro GuanzonRodrigu_Oevl 3164 191 06-30 1996193 10 Mis_misOriental Misamis AnlonioSerina 571 149 12-31 2015194 10 MisamisOriental Clave_ia Ge_atdoP.Orcullo.Jr. 592 120 12-31 1904
105 10 Mi_'zmEOfienlal J,_,a,'Ln CarmcnZaya_ 613 64 12-31 2016
196 11 DavaodelSur OavaoCity L,S.Sarmiento&Co.lnc. 2885 445 06-30 1993
197 11 DavaodelSur Malalag HeirsolEmmanuelBuenviaje 2861 516 06-30 1993198 11 DavaodelNode Slo.Tomas ManuelaS,Arandia 251 54 12-31 2010
199 11 SouthColabalo Bawing AngelinaVda.deAcharon 85 518 12-31 2011200 11 SouthCotabalo Gen.SantosCity AiejandfoAlcanlara 103 1228 12-31 2001
201 11 SouthColabalo Gen,SantosCity Felici_imo^lcanlara 552 2000 06-30 1993
202 11 SouthCotabato Gen,SantosCity Nica_ioAlcantara 524 1000 06-30 1993203 11 SouthCotabalo Gen.SantosCity TomasAIcantala 543 683 06-30 1992
204 11 SouthColabato Gen.SantosCity AlsonsDay.Inc.Corp. 546 1467 06-30 1992205 11 SouthCotabato Gen.SantosCity MindaAJendido 278 152 12-31 1996
206 11 SouthCotabato G_.SantosCity HeirsofLintangBanisil 3326 430 06-30 1997

Conrd
No. Region Province Localion _,_c Le.,'L,',eNo.^_e,1[Ha.) ExpiryDale
207 il SouthP-olabalo Gen.Santos_City B illsCattleRanch'C'o',lnc. 2995 1224 06-30 1994
208 11 SouthCotabato Gen,SantosCity BuayanCattleRanch 541 1314 06-30 1994
209 11 $outhCotabato Gen.SantosCity HeirsolHermoger_sCahilsot 111 207 12-31 1994210 11 South.Colabato Gen.SantosCity PedroChangco,Jr. 445 f000 06-30 1994211 11 SouthColahato Gen.,SantosCity RodrigoE.Rivera 528 500 12-31 1994212 11 SouthColabalo Gen.SanlosCity Leopoldo(:_a.Jr. 1401 1088 06-30 1996
213 11 SouthColabalo Gen.SanlosCity CaridadDutoga 4039 317 12-31 1995
214 11 SouthColabato C-en.SantosCity LucioFemandez F386 528 12-31 2011215 11 SouthCotabalo Gen.SantosCity DionisifGutieJrez 551 480 06-30 1993
216 11" SouthCotabato Gen.SantosCity I-lacier',d_SanJose 2092 605 06-30 1993217 11 SouthCotabalo Ge_.SantosCity JacovinoJava 288 260 12-31 2010
218 11 SouthCotabato C-en.SanlosCity JosaKho 282 200 12-31 2010
219 11 SouthCotabato TamblerLGen,SantosPantaleonK.Cababayao 504 58 12-31 2013
220 11 SouthColabato Gan.SantosCity BernardoLozano.Jr. F390 400 06-30 1998221 11 - SouthCotabato Gen.SantosCity EduardoLeyson 527 755 06-30 1992
222 11 SouthCotabalo Gen.SantosCity EduardoI.eyson 526 568 12-31 1996
223 11 SouthCotabato Go.SantosCity BemardinoLozano,Jr. 2193 226 06-30 1998224 11 SouthColabato Gen.SanlosCity oMarianaEozano 1024 405 06-30 2003225 11 SouthCotabalo Gen.SanlosCity VoltaireM.Flores 534 400 06-30 1994
226 11 SouthColabato Gen.SantosCity PabloSunglao 118 336 12-31 2006227 11 SouthColabato Gen.SantosCity HeirsolAriande_ Manas 2233 510 06-30 1998
228 11 SouthCotabato Gen.SantosCity DolorioMejorado 3069 530 06-30 1995
229 11 SouthCotabato Gen.SantosCity IsmaelNgilay 3290 122 06-30 1997
230 11 SouthCotabato Gen.SantosCity NazarioB.Guinto 561 203 12-31 1992231 11 SouthCotabalo Gen.SanlosCity Patios CattleRanch 291 520 12-31 2010
232 11 SouthCotabato Gen.SantosCily MelanioRomeso 1330 416 06-30 1993
233 11 SouthColabalo Gen.SantosCity ZuflagiaV_. deSal,_ar 2996 624 06-30 1994234 11 SouthCotabato Maasim FranciscoGiron,Jr. F464 1096 12-31 '1997
235 11 SouthCotahalo G_. SanlosCity SarangganiCattleRanch 548 1987 06-30 1992236 11 SouthCotahalo Gen.SantosCity Tu!aSulanting 4126 108 12-31 1998
237 11 SouthCotabalo Kiamba AnitaCarino 2924 670 06-30 1996236 11 SouthCotabalo Kiamba ChainsawService,Inc. 3269 1935 06*30 1906
239 11 SouthColabalo Kiamba AnlonioDty,'t 1802 756 06-30 1996240 11 SouthColabato Kiamba Gr_orioYabes 2906 680 06-30 1994
241 11 SouthCotabalo Koronadal AduroUy 40 155 12-31 2008
242 11 SouthColobalo Mazsim ArcalDevelopmentInc. 2471 780 06-30 2001243 11 SouthColabato Maasim I..ladjiAhmadBajumid 3074 340 06-30 1995
244 11 SouthCotabato Maasim PriscillaFIorenlino F458 564 06-30 1996
24S 11 SouthCotabato Maasim DomingoCarino 851 626 06-30 1994246 11 SouthCotabalo M._.im Rubi& Sons,Inc. 482 698 12-31 2013
247 1,1 SouthColabato Maasim FloremarAgricultufalDav'lCorp.02 772 12-31 1993
248 11 SouthCotabalo Maasim FloremarAgricullufalDavlCorp. 67 370 12-31 2011249 11 SouthCutahalo Maasim JulioOtarte 120 240 12-31 2009250 11 SouthColabato Maasim AIIonsoRivera 2889 557 06-30 1993251 11 SouthCokLbalo Maasim AllonsoRiver.'= 873 533 06-30 1903252 11 SouthColabalo Maacim SiguelCattleRanchCorp. 3234 1467 06-30 1998
253 11 SouthColabato M,_asim BelchVda,deSi._on 3t19 720 06-30 1997254 11 SouthColabato Maasim PurilaYu 383 500 12-31 2011255 It SoulhColabalo M,_sim EsperanzaAIbano 2926 470 06-30 1994
256 11 SouthCotabalo• Maasim" AlladoCon_JruclionCorp, 2826 1440 06-30 1992
257 11 SouthCotabalo Malungon RomeoAparenle 83 280 12-31 2000
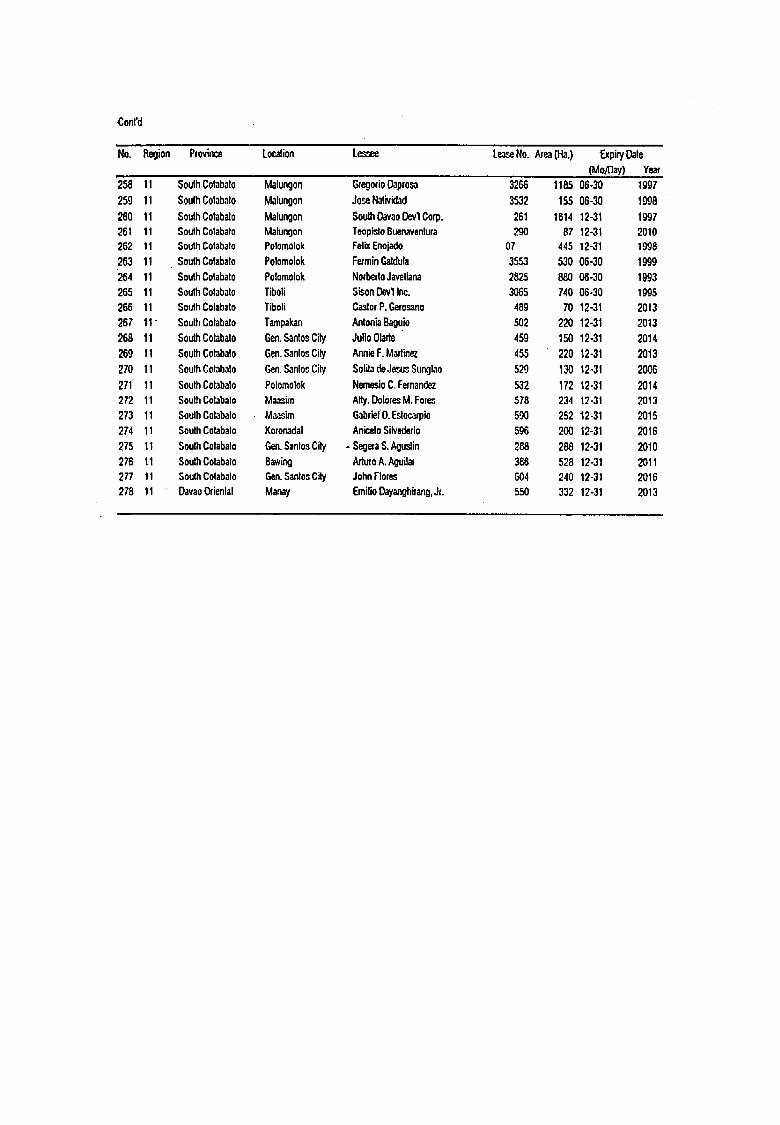
Cont'd
No. Region Province Localion Les_._e Le._No. Area(Ha.) ExpiryOole
(Moray) Year258 11 SouthCotabalo Malungon GregorioDopfosa 3266 1185 06-30 1997
259 11 Sot,lhCalabria Malungon JoceNalividad 3532 155 06-30 1998
260 11 $outhCotabato Malungon SoulhDavaoOevlCorp, 261 1614 12-31 199726t 11 SoulhColabalo Malungon TeopP.JoBuen,wenlura 290 87 12-31 2010262 11 SouthCotabalo PolomoIok FelixEnojado 07 445 12-31 1998263 11 SouthCotabato Polomolok FerminGatdula 3553 530 06-30 1999
264 11 $oulhCotabato Polomolok NmbedoJavellana 2825 880 06-30 1993265 11 SouthCotabalo Tiboli St=onOevlInc. 3065 740 06-30 1995266 11 SouthCotabato Tiboli CaslorP.Gerosano 489 70 12-31 2013
267 11" SouthColabalo Tarnpakan AntoniaBaguio 502 220 12-31 2013268 11 SouthCotabato Gen.SantosCity JuliaOlarto 459 150 12-31 2014
269 11 SouthCotabato Gen.SantosCily AnnieF,Martinez 455 220 12-31 2013
270 11 SoulhCol,lb_lo Gut.Santo":.City SolitadeJe:',usStln0lao 529 130 12-31 2006271 11 SouthCotabato Polomotok NemesioC,Fernandez 532 172 12-31 2014
272 11 SouthCotabalo Ma,,'L_im Airy.DoloresM,Fores 578 234 12-31 2013273 11 SouthColabato Maasim GabrietO.Estocapio 590 252 12-31 2015274 11 SouthCotabato Koronadal AnicetoSilvederio 596 200 12-31 2016
275 11 SouthCotabalo Gen,SanlosCity . SegeraS,Aguslin 288 288 12-31 2010276 11 SouthCotabato Bawing AduroA,Aguilar 386 528 12-31 2011277 11 SoulhCotabalo Gen.SanlosCity JohnFlares 604 240 12-3t 2016
278 11 DavaoOrienlal Manay EmilioDayanghirang,Jr. 550 332 12-31 2013

2
obtain the samples for the planned survey of pasture leases, ocular inspections and a
pre-testing of the survey instnlment were first undertaken in these provinces.
The ocular inspection in Mindoro Occidental revealed that more than half of the
pasture leases were not being operated as they were supposed to be, where the cattle
were being brought down from the pasture lease areas to their lowland farms or even to
the towns for enclosed feeding; or rented out to small farmers for fattening on a profit-
sharing basis. The most prevalent reason given was the inability to operated in the hills
due to peace-and-order (insurgency) problems. No successful pre-testing of the
instrument for farm managers was enacted:as even the farm managers were not in the
pasture lease sites. With these problems met with the planned sample province,
Mindoro Occidental was deleted from the final set of samples. Thus, Region IV was
not represented in he final choice of provinces to be subjected to the pasture lease
survey.
The final set of provinces chosen as survey sites were Masbate, Bukidnon, and
South Cotabato. For these provinces, the updated master list of pasture lease holders
were obtained from the central office of the DENR, and validated with the updated
records in the regional and provincial offices of the DENR. The list of pasture lease
holders in these provinces are shown in Appendix A: Table 2. From the list of pasture
lease holders in each province, samples were drawn randomly, with replacements for
possible non-response also drawn randomly. The number of samples obtained from
each of the provinces are shown in Appendix A: Table 3.
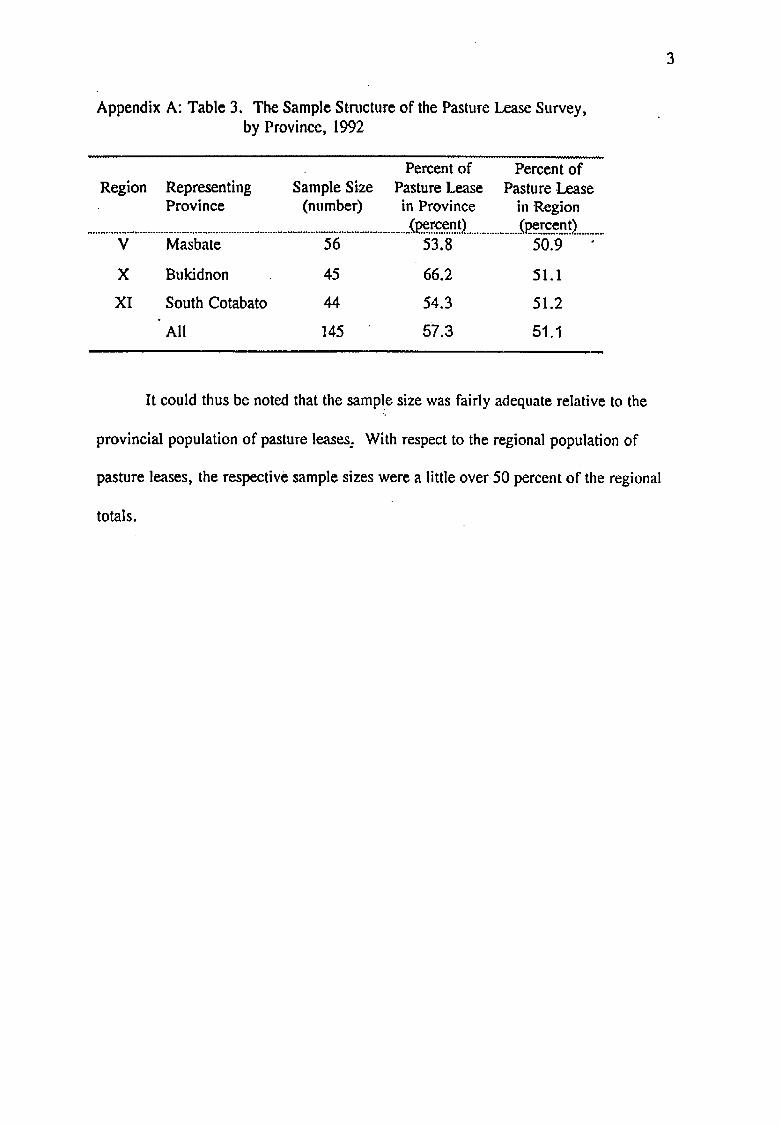
3
Appendix A: Table 3. The Sample Structure of the Pasture Lease Survey,by Province, 1992
Percent of Percent ofRegion Representing Sample Size Pasture Lease Pasture Lease
Province (number) in Province in Region.............................................................................................................................(_r.c.e.nt).......................(Pe.rc.e.n..t)............
V Masbate 56 53.8 50.9
X Bukidnon 45 66.2 51.1
XI South Cotabato 44 54.3 51.2
All 145 57.3 51.1
It could thus be noted that the sample size was fairly adequate relative to the
provincial population of pasture leases: With respect to the regional population of
pasture leases, the respective sample sizes were a little over 50 percent of"the regional
totals.

Appendix B
CARP and the Livestock Sector - Adjustments in thePasture Leases
DESIGN OF THE INSTRUMENT
Overview of the Study_and its Obiectives
T.he cattle industry has been observed to be on a stage of decline throughout the
1980's. While the backyard sector of the industry has experienced modest reductions in
cattle populations, the commercial sector has shown to have exhibited a more rapid
decline, both in the number of farms and in cattle population. A significant number of
commercial farms exist as pasture leases.
The reduction in commercial cattle raising activity has been blamed squarely on the
uncertainties brought about the by the Comprehensive Agrarian Reform Program (CARP)
and the Peace and Order Problem related to insurgency in the countryside. To what
extent these reasons are significant is to be established in the study.
The study would not be able to include those ranches that have already closed
down. Thus, the survey will try to determine how the remaining ranches have been
adjusting in matters of allocation of assets, i.e, between investments in the pasture leases
and investments in some other non-pasture activities. Incomes derived from investments
in non-pasture enterprises would indicate the return from alternative activities relative to
that from the pasture lease.
The study also aims to establish whether the pasture leasing business is still
profitable or not, and determine which factors significantly affect the profitability of the
enterprise. These would mainly be: _, input prices, carrying capacity of the
pasture (i.e. efficiency of land use), herd productivity, and other non-price factors. The
private costs incurred ensuring secu.ri.tv,of farm assets and the rights to exclusive
enjoyment of the benefits form the lease is also to be obtained.
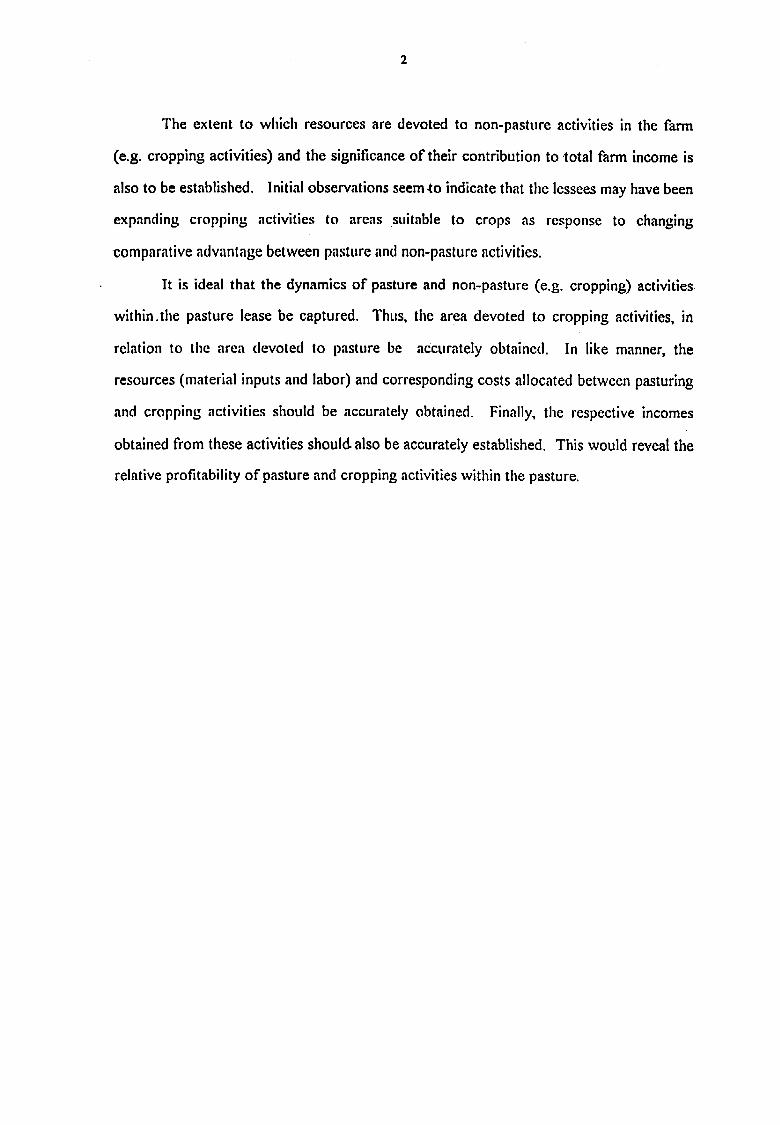
The extent to which resot, rces are devoted to non-pasture activities in the farm
(e.g. cropping activities) and the significance of their contribution to total farm income is
also to be established. Initial observations seem .to indicate that the lessees may have been
expanding cropping activities to areas suitable to crops as response to changing
comparative advantage between pasture and non-pasture activities.
It is ideal that the dynamics of pasture and non-pasture (e.g. cropping) activities
within.the pasture lease be captured. Thus, the area devoted to cropping activities, in
relation to the area devoted to pasture be accurately obtained. In like manner, the
resources (material inputs and labor) and corresponding costs allocated between pasturing
and cropping activities should be accurately obtained. Finally, the respective incomes
obtained from these activities should, also be accurately established. This would reveal the
relative profitability of pasture and cropping activities within the pasture.
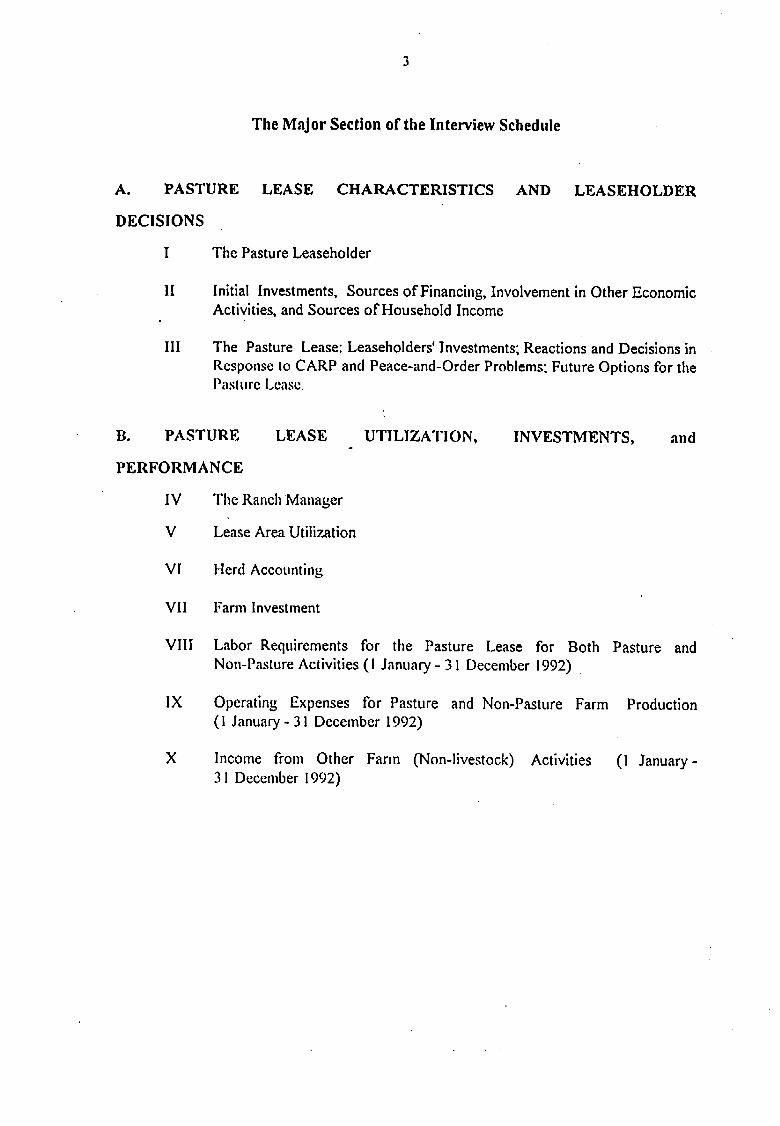
The Major Section of the Interview Schedule
A. PASTURE LEASE CHARACTERISTICS AND LEASEHOLDER
DECISIONS
I The Pasture Leaseholder
II Initial Investments, Sources of Financing, Involvement in Other EconomicActivities, and Sources of Household Income
III The Pasture Lease: Leaseholders' Investments; Reactions and Decisions inResponse to CARP and Peace-and-Order Problems; Future Options for thePasture Lease.
B. PASTURE LEASE UTILIZATION, INVESTMENTS, and
PERFORMANCE
IV The Ranch Manager
V Lease Area Utilization
VI Herd Accounting
VII Farm Investment
VIII Labor Requirements for the Pasture Lease for Both Pasture andNon-Pasture Activities (I January - 31 December 1992)
IX Operating Expenses for Pasture and Non-Pasture Farm Production(i January - 31 December !992)
X Income from Other Farm (-Non-livestock) Activities (1 January-31 December 1992)

The Choice of Resl)ondent
I. The Pasture Leaseholder.
The leaseholder is to be the respondent for the section on Pasture Lease
charactcristics and Leaseholder Decisions.
2. The Ranch Manager.
The ranch manager is to be the respondent for the Pasture Lease Utilization,
Investments, and Performance.
Note: If the leaseholder is also the ranch manager, he would be the respondent for both
sections.
SECTIONS/
QUESTION RATIONALE AND OBJECTIVESNUMBER
SET A. PASTURE LEASE CIIARACTERISTICS AND DECISIONS
I.A THE PASTURE LEASE HOLDER
Objective:
To obtain socio-demographic characteristics of the pasture leaseholder, information on the beginnings of his pasture, and his involvementsin a profession or business outside the pasture leasing activity.
!!. INITIAL INVESTMENTS , SOURCES OF FINANCING,INVOLVEMENT IN OTHER ECONOMIC ACTIVITIES, ANDSOURCES OF HOUSEHOLD INCOME
A. Initial Investments and Loans for tile Pasture Lease
1 - 4 This section would provide an idea on the following:
I. How long it took the respondent to undertake the initial investments;
2. How large were these investments relative to the area leased;
3. Which were the major investment items; and
4. How much of the investments had to be financed from borrowings.
5 This section traces tile structure of these loans made as to theirrespective sources, value, and terms.
6-7 These sections try 1o capture if the problems of obtaining credithave remained the same or changed through time.
Bt, I
B.I, B.2 This section also traces the structure of loans made in the last twoyears (1991 - 1992) and determi,le:
I. how loans lbr the pasture lease have changed over time and
2. how loans lbr the pasture lease dillTerlrromloans for other purposes orbt,siness

C. Involvement in Economic Activities Outside Pasture Leasing
The degree of involvement in non-pasture economic activities maybe reflected in the investments in non-pasture assets, the composition ofliabilities, and the composition of the sources of income.
C.I Non-Pasture Major Assets
Section C. 1 is designed to yield information on the size and value ofthe lessee's assets outside the pasture lease, its geographic concentration ordistribution, and the income derived from it for the whole year of 1992.
C.2 Liabilities
Information on liabilities is needed to obtain the respondent's networth.
D. Sources of Household lucome for Year 1992
Section D is designed to obtain the structure of income sources ofthe household of the pasture lessee. This would provide a picture of therelative importance of the income from the pasture lease, compared toother sources.
Definition: Household income, per source, refers to the take-home payof the income earner before taxes and other deductionsare paid.
Ill. THE PASTURE LEASE
A. Tile Lease Contract and its Terms
Section A is designed to obtain information about the leasehold's
characteristics, the status of improvements within the pasture, theadjustments that are taking place in reaction to perceived unfavorabledevelopments in the environment such as: invasion into the lease by othercontending parties, the Comprehensive Agrarian Reform Program (CARP),and the peace and order situation.
I - 2 Information about tile Lease

3 Grazing Mam_gement Plan (GMP)
Each lessee is required to formulate a GMP which indicates theprojections about the development of the lease, specifying targets from thestart of the contract and onwards into the future, perhaps stabilizing after acertain number of years.
Thus, the GMP must reflect that by the end of the year 1992,certain relevant targets must apply in terms of numbers of hectaresdeveloped as improved pastures, heads of cattle produced per year, cattleinventory, portion of the perimeter fenced, and others.
4- 5 Willingness to stay in the pasture lease/cattle raising business undercurrent rules and regulations, social and business environment.
Objective:
To elicit certain factors which determine the decision to stay in ormove out of the business.
7 The Scarcity of Rental Value of the Pasture Lease and tile Rightsgranged to it by the PLA/FLGLA.
Objective:
To obtain an estimate of the current rental value to the pasturelease.
Rationale:
Since the opening of forest lands to PLAs, the lease rental rates hadalways been PI.00/ha./year. Over the years, it has never increased withinflation. The investigator is convinced that P l.00/ha./year is no longer thescarcity value of the lands but much higher. As estirnate of such a scarcityvalue would be greatly informative for policy on future lease rental rates.

7 - 8 Tile Capit'alized Value of the Pasture Lease nntil its Expiration Date
Objective:
This section aims to capture that part of the value of the pasturelease, which, after accounting for all non-and values, would purely beattributable to the value of the land itself (e.g. improvements) and theprivilege of operating it.
This would be a fair estimate of the capitalize value of the leaseuntil its expiration date.
:,
9- 12 Problems Related to:
a. Rival claims on the pasture lease or a portion of it.
b. Uncertainty brought about by the CARP (Comprehensive AgrarianReform Program)
c. Peace and order; personal security and safety.
Rationale:
The three problems above had always been blames for the closureo1" many commercial ranches and pasture leases, and for the poorpertbrmance of the pasture leases in terms of investments on improvementsand cattle inventory.
Objective:
These questions are designed to specify the nature of theseproblems and obtain information on how real these expressed reasons arein retarding investments in the pasture leases.
13-15 Investments and Expenditures as a Response to Peace and OrderProblems; Investments and Current Expenditures to Enforce Property RightsOver the Pasture Lease.
Rationale:
The enforcement of rights of private citizens is the duty of thegovernment through its police powers. But if the government is unable to

enact its functions, then private citizens (e.g. PLA holders) are forced toincur expenditures for the protection of their rights.
Objective:
This section aims to obtain information on the magnitude and valueof resources that the leases are allocating for the security of their householdand farm assets.

10
SET B: (For tile Ranch Manager)
PASTURE LEASE UTILIZATION, INVESTMENTS, and PERFORMANCE
A. The Ranch Manager
Objective:
To obtain some socio-demographic characteristics of the farmmanager and to obtain consistency ofinformati0n on the leaseholder andthe Lease.
IV. Lease Area Utilization
1 - 5 Objective:
Section IV would provide information on the status of developmentof the pasture lease, especially in terms of area devoted to:
(i) Improved pasture(ii) Crops
V. Herd Accounting ( 1 January - 31 December 1992)
Section V tries to account for the composition of the herd,classified as (i) breeding bulls, (i) breeding cows (at reproductive stage),(iii) heifers (females not yet at reproductive stage), (iv) steers (males), and(v) calves. Non-cattle animals are also to e accounted for.
The various cattle grot, ps are also identified according to their agebracket, designed mainly to facilitate the pricing or valuing of the wholeherd. The accounting period is from 1 January to 31 December 1992.
A. Herd Inventory, Purchases and Sales (1 .Jail.- 31 Dec. 1992)
Objectives:
(i) To obtain an accurate accounting of the number of heads and thevalue of the oe._ORfi._ stock (i Jan. 1992) and closing stock (31Dec. 1992), respectively.

11
(ii) To obtain a measurement of the productive capacity ofthe lease interms of the numbers of cattle sold and change in invento,ry;
(iii) To obtain an aCcurate accounting of the flows that determinechanges in inventory.
Accounting Identity
For each group and age category, the t"ollowing accounting identityshould hold:
Closing Stock = Opening stock + births �purchasesfor herddeaths/losses - sold cattle - slaughtered/given away +transfers from younger class - promotions to older class.
Notes on Price/Head:
The price/head refers to the estimated value of the animal at thatpoint in time, if it were sold at the farmgate level.
(i) For the opening stock, this refers to the 1 January 1992 prices. Forthe closing stock, this refers to estimated value/head at31 December 1992 prices.
Increases in the price per head area expected due to inflation and/orincrease in the real value of the animal due to weight gain.
B. Purchases for Herd (I Jan. - 31 Dec. 1992)
Note_
The information on the number purchased and price/head is alreadyobtainable on the previous section (V.A). The new information that wouldbe extracted from this section would thus be:
(i) Name o1"breed of the cattle purchased,(ii) Source/origin of cattle,(iii) Stated price reference, and(iv) Transport cost per head.
The stated price reference is important to obtain information ontrue cattle prices at the farm level, adjusted for transport costs.

12
C. Sale of Livestock (1 Jan. - 31 Dec. 1992)
The initial information on livestock sold are already in section V.A.The sold cattle are to be classified as SURPLUS or CULLED cattle.
Notes on distinction between SURPLUS and CULLED livestock:
(i) Surplus - those produced and grown as planned and programmed forsale at a designated time or month. From the viewpoint ofoptimality, a longer stay at the farm would beuneconomical, or would not be warranted by the pasture's
carrying capacity.
(ii) Culled - those that are disposed-offfor reasons of less than expectedproductivity. It may include animals who have passed theirprime, injured cattle, or simply unproductive heads. Theyare sold for all they are worth.
Notes on respondent being unable to distinguish between SURPLUSand CULLS:
If no distinction is made between surplus and culled livestock, thenall sold livestock are to be classified as SURPLUS.
C.|_
C.2 Sales of Cattle (Surplus, Culled)
These sections intend to obtain for each category, information on
the tbllowing:
(i) Numbers and weight ranges of cattle sold
(ii) Characteristics of the point of sale referring to:
a. site of sale (farm, livestock auction market, or buyer's centre orlocation)
b. what the buyer is (rancher, small farmer, trader, a company/firm,etc.)
c. distance ofpoint of sale to harm.

13
(iii) Prices and pricing methods, specifically:
a. actual price received;
b. price reference (whether price refers to that received at farm orreceived at buyer's location); and
c. pricing method (i.e. per kilogram liveweight, by age, by ocularinspection or "eyeball calibration", per head, etc.)
(iv) Transport cost - applicable only if the price reference is thatreceived at buyer's location with the rancher shouldering thetransport cost.
VI, FARM INVESTMENT
Farm investments are categorized into:
A. Fixed investments and
B. Supplies/stock of variable inputs as of end December 1992.
A. Fixed Investments
Fixed investments should refer to assets of structures in the ranch
on which expenditures were made in pursuit of the production objective ofthe tarm
Fixed investments are classified into expenditure on:
!. Land Improvement2. Construction of Physical Facilities3. Equipment4. Other Physical Structures5. Livestock information obtained from Opening inventory (1 Jan.
1992) plus net additions to the stock.
These should include only assets which still had productive valueuntil the end of 1992. Thus, the list should exclude structures or
equipment which are already obsolete or exhausted productive life.
t4
Notes on the informatio n required for each investment item:
a. On year(s) undertaken/acquired
The schedule allows for investments that have been staggered. If
the staggering exceeds four years, then just the three major investmentyears according to expenditure incurred.
b. On size/quantity/number of investment items
The physical traits in which the investment items would bemeasured differ depending on the type of investment. As a general guide,the following units of measurement should be followed:
(i) area coveredl in _hectares- for land related improvements as well asfor fencing structures
(ii) number of units for physical facilities, equipment, and otherstructures
(iii) number of heads - for livestock.
c. On Cost/Expenditure Incurred
This refers to the peso value of the investment item at the time ofinvestment.
d. On ye'.lrs more to last (from 1992)
This refers to the estimated remaining productive life of the asset.If the asset's life expires this year (1992), then the correct entry should bezero (0).
B. Supplies/Stock of Variable Inputs (as of 31 Dec. 19920
Section B includes the stock remaining, as of end 1992, of thevariable inputs the farm uses in the production of cattle and other crops.This includes the stock of the following:
1. Feed concentrates
2. R.oughage

15
3. Planting materials for pasture grasses (sees, cuttings)4. Fertilizers (for grasses and other crops)5. Veterinary supplies6. Other supplies (for cattle and crop production).
The supplies have either been bought or produced at the farm. Ifbought, the market price should be obtained, if produced at the farm, thevalue of the stock as input to the production process, at the farmgate level,should be imputed. From here, the value per unit could be obtained.
VIII.. LABOR REQUIREMENTS
A Composition of Workers
i - 3 Objectives:
This section aims to obtain information on the following:
(i) The total number of workers employed- i.e. the employmentgenerating capacity of the farm - both family and hired;
(ii) The structure of hired workers according to status: regular orcontractual;
(iii) The division of labor resources between livestock/pasture activitiesand non-livestock/non-pasture activities e.g. cropping activities).
Note: The division of labor between livestock/pasture activities andnon-livestock/non-pasture activities will serve as check on the relativeimportance of non-livestock income generating activities in the pasturelease.
B & C Labor Utilization (! Jan.- 31 Dec. 1992)
B.I R,egular Hired workersB.2 Contractual/Seasonal Hired workers
B.3 Regular family workersB.4 Contractual family workers

16
Objective:
This sectionaims to obtain informationon the following:
I. The common classification of workers into groups according tomajor functions;
2. The distribution of regular hired, contractual/seasonal, and familyworkers according to such major groupings;
3. The average wage rate (P/day) or salary (P/month) for each workerfor each category; and
4. Labor expenditures for each category, to arrive at total laborexpenditures for the year 1992.
Note:
In the final analysis, the important set of information that is desiredto be extracted are:
(i) Number of workers employed(ii) The relevant compensation (wage/day or salary/month) and(iii) The annual equivalent of the compensation.
Thus, the grouping from the viewpoint of the employer (ormanager) should work as an aid to simplifying classification andaggregation purposes. From the perspective of simplification in computingannual labor expenditures per group, homogeneity according to wage ratesor salary per group would facilitate calculations.
IX OPERATING EXPENSES FOR PASTURE AND OTHER FARM
PRODUCTION ACTIVITIES (1 JAN. - 31 DEC. 1992)
The major categories of operating expenses identified are thoseassociated with tile tbllowing:
A. Pasture improvementB. Livestock Care
C. Operation, maintenance, repairs of equipments, machineries, andfacilities
D. R,entals

17
E. Interest of loans
F. Other material expenses for other farm production activities, e.g..cropping.
The items identified in this section excludes labor expendituresassociated with putting to use these material inputs. The non-materialinputs included here are"External Professional Services", measured innumber of heads of cattle serviced for the Year.
Notes on the following information required:
(i) Quantity, number - unless specified, the respondent should specifythe appropriate units used.
(ii) Price, Cost per unit - this refers to the buying price actually paid.
(iii) Price reference - the stated price either refers to that paid if:
0- the material is delivered to the ranch/farm by seller andseller shoulders transport cost, or
I - the material is fetched by buyer from the market and buyershoulders transport cost.
Notes on Dealing with transport costs
There is no separate entry for transport costs incurred for fetchingthe material inputs to the market. There is, however, information on
transport costs incurred in purchasing from, and selling to, the market.
Expenditure items in IX should embody all transport costs incurredin fetching and delivering cattle and in fetching production supplies fromthe market. After deducting cattle transport costs, the remaining should beattributed to transport costs incurred in fetching material inputs from themarket.
X. INCOM E FROM OTIi ER FARM (NON-LIVESTOCK)ACTIVITIES
S:dcs of crops and olhcr farmoulpul.
When part of the pasture lease is devoted to crops for either fodder(animal feed) or lbod purposes (or both), then the farm generatesadditional income.
18
If t.he output is sold to another party, the price received per unit is
to be directly obtained.
If the _utput is used or consumed within the farm, the value per
unit if.purchaged at the farm level is to be imputed.