compositional and structural factors that influence hydrogen … · 2018-06-18 · ferrous physical...
TRANSCRIPT

Compositional and Structural Factors that Influence Hydrogen Induced Cracking and Hydrogen
Flaking in Steels
Allan Arenas and Shuai Cai Advisor: C. Isaac Garcia
Ferrous Physical Metallurgy Group MEMS Department
Image Quality or Inverse Lattice Distortion
LTP
HTP

Acknowledgements
To all the members of the Ingot Metallurgy Forum for their support and participation to make this program possible. The expected benefits of this program are to provide a Road-Map to increase the understanding and to control the metallurgical factors responsible for Hydrogen delayed failures (HDF) and Hydrogen induced cracking (HIC) in high alloyed steels. This program will also provide the education and training of graduate and undergraduate students interested in ferrous physical metallurgy.

• Objective • Background • Experimental Procedure
o Chemical Composition o Processing Information of As-received samples o Sample Preparation o Microstructural Analysis
• Results to Date • Discussion • Future Work
Content

Relevance to Goals and Objectives This research effort directly targets the following technology areas: • Assessment of alloy design, processing and solute
segregation. • Microstructural description and quantification. • Stereology and chemical description of non-metallic
inclusions and precipitates. • Transformation behavior, continuous cooling and/or
isothermal transformation. • Better understanding to reduce or eliminate hydrogen
embrittlement in large forgings.

Hydrogen Induced Cracking and Hydrogen Delayed Cracking
The exact mechanism of hydrogen embrittlement is “not well-known”. The initial step is the same: penetration of atomic hydrogen into the metal structure. Most of the mechanisms that have been proposed for hydrogen embrittlement are based on dislocation slip interference by dissolved hydrogen. This slip interference may be due to accumulation of hydrogen near dislocation sites, micro-voids, non-metallic inclusions, retained austenite and low temperature transformation products.
HE Domain
Environment Mechanical and Electrochemical
Effects
Materials

Hydrogen Induced Cracking (HIC) Susceptibility to HIC • P, S, Ni and Mn concentration – segregation and/or
promote retained austenite during transformation. • Slab/Ingot Reheating Temperature- Austenite grain
size. Grain boundary segregation- hardenability • Thermal Path (CCT or ITT) – decomposition of
austenite & transformation products. • Additional tempering treatments – softening,
precipitation hardening, retained austenite decomposition.

Proposed Program
Year 1 Year 1
Year 2

Study the Effect of TMP and Thermal Path on Transformation during CCT & ITT
F-start P-final
P-start
B-start B-final
YEAR 2

Experimental Procedure
NDE/NDT – Microstructural Analysis

Two different steel grades has been selected for this study. Since the start of the project 3 companies have provided samples. These samples have different shapes, process parameters and small variations on chemical composition. The ID of the companies has been designated as A, B and C according to the sample reception date.
Process Parameters
Company Grade Sample Forged Process Condition
A 4340 1 Yes Normalizing – Austenizing - Oil Quench - Temper
A 4340 AC No As Cast
A 8630 1 Yes Normalizing – Austenizing - Oil Quench - Temper
A 8630 AC No As Cast
B 4340 05-03 Yes Ingot – Soaking – Forging – Air Cooling
B 4340 05-02 Yes Ingot – Soaking – Forging – Air Cooling
B 8630 All of them.
Yes Ingot – Soaking – Forging – Air Cooling
C No Information is available

Chemical Composition (wt%)
Element Company A
4340 S1
Company A 4340 AC
Company B 4340 05
Company B 4340 87
Company A 8630 S1
Company A 8630 AC
Company B 8630 99
C 0.42 0.42 0.42 0.41 0.30 0.32 0.3
Mn 0.78 0.76 0.78 0.78 0.96 0.94 0.89
P 0.010 0.009 0.007 0.009 0.008 0.010 0.009
S 0.017 0.014 0.002 0.018 0.01 0.006 0.008
Si 0.29 0.32 0.28 0.34 0.35 0.30 0.32
Ni 1.72 1.74 0.86 1.67 0.85 0.85 0.44
Cr 0.90 0.86 0.86 0.86 1.10 0.99 0.47
Mo 0.29 0.26 0.29 0.22 0.48 0.43 0.16
V 0.052 0.006 0.005 0.006 0.008 0.007 0.002
Al 0.020 0.03 0.028 0.028 0.020 0.026 0.03
Cu 0.19 0.19 0.18 0.17 0.19 0.17 0.16
H 1.6ppm - - - 1 ppm -

HIC in welding
- Cold cracking/ HAZ cracking Source for hydrogen entrapment -Moisture -Organic compounds - Occurs 72 hrs. after welding - At 450 F hydrogen diffuses at rate of 1
inch /hr. - At 220 F - 1 inch / 48hr - At RT 1 inch /2 weeks
Hydrogen blistering
- Nucleation of hydrogen at internal defects - Rupture of material
Sulfide Stress Cracking
- If hydrogen sulfide is present will cause entry of hydrogen into the component (i.e. Sour service environment)
Examples of HIC manifestation

HIC HIC

EDS Analysis of undissolved FeNb paticles

The use of UT for flaw detection is not new and has been used for years as a quality control method. Between the most common aplications of UT systems is possible found the inspection of raw materials, casting, and forgings, engineering metals, composites, ceramics, and polymers, Carbon/Carbon composites, Carbon/Epoxy composites, Graphite-epoxy sandwich panels, Automotive clutch facings, Automobile brake pads, Asphalt concrete, Weldments, adhesive bonds, pipe, etc..
UT Immersion Tank

UT techniques have been used primary for defect detection but another major application is to help in the understanding and characterization of microstructures, grain sizes, etc.

A-scan
Flaw zone
Safe zone
Clean sample Sample with indication
C-scan
The different UT techniques mesure how a wave sound travels in a material. Changes in the material macro and microstructure generates changes in the wave sound propagation. These changes indicated that something is interfering with the sound wave propagation in the material. The level of absorption of the sound wave depends on the nature of the interfering factor. Our main interest is to identify the location of these changes generated by microstructural differences.

Special chemical etchants used in this study:
Etchant Composition Result
Nital 100 ml ethanol 99%, 10 ml nitric acid 65% General microstructure
LePera 50 ml Na2S2O5 1% in aqueous dilution, 50 ml picric acid 4% in ethanol
Retained austenite in White, Bainite in Brown
Beraha 50 ml Na2S2O5 1% in aqueous dilution, 50 ml picric acid 4% in ethanol
Colouring over the non ferritic structures
Kalling 33 ml destilled water, 33 ml ethanol 99%, 33 ml hydrochloric acid 32%, 1,5 g copper(II)-chloride
Grain boundaries, general structure
Nital + Sodium metabisulfate
Pre-etching with Nital, wet etching with Na2S2O5 10% in aqueous dilution
Different tonalities between non ferritic structures

DIC
Special etchants
SEM
EBSD - IPF
Using different metallographic techniques is possible to analyze the microstructure and the Hydrogen effect on these.

M-A
M-A

AHSA steel stained in boiling alkaline
chromate solution
New F α'
Old F
New F
α'
Old F
20mm

NDT/NDE was used as a tool to aid in the location of possible “indications – microstructural variations” before the microstructural characterization.

h= 129.42mm (5.09 in)
L= 105.75mm (4.13in)
W= 104.8mm (4.12in)
h
L
W
h= 130.01mm (5.11in)
L= 105.45mm (4.12in)
W= 104.3mm (4.13in)
h
L
W
4340
8630
h
h
L
W
W
L
l
l
h= 30mm (1.18 in)
L= 372.2mm (14.64in) l= 354mm (13.9in)
W= 97.3mm (3.83in)
108-03
AM988
h= 34mm (1.33 in)
L= 280.4mm (11in) l= 264mm (10.4in)
W= 78.5mm (3.09in)
COMPANY A

xx499-1-02
xx499-3-02
xx499-4-02
h= 40mm (1.57 in)
L= 149.67mm (5.9in)
W= 149.6mm (5.9in)
L
h
W
h= 51.7mm (2.03 in)
L= 148.92mm (5.9in)
W= 147.6mm (5.9in)
h= 66.7mm (2.62 in)
L= 150.1mm (5.9in)
W= 149.7mm (5.9in)
L
h
W
L
h
W
COMPANY B
xx405-1-03
h= 55mm (2.16 in)
D= 246mm ( 9.68in)
xx405-1-02
h D
h D h= 58mm (2.28in)
D= 244mm ( 2.60in)
D
h h= 46mm (1.81 in)
D= 207mm (8.15in )
xx487-1-02

h
L W
h
L
W
h= 6in L= 9in W= 5in
COMPANY C xxx201L
xxx172LL
h= 0.75in L= 9in W= 5in

The scan was performed using a bidirectional scanning where the acquired data is taken each 0.2mm. 1, 5 and 10Mhz transducers were used for the characterization. Z distance (the distance from the sample surface to the transducers) vary according to the sample thickness. Z distance was the same for all the used transducers (minor gate adjusting is needed) in order to keep the scanning conditions uniform. The samples were scanned trough the thickness ( h dimension according the sample drawings).
Scanning Direction
Z distance

Using the different transducers is possible see that using the 1 Mhz transducer is possible obtain more contrast between the lectures. This is the 8630 Company B J2499- 3-02 sample. Scanning parameters were the same for all the transducers. The sample orientation was also the same. Due this higher response in the 1Mhz transducer the following results correspond to 1Mhz signals.
20mm 1 Mhz
20mm 5 Mhz
20mm 10 Mhz

Sample Sectioning surface preparation
Macroetching
Sectioning Faces preparation Mounting

Results

Sample Gate size was selected to analyze 10mm sections looking for variations in the signals for 4340 Company A sample
Surface 10mm 20mm
30mm 40mm 50mm
60mm 70mm 80mm 90mm
100mm 110mm Bottom
Colors means the differences in the acquired waves. Homogeneous material would show a single color with different saturations. Different colors means significant signal responses.

10mm 10mm
50mm
29.4HRC
31.8HRC
29.4 HRC
31.8 HRC
Company A- 4340 Microstructures

-35
-30
-25
-20
-15
-10
-5
0
0 20 40 60 80 100 120 140
110mm
10mm
110mm
Pea
k A
mp d
B
31.8HRC
Depth mm
50mm
31.8 HRC
Company A- 4340 Microstructures

Sample Gate size was selected to analyze 5mm sections looking for variations in the signals for 4340 Company B sample
Surface 5mm 10mm
15mm 20mm 25mm
30mm 35mm 40mm
Bottom Colors means the differences in the acquired waves. Homogeneous material would show a single color with different saturations. Different colors means significant signal responses.

5mm
22.7HRC 32.9HRC
32.9 HRC
22.7 HRC
Company B 4340 Microstructures

25mm
20mm
32.9HRC
31.7HRC
32.9HRC
31.7HRC
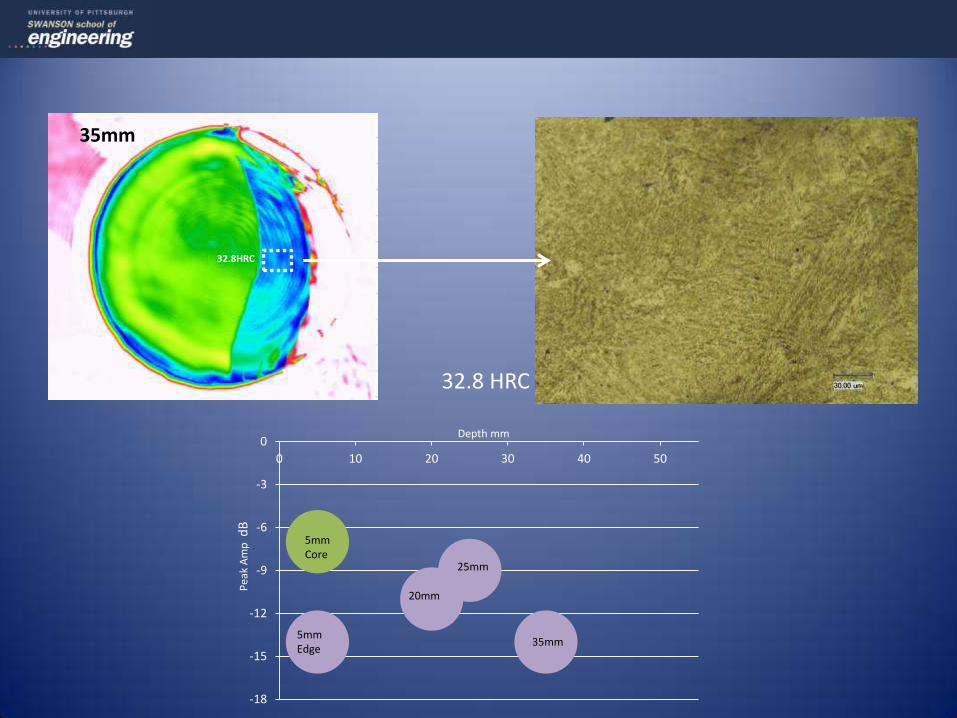
-18
-15
-12
-9
-6
-3
0
0 10 20 30 40 50
35mm
32.8HRC
Pea
k A
mp d
B
Depth mm
5mm Edge
5mm Core
20mm
25mm
35mm
32.8 HRC

Sample Gate size was selected to analyze 10mm sections looking for variations in the signals for 4340 Company B disc sample
Surface 10mm 20mm
20mm
Bottom
30mm 40mm 50mm
Colors means the differences in the acquired waves. Homogeneous material would show a single color with different saturations. Different colors means significant signal responses.

10mm
20mm
30.3HRC
31.0HRC
30.3 HRC
31.0 HRC

-25
-20
-15
-10
-5
0
0 10 20 30 40 50 60
Depth mm
50mm
31.4HRC
Pea
k A
mp d
B
20mm
10mm
50mm
31.4 HRC

-35
-30
-25
-20
-15
-10
-5
0
0 20 40 60 80 100 120 140
Pea
k A
mp d
B 50mm
100mm 10mm
10mm
110mm
50mm
100mm
-25
-20
-15
-10
-5
0
0 10 20 30 40 50 60
Depth mm
J2487-1-02 Core J2487-1-02 J2405-1-02
-11.2 dB 20mm J2487-1-02 -13.97dB 35mm J2487-1-02 -13.34 dB20mm J2405-1-02
22.7HRC
32.9HRC
32.9HRC 31.7HRC
32.8HRC
30.3HRC
31.0HRC
31.4HRC
31.8HRC
29.4HRC 29.3HRC
4340 company A
-15.0 dB 10mm Company A
Depth mm
Pea
k A
mp d
B
Signal response Peak Amplitude and Hardness between the 4340 samples

Signal response Peak Amplitude and Hardness between the company A samples
-32
-27
-22
-17
-12
-7P
eak
Am
p d
B
10mm
10mm
50mm 110mm
50mm
100mm
8630 4340
* Same scanning parameters were used for both samples.
31.8HRC
29.4HRC 29.3HRC
27.6HRC
26.7HRC
27.3HRC
The microstructures generated by 8630 steel seems to produce lower signal attenuation than the microstructures generated by 4340 steel. Company A samples where used for this analysis cause have similar process and shape between them.

0
10
20
30
40
50
60
70
-35 -30 -25 -20 -15 -10 -5 0Peak Amp dB
Har
dn
ess
HR
C
Ferrite
Pearlite – Lamellar structure
Possible M-A Pro eutectoide
cementite
Signal response Peak Amplitude, Hardness Microstructure.
The microstructures corresponding to company B samples from 4340 and 8630. For both grades the Pearlitic structures are very close in their response even when chemical composition is different.

Microstructural Analysis OM and SEM results

xx499-1-02 Company B 8630 Microstructures
Inclusion Size Avg: 52microns
2% Nital
Le Pera
SEM
No Etching
262.7HV

Inclusion Size Avg: 49.7microns
2% Nital
Le Pera
SEM
No Etching
xx499-3-02 Company B 8630 Microstructures

Sample 8630

Inclusion Size Avg: 42.11 microns
2% Nital
Le Pera
SEM
No Etching
xx499-4-02 Company B 8630 Microstructures

Element % Wt
Mn 47.42
S 27.51
Fe 15.16 *
Others 9.91*
8630 Company B Inclusions Chemical Composition
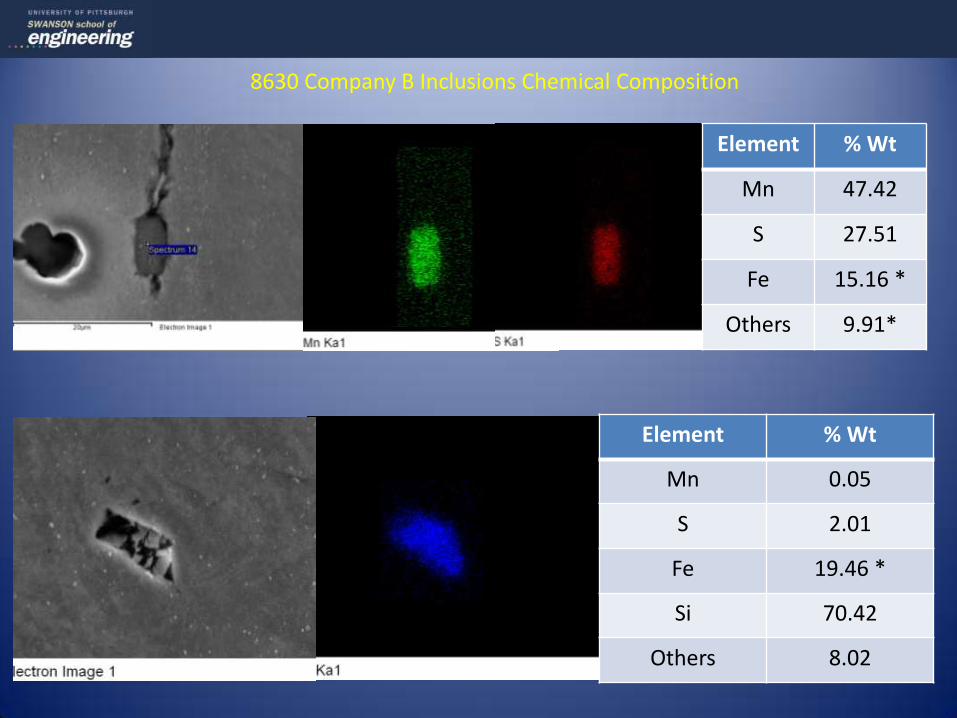
Element % Wt
Mn 0.05
S 2.01
Fe 19.46 *
Si 70.42
Others 8.02
Element % Wt
Mn 47.42
S 27.51
Fe 15.16 *
Others 9.91*
8630 Company B Inclusions Chemical Composition

Company B Micro Hardness According Present Microstructures
XX405-1-02 (4340) Micro Hardness
XX499-3-02 (8630) Micro Hardness

XX405-1-02 (4340) Microstructure

XX405-1-02 (4340) Microstructure

XX405-1-02 (4340) Microstructure

4340

8630 Microstructure

8630 Microstructure

8630 Microstructure

Summary (6 months progress report)
Note: No all the samples were received in May.

Step A 8630 A 4340 B4340 1 B4340 2 B 4340 3 B 8630 1 B 8630 2 B 8630 3 C 1 C 2
UT 1Mhz Scan DONE DONE DONE DONE DONE DONE DONE DONE DONE PENDING
UT 5Mhz Scan DONE DONE DONE DONE DONE DONE DONE DONE DONE PENDING
UT 10Mhz Scan DONE DONE DONE DONE DONE DONE DONE DONE DONE PENDING
Sectioning DONE DONE DONE DONE DONE DONE DONE DONE DONE PENDING
Grinding/ Polishing DONE DONE DONE DONE DONE DONE DONE DONE DONE PENDING
Nital Etching DONE DONE DONE DONE DONE DONE DONE DONE DONE PENDING
Vickers Hardness Measurement
DONE DONE DONE DONE DONE PENDING DONE DONE DONE PENDING
Inclusion Size Measurement
DONE PENDING DONE DONE DONE DONE DONE DONE DONE PENDING
Le Pera Etching DONE DONE DONE DONE DONE DONE DONE DONE DONE PENDING
Modified Sodium Metabisulfite
PENDING PENDING DONE DONE DONE PENDING PENDING PENDING PENDING PENDING
Modified Le Pera Etching PENDING PENDING PENDING PENDING PENDING PENDING PENDING PENDING PENDING PENDING
SEM Inclusions analysis PENDING PENDING DONE DONE DONE PENDING PENDING PENDING PENDING PENDING
SEM Microstructure PENDING PENDING DONE DONE DONE PENDING PENDING PENDING PENDING PENDING
SEM-FEC (WDS) PENDING PENDING PENDING PENDING PENDING PENDING PENDING PENDING PENDING PENDING
Hyper Probe PENDING PENDING PENDING PENDING PENDING PENDING PENDING PENDING PENDING PENDING

Future Work A JEOL JXA-8530F (FEG) "Hyperprobe" electron probe microanalyzer (EPMA-electron microprobe analyzer) will be used in this study.
Specifications: Available WDS analyzing crystals on the five-spectrometer channels are: Gas-flow, P-10: LDE1 6-10 (Ka), 20-29 (La) or TAP 8-15 (Ka), 24-41 (La), 57-80 (Ma) Gas-flow, P-10: LDE2 5-8 (Ka), 20-29 (La) or TAP 8-15 (Ka), 24-41 (La), 57-80 (Ma) Sealed, Xenon: PETJ 13-26 (Ka), 36-66 (La), 71-92 (Ma) or LIF 19-38 (Ka), 48-93 (La) Sealed Xenon: PETL 13-26 (Ka), 36-66 (La), 71-92 (Ma) EDS Detector: JEOL SDD (silicon drift detector ) - Silicon Drift x-ray detector with 10 mm2 active area; 133 eV resolution. Detects Boron thru Uranium.


Atomic % vs. Spot Number

Weight% vs. Spot Number

