compositional analysis of microbial communities …
TRANSCRIPT
DEVELOPMENT AND COMPOSITIONAL ANALYSIS OF MICROBIAL COMMUNITIES SUITABLE FOR
ANAEROBIC DIGESTION OF CARROT POMACE.
by
SARAHI LORENA GARCIA GARCIA
(Under the direction of Keshav Das)
ABSTRACT
Depletion of energy and environmental pollution are two of the major problems the world is
currently facing. Anaerobic digestion of organic wastes offers a solution to both problems because it
converts the organic waste material into methane which is a combustible gas and can be a renewable
energy source. However, knowledge about the microorganisms involved in the process is still very
limited. In this study a microbial community suitable for anaerobic digestion of carrot pomace was
developed from inocula obtained from natural environmental sources. The changes along the process
were monitored using pyrosequencing of the 16S rDNA gene. As the community adapted from a very
diverse natural community to a specific community with a definite function, the diversity decreased
drastically. The bacterial population in an anaerobic reactor was found to be more diverse than the
archaeal population. Major bacterial groups in the anaerobic digestion were Bacilli (31% ‐ 45.3%),
Porphyromonadaceae (12.1% ‐ 24.8%) and Spirochaetes (12.5% ‐ 18.5%). The archaeal population was
mainly represented by an OTU that is 99.7% similar to Methanosarcina mazei. Failures in the methane
production were related to shifts in bacterial populations and loss of methanogens.
INDEX WORDS: Anaerobic digestion, Carrot pomace, Microbial community, 16S rDNA libraries

DEVELOPMENT AND COMPOSITIONAL ANALYSIS OF MICROBIAL COMMUNITIES SUITABLE FOR
ANAEROBIC DIGESTION OF CARROT POMACE.
by
SARAHI LORENA GARCIA GARCIA
B.E. Universidad Autonoma de Coahulia, Torreon Mexico, 2008
A Thesis Submited to the Graduate Faculty of The University of Georgia in Partial Fullfilment of the
Requirements for the Degree
MASTER OF SCIENCE
ATHENS, GEORGIA
2010

©2010
Sarahi Garcia
All Rights Reserved

DEVELOPMENT AND COMPOSITIONAL ANALYSIS OF MICROBIAL COMMUNITIES SUITABLE FOR
ANAEROBIC DIGESTION OF CARROT POMACE.
by
SARAHI LORENA GARCIA GARCIA
Approved
Major Professor: Keshav Das
Committee: William B. Whitman Gary Hawkins
Electronic Version Approved: Maureen Grasso Dean of the Graduate School The University of Georgia July 2010

iv
ACKNOWLEDGMENTS
I am grateful to all the persons who helped me during my thesis research. My major professor,
Dr. K.C. Das, for guiding me and giving me the most encouraging advice.
My committee members; Dr. William B. Whitman who's wise advice helped me in so many
aspects of my research, and Dr. Gary Hawkins whose love for anaerobic digestion inspired me.
I also thank Dr. Kamlesh Jangid who helped me and improved my understanding of
pyrosequencing preparation and analysis. My thanks and appreciation to all the members of Dr.
Whitman laboratory for their kind support; Magdalena Lupa who helped learn anaerobic techniques in
my early research stages, Boguslaw Lupa, Felipe Sarmiento, Chirs Reisch, Yuchen Liu and Nick Galloway.
I give my special acknowledgment to Claire Edwards and Bradley Tolar for helping me in the last
stages of writing my thesis.
I would like to acknowledge the funding provided by HED/US AID under the TIES program that
supported my study. Thanks also to Dr. Nagamani Balagurusamy for support and guidance in the
selection process into the TIES program.
Finally, I thank my parents for teaching me by their example of hard work, and I thank all my
friends, who have been like a family when I needed support and care.

v
TABLE OF CONTENTS
Page
ACKNOWLEDGMENTS..........................................................................................................................iv
CHAPTER
1 INTRODUCTION AND LITERATURE REVIEW...................................................................1
2 MATERIALS AND METHODS......................................................................................13
3 RESULTS AND DISCUSSIONS.......................................................................................25
4 CONCLUSIONS............................................................................................................70

CHAPTER 1
INTRODUCTION AND LITERATURE REVIEW
In the Unites States, food waste has progressively increased from nearly 30% of the available
food supply in 1974 to almost 40% in recent years (9). This percentage includes the 18% of vegetables
lost in the farm due to deterioration, neglect and processing and the 17 tons of fruits and vegetables
wasted annually at the supermarket (14). Many of the fruits and vegetables produced are never
consumed and go to waste. This kind of waste represents a potential pollutant and a loss of biomass
that could have other applications. The use of this biomass to produce energy would lead to a more
sustainable economy.
Fruit and vegetable waste contains 8‐18% total solids (TS), with a total volatile solids (VS)
content of 86‐92%. Anaerobic digestion of fruits and vegetables waste generally permits the conversion
of 70‐95% of the organic matter to methane. Efficient systems can produce methane up to 420 L/kg of
VS added (3). Taking in consideration these numbers, the amount of fruits and vegetables wasted in
every supermarket would yield up to 1 million liters of methane per year. This is the equivalent to 350
gallons of gasoline in terms of energy content.
Anaerobic digestion, a process that involves three major groups of microorganisms (1), is a
conversion of organic wastes into biogas, mainly methane (CH4 60% ‐ 70%) and carbon dioxide (CO2 30%
‐ 40%) (4). The more methane produced the more efficient the process becomes because it decreases
environmental pollution and increases the production of combustible energy (10). Although scientists
have been working on anaerobic digestion since the early 20th century, commercial anaerobic digestion

2
is far below its potential. Furthermore, digestion of vegetable waste has an added difficulty due to the
presence of rapidly hydrolyzable components and consequent acidification and inhibition of
methanogenesis (30). In addition, monitoring and controlling the anaerobic digestion from a biological
perspective has not been fully possible due to the complexity of the microbial community and lack of
understanding of the biochemical reactions and interactions within the community (21, 24).
This project conducts a deeper study of the anaerobic digestion of carrot waste starting with
small volume reactors and natural sources of microorganisms. Information from the small scale
digesters will be used to develop a mature microbial community. The study includes the scaling of
reactors to test the community’s stability.
LITERATURE REVIEW
Anaerobic digestion is a process where microorganisms convert organic wastes into biogas. This
process simultaneously degrades waste while producing energy in the form of methane. This energy can
be used for electricity or heat production (1).
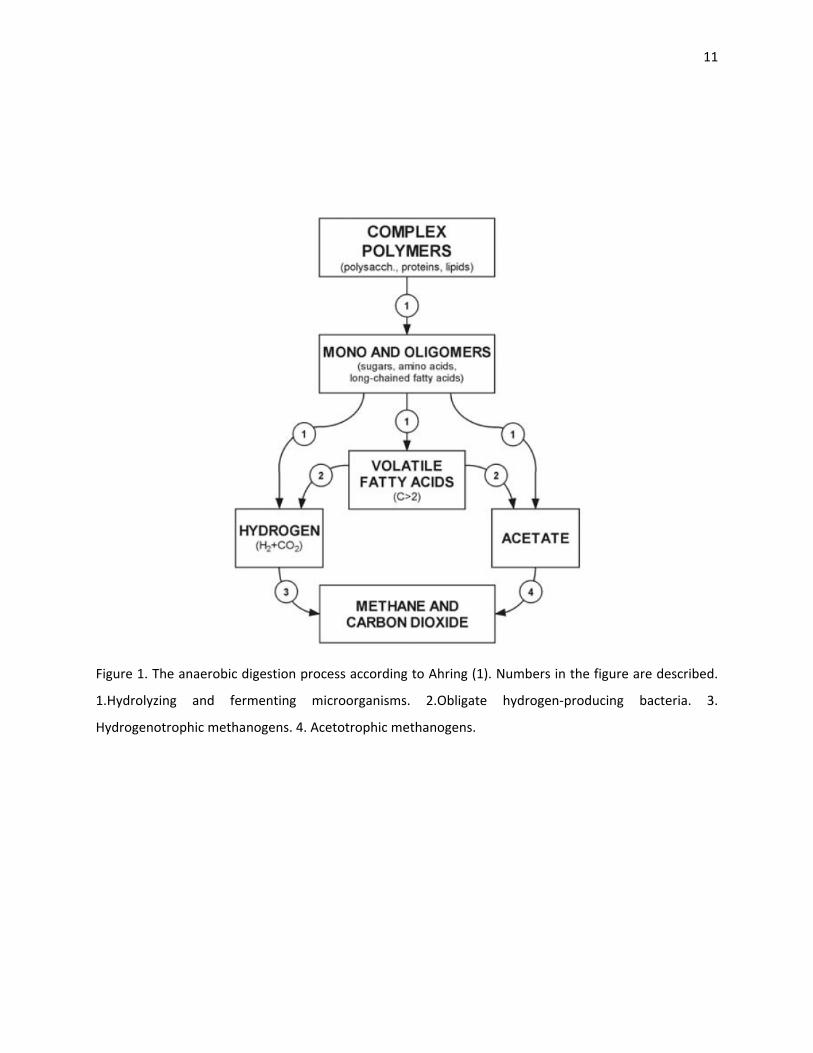
Three major groups of microorganisms are involved in the degradation process (Figure 1):
1. Hydrolyzing and fermenting microorganisms, which organisms break down the
polymers and monomers present in the waste and produce acetate, hydrogen gas
and volatile fatty acids.
2. Obligate hydrogen‐producing bacteria, that convert volatile fatty acids into hydrogen
gas and acetate.
3. Methanogens that are composed of two subgroups. The first producing methane
from hydrogen (hydrogenotrophic methanogens) and the second from acetate
(acetotrophic methanogens).

3
There is a close relationship between the obligate hydrogen‐producing bacteria and
hydrogenotrophic methanogens. This relationship is called syntrophy. This means that the consumption
of the fatty acids (especially butyrate), formed as intermediates by the hydrolyzing microorganisms, is
thermodynamically unfavorable unless coupled with the consumption of hydrogen by hydrogenotrophic
methanogens (28).
There are different kinds of feedstocks for anaerobic digestion (30). Likewise, the versatility of
the process is due to the different types of microorganisms that can grow on the components of the
organic matter. A summary of the different microbes found in various types of reactors and substrates is
shown in Table 1.
Vegetable wastes are mainly characterized by high moisture, low total solids and high volatile
solids. This kind of waste is easily degraded, but the rapid hydrolysis of polymers and monomers leads to
acidification and, in many cases, the delay or inhibition of methanogenesis (3, 30). In the juice industry,
thousands of tons of carrot pomace are produced after juice extraction. This waste, generally disposed
of as animal feed (11), could be used for methane and subsequently electricity production if the right
microbial population can be found.
Previous studies have examined the feasibility of using vegetable or fruit waste as a feedstock
for methane production. One such study was conducted by Clark and his colleagues (5).The digestion of
banana waste was studied relying entirely on its natural microbial consortia. Approximately 80% of the
volatile solids in bananas, like in many other fruits and vegetables, are composed of easily degradable
carbohydrates. Their results showed a drop in pH during the startup phase. This acidification is related
to hydrogen, acetate and butyric acid accumulation. The acidic conditions continued up to 40 days. After
this time, the pH started to rise and hydrogen and volatile fatty acids concentrations started to diminish
upon the onset of methane production. In conclusion, banana waste has poor presence of
microorganisms for rapidly initiating methanogenic conditions. Clarke’s study demonstrates that

4
vegetable and fruit waste are prone to acidification and highlights the importance of using a proper
inoculum.
Starting a bioprocess such as anaerobic digestion can be achieved by inoculating with a
consortium of microorganisms or by adding specific microorganisms such as in bioaugmentation (1). All
of these microbes occur naturally in anaerobic ecosystems such as sediments, paddy fields, water‐
logged soils and in the rumen (32). In general, the inocula for reactors are usually mixed communities of
unknown composition. Mesophilic sludge from wastewater treatment plant was used as inoculum in a
study by Forster‐Carneiro et al. In their study the acclimatization took up to 60 days until the methane
production reached its maximum (7). Nair et al. used rumen fluid to digest grass observing a 50%
degradation in 4 days (22). Kaparaju et al. used material from a biogas fermenter treating manure and
industrial waste as inoculum for the treatment of manure (15). Since many different microbes with
different roles in the overall process are needed, there are a wide variety of anaerobic sources that can
be used.
Bioaugmentation, the addition of specific microbes for the desired process, can be used as well.
This concept relies on the ability of microorganisms to adapt to environmental conditions established
during the process. In 2007 Nielsen et al., reported that adding two types of bacteria specialized in
degrading cellulose and xylose improved anaerobic digestion of cattle manure (23). Savant and Ranade
added an acid‐tolerant methanogen to an acidogenic digester to a 8 day experiment (26). Both studies
found a significant increase in methane yield.
Even when microbes are added, monitoring and controlling the anaerobic digestion process
from a biological perspective has not been fully possible (24) due to the complexity of the microbial
community and lack of understanding of the biochemical reactions and interactions among the microbes
within this community (21). There have been many studies aiming to elucidate the microbial
communities in anaerobic digesters (6, 8, 13, 16‐20, 27, 29, 31) (Table 1). However, no previous studies

5
were found characterizing microbial communities performing anaerobic digestion using carrot as a
substrate.
Polymerase chain reaction amplification of the 16S rRNA gene is used to assist in the
understanding of community structures (2). This technique can also be used to elucidate population
dynamics of bacteria and archaea through time. Furthermore, it has been shown that full length small
subunit rRNA and hypervariable regions V3 and V6 provide equivalent measures of relative abundance
(12). Pyrosequencing, a DNA sequencing technique that allows a large number of samples to be
analyzed in one run (25), increases the number of organisms that can be sampled allowing a cost‐
effective exploration of changes in microbial community structure (12). All these techniques would be
helpful in the study of the anaerobic digester’s microbial communities and their changes during their
acclimatization to a specific substrate.
It can be inferred from the literature that the startup and success of a reactor depends on more
than just having waste in an anaerobic reactor. By adding a random source of microorganisms as
inocula, the certainty of having the right microorganisms decreases. Microorganisms selected should be
specific to degrade the desired organic waste and tolerate the conditions they will be exposed to.
Carrot waste is composed of easily hydrolysable polymers that may acidify the waste and delay
methane production. Starting a reactor with substrate acclimatized microorganisms, and elucidating the
composition of the communities, would lead to a better understanding of the process within the
reactors and their stability.
OBJECTIVES
The main objective of this study was to develop a natural microbial community capable of
converting carrot pomace into methane. The adapted consortium was developed from several

6
environmental samples through a series of enrichments with the selected waste. Specific objectives
included the following:
• Elucidating the adapted communities’ composition.
Molecular analysis was performed on samples taken from the microbial community at
defined times during the enrichment process, and their composition was determined. This
provided insight into the adaptation process and the microorganisms present in the
communities that oxidize organic matter into methane.
• Scale up the adapted community and test its stability in a continuous reactor.
The microbial community was scaled up, and its stability was tested in a 3.45 liter upflow
anaerobic reactor. This was to further demonstrate the stability of the community and the
capability of adaptation in a continuous flow reactor.
This project was the first step towards the understanding of microbial communities’ adaptation
in methane producing reactors.
HYPOTHESIS
The individually developed microbial communities will possess microorganisms that have
functionally equivalent characteristics even though the sources of inoculum are different. It is expected
that groups of carbohydrate‐utilizing bacteria, amino acid utilizing bacteria, syntrophic bacteria, and
aceticlastic and hydrogenotrophic methanogens will develop in consortia regardless of the source of
inoculum.

7
REFERENCES
1. Ahring, B. K. 2003. Perspectives for anaerobic digestion. Adv. Biochem. Eng./Biotechnol. 81:1‐
30.
2. Baker, G. C., J. J. Smith, and D. A. Cowan. 2003. Review and re‐analysis of domain‐specific 16S
primers. J. Microbiol. Methods 55:541‐555.
3. Bouallagui, H., Y. Touhami, R. Ben Cheikh, and M. Hamdi. 2005. Bioreactor performance in
anaerobic digestion of fruit and vegetable wastes. Process Biochem. 40:989‐995.
4. Cantrell, K. B., T. Ducey, K. S. Ro, and P. G. Hunt. 2008. Livestock waste‐to‐bioenergy
generation opportunities. Bioresour. Technol. 99:7941‐7953.
5. Clarke, W. P., P. Radnidge, T. E. Lai, P. D. Jensen, and M. T. Hardin. 2008. Digestion of waste
bananas to generate energy in Australia. Waste Manage. 28:527‐533.
6. Fernandez, A., S. Huang, S. Seston, J. Xing, R. Hickey, C. Criddle, and J. Tiedje. 1999. How stable
is stable? function versus community composition. Appl.Environ.Microbiol. 65:3697‐3704.
7. Forster‐Carneiro, T., M. Pérez, and L. I. Romero. 2008. Influence of total solid and inoculum
contents on performance of anaerobic reactors treating food waste. Bioresour. Technol.
99:6994‐7002.
8. Franke‐Whittle, I. H., M. Goberna, V. Pfister, and H. Insam. 2009. Design and development of
the ANAEROCHIP microarray for investigation of methanogenic communities.
J.Microbiol.Methods 79:279‐288.
9. Hall, K. D., J. Guo, M. Dore, and C. C. Chow. 2009. The progressive increase of food waste in
America and its environmental impact. PLoS ONE 4:e7940. doi:10.1371/journal.pone.0007940.
10. Harikishan, S., and S. Sung. 2003. Cattle waste treatment and Class A biosolid production using
temperature‐phased anaerobic digester. Adv.Environ.Res. 7:701‐706.
8
11. Hsu, P.‐K., P.‐J. Chien, C.‐H. Chen, and C.‐F. Chau. 2006. Carrot insoluble fiber‐rich fraction
lowers lipid and cholesterol absorption in hamsters. LWT Food Sci. Technol. 39:338‐343.
12. Huse, S. M., L. Dethlefsen, J. A. Huber, D. M. Welch, D. A. Relman, and M. L. Sogin. 2008.
Exploring microbial diversity and taxonomy using SSU rRNA hypervariable tag sequencing. PLos
Genet. 4:e1000255.
13. Hwang, K., M. Song, W. Kim, N. Kim, and S. Hwang. 2010. Effects of prolonged starvation on
methanogenic population dynamics in anaerobic digestion of swine wastewater. Suppl. Issue
Recent Dev. Biomass Convers. Technol. 101:S2‐S6.
14. Jones, W. T. 2005. Using contemporary archaeology and applied anthropolgy to understand
food loss in the american food system. University of
Arizona:http://www.ce.cmu.edu/~gdrg/readings/2006/12/19/Jones_UsingContemporaryArchae
ologyAndAppliedAnthropologyToUnderstandFoodLossInAmericanFoodSystem.pdf.
15. Kaparaju, P., I. Buendia, L. Ellegaard, and I. Angelidakia. 2008. Effects of mixing on methane
production during thermophilic anaerobic digestion of manure: Lab‐scale and pilot‐scale studies.
Explor. Horiz. Biotechnol.: A Global Venture 99:4919‐4928.
16. Klocke, M., P. Mähnert, K. Mundt, K. Souidi, and B. Linke. 2007. Microbial community analysis
of a biogas‐producing completely stirred tank reactor fed continuously with fodder beet silage
as mono‐substrate. Syst. Appl. Microbiol. 30:139‐151.
17. Krakat, N., A. Westphal, S. Schmidt, and P. Scherer. 2010. Anaerobic digestion of renewable
biomass: thermophilic temperature governs methanogen population dynamics.
Appl.Environ.Microbiol. 76:1842‐1850.
18. Krause, L., N. N. Diaz, R. A. Edwards, K.‐H. Gartemann, H. Krömeke, H. Neuweger, A. Pühler, K.
J. Runte, A. Schlüter, J. Stoye, R. Szczepanowski, A. Tauch, and A. Goesmann. 2008. Taxonomic

9
composition and gene content of a methane‐producing microbial community isolated from a
biogas reactor. J. Biotechnol. 136:91‐101.
19. Li, P., Y. Wang, Y. Wang, K. Liu, and L. Tong. 2010. Bacterial community structure and diversity
during establishment of an anaerobic bioreactor to treat swine wastewater. Water Sci. Technol.
61:243‐252.
20. Liu, F. H., S. B. Wang, J. S. Zhang, J. Zhang, X. Yan, H. K. Zhou, G. P. Zhao, and Z. H. Zhou. 2009.
The structure of the bacterial and archaeal community in a biogas digester as revealed by
denaturing gradient gel electrophoresis and 16S rDNA sequencing analysis. J. Appl. Microbiol.
106:952‐966.
21. McHugh, S., M. Carton, T. Mahony, and V. O'Flaherty. 2003. Methanogenic population
structure in a variety of anaerobic bioreactors. FEMS Microbiol. Lett. 219:297‐304.
22. Nair, S., Y. Kuang, and P. Pullammanappallil. 2005. Enhanced degradation of waste grass
clippings in one and two stage anaerobic systems. Environ. Technol. 26:1003‐1012.
23. Nielsen, H. B., Z. Mladenovska, and B. K. Ahring. 2007. Bioaugmentation of a two‐stage
thermophilic (68 degrees C/55 degrees C) anaerobic digestion concept for improvement of the
methane yield from cattle manure. Biotechnol. Bioeng. 97:1638‐1643.
24. Pind, P. F., I. Angelidaki, B. K. Ahring, K. Stamatelatou, and G. Lyberatos. 2003. Monitoring and
Control of Anaerobic Reactors. Adv. Biochem. Eng./Biotechnol. 82:135‐182.
25. Ronaghi, M. 2001. Pyrosequencing Sheds Light on DNA Sequencing. Genome Res. 11:3‐11.
26. Savant, D. V., and D. R. Ranade. 2004. Application of Methanobrevibacter acididurans in
anaerobic digestion. Water Sci. Technol. 50:109‐114.
27. Schlüter, A., T. Bekel, N. N. Diaz, M. Dondrup, R. Eichenlaub, K.‐H. Gartemann, I. Krahn, L.
Krause, H. Krömeke, O. Kruse, J. H. Mussgnug, H. Neuweger, K. Niehaus, A. Pühler, K. J. Runte,
R. Szczepanowski, A. Tauch, A. Tilker, P. Viehöver, and A. Goesmann. 2008. The metagenome

10
of a biogas‐producing microbial community of a production‐scale biogas plant fermenter
analysed by the 454‐pyrosequencing technology. J. Biotechnol. 136:77‐90.
28. Sekiguchi, Y., Y. Kamagata, K. Nakamura, A. Ohashi, and H. Harada. 2000. Syntrophothermus
lipocalidus gen. nov., sp. nov., a novel thermophilic, syntrophic, fatty‐acid‐oxidizing anaerobe
which utilizes isobutyrate. Int.J.Syst.Evol.Microbiol. 50:771‐779.
29. Wang, H., K. Tolvanen, A. Lehtomäki, J. Puhakka, and J. Rintala. 2010. Microbial community
structure in anaerobic co‐digestion of grass silage and cow manure in a laboratory continuously
stirred tank reactor. Biodegrad. 21:153‐146.
30. Ward, A. J., P. J. Hobbs, P. J. Holliman, and D. L. Jones. 2008. Optimisation of the anaerobic
digestion of agricultural resources. Bioresour. Technol. 99:7928‐7940.
31. Ying, Z., S. Aiyuk, H. Xu, G. Chen, and W. Verstraete. 2005. Study of microbial community
structures in UASB sludge treating municipal wastewater by denaturing gradient gel
electrophoresis of 16S rDNA. Sci. China, Ser. C Life Sci. 48:128‐135.
32. Zinder, S. H. 1993. Physiological ecology of methanogens. In: Fierry JG (ed), Methanogenesis.
Ecology, physiology, biochemistry and genetics. Chapman and Hall, New York128.
11
Figure 1. The anaerobic digestion process according to Ahring (1). Numbers in the figure are described.
1.Hydrolyzing and fermenting microorganisms. 2.Obligate hydrogen‐producing bacteria. 3.
Hydrogenotrophic methanogens. 4. Acetotrophic methanogens.

12
Table 1. Summary of microbes present in digestion of different types of organic matter
Organic substrate
Type of reactor Most abundant
bacteria* Most abundant methanogens*
Molecular tool used to identify the microbe
Reference
Glucose Continuously stirred reactor
Spirochete group Eubacterium genus Propionibacterium
genus
Methanobacterium formicicum
Methanisarcina mazei
Methanobacterium bryantii
ARDRA Fernández et al 1999 (6)
Municipal wastewater
UASB 10 uncultured Desulforhabdus
amnigena
Methanosaeta concilii
DGGE Ying et al 2005
(31)
Fodder beet silage
CSTR Sedimentibacter
Desulfotomaculum Peptococcus
Methanosarcina Methanosaeta
concilii Methanobacterium
formicium
Clone library and ARDRA
Klocke et al 2007 (16)
Maize silage, green rye and
chicken manure
Nonspecified
Sedimentibacter Syntrophomonas
Acetivibrio Clostridium
Methanoculleus 16S rDNA gene pyrosequencing
Krause et al 2008 (18)
Maize silage, green rye and
chicken manure
Nonspecified
Clostridium thermocellum Thermosinus
carboxydivorans Halothermothrix
orenii
Methanoculleus marisnigri
Metagenomics and
pyrosequencing
Schlüter et al 2008 (27)
Liquid pig manure, thermally pretreated food, plant
cuttings, grass silage and corn
silage
CSTR N/A
Methanoculleus bourgensis
Methanobrevibacter Methanobacterium
formicicum Methanosarcina thermophila
ANAEROCHIP microarray
16S rRNA gene cloning and sequencing
Franke‐Whittle et al 2009(8)
Pig manure Nonspecified
Uncultured anaerobic Alkaliflexus imshenetskii Petrimonas sulfuriphila
Methanoculleus bourgensis
Methanosarcina barkeri
Methanospirillum hungatei
DGGE and sequencing
Liu et al 2009 (20)
Swine wastewater
UASB
Acidobacterium sp. Deltaproteobacteria Syntrophobacter sp.
Tissierella sp.
N/A PCR‐DGGE and
ARDRA Li et al. 2010
(19)
Beet silage and beet juice
Nonspecified N/A Methanobacteriales FISH, cloning and ARDRA
Krakat et al 2010 (17)
Swine wastewater
Anaerobic batch reactor
N/A
Methanoculleus bourgensis
Methanosarcina acetivorans
DGGE, cloning and real‐time
PCR
Hwang et al 2010 (13)
Cow manure and grass silage
CSTR Bacteroidetes Clostrideacea
N/A T‐RFLP and
DGGE Wang et al 2010 (29)
* Organisms found in the studies were reported in terms of their closest homologues.

CHAPTER 2
MATERIALS AND METHODS
Samples
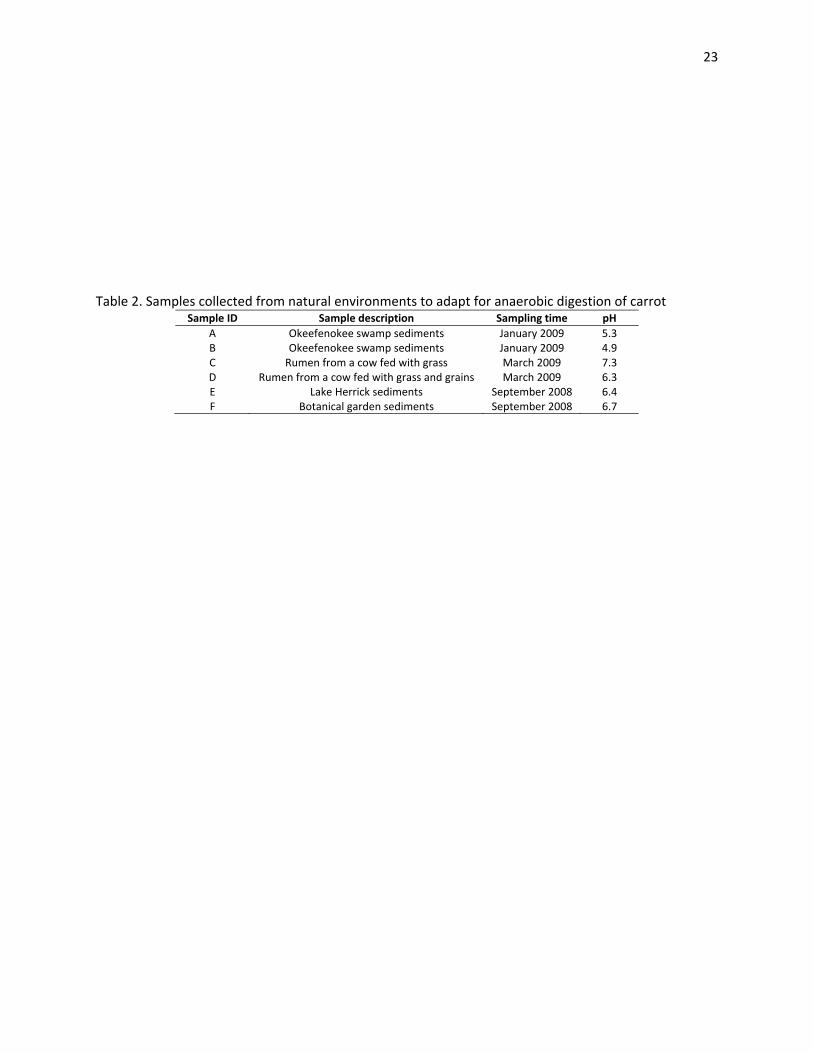
Six samples were collected from different natural environment sources (Table 2). Samples A, B, E
and F, are all sediments collected underwater, from the bottom of the natural sites, where anaerobic
conditions were confirmed by biogas production. Sample C was collected from a grass fed cow’s rumen
using a hose and a vacuum pump. Sample D was collected from a grain‐fed, fistulated cow by manually
extracting the contents of the rumen and squeezing them to extract the liquid portion.
The samples were stored in sealed glass bottles at room temperature in darkness until the day of
inoculation. Each sample was used to inoculate a separate enrichment. A seventh enrichment was
inoculated using a mixture comprised of equal volumes of each sample. DNA was extracted from each
sample on the day of inoculation. DNA was stored at ‐80°C.
Cultivation media
A volume of 1.5 kg of carrot was subjected to juice extraction in a clean juice extractor. Pomace,
102 g, together with 850 mL of filtered water were transferred to a clean glass blender. The water and
the waste were blended for 5 min at the highest setting and the resulting material was evenly
distributed into 14 sterile bottles of 160 mL to be stored in the freezer at ‐20°C.
The enriched mineral solution was prepared according to Balch et al. (3). It consisted of 50 mL of
general salts solution, 50 mL of K2HPO4 (6 g/L), 10 ml of trace mineral solution, 1 mL of iron stock

14
solution, 5 g of NaHCO3 and 0.5 g of cysteine (added after boiling). General salt solution contained
K2HPO4 (6 g/L), (NH4)2(SO4)2 (6 g/L), NaCl (12 g/L), MgSO4.7H2O (2.6 g/L), and CaCl2.2H2O (0.16 g/L). Iron
stock solution was prepared by adding 0.2 g of Fe(NH4)2(SO4)2.6H2O to a small screw top bottle with 2
drops of concentrated HCl followed by 100 mL of glass distilled water. Trace mineral solution contained
nitriloacetic acid (1.5 g/L), MgSO4.7H2O (3 g/L), MnSO4.2H2O (0.5 g/L), NaCl (1 g/L), Fe2SO4.7H2O (0.1
g/L), CoCl2 (0.1 g/L), CaCl.2H2O (0.1 g/L), ZnSO4 (0.1 g/L), CuSO4.5H2O (0.01 g/L), ALK(SO4)2 (0.01 g/L),
H3BO3 (0.1 g/L) and Na2MoO4.2H2O (0.1 g/L).
Preliminary experimentation to determine optimal substrate concentration
Two sets of preliminary experiments were performed to determine the carrot concentration
best suited for the enrichments. In the first set of enrichments, four different environmental samples
were used as 10% inocula into two concentrations (1% and 10%) of simple carrot enrichments to
determine at which substrate concentration methane was produced the fastest. A second set of
enrichments were performed to confirm that 1% carrot enrichments and 10% inocula were the optimum
substrate and inoculum concentration. Aliquots of 3 ml were taken from the two enrichments with the
highest methane production and further tested at different carrot concentrations. Eight conditions were
tested in duplicate. Five of those conditions were to test the carrot concentration and three were to test
inoculum concentration. Aliquots of 3 mL from the selected enrichments were inoculated into 1%, 2%,
4%, 6% and 10% carrot waste. To analyse the effects of the inoculum concentration, three dilutions of
the 1% enrichment were prepared. After the 1% carrot enrichment was prepared and inoculated, a
series the dilutions were transferred to bottles containing 1% carrot, giving rise to enrichments that
were inoculated with approximately 1%, 0.1% and 0.01% of the contents of the previous selected of
enrichment. The enrichments contained deionized water, 10% inoculum (or other if stated) and the
carrot concentration to be tested for a total working volume of 30 mL in a 160 mL glass bottle.

15
Anaerobic conditions were created by sealing the bottles, flushing the bottles with nitrogen for 30
minutes.
Enrichments
Six environmental samples were used as inocula for acclimatization to anaerobic digestion of
carrot waste. A seventh acclimatization was performed using a mixture of the six sources sources. The
objective of the acclimatization of the mixture was to observe how a combination of different inoculum
sources would work to develop a community capable of degrading carrot waste and producing methane.
In total, three successive sets of enrichments were conducted in triplicate. The first set was inoculated
with 10% (vol./vol.) of an environmental sample, the second set was inoculated with 10% of the first
enrichment, and the third set was inoculated with 10% of the second enrichment.
Acclimatization of the samples to carrot waste was conducted in 160 mL serum bottles. Each
sample was enriched in triplicate. The enrichment consisted of 24.5 mL of enrichment mineral solution,
2.5 mL of carrot waste solution (120 g/L), and 3 mL of inoculum.
The enrichment mineral solution was added to the serum bottles in an anaerobic chamber. The
gas phase of the bottles was exchanged using two cycles of 30 seconds of vacuum and 30 seconds of a
mixture of gas (N2 80% and CO2 20%) with a pressure of 5 psi. After gas exchange, the bottles were
autoclaved. Carrot waste and inoculum were transferred consecutively with a sterile syringe and needle,
size 18G1½, once the bottles were cooled at room temperature.
Once the enrichments did not produce more methane, an aliquot of 3 mL was taken and
inoculated into fresh carrot waste enrichment. The aliquots were taken after vigorous shaking to
homogenize the enrichment. The next enrichment preparation was conducted as previously described.
The successive enrichment was repeated for another generation for a total of three enrichments. After

16
inoculation, 0.2 mL of the enrichment products were used for analysis of chemical oxygen demand
(COD) and 4.5 mL were centrifuged for DNA extraction from the pellet.
Scaling up the microbial community
The triplicates of the first generation carrot enrichment that produced the most methane were
scaled up to 200 mL enrichments in a one liter bottle. The scaled enrichment consisted of 163.3 mL of
enriched mineral solution, 16.67 mL of carrot waste solution (120 g/L), and 20 mL of inoculum. Methane
production was monitored using a gas chromatograph (SRI 8610‐C). Once the maximum amount of
methane was reached, the 200 mL enrichments were scaled up into a 2 L enrichment in 4 L bottles.
Since the bottles did not fit in the anaerobic chamber, the anaerobic conditions were created by flushing
the bottles with a mixture of gas (N2 80% and CO2 20%) for 60 minutes.
Upflow anaerobic reactor
Two 3.45 L working volume reactors were used. Each reactor consisted of a glass column with an
internal diameter of 10 cm and height of 50 cm, with 4 sampling ports evenly distributed along the
height of the column. A peristaltic pump was set so the inlet could be at the bottom of the reactor and
the outlet at the top. One reactor was set up with raw rumen fluid as the inoculum and another reactor
was set up with the acclimatized inoculum from the 4 L bottle enrichments. Both inocula were analyzed
for total solids (TS), volatile suspended solids (VSS) and chemical oxygen demand (COD) before starting
the reactor. The reactor was started with about 1.7 L acclimatized inoculum, and the other reactor with
350 mL of rumen fluid. Both reactors were topped with enriched mineral solution and 1% carrot pomace
was added. The content of the reactor was recirculated at a flow rate of 0.5 mL per minute until the COD
decreased by 60%. After recirculation the flow rate was kept constant with fresh waste influent. The
hydraulic retention time (HRT) at that flow rate was 5 days. The flow rate was further increased based

17
on the COD removal. The feedstock bucket was cleaned and feedstock was prepared daily. Biogas
production was monitored.
Analytical methods
Methane production was monitored using gas chromatography on a SRI 8610‐C gas
chromatograph with a 80/100 Porapack Q 6ft x 1/8 inch column with nitrogen carrier gas, an oven
temperature of 60°C, and a flame ionization detector. All needles and syringes used were sterile and
disposable and were subjected to gas exchange with nitrogen.
COD was assessed using a colorimetric method. Samples were digested in a digital reactor, DRB
200 (Hach Company, Loveland, Colorado), using the fabricant digestion solution for COD (0 – 1500 ppm
range, Hach) and optical density was observed in a spectrophotometer DR 2700 (Hach).
Community DNA extraction and pyrosequencing
Total community DNA was extracted using ZR Soil Microbe DNA Kit (Zymo research, Orange,
California) and the manufacturer’s protocol, with the following modifications: the starting material was
a pellet from 4.5 ml of supernatant, and the Zymo‐SpinTM IIC Column was incubated for 5 minutes at
room temperature after the addition of DNA Elution Buffer to increase DNA yield. DNA extraction was
visually verified by electrophoresis on a 1% agarose gel with ethidium bromide staining (Sigma‐Aldrich,
St. Louis, Missouri). PCR amplification of the V3 and V6 region of the bacterial and archaeal 16S rRNA
genes, respectively, was conducted. The PCR conditions consisted of initial denaturation at 95°C for 3
minutes followed by 20 or 25 cycles for bacteria and archaea, respectively, of denaturation at 94°C for
30 s, annealing at 60°C for 30 s and extension at 68°C for 60 s. The final extension was carried out at
68°C for 4 minutes. The bacterial primers used were 515R‐M (5’‐CCGCNGCKGCTGGCAC‐3’) modified
after Acosta‐Martínez et al. (1) and the sevenfold‐degenerate primer 27F‐YM+3 (5). The sevenfold‐

18
degenerate primer 27F‐YM+3 is four parts 27F‐YM (5’‐AGAGTTTGATYMTGGCTCAG‐5’), plus one part
each of the primers specific for the amplification of Bifidobacteriaceae (27F‐Bif, 5’‐
AGGGTTCGATTCTGGCTCAG‐3’), Borrelia (27F‐Bor, 5’‐AGAGTTTGATCCTGGCTTAG‐3’), and Chlamydiales
(27F‐Chl, 5’‐AGAATTTGATCTTGGTTCAG‐3’). The archaeal primers used were 1043R‐YH (5’‐
GGCCATGCACCWCYHCTC‐3’) (2) and 533F‐K (5’‐GTGBCAGCMGCCGCGGKAA‐3’) modified after Sørensen
and Teske (11). The binding sites with respect to E. coli 16S rRNA gene (Genbank accession number
U00096) are reflected in the primer name. For purposes of pyrosequencing, the primers were
synthesized with an adaptor as shown: Adaptor(A)‐BARCODE‐(515R‐M or 1043R‐YH) and Adaptor(B)‐(
27F‐YM+3 or 533F‐K). The Roche Adaptor(A) (5’‐CCATCTCATCCCTGCGTGTCTCCGACTCAG‐3’) and
Adaptor(B) (5’‐CCTATCCCCTGTGTGCCTTGGCAGTCTCAG‐3’) for their titanium platform were used. For
each DNA sample, a specific 8‐nt barcode was used. The barcode sequences were selected from Hamady
et al. (2008) (6) based on GC%, melting temperature and complementarity with the primers listed
above. PCR reactions were performed on a Veriti 96‐well Thermal Cycler (AB Applied Biosystem,
Carlsbad, california). PCR products were visualized by electrophoresis on 1% agarose gels, stained with
SYBR Green Dye (Invitrogen, Carlsbad, California). The resultant images were scanned using Typhoon
Trio+ Variable mode imager (GE Healthcare, Pittsburg, new Jersey). PCR bands were quantified using
Image Quant 5.2 (Molecular Dynamics).
PCR amplicons obtained from replicate samples were pooled together in equimolar
concentrations prior to gel elution. Pooled products were recovered using Zymoclean Gel DNA Recovery
Kit (Zymo research, Orange, California). Concentration of the gel eluted DNA were assessed using
capillary electrophoresis on the Experion System (Bio‐Rad, Hercules, California). All samples were
pooled together in equimolar concentration according to the number of sequences desired for each
sample. Pooled samples were purified using the Agencourt AMpure magnetic bead purification method
(Beckman Coulter, Brea, California). The purified DNA was resuspended in 40 µL of TE buffer.

19
Concentrations of the purified DNA were assessed using the Experion System (Bio‐Rad, Hercules,
California) and 500 ng of purified amplicons were submitted to Georgia Genomics Facility
(http://dna.uga.edu/) for pyrosequencing.
Real‐time polymerase chain reaction (qPCR)
qPCR was used to estimate the abundance of the 16S rDNA genes from Bacteria and Archaea.
Gene abundance in 1 µL of extract was measured in triplicate on a iCycler iQ5 thermocycler (Bio‐Rad,
Hercules, California). The PCR conditions consisted of initial denaturation at 95°C for 5 minutes followed
by 35 and 45 cycles for bacteria and archaea, respectively, of denaturation at 95°C for 45 s, annealing
and extention at 60°C and 62°C (for bacteria and archaea, respectively) for 40 s and image at 82°C for 25
s. At the end, the reaction was heated at 95°C for 1 minutes followed by 1 minute at 56°C. The bacterial
primers used were 515R (5’‐CCGCNGCKGCTGGCAC‐3’) modified after Acosta‐Martínez et al. (1) and 356F
(5’‐ACTCCTACGGRAGGCWGC‐3’) modified after Rudi et al.(9). The archaeal primers used were 515R (5’‐
TTMCCGCGGCKGCTGVCAC ‐3’) modified after Sørensen and Teske (11) and 349F (5’‐
GYGCASCAGKCGMGAAW ‐3’) (12). The binding sites with respect to E. coli 16S rRNA gene (Genbank
accession number U00096) are reflected in the primer name. Abundance of Archaea and Bacteria 16S
rDNA genes was determined using iQ SYBRgreen super mix (Bio‐Rad, Hercules, California) to measure
amplicon acuumulation. Bacteria standards were made from Xanthamonas (Genbank accession number
EF665883). Standards for Archaea genes were amplicons cloned from environmental samples. Standard
curves were performed according to Kalanetra et al. (7).
Inclusion of controls for pyrosequencing
A set of three previously cloned full length 16S rRNA gene fragments were used to prepare
control amplicons to test for errors during PCR amplification and pyrosequencing. These clones were

20
previously prepared for the Michigan GASP dataset (Jangid et al., in prep). Plasmids were isolated from
5 ml of overnight cultures previously inoculated with a single colony of the selected clones followed by
gel quantification using SYBR Green Dye (Invitrogen, Carlsbad, California) on a Typhoon Trio+ Variable
mode imager (GE Healthcare, Pittsburg, New Jersey). To prepare the controls C1 to C3, 30 ng of plasmid
was used as a template for three separate PCR amplifications, as identified in Table 3. For amplification
20 cycle PCR reactions were set for each control under previously described conditions. Each control
reaction used a different barcode as described above. Sequence pipelines were done testing different
length of controls DNA sequences and distances for clustering, as well as the use of software to evaluate
the best set of conditions to analyze the enrichments amplicons sequences.
Sequence analysis pipeline
Sequences analysis was carried out using a combination of QIIME (4) and MOTHUR (10). The
sequences were aligned using the SILVA database in MOTHUR and further filtered. Operational
taxonomic units were clustered using the average neighbor method. Representative sequences were
classified using SIMO RDP query (8).
The commands for the analysis pipeline go as follows (Step 1 to 4 were done in QIIME, 5 and 6
were done using word processing software and 7 to 15 were done using MOTHUR):
1. sffinfo *.sff > *.sff.txt
2. split_libraries.py ‐m *map.txt ‐f *.fna ‐q *.qual ‐l 400 ‐r ‐b 12 ‐o output_folder
3. denoise.py ‐v ‐i *.sff.txt ‐f output_folder/seqs.fna ‐o output_folder /denoised/ ‐m *map.txt
4. cat output_folder /denoised/centroids.fasta output_folder /denoised/singletons.fasta > *.fasta
5. *.names file from denoised_mapping.txt
6. *.groups file from seqs.fasta
7. align.seqs(candidate=*.fasta, template=silva.bacteria.fasta/silva.archaea.fasta)

21
8. screen.seqs(fasta=*.align, start=, end=, name=*.names, group=*.groups)
9. filter.seqs(fasta=*.good.align, vertical=T, trump=.)
10. unique.seqs(fasta=*.good.filter.fasta, name=*.good.names)
11. pre.cluster(fasta=*.good.filter.unique.fasta, name=*.good.filter.unique.names)
12. dist.seqs(fasta=*.good.filter.unique.precluster.fasta, cutoff=0.10)
13. read.dist(column=*.good.filter.unique.precluster.dist,
name=*.good.filter.unique.precluster.names, cutoff=0.03)
14. cluster(method=average)
15. read.otu(list=*.good.filter.unique.precluster.an.list, group=*.good.groups)
REFERENCES
1. Acosta‐Martinez, V., S. Dowd, Y. Sun, and V. Allen. 2008. Tag‐encoded pyrosequencing analysis
of bacterial diversity in a single soil type as affected by management and land use. Soil Biol.
Biochem. 40:2762‐2770.
2. Baker, G. C., and D. A. Cowan. 2004. 16 S rDNA primers and the unbiased assessment of
thermophile diversity. Biochem. Soc. Trans. 32:218‐221.
3. Balch, W. E., C. E. Fox, L. J. Magrum, C. R. Woese, and R. S. Wolfe. 1979. Methanogens:
reevaluation of a unique biological group. Microbiol. Rev. 43:260.
4. Caporaso, J. G., J. Kuczynski, J. Stombaugh, K. Bittinger, F. D. Bushman, E. K. Costello, N. Fierer,
A. Gonzalez Pena, J. K. Goodrich, J. Gordon, G. A. Huttley, S. T. Kelley, D. Knights, J. E. Koenig,
R. E. Ley, C. A. Lozupone, D. McDonald, B. D. Muegge, M. Pirrung, J. Reeder, J. R. Sevinsky, P. J.
Turnbaugh, W. A. Walters, J. Widmann, T. Yatsunenko, J. Zaneveld, and R. Knight. QIIME
allows analysis of high‐throughput community sequencing data. Nat. Methods:335.

22
5. Frank, J. A., C. I. Reich, S. Sharma, J. S. Weisbaum, B. A. Wilson, and G. J. Olsen. 2008. Critical
evaluation of two primers commonly used for amplification of bacterial 16S rRNA genes. Appl.
Env. Microbiol. 74:2461‐2470.
6. Hamady, M., J. J. Walker, J. K. Harris, N. J. Gold, and R. Knight. 2008. Error‐correcting barcoded
primers for pyrosequencing hundreds of samples in multiplex. Nat. Methods 5:235‐237.
7. Kalanetra, K. M., N. Bano, and J. T. Hollibaugh. 2009. Ammonia‐oxidizing Archaea in the Arctic
Ocean and Antarctic coastal waters. Environ. Microbiol. 11:2434‐2445.
8. Lasher, C., G. Dyszynski, K. Everett, J. Edmonds, W. Ye, W. Sheldon, S. Wang, S. B. Joye, M. A.
Moran, and W. B. Whitman. 2009. The Diverse Bacterial Community in Intertidal, Anaerobic
Sediments at Sapelo Island, Georgia. Microbial. Ecol. 58:244‐261.
9. Rudi, K., O. M. Skulberg, F. Larsen, and K. S. Jfkobsen. 1997. Strain characterization and
classification of oxyphotobacteria in clone cultures on the basis of 16S rRNA sequences from the
variable regions V6, V7, and V8. Appl.Environ.Microbiol. 63:2593‐2599.
10. Schloss, P. D., S. L. Westcott, T. Ryabin, J. R. Hall, M. Hartmann, E. B. Hollister, R. A.
Lesniewski, B. B. Oakley, D. H. Parks, C. J. Robinson, J. W. Sahl, B. Stres, G. G. Thallinger, D. J.
Van Horn, and C. F. Weber. 2009. Introducing mothur: open‐source, platform‐independent,
community‐supported software for describing and comparing microbial communities. Appl. Env.
Microbiol.75:7537‐7541.
11. Sorensen, K. B., and A. Teske. 2006. Stratified communities of active archaea in deep marine
subsurface sediments. Appl. Env. Microbiol. 72:4596‐4603.
12. Takai, K., and K. Horikoshi. 2000. Rapid Detection and Quantification of Members of the
Archaeal Community by Quantitative PCR Using Fluorogenic Probes. Appl.Environ.Microbiol.
66:5066‐5072.
23
Table 2. Samples collected from natural environments to adapt for anaerobic digestion of carrot
Sample ID Sample description Sampling time pH
A Okeefenokee swamp sediments January 2009 5.3 B Okeefenokee swamp sediments January 2009 4.9 C Rumen from a cow fed with grass March 2009 7.3 D Rumen from a cow fed with grass and grains March 2009 6.3 E Lake Herrick sediments September 2008 6.4 F Botanical garden sediments September 2008 6.7
24
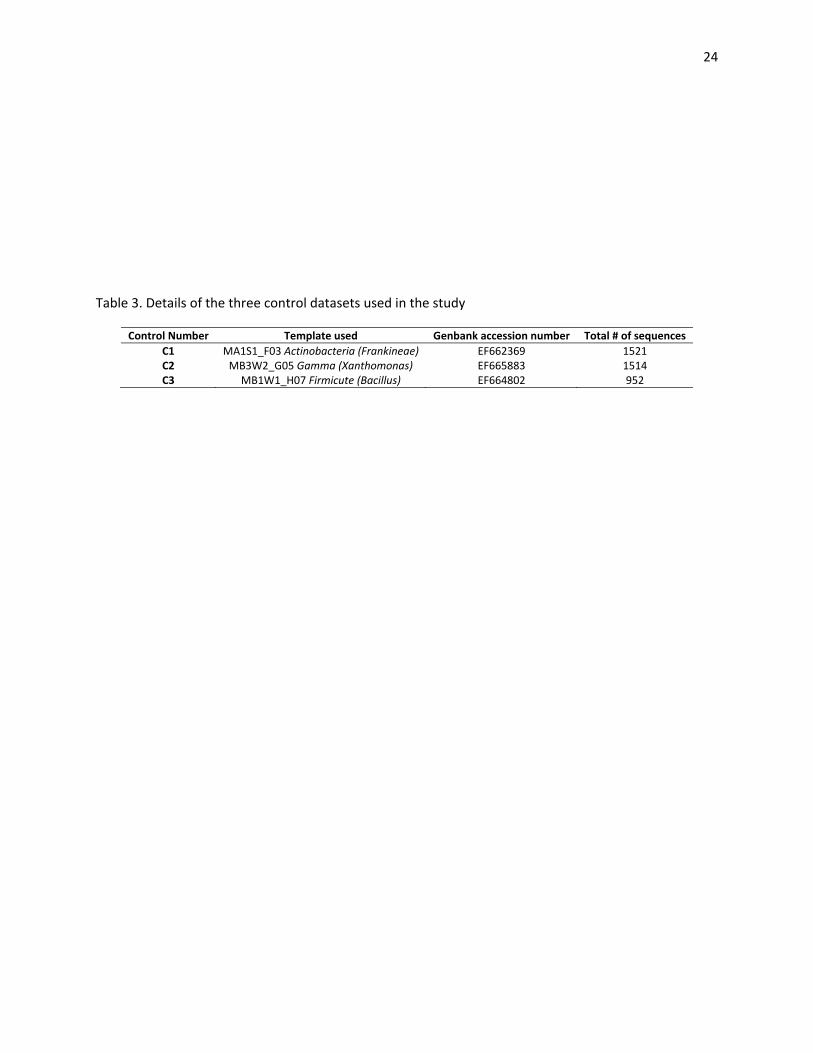
Table 3. Details of the three control datasets used in the study
Control Number Template used Genbank accession number Total # of sequences
C1 MA1S1_F03 Actinobacteria (Frankineae) EF662369 1521 C2 MB3W2_G05 Gamma (Xanthomonas) EF665883 1514 C3 MB1W1_H07 Firmicute (Bacillus) EF664802 952

CHAPTER 3
RESULTS AND DISCUSSIONS
Preliminary experimentation to determine optimal substrate concentration
In the first set of enrichments, four types of samples were inoculated in duplicate to two
different concentrations of carrot, 1% and 10%. The 1% and 10% carrot concentration represent 13.5
mg/L and 135 mg/L of VS respectively. At day 21, all of the 1% carrot enrichments had produced more
methane than the 10% carrot enrichments (Figure 2). Vegetables, such as carrot, are easily degradable
and can produce and accumulate volatile acids which are toxic to methanogenesis (1, 22). The 10% of
carrot waste enrichments likely inhibited methanogenesis through volatile fatty acids accumulation.
In the second set of enrichments, bottles containing 1% and 2% carrot and an inoculum of 10%
produced more methane than the other enrichments (Figure 3). Although, in sample 2 similar
concentration of methane at 1% and 2% carrot loading were observed, sample 4 shows clearly that 1%
carrot enrichments produced higher amounts of methane. Comparison of consecutive enrichments
(Figure 2 and 3) show that at day 21, the methane production in the second set of enrichments is lower
than the methane production from the first set. This could be caused by the difference in the amount of
organic matter present in the samples. The first set of enrichments are inoculated with 10% natural
samples, which contained significant amounts of carbon, while the second set of enrichments are
inoculated with digested product from the first set. Based on these observations, it was decided that a
10% inoculums and 1% carrot waste will be used for further experiments.

26
Adapting natural sources of inoculum to anaerobic digestion of carrot.
In the first set of enrichments, which were inoculated with seven different environmental
samples, only two showed considerable methane production (Figure 4). The enrichments were
monitored until a plateau was observed. Rumen (pH 6.3) and the mixture of inocula reached its
maximum methane production around day 40. On day 63 of the first set of enrichments, 3 mL of each
digested enrichments were transferred to fresh medium to begin the second set of enrichments. The
behavior of the first set and the second set of enrichments showed a similar trend in methane
production (Figure 4 and 5). Unlike the first set, the second set of enrichments reached the maximum
methane production five days earlier. This shows the adaptation of the biogas producing community to
the carrot waste. The second set of enrichments produced approximately half as much methane as the
first set. This phenomenon was not unexpected since the first set contained a large organic load
acquired from the 10% inoculum, while the second set was inoculated with digested product from the
first set which had only small amounts of organic matter.
Once the methane production from the second set of enrichments plateaued, a third set was
inoculated. The methane production from the third generation of enrichments followed a similar
pattern. The rumen (pH 6.3) inoculum was the highest (Figure 6). The mixture exhibited a large variance
in methane production because one of the triplicates failed to produce methane. In the third set of
enrichments, neither the rumen (pH 6.3) nor the mixture reached a plateau.
Additional COD removal analyses were performed on the third set of enrichments in order to
estimate the loss of organics. It can be seen that rumen (pH 6.3) and the mixture of inocula were the
enrichments that removed the most COD, and this correlated with the methane production observed
(Figure 7). There was a larger variance in the mixed inoculum enrichment, this is related to the single
enrichment that did not produce methane. Theoretically for every gram of COD removed, 0.351 L of

27
methane should be produced (8). On average the rumen (6.3 pH) removed 45 mg of COD but only
produced 8.9 mL of methane, which represented 56% of the methane that could have been produced.
Carrot waste has a moisture content of 85%, therefore the actual amount of digestible dry
weight per bottle was 0.045 g of carrot waste. Carrot pomace is mainly a source of fiber (4). If all that
fiber converted to sugars and then to acetate, carbon dioxide and methane, a maximum amount of 750
micromoles of methane could be produced. Microorganisms use carbon for growing and maintenance,
therefore it is impossible to reach the maximum methane production. Mixture and rumen (pH 6.3)
enrichments produced larger concentrations of methane in the first enrichments; this may be due to the
organic matter present in the original source of inoculum. Nevertheless, these same sources of microbes
exhibit faster methane production in the later sets of enrichments which illustrates the adaptation of
the microorganisms.
Influence of sulfates in the methane production.
Only two of the seven sources of inoculum produced significant amounts of methane. The
mineral media used in these enrichments (3) was designed to culture methanogens. The final
concentration of sulfate in the enrichments is around 83 µM. Since the carrot enrichments contained
anaerobic communities, there is a chance that sulfate‐reducing bacteria may be present and convert
sulfate into sulfide, which could inhibit methanogenesis (9). A new medium was designed, replacing all
of the sulfates with chlorides in equimolar concentrations. A set of enrichments was started which were
inoculated with the six environmental samples (the mixture was not used) in triplicate. These
enrichments contained either Balch medium or the modified Balch medium (replacing sulfate with
chlorides). The methane production of the enrichments at day 42 showed that the presence of sulfates
did not make a significant difference in five of the six cultures (Figure 8). The presence of sulfate makes a
significant difference in the community present in sediments from the Botanical Garden (Athens, GA)

28
(letter D in Figure 8). However the amount of methane produced by this sample in the absence of
sulfate was far below its potential. This eliminated the possibility that sulfate may have inhibited
methanogens in the previous enrichments.
The enrichments inoculated from the rumen (pH 7.3) produced a significant amount of methane
in contrast to its performance in the serial enrichments (letter C in figure 8). Although the source of
inoculum was taken from the same anaerobic stored bottle, this graph shows that after a year of being
stored anaerobically and at room temperature, the rumen community had transformed. Most likely
shifts in the methanogenic community during starvation (7) resulted in a community more suitable for
carrot digestion.
Scaling up the microbial community.
Usually anaerobic digesters are inoculated with up to 50% of volume, therefore, scaling up the
enrichments to achieve a volume large enough for testing in an anaerobic reactor was necessary
because. The upflow anaerobic digesters that were used have a volume of 3.45 L. This means that 1.72 L
of inocula were needed.
From the first set of enrichments, 20 mL of digested product was used as a 10% inoculum for a
200 mL digestion. Based on the amount of substrate added and ignoring the carbon uptake of the
microorganisms, the maximum methane formation would be 5000 µmol. Methane peaked around day
35 (Figure 9). These results are similar to its parallel experiment, the second set of enrichments. Both
the second set of enrichments and the first stage scale up are derivatives of the microbial community
developed in the first stage enrichment.
After the 200 mL enrichment’s methane production plateaued, a second stage scale up was
started. The volume of these enrichments was 2 L. These enrichments performed poorly compared to
the previous enrichments (Figure 10A). The amount of substrate was 10 times higher than the first

29
scaled up enrichment, but the methane production was far below the expected production levels. From
the triplicate, two of the enrichments produced less than 10% of the expected methane production, and
the other produced 39% of its potential. Moreover, the maximum amount of methane was produced by
day 73, which is twice as long as was previously observed.
The setup of these enrichments differed from previous enrichments in several aspects. Since the
bottle size was 4 L, it did not fit into the anaerobic chamber so gas flushing was used to create an
anaerobic environment. Cysteine was added after autoclaving, and, in general, the anaerobic
environment was not maintained as well with these techniques. Presence of oxygen possibly caused the
inhibition of methanogenesis. In previous setups, O2 was completely absent. There is the chance that no
microaerophilic bacteria were developed in these microbial communities, making it difficult for the
community to tolerate minimum amounts of oxygen.
The microbial community of the 2 L enrichments was assessed. An aliquot of 3 mL of the
digested product was taken and inoculated as previously described in the anaerobic chamber. The
methane production was delayed when compared with the third set of enrichments, but after a period
of acclimatization, the methane production was restored (Figure 10B). This demonstrates that the
microbial community was still capable of methane production. Possibly, the presence of oxygen affected
the methanogenesis in the 2 L enrichments.
Testing the community on an upflow anaerobic digester.
Two upflow anaerobic digesters were setup. One was inoculated with 50% with the digested
product of the 2 L enrichment that produced higher concentration of methane; the second was
inoculated with 10% of freshly collected filtered rumen fluid. Both reactors contained 1% carrot waste.
A photograph of the reactors setup on day two can be seen in Figure 11.

30
The reactors went through a process of recirculation, in which a maximum methane production
of 87.5 mmol was expected according to the amount of carrot waste added. COD removal and methane
production were observed throughout the recirculation process. The methane production of the reactor
with the adapted inoculum was very low, whereas the rumen showed a logarithmic methane production
(data not shown). Chemical oxygen demand measurements were not accurate due to difficulty in taking
representative and homogenous samples.
The fermentation process which can be scaled up without any difficulty is a rarity (12). During
the setup of the reactors, the preparation and handling of the media and the containers differed from
the 160 mL enrichments. The anaerobic conditions are much less controlled. Since the developed
community was specialized and acclimatized to the conditions given in the small volume enrichments,
all these changes in medium preparation and oxygen levels could be reasons for the failure of the
reactor setup. However, the rumen sample consists of a very rich and diverse community that can adapt
to these conditions with more ease than the already adapted developed community.
Analysis of 16S rDNA gene controls.
To establish the length of the amplicon used, the software parameters and distance at which the
OTUs were to be clustered, three cloned 16S rDNA genes were run as controls. Since the length of the
obtained sequences varied from 34 bp to 531 bp, with a median of 489 bp, a test was performed to
determine the length at which the sequences should be trimmed. The sequences were analyzed using
only MOTHUR (and without step #11 in the sequence analysis pipeline). At length 250 bp is when the
less number of OTUs are formed, followed by length 400 bp (Table length). Among these two lengths,
the percent of correctly classified sequences only differs by 1.21%. The length 250 bp includes 231 more
sequences in the analysis than the length 400 bp, which translates to 34,650 base pairs more. On the
other hand, the length 400 bp includes 367,800 more base pairs than the length 250 bp. Since the 400

31
bp length included more base pairs (information) and performed as wellas the 250 bp, it was chosen for
further analyses.
Once it was established that the length of the amplicon used should be 400 bp, a comparison
using different pipelines was performed. One of the pipelines tested was using only MOTHUR (and
without step #11 in the sequence analysis pipeline). The other pipeline tested was using QIIME to
denoise (step #3 in the sequence analysis pipeline) the data and pre.cluster (step #11 in the sequence
analysis pipeline). It was evident that the use of these two tools reduced the number of OTUs and
increased the percentage of correctly classified sequences especially at shorter distances (Figure 12). At
longer distances such as 0.06 and 0.08 using denoise and precluster tools just increased by 0.3% the
correctly classified sequences. The use of these parameters was included in the rest of further analysis.
Out of the 3987 sequences obtained from the sequencing facility, 70% passed the quality filters
for inclusion in the analysis (Table 4). The quality sequences were aligned against the SILVA database in
MOTHUR and clustered at different distances. The number of OTUs and the percentage of sequences
correctly assigned approached a constant value at a distance of 0.03 (Figure 12). Therefore, 0.03 was
selected as the distance to cluster the sequences. It is important to note that at distance 0.03, the
percentage of correctly classified sequences is 96.23%. Therefore, there is an error rate of 3.77%. In
addition, 38 OTUs are observed which is 35 more OTUs than expected from the three different 16S rRNA
genes. Of those 35 OTUs, one contained 17 sequences distributed in the three libraries, which was
probably a contamination. The representative sequence from this OTU was compared to the NCBI
database and revealed 100% similarity to an E. coli 16S rRNA gene sequence. This information leads to
the conclusion that 0.6% of the analyzed sequences came from a contaminant. The other 34 OTUs were
all smaller than 10 sequences.

32
Community analysis.
The composition of the communities inhabiting the enrichments and the natural sources of
inoculum was assessed through the amplification of a 16S rRNA gene amplified region (V3 for bacteria
and V6 for archaea). The reads were aligned and clustered into operational taxonomic units (OTU). Since
5 of the inoculum sources did not produce a significant amount of methane, only the 16S rRNA genes
from the two sources of inoculum and their successive enrichments that did produce significant
amounts of methane were sequenced. Therefore the whole series of rumen (pH 6.3) and mixed source
inocula were sequenced. One of the samples from the second generation of the mixed inoculum
enrichments was lost due to degradation of DNA in the freezer.
Previous reports show that bacteria are the dominant superkingdom in the biogas reactor (10),
therefore more sequences from the bacterial than the archaeal 16S RNA gene were obtained by
submitting 20 times more bacterial than archaeal amplicons. Once the sequences were obtained from
the sequencing facility, it was observed that the good quality sequences were about 70% (Table 5). After
clustering, the archaeal sequences formed 59 OTUs, and the bacterial sequences formed 13,328 OTUs.
The diversity of archaeal and bacterial communities diminished as the community became more
adapted to the enrichment (Figure 13). The number of OTUs was drastically reduced after the first
enrichment. Rarefaction curves were created to better illustrate how the richness of the communities
decreased with the adaptation process (Figure 14). Another good estimator of diversity is the Simpson’s
diversity index. With this index, 0 represents infinite diversity and 1 represents no diversity. The
Simpson’s index of the bacterial and the archaeal gradually increases as the communities adapt (Table 6
and 7). The Shannon diversity index represents a measure of community evenness. The higher the
number, the more homogeneous is a population. All these estimators confirm that anaerobic digestion
has greater bacterial than archaeal diversity and that the more adapted the community becomes to a
specific substrate and condition, the less diverse the community becomes.
33
A representative sequence from every archaeal and bacterial OTU was chosen and its closest
homologue was identified. Representative sequences were matched to isolated species and
environmental samples. Table 8 shows the number of bacterial and archaeal sequences and their
percentage of relatedness with isolated microorganisms and environmental samples. Sequences with
high similarity to database are less likely to be errors. Of the bacterial sequences, 97% have greater than
90% similarity to previously described environmental sequences, whereas 99.9% of the archaeal
sequences have greater than 96% similarity to previously described environmental sequences. This
reflects that bacterial communities from the environment and reactors are described less than archaeal
communities in the literature. This could be because the archaeal community is less diverse, therefore,
easier to sample and describe. The table also shows the number of OTUs and their percentage similarity
with isolated microorganisms. At similarity values below 97.5% it is unlikely that two organisms are
related at the level of species (18). Only 366 bacterial OTUs have greater than 97% similarity with
previously isolated bacteria. Therefore, 97.25% of the OTUs found in the anaerobic community most
likely have never been isolated. In the archaeal community, 10 OTUs show more than 97% similarity to
isolated species, representing 16.9% of the total number of archaeal OTUs. The sampled archaeal
community has been relatively more isolated than the sampled bacterial community.
Members from the domain Archaea are responsible for the methane production, which is the
last step in the anaerobic digestion. After sequencing, 7698 quality were sequences obtained and
clustered into 59 OTU using precluster followed by cluster commands in MOTHUR. Eleven OTUs out of
the 59 cluster more than 20 sequences (Table 9). These eleven OTUs represent 98% of the total number
of archaeal sequences obtained (Figure 15). A summary of these 11 OTUs is shown in Table 10 and Table
11. Two different trends can be observed. OTUs that were not detected in the source of inoculum were
enriched and dominate the community in the digestion conditions. The most dominant OTUs in the
source of inoculum were diluted out or otherwise removed during the enrichments. The distribution of

34
the sequences in the libraries supports that as the communities become more adapted to specific
conditions, the diversity decreases. Methanobacteriales was the most dominant order of methanogens
in both sources of inoculum (Table 12 and 13). Methanosarcinales was the most dominant order in the
anaerobic digestion enrichments. The most abundant OTU in the enrichments was represented by a
sequence that shares 99.7% similarity with Methanosarcina mazei. The group Methanosarcina is often
found in anaerobic digestion (5‐7, 11). Relatives to Methanosarcina were not detected in the rumen and
hardly detected in the mixed source of inoculum.
The triplicate inoculated with the mixed source which failed to produce methane, was primarily
colonized by an unclassified order of archea that is 82.5% related to Thermogymnomonas acidicola.
Since the percent of similarity is low the phenotype of the microorganism cannot be deduced. The
representative sequence of this OTU did have 97.4% similarity to a clone from a pig manure storage pit
(16). Unclassified sequences closely related to members of the order Thermoplasmatales have also been
found in sheep rumen (23). This shows that this kind of microorganism is well adapted to anaerobic
environments and communities. As Snell‐Castro discussed, it might represent a microorganism
belonging to a new group of archaea.
The bacterial communities in reactors are responsible for the conversion of polymers into
volatile acids, acetate, carbon dioxide and hydrogen that can be used by the methanogens to produce
methane. Table 14 and 15 summarize the trend of the bacterial communities when adapted from the
environment to the anaerobic digestion of carrot. Both natural communities have high abundance of
Prevotellaceae and Clostridia. After the adaptation the major groups were Spirochaetes,
Porphyromonadaceae, Bacteroidaceae and Bacilli. Some studies have found members of the group
Clostridia were abundant in anaerobic reactors (5, 10, 14, 21), others have found Bacteroidetes (11, 21).
All of these organisms anaerobically hydrolyze complex and simple sugars to produce acids (Table 16
and 17) (2, 13, 17, 20). It is also interesting to note that Synergistetes was not detected in the rumen and

35
barely detected in the mixed inoculum but increased to approximately 1% of the population in the final
enrichments. Synergistetes is a group of microorganisms that couple the volatile fatty acids consumption
with the H2 production (15).
The enrichment that failed to produce methane shows another anomaly. While the other third
generation enrichments have a low abundance of Clostridia, 44% of this enrichment consist of Clostridia.
Most of these sequences are represented by OTU 9, which has 98.7% similarity to Clostridium quinii
(Table 17). This microorganism was isolated from a UASB reactor and is a saccharolytic anaerobe that
produces small amounts of butyrate during exponential growth (19). It was also observed that the
number of Porphyromonadaceae and Bacilli are reduced in this enrichment. Presumably, this shift in
bacterial population affected the methane production as well as the archaeal population, including the
absence of the Methanosarcina group.
Moreover the abundance of the 16S rDNA genes was assessed. The average gene copy number
per 1 µL of the bacterial communities in the enrichments was 3.58x10⁶ ± 2.36x10⁶. It was found that in
reactors which produce methane, the number of bacterial 16S rDNA genes is up to 5 fold the number of
archaeal genes, and this ratio increased to 16 in the reactor that failed to produce methane (Table 18).
This proved the reduction of the archaeal community when the reactors failed to produce methane.
In conclusion, it was observed that when the community adapts from a very diverse natural
community to a specific community with a definite function, the diversity decreased drastically. It was
also be observed that the bacterial population in an anaerobic reactor was more diverse than the
archeal population. A reactor failure to produce methane involved community shifts and the loss of
methanogens. Further proposed studies would include amplification and sequencing of genes related to
function along with the 16S rRNA gene in order to obtain more information from the communities. This
information could be helpful to better understand the chemical interaction among microorganisms.

36
Isolation of new bacterial and archaeal species will also give further insight into the anaerobic digestion
microbial communities.
REFERENCES
1. Arvanitoyannis, I. S., and T. H. Varzakas. 2008. Vegetable waste treatment: Comparison and
critical presentation of methodologies. Crit. Rev. Food Sci.Nutr. 48:205‐247.
2. Bakir, M. A., M. Kitahara, M. Sakamoto, M. Matsumoto, and Y. Benno. 2006. Bacteroides
finegoldii sp. nov., isolated from human faeces. Int. J.Syst.Evol. Microbiol.56:931‐935.
3. Balch, W. E., C. E. Fox, L. J. Magrum, C. R. Woese, and R. S. Wolfe. 1979. Methanogens:
reevaluation of a unique biological group. Microbiol. Rev. 43:260.
4. Bao, B., and K. C. Chang. 2006. Carrot Pulp Chemical Composition, Color, and Water‐holding
Capacity as Affected by Blanching. J. Food Sci. 59:1159‐1161.
5. Fernandez, A., S. Huang, S. Seston, J. Xing, R. Hickey, C. Criddle, and J. Tiedje. 1999. How stable
is stable? function versus community composition. Appl. Env. Microbiol.65:3697‐3704.
6. Franke‐Whittle, I. H., M. Goberna, V. Pfister, and H. Insam. 2009. Design and development of
the ANAEROCHIP microarray for investigation of methanogenic communities. J. Microbiol.
Methods 79:279‐288.
7. Hwang, K., M. Song, W. Kim, N. Kim, and S. Hwang. 2010. Effects of prolonged starvation on
methanogenic population dynamics in anaerobic digestion of swine wastewater. Suppl. Issue
Rec. Dev. Biomass Conv. Technol.101:S2‐S6.
8. Jennett, J. C., and J. N. D. Dennis. 1975. Anaerobic filter treatment of pharmaceutical waste. J.
Water Pollut. Control 45:104‐121.
9. Karhadkar, P. P., J.‐M. Audic, G. M. Faup, and P. Khanna. 1987. Sulfide and sulfate inhibition of
methanogenesis. Water Res. 21:1061‐1066.

37
10. Krause, L., N. N. Diaz, R. A. Edwards, K.‐H. Gartemann, H. Krömeke, H. Neuweger, A. Pühler, K.
J. Runte, A. Schlüter, J. Stoye, R. Szczepanowski, A. Tauch, and A. Goesmann. 2008. Taxonomic
composition and gene content of a methane‐producing microbial community isolated from a
biogas reactor. J. Biotechnol. 136:91‐101.
11. Liu, F. H., S. B. Wang, J. S. Zhang, J. Zhang, X. Yan, H. K. Zhou, G. P. Zhao, and Z. H. Zhou. 2009.
The structure of the bacterial and archaeal community in a biogas digester as revealed by
denaturing gradient gel electrophoresis and 16S rDNA sequencing analysis. J. Appl.Microbiol.
106:952‐966.
12. Lonsane, B. K., G. Saucedo‐Castaneda, M. Raimbault, S. Roussos, G. Viniegra‐Gonzalez, N. P.
Ghildyal, M. Ramakrishna, and M. M. Krishnaiah. 1992. Scale‐up strategies for solid state
fermentation systems. Process Biochem.27:259‐273.
13. Nishiyama, T., A. Ueki, N. Kaku, K. Watanabe, and K. Ueki. 2009. Bacteroides graminisolvens
sp. nov., a xylanolytic anaerobe isolated from a methanogenic reactor treating cattle waste. Int.
J. Syst.Evol. Microbiol. 59:1901‐1907.
14. Schlüter, A., T. Bekel, N. N. Diaz, M. Dondrup, R. Eichenlaub, K.‐H. Gartemann, I. Krahn, L.
Krause, H. Krömeke, O. Kruse, J. H. Mussgnug, H. Neuweger, K. Niehaus, A. Pühler, K. J. Runte,
R. Szczepanowski, A. Tauch, A. Tilker, P. Viehöver, and A. Goesmann. 2008. The metagenome
of a biogas‐producing microbial community of a production‐scale biogas plant fermenter
analysed by the 454‐pyrosequencing technology. J. Biotechnol. 136:77‐90.
15. Sekiguchi, Y., Y. Kamagata, K. Nakamura, A. Ohashi, and H. Harada. 2000. Syntrophothermus
lipocalidus gen. nov., sp. nov., a novel thermophilic, syntrophic, fatty‐acid‐oxidizing anaerobe
which utilizes isobutyrate. Int. J. Syst. Evol. Microbiol. 50:771‐779.

38
16. Snell‐Castro, R., J. J. Godon, J. P. Delgenes, and P. Dabert. 2005. Characterisation of the
microbial diversity in a pig manure storage pit using small subunit rDNA sequence analysis.
FEMS Microbial Ecol.52:229‐242.
17. Song, Y., C. Liu, J. Lee, M. Bolanos, M.‐L. Vaisanen, and S. M. Finegold. 2005. "Bacteroides
goldsteinii sp. nov." Isolated from Clinical Specimens of Human Intestinal Origin. J. Clin.
Microbiol. 43:4522‐4527.
18. Stackerbrandt, E., and B. M. Goebel. 1994. Taxonomic note: A place for DNA‐DNA reassociation
and 16S rRNA sequence analysis in the present species definition in bacteriology. Int. J. Syst.
Evol. Microbiol. 44:846‐849.
19. Svensson, B. H., H.‐C. Dubourguier, G. Prensier, and A. J. B. Zehnder. 1992. Clostridium quinii
sp. nov., a new saccharolytic anaerobic bacterium isolated from granular sludge. Arch. of
Microbiol. 157:97.
20. Ueki, A., H. Akasaka, D. Suzuki, and K. Ueki. 2006. Paludibacter propionicigenes gen. nov., sp.
nov., a novel strictly anaerobic, Gram‐negative, propionate‐producing bacterium isolated from
plant residue in irrigated rice‐field soil in Japan. Int. J. Syst. Evol. Microbiol. 56:39‐44.
21. Wang, H., K. Tolvanen, A. Lehtomaki, J. Puhakka, and J. Rintala. 2010. Microbial community
structure in anaerobic co‐digestion of grass silage and cow manure in a laboratory continuously
stirred tank reactor. Biodegrad. 21:153‐146.
22. Ward, A. J., P. J. Hobbs, P. J. Holliman, and D. L. Jones. 2008. Optimisation of the anaerobic
digestion of agricultural resources. Bioresour. Technol. 99:7928‐7940.
23. Wright, A.‐D. G., A. F. Toovey, and C. L. Pimm. 2006. Molecular identification of methanogenic
archaea from sheep in Queensland, Australia reveal more uncultured novel archaea. Anaerobe
12:134‐139.

39
Figure 2. Micromoles of methane present in first set of preliminary enrichments on day 21. Dark grey and light grey bars represent the data from
the two replicates. The sample numbers correspond to four different environmental samples that were collected, namely, 1. Okefenokee marsh
(3/18/07), 2. Botanical garden (9/20/08), 3. Okefenokee wildlife refuge (3/18/07), and 4. Lake Herrick (9/20/08)
0
50
100
150
200
250
300
1‐1% 1‐10% 2‐1% 2‐10% 3‐1% 3‐10% 4‐1% 4‐10%
Methan
e produced (micromoles)
Sample number and carrot concentration

40
Figure 3. Micromoles of methane per bottle present in the second set of preliminary enrichments on day 21. Dark grey and light grey bars
represent the data from the two replicates. The sample numbers correspond to four different environmental samples that were collected 2.
Botanical garden (9/20/08), 4. Lake Herrick (9/20/08
0
20
40
60
80
100
120
140
160
2‐1% 2‐2% 2‐4% 2‐6% 2‐10% 4‐1% 4‐2% 4‐4% 4‐6% 4‐10%
Methan
e produced (mocrim
oles)
Sample number and carrot concentration

41
Figure 4. Comparison of methane production over the duration of enrichment after inoculation with environmental sample.
0
100
200
300
400
500
600
700
800
900
1000
0 10 20 30 40 50 60 70
Methan
e produced (micromoles)
Time in days
Okefenokee [pH 5.3]
Okefenokee [pH 4.9]
Rumen [pH 7.3]
Rumen [pH 6.3]
Lake Herrick [pH 6.4]
Botanical Garden [pH 6.7]
Mixture

42
Figure 5. Comparison of methane production over the duration of enrichment after inoculation with digested product from the first generation
enrichments.
0
50
100
150
200
250
300
350
400
450
500
0 10 20 30 40 50 60
Methan
e produced (micromoles)
Time in days
Okefenokee [pH 5.3]
Okefenokee [pH 4.9]
Rumen [pH 7.3]
Rumen [pH 6.3]
Lake Herrick [pH 6.4]
Botanical Garden [pH 6.7]
Mixture

43
Figure 6. Comparison of methane production over the duration of enrichment after inoculation with digested product from the second
generation enrichments.
0
100
200
300
400
500
600
0 5 10 15 20 25 30 35 40 45
MEthan
e produced (micromoles)
Time in days
Okefenokee [pH 5.3]
Okefenokee [pH 4.9]
Rumen [pH 7.3]
Rumen [pH 6.3]
Lake Herrick [pH 6.4]
Botanical Garden [pH 6.7]
Mixture

44
Figure 7. COD removal of the third generation enrichment. Enrichments were inoculated with digested product of a second generation
enrichments. A. Okefenokee (pH 5.3). B. Okefenokee (pH 4.9). C. Rumen (pH 7.3). D. Rumen (pH 6.3). E. Lake Herrick (pH 6.4). F. Botanical
Garden (pH 6.7). Initial COD was 4318 mg/L with a standard deviation of 200 mg/L.
0
10
20
30
40
50
60
A B C D E F M
Percentage
of COD removal
Initial source of inoculum

45
Figure 8. Influence of sulfate on the anaerobic communities producing methane on day 42. A. Okefenokee (pH 5.3). B. Okefenokee (pH 4.9). C.
Rumen (pH 7.3). D. Rumen (pH 6.3). E. Lake Herrick (pH 6.4). F. Botanical Garden (pH 6.7). Inocula was stored for 7 months after the inoculation
of the first generation enrichments and before inoculation of this experiment.
0
50
100
150
200
250
300
350
A B C D E F
Methan
e produced (micromoles)
Source of inoculum
With SO4
Without SO4

46
Figure 9. Methane production of the first stage of scaling from rumen (pH 6.3) enrichment.
0
500
1000
1500
2000
2500
3000
3500
4000
0 10 20 30 40 50 60
Methan
e produced (micromoles)
Time in days
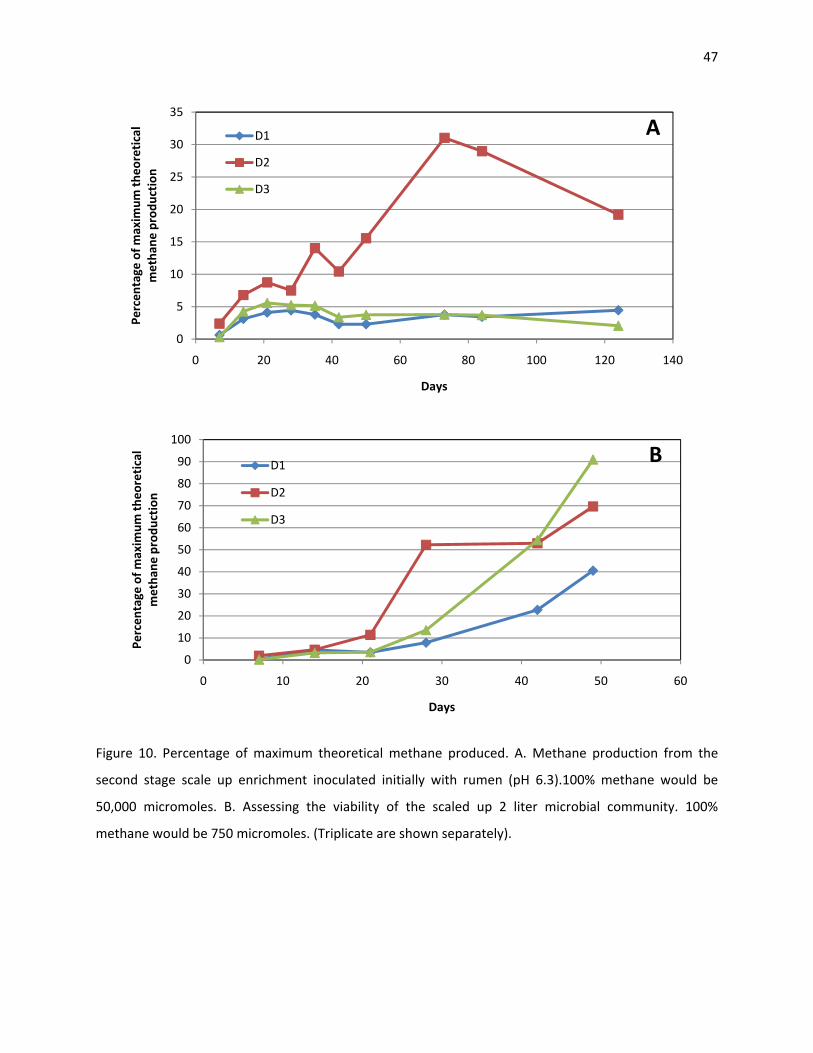
47
Figure 10. Percentage of maximum theoretical methane produced. A. Methane production from the
second stage scale up enrichment inoculated initially with rumen (pH 6.3).100% methane would be
50,000 micromoles. B. Assessing the viability of the scaled up 2 liter microbial community. 100%
methane would be 750 micromoles. (Triplicate are shown separately).
0
5
10
15
20
25
30
35
0 20 40 60 80 100 120 140
Percen
tage
of m
axim
um th
eoretical
metha
ne produ
ction
Days
AD1
D2
D3
0
10
20
30
40
50
60
70
80
90
100
0 10 20 30 40 50 60
Percen
tage
of m
axim
um th
eoretical
metha
ne produ
ction
Days
BD1
D2
D3

48
Figure 11. Upflow anaerobic digesters.

49
Table 3. Performance of the clustering at different lengths of sequence used. Three cloned environmental 16S rDNA genes were amplified and
the sequences trimmed at the specified length and then clustered at distance 0.03
Minimum length (bp) 100 150 200 250 300 350 400Number of sequences analyzed 3286 3172 3120 3068 3008 2955 2837Number of sequences correctly classified 2864 2967 2940 2915 2767 2804 2661Percent of correctly classified sequences 87.18 93.56 94.26 95.04 92.02 94.89 93.83Number of OTU 119 91 80 66 74 74 69

50
Figure 12. Summary of controls analysis. Comparison of the performance of clustering using pyronoise in QIMME and pre.cluster in MOTHUR
versus MOTHUR alone. Percentage of correctly classified sequences and number of OTUs are plotted versus the distance at which those OTUs
where formed.
50
55
60
65
70
75
80
85
90
95
100
0
50
100
150
200
250
300
0 0.02 0.04 0.06 0.08 0.1
Percentage
Number of OTU
Distance
No. OTU (denoise + pre.cluster)
No. OTU with MOTHUR alone
Percentage of correctly classifiedsequences (denoise + precluster)
Percentage of correct classifiedsequences with MOTHU alone

51
Table 4. Sequences obtained from the controls. Raw sequences were obtained from the sequence
facility and quality sequences were assessed using QIIME
Raw sequences
Quality sequences
C1 1521 1011
C2 1514 1070
C3 952 737
Total 3987 2818

52
Table 5. Sequences obtained from the communities. On the labels, the ordinal number refers to the
number in the enrichment generation, the letter refers to the source of inoculum and the last number
refers to triplicate.
Labels Bacteria Archaea
Raw sequences Quality sequences Raw sequences Quality sequences
Rumen 42931 27762 1833 1355
Mixture 37272 25173 1687 1203
1stD1 4305 3023 471 320
1stD2 9898 6465 569 407
1stD3 13114 9367 872 636
1stM1 15301 10426 392 273
1stM2 9169 5940 847 638
1stM3 34644 21897 299 208
2ndD1 3982 2549 346 242
2ndD2 3551 2386 63 46
2ndD3 5412 3598 198 150
2ndM2 5108 3370 1175 872
2ndM3 4936 3360 143 97
3rdD1 3721 2532 155 116
3rdD2 4498 3134 98 68
3rdD3 5563 3864 200 138
3rdM1 6898 4840 949 674
3rdM2 4637 3000 327 226
3rdM3 6596 4509 49 29
Total 221536 147195 10673 7698

53
Figure 13. Microbial community diversity trends through successive enrichments. A. Archaeal
community trends. B. Bacterial community trends
0
5
10
15
20
25
30
35
0 0.5 1 1.5 2 2.5 3 3.5
Number of OTU
s
Generations of enrichments
A
Rumen derivedenrichments
Mixed inoculumderived enrichments
0
1000
2000
3000
4000
5000
6000
7000
0 0.5 1 1.5 2 2.5 3 3.5
Number of OTU
s
Generations of enrichments
B
Rumen derivedenrichments
Mixed inoculumderived enrichments

54
0
500
1000
1500
2000
2500
0 1000 2000 3000 4000 5000 6000
Number of OTU
s
Number of sequences
A rumen
1stD1
1stD2
1stD3
2ndD1
2ndD2
2ndD3
3rdD1
3rdD2
3rdD3
0
500
1000
1500
2000
2500
0 1000 2000 3000 4000 5000 6000
Number of OTU
s
Number of sequences
B
mixture
1stM1
1stM2
1stM3
2ndM2
2ndM3
3rdM1
3rdM2
3rdM3

55
Figure 14. Rarefaction curves of the microbial communities. A. Bacterial communities from rumen (pH
6.3). B. Bacterial communities from mixed source of inoculum. C. Archaeal communities from rumen (pH
6.3). D. Archaeal communities from mixed source of inoculum. On the labels, the ordinal number refers
to the number in the enrichment generation, the letter refers to the source of inoculum and the last
number refers to triplicate.
0
2
4
6
8
10
12
14
16
18
20
0 200 400 600 800
Number of OTU
s
Number of sequences
C rumen
1stD1
1stD2
1stD3
2ndD1
2ndD2
2ndD3
3rdD1
3rdD2
3rdD3
0
5
10
15
20
25
30
0 200 400 600 800
Number of OTU
s
Number of sequences
D
mixture
1stM1
1stM2
1stM3
2ndM2
2ndM3
3rdM1
3rdM2
3rdM3
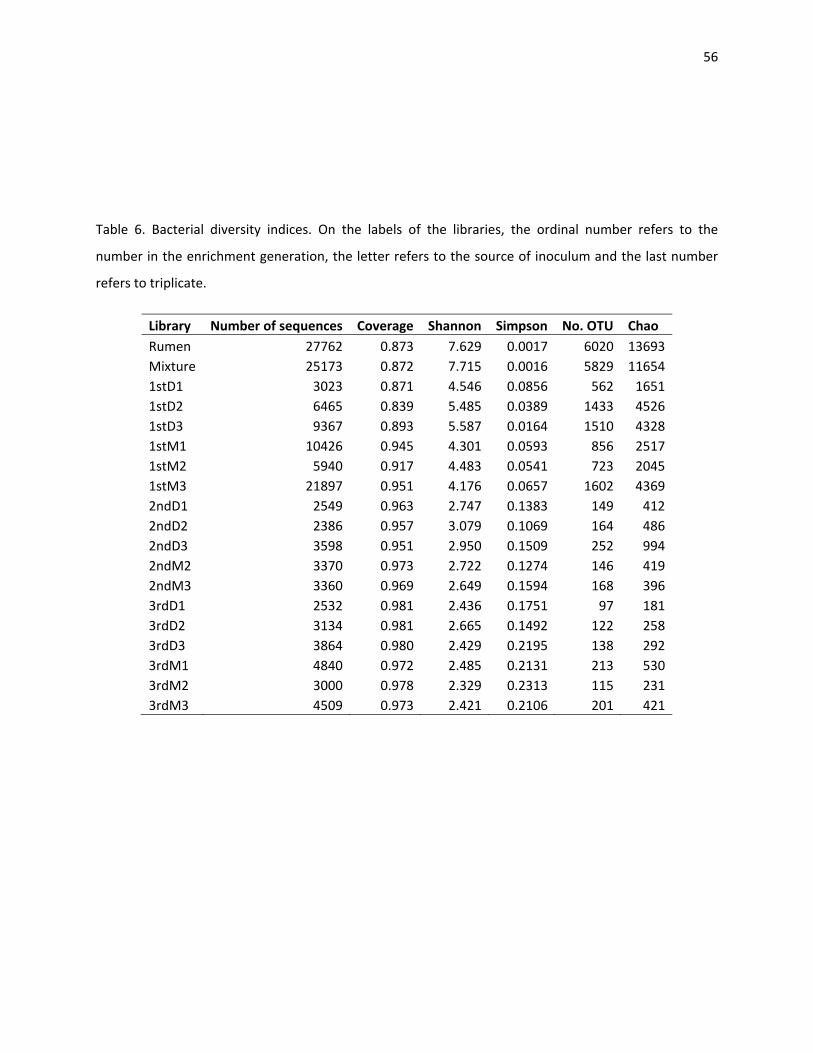
56
Table 6. Bacterial diversity indices. On the labels of the libraries, the ordinal number refers to the
number in the enrichment generation, the letter refers to the source of inoculum and the last number
refers to triplicate.
Library Number of sequences Coverage Shannon Simpson No. OTU Chao
Rumen 27762 0.873 7.629 0.0017 6020 13693
Mixture 25173 0.872 7.715 0.0016 5829 11654
1stD1 3023 0.871 4.546 0.0856 562 1651
1stD2 6465 0.839 5.485 0.0389 1433 4526
1stD3 9367 0.893 5.587 0.0164 1510 4328
1stM1 10426 0.945 4.301 0.0593 856 2517
1stM2 5940 0.917 4.483 0.0541 723 2045
1stM3 21897 0.951 4.176 0.0657 1602 4369
2ndD1 2549 0.963 2.747 0.1383 149 412
2ndD2 2386 0.957 3.079 0.1069 164 486
2ndD3 3598 0.951 2.950 0.1509 252 994
2ndM2 3370 0.973 2.722 0.1274 146 419
2ndM3 3360 0.969 2.649 0.1594 168 396
3rdD1 2532 0.981 2.436 0.1751 97 181
3rdD2 3134 0.981 2.665 0.1492 122 258
3rdD3 3864 0.980 2.429 0.2195 138 292
3rdM1 4840 0.972 2.485 0.2131 213 530
3rdM2 3000 0.978 2.329 0.2313 115 231
3rdM3 4509 0.973 2.421 0.2106 201 421
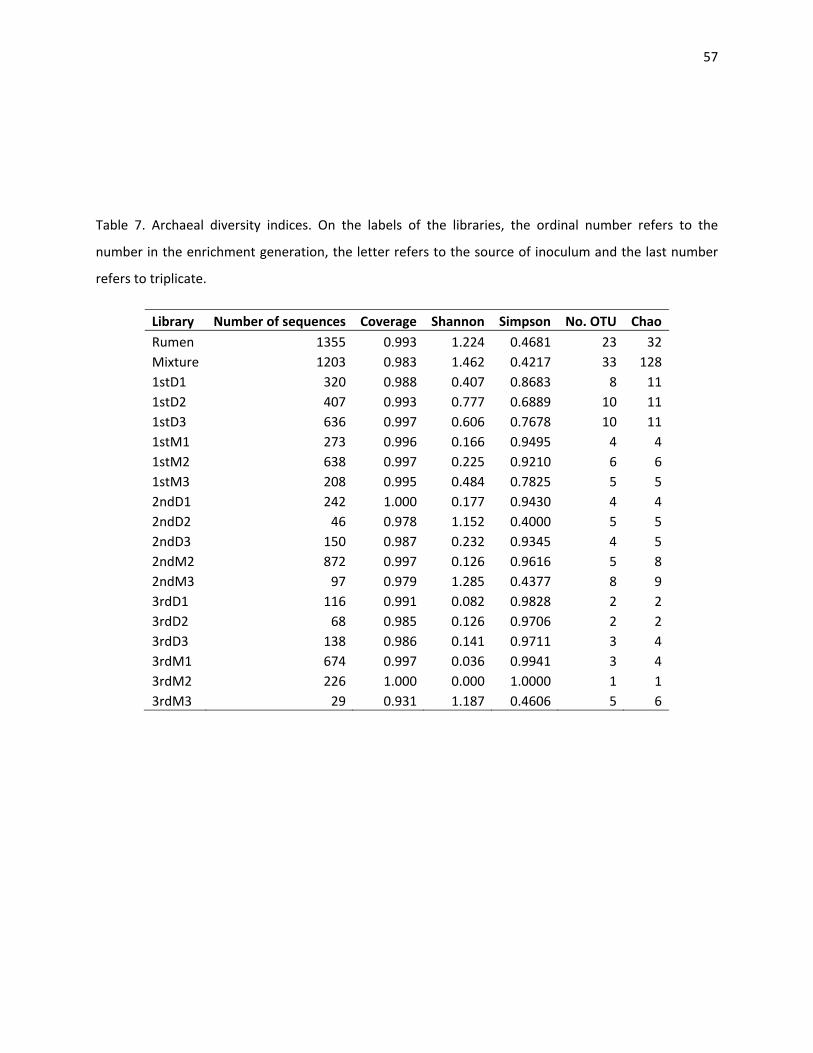
57
Table 7. Archaeal diversity indices. On the labels of the libraries, the ordinal number refers to the
number in the enrichment generation, the letter refers to the source of inoculum and the last number
refers to triplicate.
Library Number of sequences Coverage Shannon Simpson No. OTU Chao
Rumen 1355 0.993 1.224 0.4681 23 32
Mixture 1203 0.983 1.462 0.4217 33 128
1stD1 320 0.988 0.407 0.8683 8 11
1stD2 407 0.993 0.777 0.6889 10 11
1stD3 636 0.997 0.606 0.7678 10 11
1stM1 273 0.996 0.166 0.9495 4 4
1stM2 638 0.997 0.225 0.9210 6 6
1stM3 208 0.995 0.484 0.7825 5 5
2ndD1 242 1.000 0.177 0.9430 4 4
2ndD2 46 0.978 1.152 0.4000 5 5
2ndD3 150 0.987 0.232 0.9345 4 5
2ndM2 872 0.997 0.126 0.9616 5 8
2ndM3 97 0.979 1.285 0.4377 8 9
3rdD1 116 0.991 0.082 0.9828 2 2
3rdD2 68 0.985 0.126 0.9706 2 2
3rdD3 138 0.986 0.141 0.9711 3 4
3rdM1 674 0.997 0.036 0.9941 3 4
3rdM2 226 1.000 0.000 1.0000 1 1
3rdM3 29 0.931 1.187 0.4606 5 6

58
Table 8. Distribution of the sequences according to percent similarity to database sequences.
Bacteria Archaea
Closest environmental clone Closest isolated species Closest environmental Closest isolated species
Percent similarity No. of sequences No. sequences No. OTU No. of sequences No. sequences No. OTU
100 1998 34 3 0 0 0
>99 90175 24300 99 7376 4892 2
>98 103564 28372 217 7641 6644 5
>97 118453 34451 366 7682 7377 10
>96 126643 36056 571 7696 7386 17
>95 131772 39338 846 7696 7393 21
>94 135441 42487 1133 7696 7400 27
>93 138577 44955 1459 7696 7402 28
>92 140535 55082 1821 7696 7402 27
>91 142003 58808 2307 7696 7402 26
>90 143578 63606 2887 7696 7402 26
Total 147195 147195 13323 7698 7698 59

59
Table 9. OTU size distribution
OTU size No. of bacterial OTU No. of archaeal OTU
>1000 14 2
>100 146 5
>50 299 7
>20 720 11
>10 1258 16
>5 2093 17
>1 5408 27
Total no. OTU 13328 59

60
Figure 15. Distribution of the archaeal and bacterial population along all the data.
0
10
20
30
40
50
60
70
80
90
100
0 10 20 30 40 50 60 70 80 90 100
Percentage
of sequences
Percentage of OTU
Bacterial distribution
Archaeal distribution

61
Table 10. Abundance of specific OTUs in the archaeal 16S rRNA gene libraries created from rumen (pH6.3) enrichments. aTotal number of
sequences.
OTU number
Closest homologue Percentsimilarity
Libraries Na
Rumen 1st
generation 2nd
generation 3rd
generation
1 2 3 1 2 3 1 2 3
1 Methanosarcina mazei 99.7 0 298 336 556 235 24 145 115 67 136 1912
2 Methanobrevibacter millerae 98.4 879 5 17 18 2 2 1 0 0 1 925
3 Methanobrevibacter wolinii 97.9 285 0 0 0 0 0 0 0 0 0 285
5 Methanoculleus submarinus 97.1 0 11 30 32 2 17 3 0 1 1 97
4 Methanobrevibacter olleyae 99.4 60 0 10 13 0 2 1 0 0 0 86
6 Thermogymnomonas acidicola 81.4 40 0 0 3 0 0 0 0 0 0 43
8 Methanosphaera stadtmanae 98.7 15 0 2 1 0 0 0 0 0 0 18
11 Thermogymnomonas acidicola 82.9 19 0 0 0 0 0 0 0 0 0 19
7 Thermogymnomonas acidicola 82.5 0 0 0 0 3 0 0 0 0 0 3
13 Thermogymnomonas acidicola 83.9 13 0 0 0 0 0 0 0 0 0 13
14 Thermogymnomonas acidicola 83.5 9 0 0 1 0 0 0 0 0 0 10

62
Table 11. Abundance of specific OTUs in the archaeal 16S rRNA gene libraries created from mixed inoculums
enrichments. a Total number of sequences. b Enrichment that failed to produce methane.
OTU number Closest homologue
Percentsimilarity Libraries Na
Mixture 1st
generation 2nd
generation 3rd
generation
1 2 3 2 3 1 2 3b
1 Methanosarcina mazei 99.7 0 266 612 183 855 15 672 226 0 2829
2 Methanobrevibacter millerae 98.4 744 2 2 0 0 2 0 0 0 750
3 Methanobrevibacter wolinii 97.9 223 0 0 0 0 0 0 0 0 223
5 Methanoculleus submarinus 97.1 0 1 20 20 14 62 1 0 6 124
4 Methanobrevibacter olleyae 99.4 59 0 0 2 0 0 0 0 0 61
6 Thermogymnomonas acidicola 81.4 41 0 0 0 0 0 0 0 0 41
8 Methanosphaera stadtmanae 98.7 39 0 0 0 0 0 0 0 0 39
11 Thermogymnomonas acidicola 82.9 21 0 0 0 0 0 0 0 0 21
7 Thermogymnomonas acidicola 82.5 0 0 0 0 0 8 0 0 19 27
13 Thermogymnomonas acidicola 83.9 13 0 0 0 0 0 0 0 0 13
14 Thermogymnomonas acidicola 83.5 16 0 0 0 0 0 0 0 0 16

63
Table 12. Distribution of the sequences in the rumen enrichments within the orders of the domain
Archaea. Total percent of sequences in libraries is presented. a Number of sequences.
Phylogenetic group Libraries
Rumen
1st generation 2nd generation 3rd generation
(Order) 1 2 3 1 2 3 1 2 3
Methanobacteriales 93.0 1.6 7.1 5.0 0.8 8.7 1.3 0.0 0.0 0.7
Methanomicrobiales 0.0 3.5 7.4 5.0 0.8 37.0 2.0 0.0 1.5 0.7
Methanosarcinales 0.0 94.3 82.6 87.4 97.1 52.2 96.7 100.0 98.5 98.6
Thermoplasmatales 1.8 0.6 1.0 0.8 0.0 2.2 0.0 0.0 0.0 0.0
Unclassified 5.2 0.0 2.0 1.7 1.2 0.0 0.0 0.0 0.0 0.0
Sample sizea 1355 318 407 636 242 46 150 116 68 138

64
Table13. Distribution of the sequences in the mixed inoculum enrichments within the orders of the
domain Archaea. Total percent of sequences in libraries is presented. a Number of sequences.
bEnrichment that failed to produce methane.
Phylogenetic group Libraries
Mixture
1st generation 2nd generation 3rd generation
(Order) 1 2 3 2 3 1 2 3b
Methanobacteriales 90.1 0.7 0.5 1.0 0.0 3.1 0.1 0.0 0.0
Methanomicrobiales 0.2 0.4 3.1 9.6 1.6 64.9 0.1 0.0 20.7
Methanosarcinales 0.3 97.4 95.9 88.0 98.1 15.5 99.7 100.0 0.0
Thermoplasmatales 2.2 1.5 0.5 1.0 0.2 5.2 0.0 0.0 6.9
Unclassified 7.1 0.0 0.0 0.5 0.1 11.3 0.0 0.0 72.4
Sample sizea 1203 273 638 208 872 97 674 226 29

65
Table 14. Phylogenetic distribution of sequences in the rumen enrichments. Total percent of sequences
in libraries is presented. Shading represents the classes and families within the phylum above. a Number
of sequences. b Includes Deinococcus Thermus, Gemmatimonadetes, OP10, SR1, Thermotogae, and TM7.
Phylogenetic group Libraries
Rumen
1st generation 2nd generation 3rd generation
1 2 3 1 2 3 1 2 3
Actinobacteria 0.7 0.5 0.6 4.0 0.1 1.2 0.0 0.1 0.3 0.0
Bacteroidetes 31.9 15.5 21.2 28.9 48.8 60.3 29.9 36.6 35.8 23.3
Bacteroidia 29.6 9.7 16.2 26.2 47.7 57.7 29.1 36.4 34.5 21.9
Bacteroidaceae 0.1 1.6 1.1 1.6 11.4 8.0 4.3 10.5 17.7 3.3
Porphyromonadaceae 1.0 5.5 4.1 19.4 35.9 42.8 23.5 24.8 14.6 17.4
Prevotellaceae 26.1 0.7 0.5 1.4 0.0 0.0 0.0 0.0 0.0 0.0
Sphingobacteria 0.2 0.0 0.1 0.1 0.0 0.0 0.0 0.0 0.0 0.0
Unclassified 2.1 5.8 4.9 2.7 1.1 2.6 0.8 0.2 1.3 1.4
Chloroflex 0.5 0.2 0.4 0.2 0.1 0.1 0.1 0.0 0.4 0.1
Fibrobacteres 2.3 0.2 0.7 2.8 0.0 0.0 2.3 0.0 0.0 1.9
Firmicutes 44.4 25.9 31.5 32.9 25.5 13.0 37.7 37.6 35.8 46.2
Bacilli 0.2 0.4 0.2 2.5 21.9 8.5 33.0 32.9 31.0 43.0
Clostridia 41.6 24.6 30.3 29.5 3.6 4.4 4.7 4.6 4.8 3.1
Erysipelotrichi 0.6 0.7 0.8 0.3 0.0 0.0 0.1 0.1 0.0 0.2
Unclassified 2.0 0.1 0.2 0.5 0.0 0.0 0.0 0.0 0.0 0.0
Fusobacteria 0.0 0.1 0.0 0.0 0.0 0.0 0.0 0.0 0.0 0.0
Lentisphaerae 2.3 1.8 1.3 1.7 0.2 0.3 0.2 0.0 0.0 0.0
Planctomycetes 0.1 0.0 0.1 0.0 0.0 0.0 0.0 0.0 0.0 0.0
Proteobacteria 3.9 8.0 7.3 3.6 1.6 2.4 1.2 4.6 4.7 2.5
Spirochaetes 0.9 35.5 27.3 12.4 15.9 13.5 17.1 17.6 18.5 17.7
Synergistetes 0.0 1.6 1.4 1.0 1.5 1.5 1.9 1.1 1.2 1.4
Tenericutes 1.3 2.9 1.7 2.7 4.5 5.7 4.3 2.2 2.8 5.2
Verrucomicrobia 2.4 4.2 2.3 1.1 0.0 0.1 0.1 0.0 0.0 0.0
Unclassified bacteria 8.6 3.4 3.7 8.5 1.8 1.9 5.2 0.3 0.5 1.7
Minor phylumsb 0.7 0.1 0.4 0.1 0.0 0.1 0.0 0.0 0.0 0.0
Sample sizea 27762 3023 6465 9367 2549 2386 3598 2532 3134 3864

66
Table 15. Phylogenetic distribution of sequences in the mixed inoculum enrichments. Total percent of
sequences in libraries is presented. Shading represents the classes and families within the phylum
above.a Number of sequences. b Enrichment that failed to produce methane. c Includes Bacteria incertae
sedis, BRC1, Caldiserica, Chlamydiae, Chlorobi, Nitrospira, Deinococcus Thermus, Gemmatimonadetes,
OD1, OP10, SR1, Thermotogae, WS3 and TM7.
Phylogenetic group Libraries
Rumen
1st generation 2nd generation
3rd generation
1 2 3 2 3 1 2 3b
Acidobacteria 0.1 0.0 0.1 0.1 0.0 0.0 0.0 0.0 0.0
Actinobacteria 0.7 0.4 0.6 0.5 0.3 0.3 0.1 0.1 0.2
Bacteroidetes 31.3 21.9 21.7 41.4 43.5 43.4 33.6 27.1 22.3
Bacteroidia 28.4 18.4 18.6 25.6 42.5 42.2 33.4 25.9 22.0
Bacteroidaceae 0.1 3.6 4.2 10.3 5.3 6.0 17.2 10.6 15.1
Porphyromonadaceae 1.5 10.8 11.1 12.6 36.0 35.2 13.7 12.1 3.9
Prevotellaceae 24.0 0.1 0.2 0.2 0.0 0.0 0.0 0.0 0.0
Flavobacteria 0.0 0.0 0.1 0.0 0.0 0.0 0.0 0.0 0.0
Sphingobacteria 0.3 0.0 0.0 0.0 0.0 0.0 0.0 0.0 0.0
Unclassified 2.7 3.5 3.0 15.8 1.0 1.1 0.2 1.2 0.3
Chloroflexi 0.6 0.2 0.5 0.4 0.0 0.0 0.0 0.0 0.0
Cyanobacteria 0.1 0.1 0.2 0.1 0.0 0.0 0.0 0.0 0.0
Fibrobacteres 1.6 0.4 0.4 0.3 0.0 0.0 0.0 0.0 0.0
Firmicutes 45.4 39.4 36.3 22.3 20.1 31.0 46.7 54.5 62.6
Bacilli 1.1 1.9 1.2 1.1 16.0 22.9 41.3 45.3 18.6
Clostridia 41.8 36.8 34.4 20.9 4.0 8.1 5.3 9.1 44.0
Erysipelotrichi 0.8 0.7 0.6 0.2 0.1 0.1 0.0 0.1 0.0
Unclassified 1.9 0.0 0.1 0.1 0.0 0.0 0.0 0.0 0.0
Fusobacteria 0.1 0.3 0.1 0.1 0.0 0.0 0.0 0.0 0.0
Lentisphaerae 1.8 1.8 0.8 0.7 0.1 0.3 0.0 0.0 0.0
Planctomycetes 0.1 0.0 0.0 0.0 0.0 0.0 0.0 0.0 0.0
Proteobacteria 4.9 11.3 12.1 11.9 4.5 5.1 2.4 1.8 1.9
Spirochaetes 0.9 19.5 20.3 17.3 21.7 14.7 13.5 12.5 10.7
Synergistetes 0.1 1.1 0.9 0.7 2.1 1.4 1.2 0.8 0.9
Tenericutes 1.0 0.8 2.8 1.1 5.2 2.4 2.1 2.4 1.1
Verrucomicrobia 2.6 0.7 0.5 0.3 0.0 0.0 0.0 0.0 0.0
Unclassified bacteria 8.1 1.8 2.6 2.5 2.6 1.4 0.4 0.8 0.2
Minor phylumsc 0.7 0.2 0.1 0.1 0.0 0.0 0.0 0.0 0.0
Sample sizea 25173 10426 5940 21897 3370 3360 4840 3000 4509

67
Table 16. Abundance of specific OTUs in the bacterial 16S rRNA gene libraries created from rumen inoculum enrichments. aTotal number of
sequences.
OTU Number
Closest homologue Percent similarity Libraries Na
Rumen
1st generation 2nd generation 3rd generation
1 2 3 1 2 3 1 2 3
2 Trichococcus flocculiformis 99.0 0 2 1 3 542 200 1141 810 966 1631 5296
1 Paludibacter propionicigenes 89.3 0 35 81 53 604 351 346 520 293 504 2787
3 Spirochaeta coccoides 86.1 1 832 1036 682 331 230 549 331 262 530 4784
6 Bacteroides graminisolvens 99.5 0 8 40 67 267 186 126 259 544 120 1617
7 Treponema brennaborense 97.1 0 195 549 266 30 40 26 67 203 62 1438
12 Acholeplasma morum 99.3 0 4 6 2 111 122 88 55 82 180 650
8 Parabacteroides goldsteinii 92.1 0 61 50 368 203 558 414 40 102 116 1912
13 Treponema denticola 87.2 0 38 98 98 32 37 22 44 102 58 529
77 Salmonella enterica 99.3 0 0 0 0 2 7 4 44 41 48 146
15 Desulfovibrio desulfuricans 99.3 0 24 60 24 1 4 1 60 38 27 239
14 Capnocytophaga cynodegmi 80.9 1 2 266 14 1 148 38 8 64 37 579
20 Paludibacter propionicigenes 89.9 0 14 28 17 47 58 17 40 29 25 275
53 Aminobacterium mobile 87.9 0 9 29 16 10 10 38 12 18 44 186
35 Fibrobacter succinogenes 86.8 0 7 42 244 0 0 78 0 0 71 442
60 Escherichia fergusonii 99.5 4 0 0 0 0 7 0 2 57 0 70
25 Dokdonia donghaensis 79.6 0 79 61 96 26 34 23 5 4 40 368
5 Anaerophaga thermohalophila 83.2 0 35 125 70 1 21 2 0 36 12 302
514 Acetobacterium malicum 99.2 0 0 0 0 0 1 0 0 44 1 46
112 Blautia hydrogenotrophica 93.0 0 5 3 2 22 0 0 43 0 0 75
11 Carnobacterium pleistocenium 72.1 0 22 24 27 25 32 149 1 11 28 319
61 Clostridium clariflavum 82.7 0 81 82 128 13 11 21 10 12 11 369
43 Paludibacter propionicigenes 89.0 0 0 2 0 14 6 16 15 5 11 69
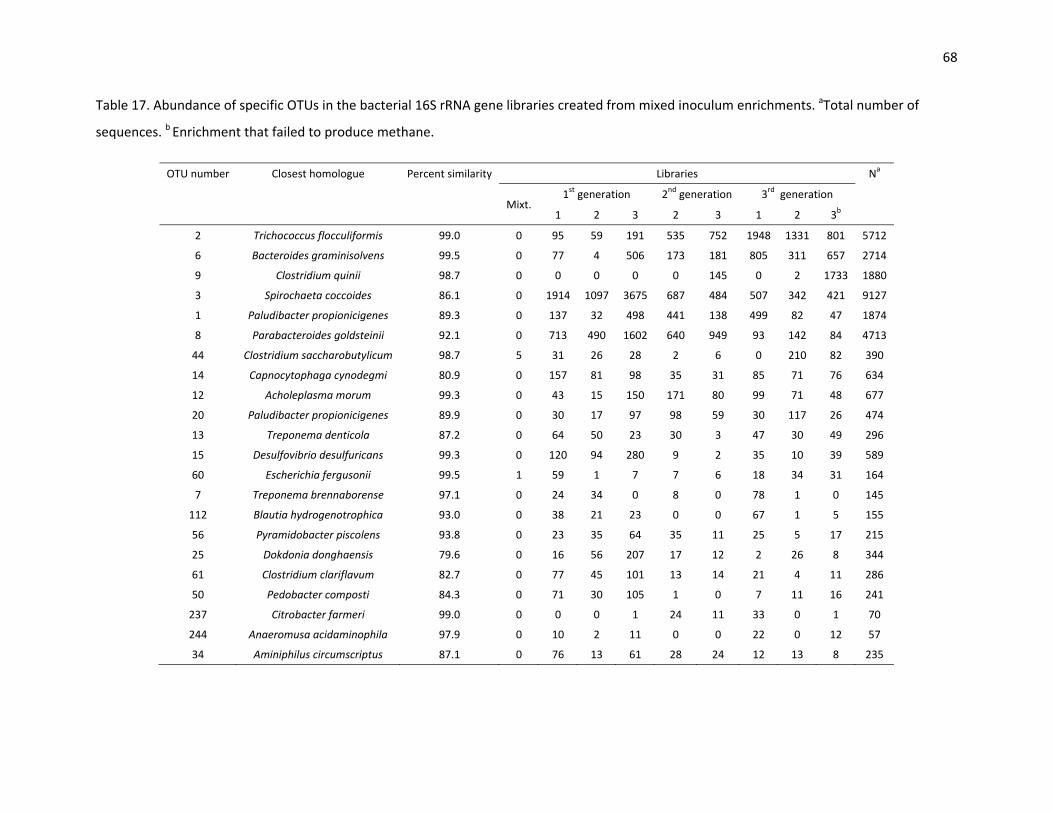
68
Table 17. Abundance of specific OTUs in the bacterial 16S rRNA gene libraries created from mixed inoculum enrichments. aTotal number of
sequences. b Enrichment that failed to produce methane.
OTU number Closest homologue Percent similarity Libraries Na
Mixt.
1st generation 2nd generation 3rd generation
1 2 3 2 3 1 2 3b
2 Trichococcus flocculiformis 99.0 0 95 59 191 535 752 1948 1331 801 5712
6 Bacteroides graminisolvens 99.5 0 77 4 506 173 181 805 311 657 2714
9 Clostridium quinii 98.7 0 0 0 0 0 145 0 2 1733 1880
3 Spirochaeta coccoides 86.1 0 1914 1097 3675 687 484 507 342 421 9127
1 Paludibacter propionicigenes 89.3 0 137 32 498 441 138 499 82 47 1874
8 Parabacteroides goldsteinii 92.1 0 713 490 1602 640 949 93 142 84 4713
44 Clostridium saccharobutylicum 98.7 5 31 26 28 2 6 0 210 82 390
14 Capnocytophaga cynodegmi 80.9 0 157 81 98 35 31 85 71 76 634
12 Acholeplasma morum 99.3 0 43 15 150 171 80 99 71 48 677
20 Paludibacter propionicigenes 89.9 0 30 17 97 98 59 30 117 26 474
13 Treponema denticola 87.2 0 64 50 23 30 3 47 30 49 296
15 Desulfovibrio desulfuricans 99.3 0 120 94 280 9 2 35 10 39 589
60 Escherichia fergusonii 99.5 1 59 1 7 7 6 18 34 31 164
7 Treponema brennaborense 97.1 0 24 34 0 8 0 78 1 0 145
112 Blautia hydrogenotrophica 93.0 0 38 21 23 0 0 67 1 5 155
56 Pyramidobacter piscolens 93.8 0 23 35 64 35 11 25 5 17 215
25 Dokdonia donghaensis 79.6 0 16 56 207 17 12 2 26 8 344
61 Clostridium clariflavum 82.7 0 77 45 101 13 14 21 4 11 286
50 Pedobacter composti 84.3 0 71 30 105 1 0 7 11 16 241
237 Citrobacter farmeri 99.0 0 0 0 1 24 11 33 0 1 70
244 Anaeromusa acidaminophila 97.9 0 10 2 11 0 0 22 0 12 57
34 Aminiphilus circumscriptus 87.1 0 76 13 61 28 24 12 13 8 235

69
Table 18. Number of copies of bacterial and archaeal 16S rDNA gene per 1 µL of DNA extracted from the
samples and the enrichments. On the labels, the ordinal number refers to the number in the enrichment
generation, the letter refers to the source of inoculum and the last number refers to triplicate. aMean of
3 replicates. SD was below 10% of the mean in most of the samples. bEnrichment that failed to produce
methane.
Labels DNA (ng/μL) Number of copies of 16S rDNA genea Ratio
Bac/Arc Bacteria Archaea
Rumen 104.9 4.02E+06 9.30E+05 4.32
1stD1 254.4 1.39E+06 2.68E+06 0.52
1stD2 259.3 2.97E+06 2.57E+06 1.15
1stD3 171.9 3.79E+06 4.13E+06 0.92
2ndD1 758.1 5.25E+06 2.04E+06 2.58
2ndD2 104.1 3.51E+06 6.80E+05 5.16
2ndD3 629.8 9.90E+06 6.65E+06 1.49
3rdD1 Unknown 1.42E+06 2.68E+05 5.29
3rdD2 3.5 2.63E+06 8.45E+05 3.11
3rdD3 4.6 2.87E+06 6.70E+05 4.28
Mixture Unknown 2.37E+06 3.66E+05 6.48
1stM1 36.8 1.09E+06 1.37E+06 0.80
1stM2 43.8 6.25E+05 8.10E+05 0.77
1stM3 56.3 1.57E+06 9.95E+05 1.57
2ndM2 198.1 5.90E+06 3.74E+06 1.58
2ndM3 307.2 5.41E+06 1.19E+06 4.55
3rdM1 5.2 5.95E+06 1.40E+06 4.25
3rdM2 5.0 2.35E+06 2.19E+06 1.07
3rdM3b 3.1 4.25E+06 2.59E+05 16.39

CHAPTER 4
CONCLUSIONS
This study performed the development of microbial communities to anaerobic digestion of
carrot pomace. After the adaptation, the composition of the communities was assessed based on the
16S rDNA gene. The following conclusions were reached:
1. Not all the anaerobic natural sources of microbes were suitable inocula for anaerobic digestion.
In this study, this was mainly due to a low microbial load and probably the absence of key
organisms.
2. The decrease in time for methane production in the enrichments illustrated the adaptation of
the microbial community to the new environment.
3. Sampled bacterial populations are less described in the literature compared to archaeal
populations. Probably because of the large diversity of bacterial population.
4. In anaerobic digestion showed a greater bacterial diversity than archaeal diversity.
5. As the community became more adapted to specific conditions, its diversity decreased.
6. The microorganisms that were most abundant in the adapted community were mostly not
detectable in the DNA extracted from the natural sources of inocula.
7. The majority of the microorganisms present in the natural source of inoculum were not
detected after the first process of adaptation to new environmental conditions. This mostly
implied the death of the microorganisms.

71
8. The adapted microbial compositions performed very similarly in terms of composition and
methane production even when the inocula were not identical.
9. Methanosarcinales was the most abundant archaeal order in the anaerobic digestion of carrot
pomace performed in the enrichments that did produce methane.
10. Spirochaetes, Porphyromonadaceae, Bacteroidaceae and Bacilli were the main bacterial groups
enriched in a community that produces methane using carrot pomace as substrate.
11. Minor changes in the environment caused a community to favor the growth of certain
microorganisms, shifting the microbial population composition and metabolism.