composition of dissolved organic matter within a...
TRANSCRIPT
1
Composition of dissolved organic matter 1
within a lacustrine environment. 2
3
4
Margaret V. McCaul A, David Sutton
C, André J. Simpson
B, Adrian Spence
A, David J. 5
McNally B, Brian. W. Moran
A, Alok Goel
D, Brendan O’Connor
D, Kris Hart
A, Brian P. 6
Kelleher A, E
7
8
A School of Chemical Sciences, Dublin City University, Glasnevin, Dublin 9, Ireland. 9
B Department of Chemistry, University of Toronto, Scarborough College, 1265 Military 10
Trail, Toronto, Ontario, M1C1A4. 11
C School of Science, Limerick Institute of Technology, Limerick, Ireland. 12
D Center for Bioanalytical Sciences and School of Biotechnology, DCU, Glasnevin, 13
Dublin 9, Ireland. 14
E Corresponding author. E-mail: [email protected] 15
16
17
18
19
20
21
22
23
24
25
26
27
28

2
1
Environmental context. 2
3
Freshwater dissolved organic matter (DOM) is a complex mixture of chemical 4
components that are central to many environmental processes, including carbon and 5
nitrogen cycling, but questions remain as to its chemical characteristics, sources and 6
transformation mechanisms. We studied the nature of DOM in a lake system and found 7
that it is influenced by anthropogenic activities and also by soil microbial biomass. 8
Human activities can therefore influence the huge amounts of carbon sequestered as 9
DOM. 10
11
Abstract 12
13
Freshwater dissolved organic matter (DOM) is a complex mixture of chemical 14
components that are central to many environmental processes, including carbon and 15
nitrogen cycling. However, questions remain as to its chemical characteristics, sources 16
and transformation mechanisms. Here, we employ 1- and 2-D nuclear magnetic 17
resonance (NMR) spectroscopy to investigate the structural components of lacustrine 18
DOM from Ireland, and how it varies within a lake system, as well as to assess potential 19
sources. Major components found, such as carboxyl-rich alicyclic molecules (CRAM) are 20
consistent with those recently identified in marine and freshwater DOM. Lignin-type 21
markers and protein/peptides were identified and vary spatially. Phenylalanine was 22
detected in lake areas influenced by agriculture while it is not detectable where zebra 23
mussels are prominent. The presence of peptidoglycan, lipoproteins, large polymeric 24
carbohydrates and proteinaceous material supports the substantial contribution of 25
material derived from microorganisms. Evidence is provided that peptidoglycan and 26
silicate species may in part originate from soil microbes. 27
28
29
30
31
32
3
Key words: Dissolved organic matter, NMR, lake, variability. 1
1. Introduction 2
3
Dissolved organic matter (DOM), both marine and freshwater, comprises of the largest 4
pool of exchangeable carbon on the Earth’s surface and is derived from numerous 5
sources that influence its relative reactivity and our ability to predict its storage capacity 6
and turnover times.[1,2]
Terrestrial and freshwater DOM, whose input to ocean waters is 7
largely controlled by riverine sources, experiences an annual flux of ca. 0.4 × 10¹⁵
g 8
C/year to the marine environment.[3]
The cycling of DOM from fresh to marine water is 9
not only important in the global carbon cycle but also plays an important role in the 10
enhanced solubility, bioavailability and fate of chemical contaminants and their global 11
transport.[4,5]
12
Despite this importance, there is still much to learn about the chemical composition of 13
freshwater DOM and how chemical constituents vary worldwide, and between freshwater 14
and marine environments.[6,7]
The application of NMR to study structures and interactions 15
in environmental chemistry is growing and is a powerful tool in helping unravel the key 16
structural components in major global carbon pools.[8-11]
In recent work, 1- and 2-D 17
solution state NMR spectroscopy has shown that major structural components of lake 18
freshwater include carboxyl-rich alicyclic molecules (CRAM), heteropolysaccharides and 19
aromatic compounds.[12]
These components were first reported, and are consistent with 20
those identified, in marine DOM.[13]
Furthermore, it has been tentatively suggested that 21
CRAM may be derived from cyclic terpenoids.[12,13]
However, it is not clear whether 22
these precursors are of terrestrial or aquatic origin or whether transformations proceed via 23
biological and/or photochemical processes. 24
Traditional methods of DOM isolation require large sample volumes to overcome the low 25
concentration in natural waters[14,15]
or are laborious and time consuming.[16]
Sampling is 26
often carried out over just one or two days, which is unlikely to be long enough to 27
provide a representative sample of the area. The samplers employed in this study were 28
deployed over a four week period and provide a more representative material that is less 29
susceptible to specific daily fluxes. Another advantage of using passive samplers of this 30
kind is that filtration is not required, reducing the possibility of contamination and loss of 31
4
material. It has also been shown that the material collected on the samplers is similar to 1
that collected using conventional DEAE-cellulose batch extraction, indicating that the 2
passive sampler approach isolates the same components.[17]
The same study also reported 3
that 72-89% of total DOM can be captured on the sampler, with the majority of lost 4
material comprising low molecular weight sugars. 5
While recent studies have contributed greatly to our knowledge of the overall 6
composition of DOM, less is known of its mechanisms of formation, compositional 7
variation and the origin of the most refractory DOM. Here we use DEAE-cellulose 8
passive samplers, as reported by Lam and Simpson,[17]
to concentrate DOM from 9
different areas in Lough Derg, a large lake system on the River Shannon in Ireland. The 10
River Shannon is the largest catchment within Ireland and Britain, draining a land area of 11
ca. 18,000km2. Lough Derg, the third largest lake in Ireland, is located at the southern 12
end of the Shannon and covers an area of 120 km2. NMR (both 1- and 2-D) is employed 13
to study DOM structure and how it varies within a lake system and assess anthropogenic 14
influence on its composition. The potential of surrounding soil microbial biomass as a 15
source of DOM is also investigated by comparison of the NMR spectra of degraded soil 16
microbial biomass and leachate to the DOM spectra. 17
18
19
2. Materials and Methods 20
21
2.1. Sampling and sample preparation 22
Six sampling sites around Lough Derg (Fig. 1) were chosen to represent areas influenced 23
by different aspects of the surrounding landscape. At each site, two passive samplers 24
(containing six membranes) were placed and suspended (using a fishing line) ca. 100 cm 25
below the surface of the water. Samples were removed from the lake after 28 days. 26
Sampling at the same sites was carried out in August 2008 and January 2009, so as to 27
assess temporal variation in DOM components. DOM was isolated using a passive 28
sampler.[17]
Water from the lough was prefiltered through 0.22 µm poly(vinylidene 29
difluoride) (PVDF) filters (Spectrapor). DOM was isolated on diethylaminoethyl 30
cellulose resin (Sigma Aldrich), a selective resin that adsorbs negatively charged species 31

5
Dromineer
Coole Bay
Ballina
Hare Island
Portumna
Williamstown
at neutral pH. The cellulose resin is contained within the PVDF tubing and protected via 1
a high density polyethylene (HDPE) casing with predrilled holes. Prior to use, DEAE-2
cellulose was precleaned using a cycle of acid, base and distilled water washings. 3
Cleaned DEAE-cellulose (250 mg) was slurry packed with distilled water into 7 cm long 4
(24 mmwide) PVDF porous membranes, which were pre-soaked in 0.1% sodium azide 5
for a minimum of 48 h. 6
Extraction of bound DOM from the passive samplers was performed by cutting and 7
removing the resin from the PVDF membranes. The resin was then placed in 50 ml 8
Teflon centrifuge tubes and extracted using ca. 40 ml of 0.1 M NaOH. The tubes were 9
centrifuged (10000 g, 10 min) to pellet the resin, and the supernatant was decanted. The 10
pellet was re-suspended and the previous steps were repeated four times, or until the 11
extracting solvent was colourless, to ensure complete extraction of DOM from the resin. 12
The extracted DOM was ion-exchanged using Amberjet 1200H Plus resin (Aldrich) and 13
freeze-dried. Duplicate samples were freeze-dried and samples were re-suspended in 14
deuterium oxide (D2O) for NMR analysis. 15
16
17
18
19
20
21
22
23
24
25
26
27
28
Fig. 1. Satellite image of Lough Derg (Ireland) and environs showing the six 29
sampling sites. 30
31
6
1
2.2. NMR 2
Each sample (100 mg) was dissolved in 1 ml D2O and titrated to pH 13.1 using NaOD 3
(40% by wt) to ensure complete solubility. Samples were analyzed using a Bruker 4
Avance 500 MHz NMR spectrometer equipped with a 1H-BB-
13C 5 mm, triple resonance 5
broadband inverse probe at 298 K. 1-D solution state 1H NMR experiments were 6
performed with 256 scans, a recycle delay of 3 s, 32768 time domain points, and an 7
acquisition time of 1.6 s. Solvent suppression was achieved by presaturation utilizing 8
relaxation gradients and echoes.[18]
Spectra were apodized through multiplication with an 9
exponential decay corresponding to 1 Hz line broadening, and a zero filling factor of 2. 10
Diffusion-edited (DE) experiments were performed using a bipolar pulse longitudinal 11
encode-decode sequence.[19]
Scans (1024) were collected using a 2.5 ms, 49 gauss/cm, 12
sine-shaped gradient pulse, a diffusion time of 100 ms, 8192 time domain points and 410 13
ms acquisition time Spectra were apodized through multiplication with an exponential 14
decay corresponding to 10 Hz line broadening and zero filling factor of 2. 15
Total correlation spectroscopy (TOCSY) spectra were obtained in the phase sensitive 16
mode, using time proportional phase incrimination (TPPI). TOCSY with presaturation of 17
the solvent resonance was acquired using 2048 time domain points in the F2 dimension 18
and 128 scans for each of the 128 slices in the F1 dimension. A mixing time of 60 ms was 19
used with a relaxation delay of 1 s. Processing of both dimensions used a sine-squared 20
function with a π/2 phase shift and a zero-filling factor of 2. TOCSY data was collected 21
to help confirm the major assignments highlighted on the 1H-
13C NMR correlations. 22
Heteronuclear multiple quantum coherence (HMQC) spectra were obtained in phase 23
sensitive mode using Echo/Antiecho gradient selection. The HMQC experiments were 24
carried out using 256 scans with 128 time domain points in the F1 dimension and 1024 25
time domain points in the F2 dimension. A relaxation delay of 1 s and 1J
1H-
13C of 145 26
Hz were used. F2 dimensions in HMQC experiments were processed using an 27
exponential function corresponding to a 15 Hz line broadening. The F1 dimension was 28
processed using a sine-squared function with a π/2 phase shift and a zero-filling factor of 29
2. 30
7
Spectral predictions were carried out using Advanced Chemistry Development’s 1
ACD/SpecManager and ACD/2D NMR Predictor using Neural Network Prediction 2
algorithms (version 10.02). Parameters used for prediction including line shape, spectral 3
resolution, sweep width and spectrometer frequency were set to match those of the real 4
datasets as closely as possible. Please see accessory materials for an example. 5
6
2.3. Growth and degradation of soil microbial biomass 7
The soil used in this study is a light clay loam from a cultivated field near Lough Derg. 8
Sampling was carried out according to a modified version of the protocol described 9
processing Joseph et al. (2003). A 25-mm-diameter clean metal core was used to sample 10
100-mm long soil cores from the A horizon, which were transferred to sterile 11
polyethylene bags and sealed at the collection site. Soil cores were transported at the 12
ambient temperature and processed within 24 h of collection. The upper 30 mm of each 13
core was discarded, and large pieces of roots and stones were removed from the 14
remainder, which was sieved through a stainless steel sieve with a 2-mm aperture 15
(IMPACT Laboratory Test Sieve, UK). Sieved samples were pooled, homogenized and 16
stored at 4°C at its field moisture content for further analysis. A CHN combustion 17
analyzer (Exeter Analytical CE440 elemental analyser) was used to determine the soil 18
elemental composition, 4.25% C, 0.58% H, 0.15% N and 0.21% P. 19
Soil microbes were cultivated according to a modified version of the protocol described 20
by Janssen et al.[20]
Soil (1 g) was added to 100 ml aliquots of sterile distilled water and 21
dispersed with a magnetic stirrer. Aliquots (1 ml) of soil suspension were added to 9 ml 22
portions of dilute nutrient broth (DNB), containing gl-1
: Lab-Lemco’ powder 1.0; yeast 23
extract 2.0; peptone 5.0 and NaCl 5.0, at a concentration of 0.08 gl-1
distilled water 24
(Oxoid Ltd., Hampshire, England). Diluted soil suspensions were mixed by vortexing at 25
ca. 150 rpm for 10 s and used to prepare serial dilutions containing 10-2
to 10-4
g soil 26
suspension. Aliquots (100 µl) of each dilution series was plated on duplicate LB agar 27
plates containing 0.5% dripstone, 0.25% yeast extract, 0.1% D-glucose, 0.25% NaCl and 28
1.5% agar. Serially inoculated LB plates were incubated at room temperature for 2 days 29
and all isolated colonies were selected from the 10-4
dilution of the soil and used to 30
inoculate 3.0 ml LB broth. Cultures were incubated at for 48 h. 31

8
The degradation experiment was conducted according to a modified version of the 1
protocol described by Kelleher et al.[21]
The experimental design attempted to mimic in 2
situ conditions and enable collection of transformed and leached organic matter (OM) for 3
further analysis. Glass funnels with borosilicate sintered discs, with porosity grade 4 4
were submerged until flush with soil in a clay pot. The soil used was a native light clay-5
loam taken from fields surrounding Lough Derg. The cavity beneath the sintered disc was 6
filled with the native soil and secured with glass wool and 0.4 g of the soil microbial 7
biomass evenly distributed on the surface of the sintered disc. This set up enables 8
microbes in the soil to access the microbial biomass. The biomass was sprinkled with 9
water every second day to mimic rain and the runoff was collected in a vial attached to 10
the end of the funnel. Moisture levels were kept constant throughout the experiment. 11
Runoff and microbial biomass were collected at 6 and 14 weeks post degradation. 12
13
14
3. Results and discussion 15
16
3.1. General characterisation 17
Recent studies that have employed multidimensional NMR spectroscopy to study DOM 18
show that marine and freshwater DOM share many structural similarities.[12,13]
These 19
major structural components are also present in all the DOM isolated from Lough Derg. 20
For example, Fig. 2 shows the conventional 1H (Fig. 2A) and diffusion edited (Fig. 2B) 21
NMR spectra for the Ballina DOM sample and also show the diffusion edited 1H 22
spectrum of the Coole Bay sample area of lake (Fig. 2C). 23
24
25
26
27
28
29
30
31
9
1
2
3
4
5
6
7
8
9
10
11
12
13
14
15
16
17
18
19
20
21
22
23
24
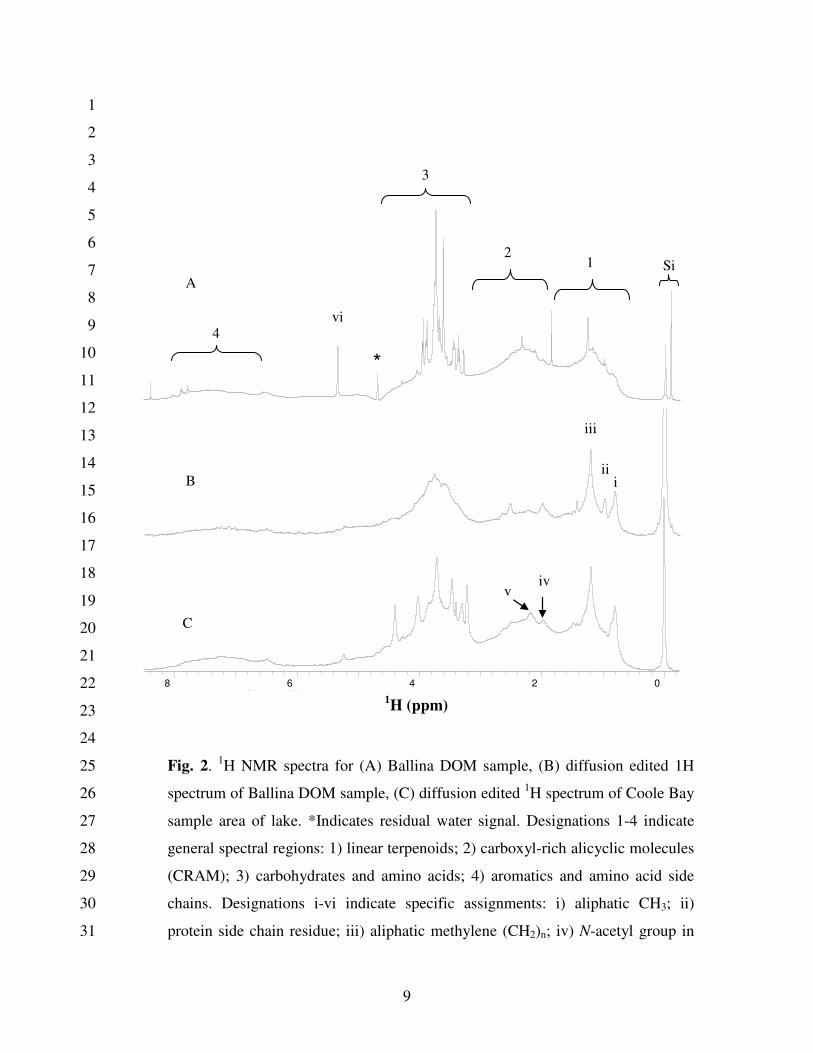
Fig. 2. 1H NMR spectra for (A) Ballina DOM sample, (B) diffusion edited 1H 25
spectrum of Ballina DOM sample, (C) diffusion edited 1H spectrum of Coole Bay 26
sample area of lake. *Indicates residual water signal. Designations 1-4 indicate 27
general spectral regions: 1) linear terpenoids; 2) carboxyl-rich alicyclic molecules 28
(CRAM); 3) carbohydrates and amino acids; 4) aromatics and amino acid side 29
chains. Designations i-vi indicate specific assignments: i) aliphatic CH3; ii) 30
protein side chain residue; iii) aliphatic methylene (CH2)n; iv) N-acetyl group in 31
BALLINA_DOM 1D_DE.ESP
COOLE_DOM 1D_DE.ESP
8 6 4 2 0Chemical Shift (ppm)
A
B
C
1
3
2
4 vi
v iv
iii
ii i
Si
*
BALLINA_DOM 1D NEWLY CALIBRATED.ESP
1H (ppm)
10
peptidoglycan or other constituents in lipids/waxes; v) aliphatic methylene units β 1
to an acid or ester or double bond; vi) anomeric protons in carbohydrate. Si 2
indicates a natural silicate and not TMS. 3
4
General assignments, consistent with those reported are: (1) aliphatics, including material 5
derived from linear terpanoids; (2) carboxyl-rich alicyclic molecules (CRAM; see also 6
Fig 5); (3) a mixture of carbohydrates and amino acids; (4) aromatics, including 7
resonances from amino acid (AA) side chains.[12,13]
More specific assignments refer to (i) 8
CH3, likely including resonances from aliphatic species and methylated amino acid side-9
chain residues in peptides/protein, (ii); consistent with a side chain residue also seen in 10
the 1H NMR spectrum for bovine serum albumin, (iii); aliphatic methylene (CH2)n, (iv); 11
contributions from both N-acetyl group in peptidoglycans and other units 12
lipids/waxes,[22,23]
(v); mainly aliphatic methylene units β to an acid or ester i.e. R2-OCO-13
CH2-R1 or double bond vi); anomeric protons in carbohydrate. ‘Si’ indicates a natural 14
silicate species and not TMS (tetramethylsilane, Si(CH3)4), a commonly used NMR 15
reference standard).[22]
16
Fig. 2A displays sharp peaks, especially in the carbohydrate region (3). Sharper lines 17
observed in NMR are often characteristic of smaller structures [21]
, and this may indicate 18
the breakdown of the carbohydrates from large polymeric structures into smaller 19
fragments. To test this, diffusion edited (DE) NMR was performed on the Ballina sample. 20
In diffusion edited NMR experiments, small molecules are essentially gated from the 21
final spectrum but signals from macromolecules which display little translational 22
diffusion are not gated and appear in the spectrum.[19,24]
The diffusion edited spectrum of 23
Ballina DOM is shown in Fig. 2B. Aliphatic chains are prominent, indicating that they 24
have restricted diffusion, which suggests that they may be present in rigid domains or 25
macromolecular structures. The relative intensity of the carbohydrate signals is much less 26
in the diffusion edited spectrum vs. the conventional 1H NMR spectrum, suggesting a 27
large fraction of the carbohydrates in the DOM is present as relatively small mobile 28
entities. However, there is still a considerable contribution from carbohydrate signals in 29
the diffusion edited spectrum, supporting a second fraction of carbohydrate with greater 30
molecular (or aggregate) size. 31
11
A characteristic resonance for CH3 in methylated AA side chain residues (Fig. 2, signal i) 1
is easily distinguishable in the diffusion edited NMR, suggesting the presence of 2
protein/peptide.[22]
Furthermore, the resonance at ca.1 ppm (Fig. 2, signal ii) is likely 3
attributed to protein/peptide as this peak is also present in the 1H NMR spectrum of 4
bovine serum albumin.[25]
Complimentary evidence for protein/peptide presence is 5
provided by the emergence of α protons from AAs in Fig. 3. Proteinaceous compounds 6
are viewed as labile in the environment [26]
and their survival and occurrence have been 7
explained through protection mechanisms such as encapsulation and formation of 8
microbially resistant complexes with carbohydrates and lignin.[27-29]
Lam et al.[12]
9
detected weak protein/peptide contributions and was considered to be only a minor 10
component in Lake Ontario DOM. However, the spectra generated indicate that the 11
protein/peptide contribution may vary considerably between DOM from different sources 12
in freshwater environments. It is estimated that plants often contain only 1–5% protein by 13
weight and that protein structures are known to degrade rapidly in a soil 14
environment.[30,31]
It seems unlikely that the preservation of plant-derived peptide/protein 15
structures can completely account for the contributions of proteins and peptides in DOM. 16
It is therefore possible that a significant portion of peptide/protein in DOM arises from 17
the cells of dead and living microbes of either aquatic or terrestrial origin. 18
Alternatively, microbially resistant ligno-protein complexes may also account for some 19
of the protein present.[32]
Lignin-type signatures were not found in the study of Lake 20
Ontario DOM,[12]
but the possibility of lignin contributions to Lough Derg DOM is 21
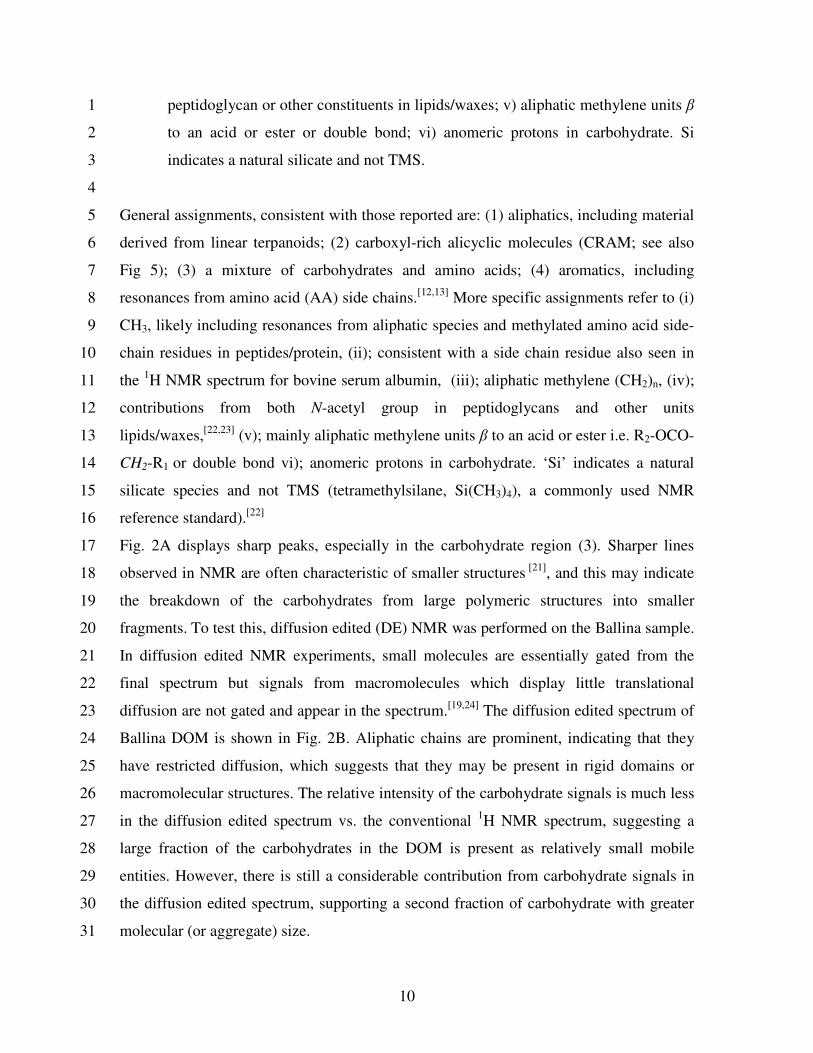
highlighted by cross peaks that may represent lignin derived O-CH3 units (Fig. 3), often 22
the most intense signal in soil OM.[9,21,33]
Methoxy cross peaks are clearly present in all 23
the lake samples (overlapped with carbohydrate crosspeaks), especially Hare Island and 24
Dromineer. Lignin is a strong indicator of terrestrial plant inputs and may be an 25
indication of the age of DOM and/or the influence of the surrounding environment. 26
Proteins originating from microbial cells may be encapsulated by, or sorbed to, lignin, 27
making them less susceptible to degradation. 28
29
30
31
12
1
2
3
4
5
6
7
8
9
10
11
12
13
14
15
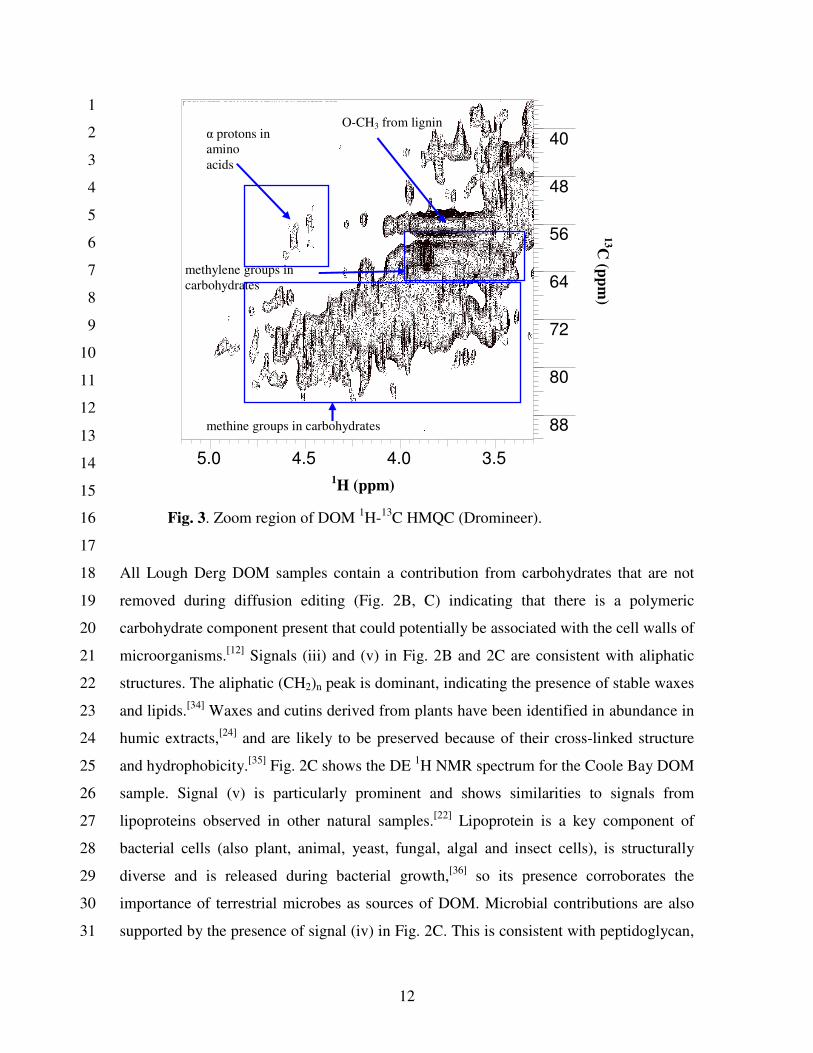
Fig. 3. Zoom region of DOM 1H-
13C HMQC (Dromineer). 16
17
All Lough Derg DOM samples contain a contribution from carbohydrates that are not 18
removed during diffusion editing (Fig. 2B, C) indicating that there is a polymeric 19
carbohydrate component present that could potentially be associated with the cell walls of 20
microorganisms.[12]
Signals (iii) and (v) in Fig. 2B and 2C are consistent with aliphatic 21
structures. The aliphatic (CH2)n peak is dominant, indicating the presence of stable waxes 22
and lipids.[34]
Waxes and cutins derived from plants have been identified in abundance in 23
humic extracts,[24]
and are likely to be preserved because of their cross-linked structure 24
and hydrophobicity.[35]
Fig. 2C shows the DE 1H NMR spectrum for the Coole Bay DOM 25
sample. Signal (v) is particularly prominent and shows similarities to signals from 26
lipoproteins observed in other natural samples.[22]
Lipoprotein is a key component of 27
bacterial cells (also plant, animal, yeast, fungal, algal and insect cells), is structurally 28
diverse and is released during bacterial growth,[36]
so its presence corroborates the 29
importance of terrestrial microbes as sources of DOM. Microbial contributions are also 30
supported by the presence of signal (iv) in Fig. 2C. This is consistent with peptidoglycan, 31
DROMINEER_DOM HMQC NEWLY CALIBRATED.ESP
5.0 4.5 4.0 3.5ppm
40
48
56
64
72
80
88
ppm
O-CH3 from lignin
methine groups in carbohydrates
methylene groups in
carbohydrates
α protons in
amino
acids
1H (ppm)
13C
(pp
m)
13
which comprises up to 90% by weight of Gram-positive bacteria and is the key structural 1
component in all microbial cell walls. That peptidoglycan was found to accumulate is not 2
unexpected since it is resistant (as are microbe cell walls) to many chemical and 3
biological processes and has been found in the most refractory components of soil OM.[22]
4
5
3.2 Soil microbial contribution 6
Despite strong microbial signatures in Fig. 2 it is difficult to know from where the 7
microbial residue originates. It has recently been shown that microbial presence in soil far 8
exceeds presently accepted values and that considering the amounts of fresh cellular 9
material in soil extracts, it is probable that the contributions of micro-organisms in the 10
terrestrial environment are seriously underestimated.[25]
Therefore, soil microbial biomass 11
may also be an important source of freshwater DOM. The potential contribution of 12
surrounding soil microbial biomass to Lough Derg DOM was studied by conducting a 13
complementary laboratory experiment that monitored the degradation of soil microbial 14
biomass cultured from soil sampled near the lake. Degradation occurred over 14 weeks, 15
allowing NMR experiments to be conducted on degraded soil microbial biomass residue 16
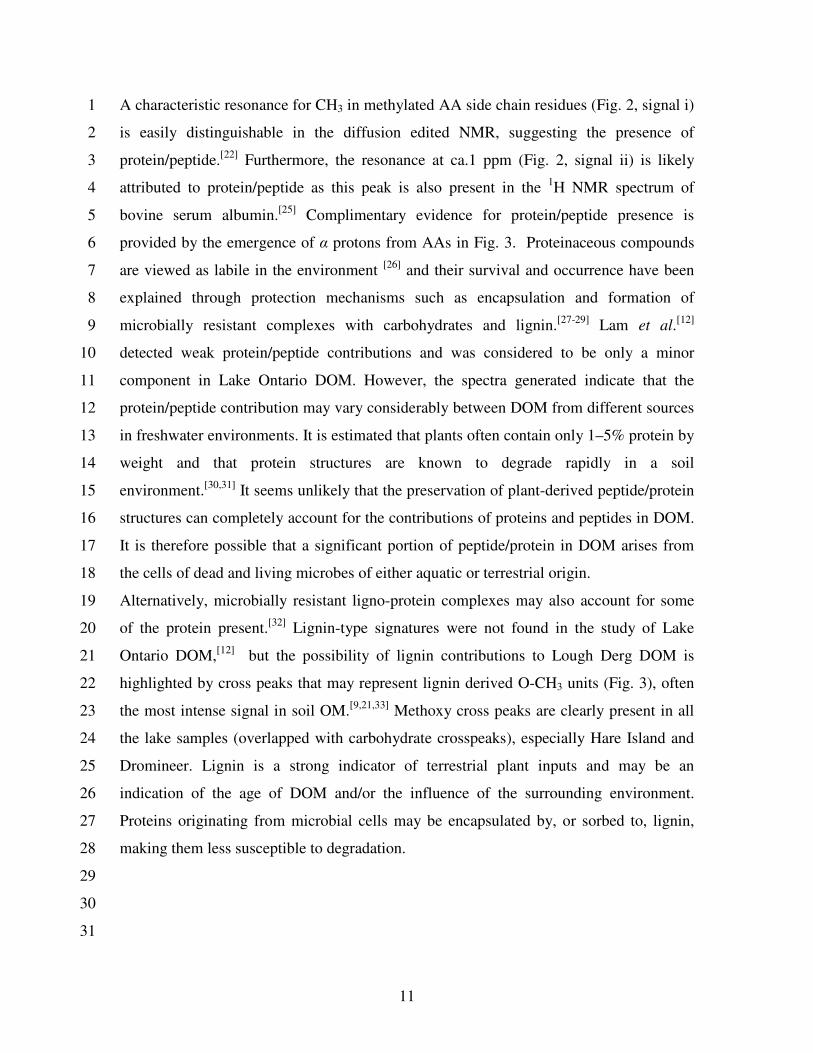
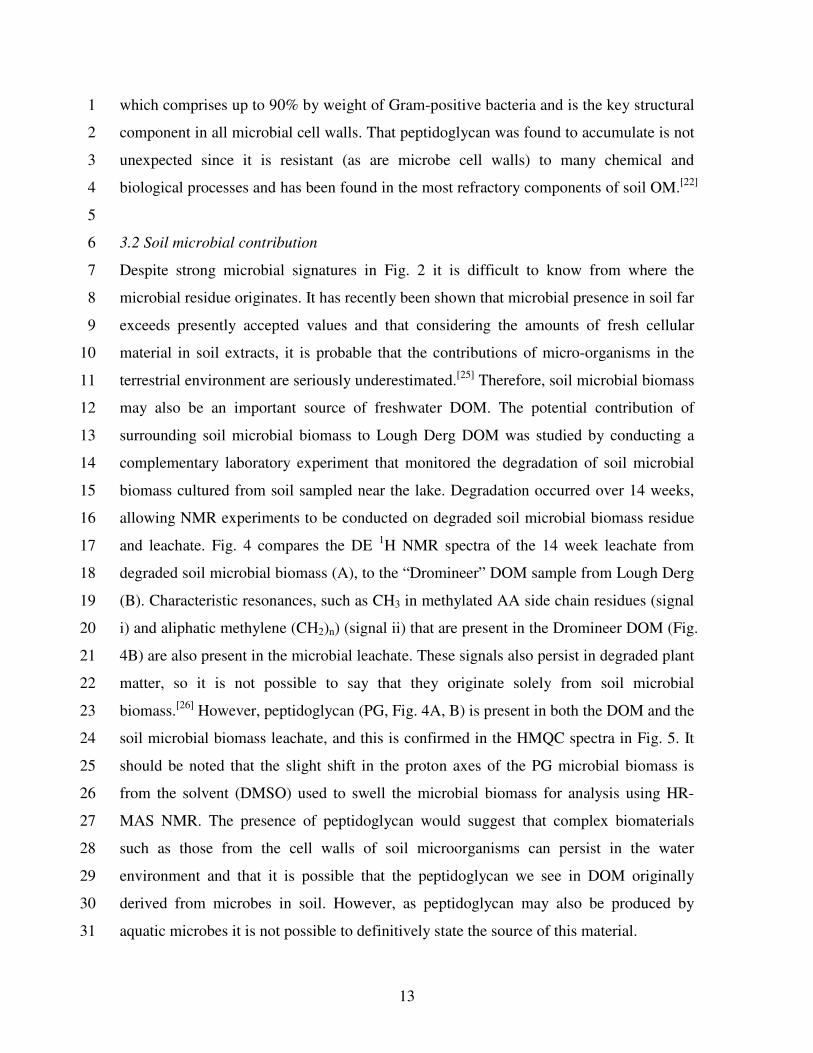
and leachate. Fig. 4 compares the DE 1H NMR spectra of the 14 week leachate from 17
degraded soil microbial biomass (A), to the “Dromineer” DOM sample from Lough Derg 18
(B). Characteristic resonances, such as CH3 in methylated AA side chain residues (signal 19
i) and aliphatic methylene (CH2)n) (signal ii) that are present in the Dromineer DOM (Fig. 20
4B) are also present in the microbial leachate. These signals also persist in degraded plant 21
matter, so it is not possible to say that they originate solely from soil microbial 22
biomass.[26]
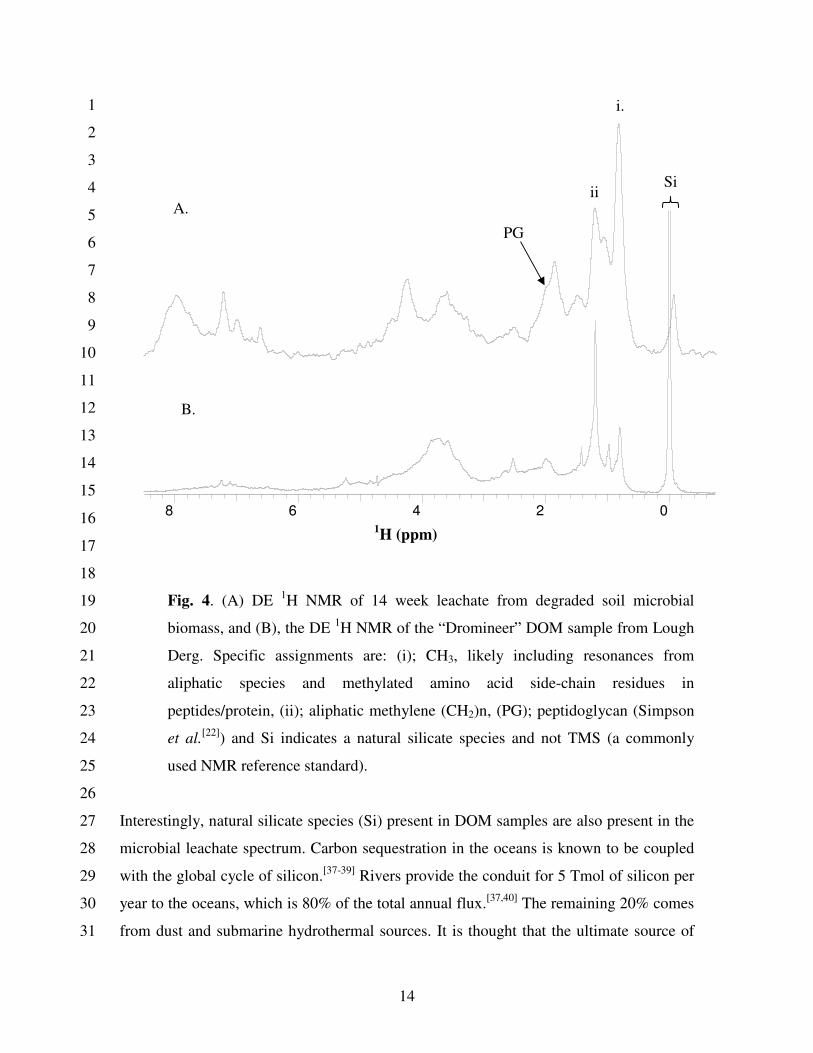
However, peptidoglycan (PG, Fig. 4A, B) is present in both the DOM and the 23
soil microbial biomass leachate, and this is confirmed in the HMQC spectra in Fig. 5. It 24
should be noted that the slight shift in the proton axes of the PG microbial biomass is 25
from the solvent (DMSO) used to swell the microbial biomass for analysis using HR-26
MAS NMR. The presence of peptidoglycan would suggest that complex biomaterials 27
such as those from the cell walls of soil microorganisms can persist in the water 28
environment and that it is possible that the peptidoglycan we see in DOM originally 29
derived from microbes in soil. However, as peptidoglycan may also be produced by 30
aquatic microbes it is not possible to definitively state the source of this material. 31
14
1
2
3
4
5
6
7
8
9
10
11
12
13
14
15
16
17
18
Fig. 4. (A) DE 1H NMR of 14 week leachate from degraded soil microbial 19
biomass, and (B), the DE 1H NMR of the “Dromineer” DOM sample from Lough 20
Derg. Specific assignments are: (i); CH3, likely including resonances from 21
aliphatic species and methylated amino acid side-chain residues in 22
peptides/protein, (ii); aliphatic methylene (CH2)n, (PG); peptidoglycan (Simpson 23
et al.[22]
) and Si indicates a natural silicate species and not TMS (a commonly 24
used NMR reference standard). 25
26
Interestingly, natural silicate species (Si) present in DOM samples are also present in the 27
microbial leachate spectrum. Carbon sequestration in the oceans is known to be coupled 28
with the global cycle of silicon.[37-39]
Rivers provide the conduit for 5 Tmol of silicon per 29
year to the oceans, which is 80% of the total annual flux.[37,40]
The remaining 20% comes 30
from dust and submarine hydrothermal sources. It is thought that the ultimate source of 31
DROMINEER_DOM 1D_DE.ESP
8 6 4 2 0Chemical Shift (ppm)
DE_2_14W_LEACH_FIELD.ESP
B.
A.
Si
i.
ii
.
PG
1H (ppm)
15
continental silicon flux to the oceans is weathering processes in terrestrial 1
biogeosystems.[41,42]
However, Sommer et al., have pointed out that silicon dynamics in 2
terrestrial biogeosystems cannot be understood solely by way of mineral weathering.[43]
3
4
5
6
7
8
9
10
11
12
13
14
15
16
Fig. 5. HMQC of expanded aliphatic region of A. Dromineer and B. 14 week 17
leachate. Abbreviations: CRAM, carboxyl-rich alicyclic molecules; PG, 18
peptidoglycan; MDLT, material derived from linear terpenoids. 19
20
The silicate species in the NMR spectra are unusual and arise at around zero ppm (also 21
present in HMQC data) and suggest methylated silica.[44]
It is important to note that these 22
signals are not from TMS, the commonly used internal standard for NMR. TMS is 23
insoluble in water and no internal standards (of any kind) were used. Furthermore, similar 24
signals are seen in all the natural water samples that have been analysed directly with 25
NMR. In direct NMR, the water sample is studied “as-is”, with no pre-concentration or 26
pre-treatment of any type, indicating that these signals must be of natural origin.[45]
27
Silicate species in the soil microbial leachate would therefore suggest that soil 28
microorganisms accumulate their own stable silicon pools and may play a larger role in 29
silicon cycling than presently thought. 30
31
1H (ppm)
13C
(pp
m)
DROMINEER_DOM HMQC NEWLY CALIBRATED.ESP
3.0 2.5 2.0 1.5 1.0ppm
10
15
20
25
30
35
40
45
pp
m
COPY OF HSQC13C_2_14W_LEACH_FIELD.ESP
3.0 2.5 2.0 1.5 1.0 0.5ppm
10
15
20
25
30
35
40
45
pp
m
CRAM
PG PG
MDLT
B. A.
16
1
2
3
4
5
6
7
8
9
10
11
12
13
14
15
16
17
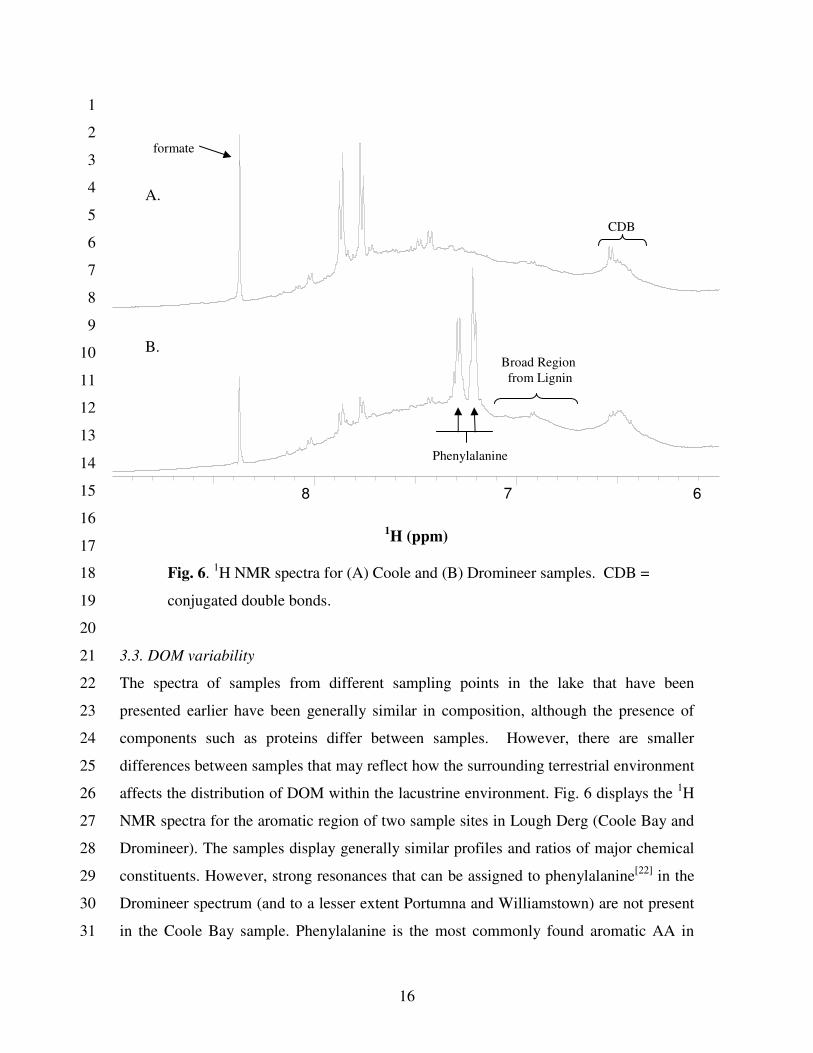
Fig. 6. 1H NMR spectra for (A) Coole and (B) Dromineer samples. CDB = 18
conjugated double bonds. 19
20
3.3. DOM variability 21
The spectra of samples from different sampling points in the lake that have been 22
presented earlier have been generally similar in composition, although the presence of 23
components such as proteins differ between samples. However, there are smaller 24
differences between samples that may reflect how the surrounding terrestrial environment 25
affects the distribution of DOM within the lacustrine environment. Fig. 6 displays the 1H 26
NMR spectra for the aromatic region of two sample sites in Lough Derg (Coole Bay and 27
Dromineer). The samples display generally similar profiles and ratios of major chemical 28
constituents. However, strong resonances that can be assigned to phenylalanine[22]
in the 29
Dromineer spectrum (and to a lesser extent Portumna and Williamstown) are not present 30
in the Coole Bay sample. Phenylalanine is the most commonly found aromatic AA in 31
1H (ppm)
DROMINEER_DOM 1D NEWLY CALIBRATED.ESP
8 7 6Chemical Shift (ppm)
COOLE_DOM 1D_NEW CALIBRATED.ESP
Broad Region
from Lignin
CDB
formate
Phenylalanine
A.
B.

17
proteins and enzymes, is invariably present in any animal tissue and is also synthesised 1
by common pathways in phytoplankton and bacteria. It is considered an easily degraded 2
hydrolysable AA,[46]
so its presence in some samples is of interest. Phenylalanine has 3
been associated with increased concentrations in water of NH4+,[47]
which in turn is a 4
product and indicator of the presence of nitrogenous organic wastes. Dromineer is 5
strongly influenced by the Nenagh River which passes through land utilized for 6
agriculture and raising livestock, and also accommodates a sizable public marina. Higher 7
phenylalanine concentrations may therefore be an indicator of elevated organic wastes 8
from agriculture and industry. Interestingly, there appears to be little phenylalanine in the 9
Coole Bay sample which is south of the Dromineer sampling site. This may be explained 10
by the fact that the site is secluded, surrounded by forestry and is not fed or influenced 11
directly by a river. However, during the sampling period from August to September; an 12
exotic invasive species in Ireland, Zebra mussels (Dreissena polymorpha) were evident at 13
highest concentrations on the eastern side of the lake at Coole Bay. The filtering 14
activities of zebra mussels have been shown to have a large ecosystem-level influence on 15
nitrogen cycling[48-50]
and organic nitrogen concentrations decrease in water columns in 16
microcosms with live zebra mussels.[51]
It is therefore possible that the filtering activities 17
of Zebra mussels result in recycling of larger organic nitrogen compounds such as 18
phenylalanine. The presence of formate in both samples suggests a pathway of organic 19
carbon degradation mainly reported for anoxic marine sediments[52]
and indicates that 20
anoxic breakdown by various microorganisms takes place in the lake. Formate and other 21
volatile fatty acids (VFAs) are products of hydrolysis and anaerobic fermentation.[53]
22
A broad background hump from lignin often centered at 6.9-7.1 ppm is present in the 23
aromatic regions of Fig. 6. The presence of lignin-type material is confirmed by the 24
intense methoxy signal seen in the HMQC data (Fig. 3). In addition, the conjugated 25
double bonds are likely the result of the presence of carotenoid structures known to be 26
produced by aquatic species and present in freshwater DOM.[12]
The fate of carotenoid 27
structures is not well understood despite an estimated net annual production over 100 28
million tons from photosynthetic organisms alone.[54,55]
29
30
31
18
4. Conclusions 1
2
Given the influence of terrestrial organic matter on marine DOM and the similarity in the 3
structures of both, it is challenging to assess the source of DOM and whether it is aquatic 4
or terrestrial in origin. The findings here suggest a strong terrestrial input of recalcitrant 5
material. Land management and human activities are important factors influencing the 6
spatial distribution of DOM within the lacustrine environment. The input of plant 7
material is confirmed by the presence of lignin-type signatures, while the influence of 8
microbial biomass from either terrestrial or aquatic sources is highlighted by resonances 9
for peptidoglycan and protein. Soil microbes may also contribute to silicon cycling 10
through stable organo-silicon structures within the cells. The study also confirms the 11
presence of CRAM in DOM from an Irish lake, which suggests that it may be globally 12
ubiquitous. 13
14
Acknowledgements 15
16
The authors thank the Science Foundation of Ireland (GEOF509), the Irish 17
Environmental Protection Agency (STRIVE program), the Geological Survey of Ireland, 18
the Natural Science and Engineering Research Council of Canada (Discovery Grant, 19
A.J.S) and the government of Ontario [Early Researcher Award (A.J.S)] for funding. 20
Thank you also to the anonymous reviewers for the very helpful suggestions and 21
criticisms. 22
23
24
25
26
27
28
29
30
31
32
19
References 1
2
[1] J. I. Hedges, R. G. Keil, R. Benner, What happens to terrestrial organic matter in 3
the ocean? Org. Geochem. 1997, 27, 195. 4
[2] R. Benner, B. Benitez-Nelson, K. Kaiser, R. M. W. Amon, Export of young 5
terrigenous dissolved organic carbon from rivers to the Arctic Ocean. Geophys. 6
Res. Lett. 2004, 31, (L05305) 1. 7
[3] J. I. Hedges, Global biogeochemical cycles - progress and problems. Mar. Chem. 8
1992, 39, 67. 9
[4] C. T. Chiou, R. L. Malcolm, T. I. Brinton, D. E. Kile, Water solubility 10
enhancement of some organic pollutants and pesticides by dissolved humic and 11
fulvic-acids. Environ. Sci. Technol. 1986, 20, 502. 12
[5] D. Hansell, C. Carlson, Biogeochemistry of Marine Dissolved Organic Matter. 13
Academic Press, New York, 2002, p. 774. 14
[6] T. Dittmar, J. A. Paeng, Heat-induced molecular signature in marine dissolved 15
organic matter. Nat. Geosci. 2009, 2, 175. 16
[7] R. Stone, The invisible hand behind a vast carbon reservoir. Science 2010, 328, 17
5985, 1476. 18
[8] L. A. Cardoza, A. K. Korir, W. H. Otto, C. J. Wurrey, C. K. Larive, Applications 19
of NMR spectroscopy in environmental science. Prog. Nucl. Mag. Res. Sp. 2004, 20
45, 209. 21
[9] A. J. Simpson, Multidimensional solution state NMR of humic substances: a 22
practical guide and review. Soil Sci. 2001, 166, 795. 23
[10] N. Hertkorn, A. Kettrup, Molecular level structural analysis of natural organic 24
matter and of humic substances by multinuclear and higher dimensional NMR 25
spectroscopy. In: Perminova, I.V., Hertkom,N., Hatfield, K. (Eds.), Use of 26
Humates to Remediate Polluted Environments: From Theory to Practice. Springer, 27
Dordrecht, 2005, pp. 391–435. 28
[11] B. P. Kelleher, A. J. Simpson Humic substances in soils: Are they really 29
chemically distinct? Environ. Sci. Technol. 2006, 40, 4605. 30

20
[12] B. Lam, A. Baer, M. Alaee, B. Lefebvre, A. Moser, A. Williams, A. J. Simpson, 1
Major structural components in freshwater dissolved organic matter. Environ. 2
Sci. Technol. 2007, 41, 8240. 3
[13] N. Hertkorn, R. Benner, M. Frommberger, P. Schmitt-Kopplin, M. Witt, K. 4
Kaiser, A. Kettrup, J. I. Hedges, Characterization of a major refractory component 5
of marine dissolved organic matter. Geochim. Cosmochim. Acta 2006, 70, 2990. 6
[14] A. J. Leenheer, Comprehensive approach to preparative isolation and 7
fractionation of dissolved organic carbon from natural waters and wastewaters. 8
Environ. Sci. Technol. 1981, 15, 578. 9
[15] E. M. Thurman, R. L. Malcolm, Preparative isolation of aquatic humic substances. 10
Environ. Sci. Technol. 1981, 15, 463. 11
[16] J. P. Simjouw, E. C. Minor, K. Mopper, Isolation and characterization of estuarine 12
dissolved organic matter: comparison of ultrafiltration and C18 solid-phase 13
extraction techniques. Mar. Chem. 2005, 96, 219. 14
[17] B. Lam, A. J. Simpson, Passive sampler for dissolved organic matter in 15
freshwater environments. Anal. Chem. 2006, 78, 8194. 16
[18] A. J. Simpson, S. A. Brown, Purge NMR: Effective and easy solvent suppression. 17
J. Magn. Reson. 2005, 175, 340. 18
[19] D. Wu, A. Chen, C. S. Johnson Jr., An improved diffusion ordered spectroscopy 19
experiment incorporating bipolar-gradient pulses. J. Magn. Reson. A. 1995, 115, 20
260. 21
[20] P. H. Janssen, P. S. Yates, B. E. Grinton, P. M. Taylor, M. Sait, Improved 22
culturability of soil bacteria and isolation in pure culture of novel members of the 23
divisions Acidobacteria, Actinobacteria, Proteobacteria, and Verrucomicrobia. 24
Appl. Environ. Microbiol. 2002, 68, 2391. 25
[21] B. P. Kelleher, M. J. Simpson, A. J. Simpson, Assessing the fate and 26
transformation of plant residues in the terrestrial environment using HR-MAS 27
NMR spectroscopy. Geochim. Cosmochim. Acta 2006, 70, 4080. 28
[22] A. J. Simpson, G. Song, E. Smith, B. Lam, E. H. Novotny, M. H. B. Hayes, 29
Unraveling the structural components of soil humin by use of solution-state 30
Nuclear Magnetic Resonance Spectroscopy. Environ. Sci. Technol. 2007, 41, 876. 31
21
[23] B. G. Pautler, A. J. Simpson, D. J. McNally, S. F. Lamoureux, M. 1
J. Simpson, Arctic Permafrost Active Layer Detachments Stimulate Microbial 2
Activity and Degradation of Soil Organic Matter. Environ. Sci. Technol. 2010, 44, 3
4076. 4
[24] A. J. Simpson, W. L. Kingery, P. G. Hatcher, The identification of plant derived 5
structures in humic materials using three dimensional NMR spectroscopy. 6
Environ. Sci. Technol. 2003, 37, 337. 7
[25] A. J. Simpson, M. J. Simpson, E. Smith, B. P. Kelleher, Microbially derived 8
inputs to soil organic matter: Are current estimates too low? Environ. Sci. Technol. 9
2007, 41, 8070. 10
[26] J. Fuhrman, Dissolved free amino acid cycling in an estuarine outflow plume. 11
Mar. Ecol.-Prog. Ser. 1990, 66, 197. 12
[27] J. I. Hedges, G. Eglinton, P. G. Hatcher, D. L. Kirchman, C. Arnosti, S. Derenne, 13
R. P. Evershed, I. Kogel-Knabner, J. W. de Leeuw, R. Littke, W. Michaelis, J. 14
Rullkotter, The molecularly uncharacterized component of nonliving organic 15
matter in natural environments. Org. Geochem. 2000, 31, 945. 16
[28] E. Tanoue, S. Nishiyama, M. Kamo, A. Tsugita, Bacterial membranes: possible 17
source of a major dissolved protein in seawater. Geochim. Cosmochim. Acta 1995, 18
59, 2643. 19
[29] H. Ogawa, Y. Amagai, I. Koike, K. Kaiser, R. Benner, Production of refractory 20
dissolved organic matter by bacteria. Science 2001, 292, 917. 21
[30] S. K. Park, N. S. Hettiarachchy, L. Were, Degradation behaviour of soy protein-22
wheat gluten films in simulated soil conditions. J. Agr. Food Chem. 2000, 48, 23
3027. 24
[31] R. A. Herman, J. D. Wolt, W. R. Halliday, Rapid degradation of the Cry1F 25
insecticidal crystal protein in soil. J. Agr. Food Chem. 2002, 50, 7076. 26
[32] A. S. Waksman, K. R. N. Iyer, Contribution to our knowledge of the chemical 27
nature and origin of humus. Soil Sci. 1932, 36, 69. 28
[33] K. M. Holtman, H.-M. Chang, H. Jameel, J. F. Kadla, Elucidation of Lignin 29
Structure through Degradative Methods: Comparison of Modified DFRC and 30
Thioacidolysis. J. Agr. Food Chem. 2003, 51, 3535. 31
22
[34] A. P. Deshmukh, A. J. Simpson, P. G. Hatcher, Evidence for cross-linking in 1
tomato cutin using HR-MAS NMR spectroscopy. Phytochemistry 2003, 64, 1163. 2
[35] A. J. Simpson, M. J. Simpson, W. L. Kingery, B. A. Lefebvre, A. Moser, A. J. 3
Williams, M. Kvasha, B. P. Kelleher, The application of 1H high-resolution 4
magic-angle spinning NMR for the study of clay-organic associations in natural 5
and synthetic complexes. Langmuir 2006, 22, 4498. 6
[36] H. W. Zhang, D. W. Niesel, J. W. Peterson, G. R. Klimpel, Lipoprotein release by 7
bacteria: Potential factor in bacterial pathogenesis. Infect. Immun. 1998, 66, 5196. 8
[37] P. Tréguer, D. M. Nelson, A. J. van Bennekorn, D. J. DeMaster, A. Leynaert, B. 9
Quéguiner, The silica balance in the world ocean: a re-estimate. Science 1995, 10
268, 375. 11
[38] O. Ragueneau, P. Treguer, A. Leynaert, R. F. Anderson, M. A. Brzezinski, D. J. 12
De Master, R. C. Dugdale, J. Dymond, G. Fische, R. Francois, C. Heinze, E. 13
Maier-Reimer, V. Martin- Jezequel, D. M. Nelson, B. Queguiner, A review of the 14
Si cycle in the modern ocean: recent progress and missing gaps in the application 15
of biogenic opal as paleoproductivity proxy. Global Planetary Change 2000, 26, 16
317. 17
[39] A. Yool, T. Tyrrell, Role of diatoms in regulating the ocean’s silicon cycle. 18
Global Biogeochem. Cy. 2003, 17, 14. 19
[40] D. J. Conley, Terrestrial ecosystems and the global biogeochemical silica cycle. 20
Global Biogeochem. Cy. 2002, 16, 1121. 21
[41] P. W. Birkeland, Soils and Geomorphology. 3rd Edn.. Oxford University Press, 22
New York, 1999. 23
[42] N. van Breemen, P. Buurman, Soil Formation. Kluwer Academic Press, 24
Dordrecht, 2002. 25
[43] M. Sommer, D. Kaczorek, Y. Kuzyakov, J. Breuer, Silicon pools and fluxes in 26
soils and landscapes: a review. J. Plant Nutr. Soil Sci. 2006, 169, 310. 27
[44] R. Brindle, M. Punch, K. Albert, H MAS NMR spectroscopy of chemically 28
modified silica gels: a fast method to characterize stationary interphases for 29
chromatography. Solid State Nucl. Mag. 1996, 6, 251. 30

23
[45] B. Lam, A. J. Simpson, Direct 1H NMR spectroscopy of dissolved organic matter 1
in natural waters. The Analyst 2008, 133, 263. 2
[46] Y. Yamashita, E. Tanoue, Distribution and alteration of amino acids in bulk DOM 3
along a transect from bay to oceanic waters. Mar. Chem. 2003, 82, 145. 4
[47] A. B. Jones, W. C. Dennison, G. R. Stmart, Macroalgal responses to nitrogen 5
source and availability: Amino acid metabolic profiling as a bioindicator using 6
Gracilaria edulis (Rhodophyta). J. Phycol. 1996, 32, 757. 7
[48] E. Mellina, J. B. Rasmussen, E. L. Mills, Impact of zebra mussel (Dreissena 8
polymorpha) on phosphorus cycling and chlorophyll in lakes. Can. J. Fish. Aquat. 9
Sci. 1995, 52, 2553. 10
[49] D. L. Arnott, M. J. Vanni, Nitrogen and phosphorus recycling by the zebra mussel 11
(Dreissena polymorpha) in the western basin of Lake Erie. Can. J. Fish. Aquat. 12
Sci. 1996, 53, 646. 13
[50] J. D. Conroy, W. J. Edwards, R. A. Pontius, D. D. Kane, H. Zhang, J. F. Shea, J. 14
N. Richey, D. A. Culver, Soluble nitrogen and phosphorus excretion of exotic 15
freshwater mussels (Dreissena spp.): potential impacts for nutrient 16
remineralisation in western Lake Erie. Freshwater Biol. 2005, 50, 1146. 17
[51] O. Bykova, A. Laursen, V. Bostan, J. Bautista, L. McCarthy, Do zebra mussels 18
(Dreissena polymorpha) alter lake water chemistry in a way that favours 19
Microcystis growth? Sci. Total Environ. 2006, 371, 362. 20
[52] D. J. Burdige, Sediment pore waters. In: Hansell, D.A.,Carlson, C.A.(Eds.), 21
Biogeochemistry of Marine Dissolved Organic Matter. Elsevier Science 2002, 13, 22
pp. 612. 23
[53] K. Mopper, D. J. Kieber, Distribution and biological turnover of dissolved organic 24
compounds in the water column of the Black Sea. Deep-Sea Res. 1991, 38 (Suppl. 25
2), S1021. 26
[54] J. W. Louda, L. Liu, E. W. Baker, Senescence- and death-related 27
alteration of chlorophylls and carotenoids in marine phytoplankton. 28
Org. Geochem. 2002, 33, 12, 1635. 29
[55] T. Matsuno, New structures of carotenoids in marine animals. 30
Pure Appl. Chem. 1985, 57, 5, 659. 31
24
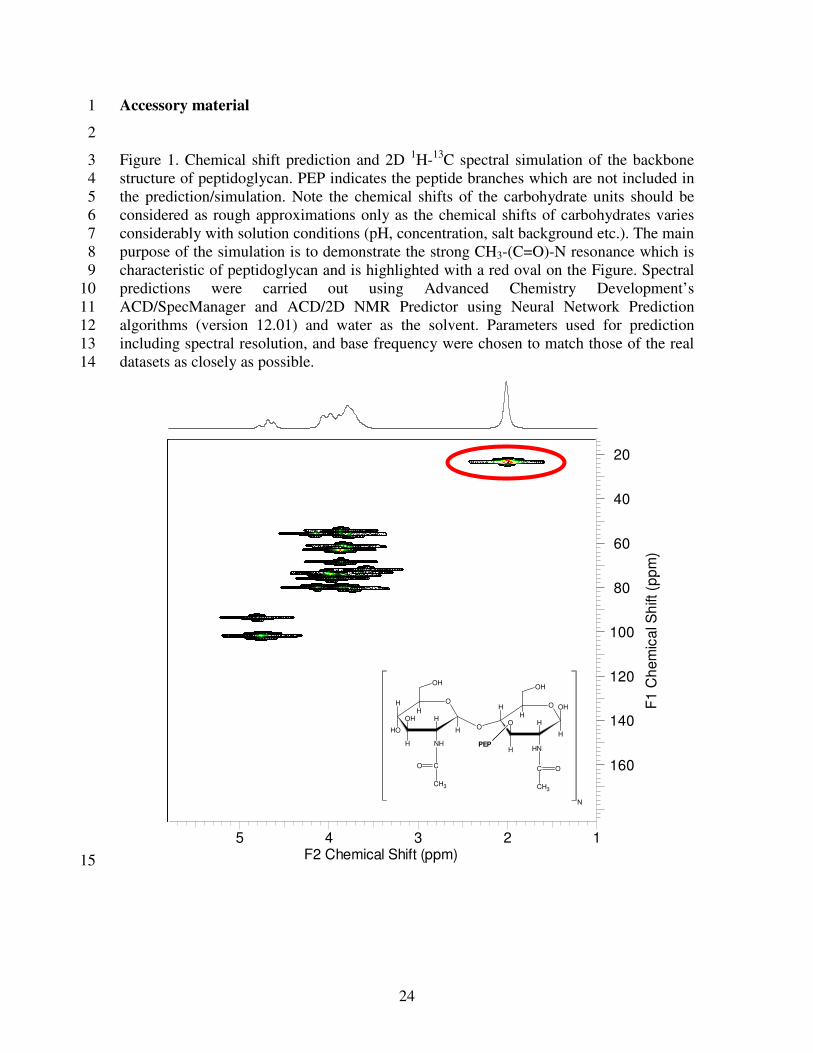
Accessory material 1
2
Figure 1. Chemical shift prediction and 2D 1H-
13C spectral simulation of the backbone 3
structure of peptidoglycan. PEP indicates the peptide branches which are not included in 4
the prediction/simulation. Note the chemical shifts of the carbohydrate units should be 5
considered as rough approximations only as the chemical shifts of carbohydrates varies 6
considerably with solution conditions (pH, concentration, salt background etc.). The main 7
purpose of the simulation is to demonstrate the strong CH3-(C=O)-N resonance which is 8
characteristic of peptidoglycan and is highlighted with a red oval on the Figure. Spectral 9
predictions were carried out using Advanced Chemistry Development’s 10
ACD/SpecManager and ACD/2D NMR Predictor using Neural Network Prediction 11
algorithms (version 12.01) and water as the solvent. Parameters used for prediction 12
including spectral resolution, and base frequency were chosen to match those of the real 13
datasets as closely as possible. 14
5 4 3 2 1F2 Chemical Shift (ppm)
20
40
60
80
100
120
140
160
F1
Ch
em
ica
l Sh
ift (
pp
m)
O
H
HH
H
OH
OH
H NH
O
OH
O
H
HH
H
O
H NH
OH
OH
PEP
CO
CH3
C
CH3
O
N
5 4 3 2 1F2 Chemical Shift (ppm)
20
40
60
80
100
120
140
160
F1
Ch
em
ica
l Sh
ift (
pp
m)
O
H
HH
H
OH
OH
H NH
O
OH
O
H
HH
H
O
H NH
OH
OH
PEP
CO
CH3
C
CH3
O
N
5 4 3 2 1F2 Chemical Shift (ppm)
20
40
60
80
100
120
140
160
F1
Ch
em
ica
l Sh
ift (
pp
m)
O
H
HH
H
OH
OH
H NH
O
OH
O
H
HH
H
O
H NH
OH
OH
PEP
CO
CH3
C
CH3
O
N
15