composition, intensity and revealed comparative advantage ...€¦ · composition, intensity and...
TRANSCRIPT
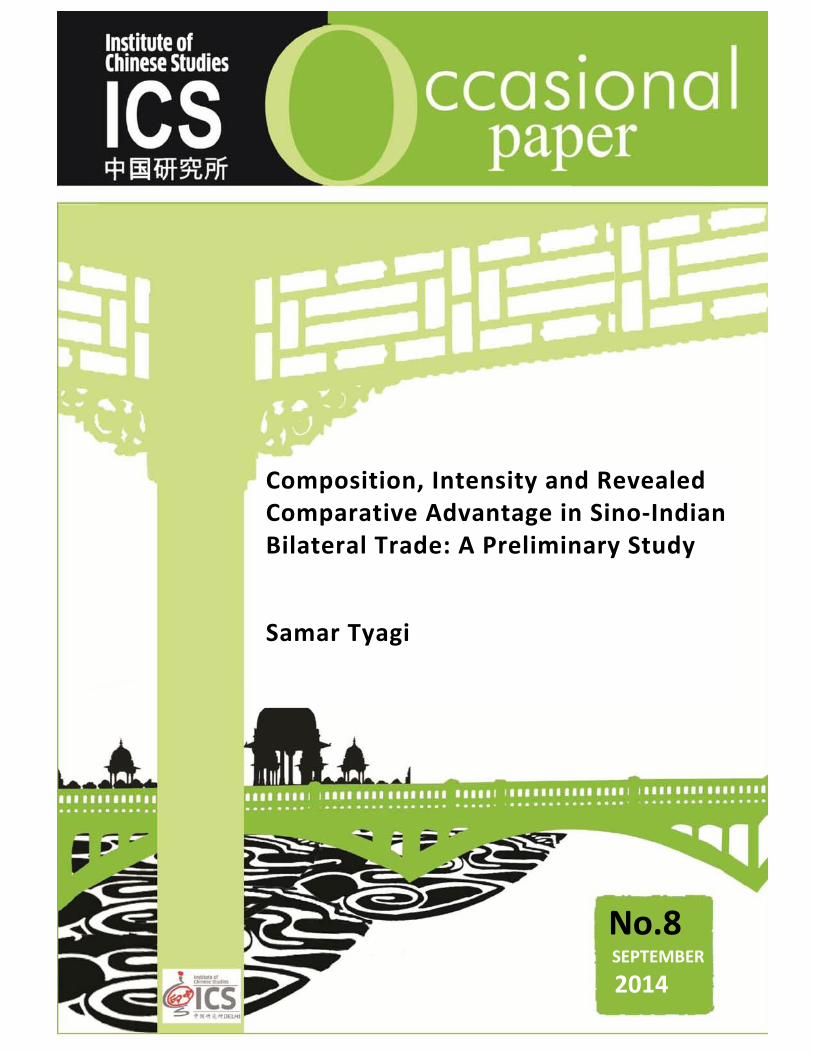
Composition, Intensity and Revealed Comparative Advantage in Sino-Indian Bilateral Trade: A Preliminary Study Samar Tyagi
No.8 SEPTEMBER
2014
Samar Tyagi is currently pursuing his MA in Economics from the Banaras Hindu University, Varanasi. He did his BA (Hons.) in Economics from the same university in 2013. He was a research intern at the Institute of Chinese Studies in June-July 2014 on a project titled, ‘A Comparative Study of India-China Trade: Demystifying the Currency Manipulation Myth’. He has presented several research papers at various national and international seminars and his work has dealt with impact of FDI on multi-brand retail in India, and food price inflation and food security in the country among others. He has also carried out intensive field surveys while studying the loss of livelihood for weavers in Banaras suburban area.
ABOUT THE AUTHOR
First published in 2014 By The Institute of Chinese Studies, 8/17 Sri Ram Road Civil Lines Delhi 110 054, India Ph.: +91-11-23938202; Fax: +91-11-23992166 Email: [email protected] Website: www.icsin.org © Institute of Chinese Studies, Delhi
ICS Occasional Paper # 8
Composition, Intensity and Revealed Comparative Advantage in Sino-Indian Bilateral Trade: A
Preliminary Study
Samar Tyagi Research Intern, Institute of Chinese Studies
& II Yr, MA Economics, Department of Economics,
Banaras Hindu University, Varanasi [email protected]
Institute of Chinese Studies Delhi
1
Composition, Intensity and Revealed Comparative Advantage in Sino-Indian Bilateral Trade: A Preliminary Study
Abstract In recent years Sino-Indian bilateral trade has grown enormously. However, few studies have accurately captured the intricacies of the trade relationship between the two countries. This paper investigates the major trends of bilateral trade and explores issues associated with trade intensity, intra-industry trade and comparative advantage in the two countries. The findings throw light on the burgeoning trade deficit of India vis-à-vis China, which have policy implications for potential trade and economic cooperation between the two developing economies. JEL Classification: F140; F150; O570 Keywords: International trade; China and India; Comparative advantage India and China are arguably set to change the order of multilateral governance. Given their increasing economic size and population, the influence of China and India in global affairs is increasing. Extrapolating from past income growth trends suggests that China will soon be the world’s largest economy while India will be the third-largest economy on purchasing power parity basis. However, in spite of their combined population of 36 per cent of the world’s total, and combined gross domestic product (GDP) of 13.88 per cent (World Bank 2014), India and China are yet to claim the share they deserve in the global economy. With the increase in the size of both economies, their bilateral trade has also increased to nearly US$72 billion in 2012 (UN Comtrade 2014). The surge in the Indian trade deficit during 2002-13, has made headlines in various bilateral talks and a major concern on Indian side. This paper studies the trade patterns and composition between the two countries over a 20-year period. Post-Independence, in 1950s, both countries looked alike in GDP terms. However, with the introduction of economic reforms in China post 1978, GDP growth skyrocketed to double digit for the next three decades. India, also adopted economic reforms in 1991 and growth rates increased. A gap of more than a decade in adoption of reforms is obvious in the outcome. Figure 1 shows the current status of the Sino-Indian position in the world economy through per capita income for over 30 years.
2
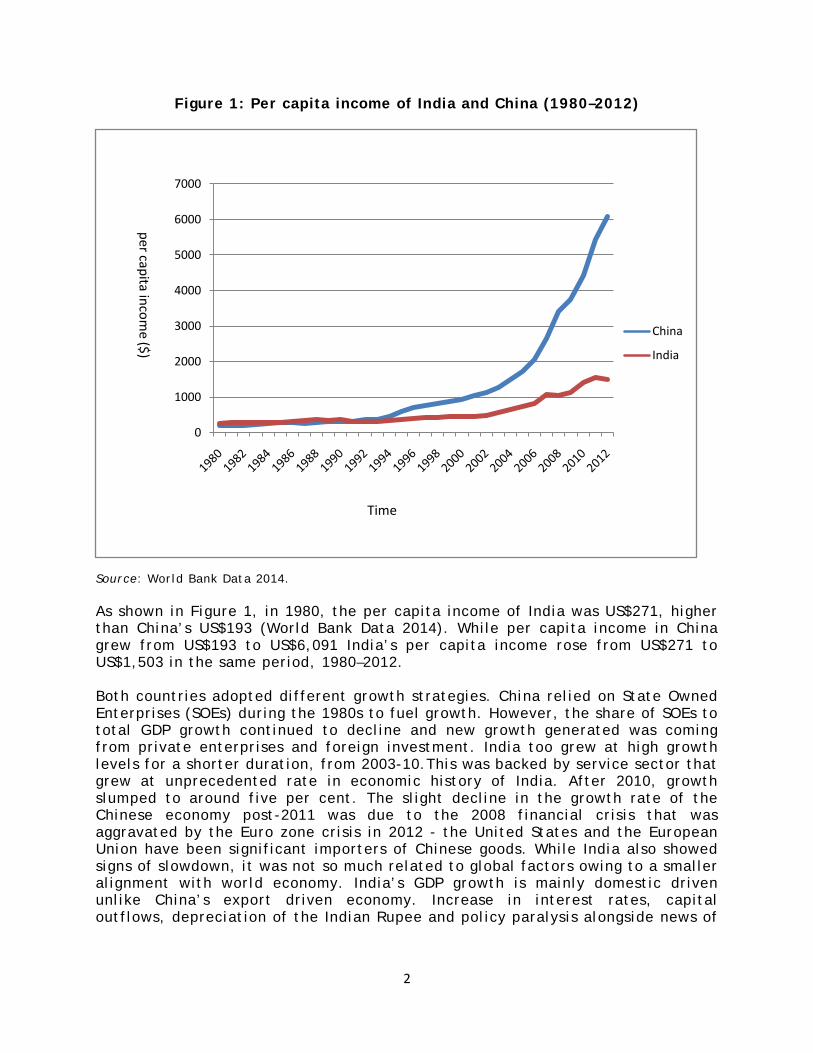
Figure 1: Per capita income of India and China (1980–2012)
Source: World Bank Data 2014. As shown in Figure 1, in 1980, the per capita income of India was US$271, higher than China’s US$193 (World Bank Data 2014). While per capita income in China grew from US$193 to US$6,091 India’s per capita income rose from US$271 to US$1,503 in the same period, 1980–2012. Both countries adopted different growth strategies. China relied on State Owned Enterprises (SOEs) during the 1980s to fuel growth. However, the share of SOEs to total GDP growth continued to decline and new growth generated was coming from private enterprises and foreign investment. India too grew at high growth levels for a shorter duration, from 2003-10.This was backed by service sector that grew at unprecedented rate in economic history of India. After 2010, growth slumped to around five per cent. The slight decline in the growth rate of the Chinese economy post-2011 was due to the 2008 financial crisis that was aggravated by the Euro zone crisis in 2012 - the United States and the European Union have been significant importers of Chinese goods. While India also showed signs of slowdown, it was not so much related to global factors owing to a smaller alignment with world economy. India’s GDP growth is mainly domestic driven unlike China’s export driven economy. Increase in interest rates, capital outflows, depreciation of the Indian Rupee and policy paralysis alongside news of
0
1000
2000
3000
4000
5000
6000
7000
China
India
Time
per capita income ($)
3
various corruption scams and the stalling of major investments in poorer parts of the country, led to the decline in India’s growth rates. Literature Review Earlier studies comparing the economies of India and China focused on developments in the 1950s and 1960s (Bergmann 1977; Chen and Uppal 1971; Harris 1974; Swamy 1973). Now the interest has become more rigorous in comparative studies of the two economies, largely due to their consistent growth performance in the 1980s and 1990s and their subsequent rise in the world economy and politics (Wu and Zhou 2006; Srinivasan 2004; Mohanty 2014). Some authors have examined the institutional settings and their impact on economic performance in the two countries (Huang and Khanna 2003). Others are keen to compare the Chinese and Indian performances in specific areas such as the steel industry (Kirkpatrick 1994) while a few works have sought to make trade projections (Boillot and Labbouz 2006). Arunachalaramanan and Golait (2011) have examined the impact of the yuan’s revaluation on India’s trade and found that, despite the depreciation of the rupee vis-à-vis the yuan, India’s balance of trade with China has worsened. Batra (2004) calculated the trade potential of India with all countries and found that bilateral trade with China still holds good potential. Beretta and Lenti (2012) have also studied bilateral trade intensively and give a comprehensive analysis of the commodities traded. This preliminary study is an attempt to fill the void in the understanding of Sino-Indian bilateral trade as available studies investigate trade relationships for a small period of time. It provides a comprehensive analysis of trade for 20 years during the period 1992–2012 and suggests policy implications, also drawn from statistical calculations. These could prove useful to Indian policymakers as they move to tame the burgeoning trade deficit and boost domestic production. Methodology This paper first examines Sino-Indian bilateral trade from 1992 to 2012 after which it calculates commodity share in the trade composition taking data from UN Comtrade Database. This shows the changing share of various commodities over the years. Next, it calculates the intra-industry trade index, leading to a computation of comparative advantage indices. Finally, some policy implications are highlighted, that clearly elucidate bilateral trade analysis, taking inputs from calculated indices. Income data are derived from the World Bank data, and trade data for the period 1992–2012 are from UN Comtrade. Data from 1996 to 2013 are derived from the Ministry of Commerce and Industry, Government of India.
4
Scope of the Study This is a comparative study that examines Sino-Indian bilateral trade for 20 years from 1992 to 2012. India was the 15th largest trading partner of China in 2012 with a share of 1.72 per cent in China’s overall trade. India was also the seventh largest export destination for China, accounting for 2.33 per cent of overall Chinese exports, and 19th among the countries exporting to China with a share of 1.1 per cent in overall imports by China in the same year. (Embassy of India, Beijing, China 2014) The slowdown in the developed countries adversely affected China’s growth rate too. China has for some time been diversifying its export market to decrease the vulnerability of its exports’ dependence on a few markets. In this endeavor, India is potentially a formidable partner that can be a reliable market for Chinese manufacturers in the long run. Given its 1.2 billion population with a rising middle income population, India provides the best possible destination for Chinese goods. Following 2003, high GDP growth rates in South Asian economies too, gave a fillip to trade. This period saw unprecedented growth in bilateral trade and China became the top trading partner of India. However, this is dwarfed by China’s export dominance vis-à-vis India.
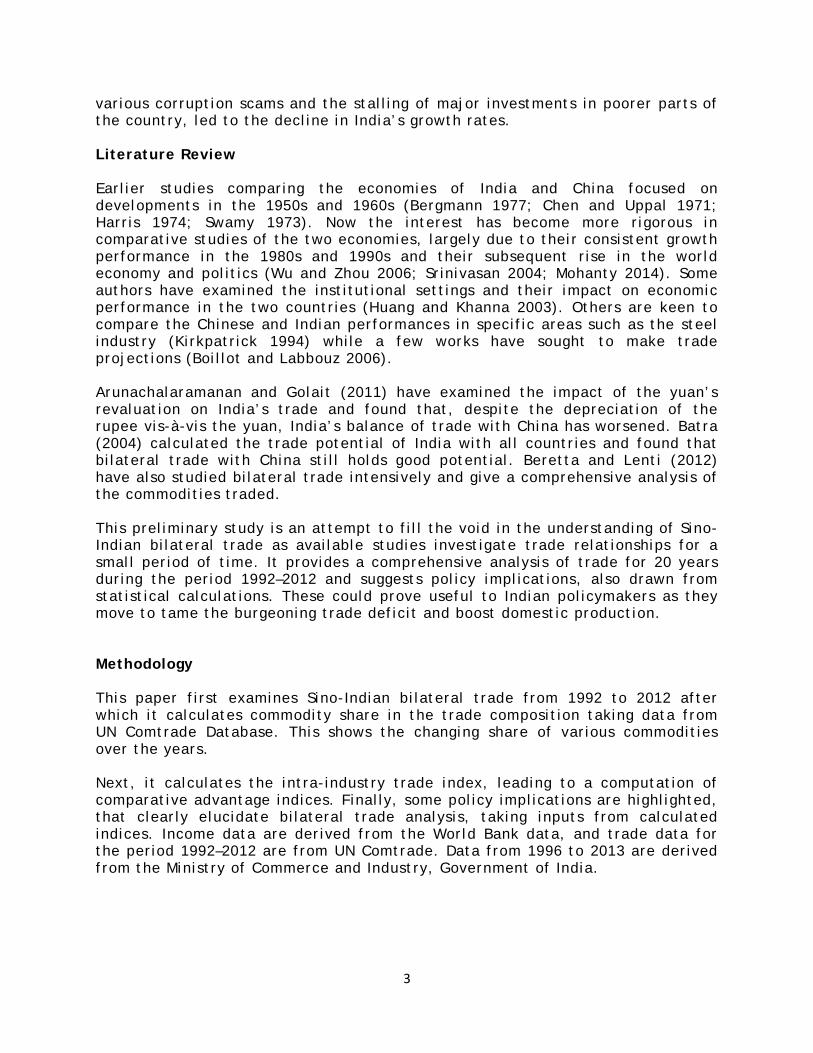
Figure 2: Bilateral Trade (Export and Import) of India and China
Source: Ministry of Commerce, Government of India 2014. As per Fig. 2, bilateral trade increased from US$1,371.71 million in 1996–7 to US$65,878.32 million in 2013–4. Imports and exports both increased for India but the rate of growth of imports from China exceeded the exports growth rate to
0
10000
20000
30000
40000
50000
60000
70000
80000
1996
1997
1998
1999
2000
2011
2002
2003
2004
2005
2006
2007
2008
2009
2010
2011
2012
2013
Exports to China
Imports from China InM
illio
n Do
llars
5
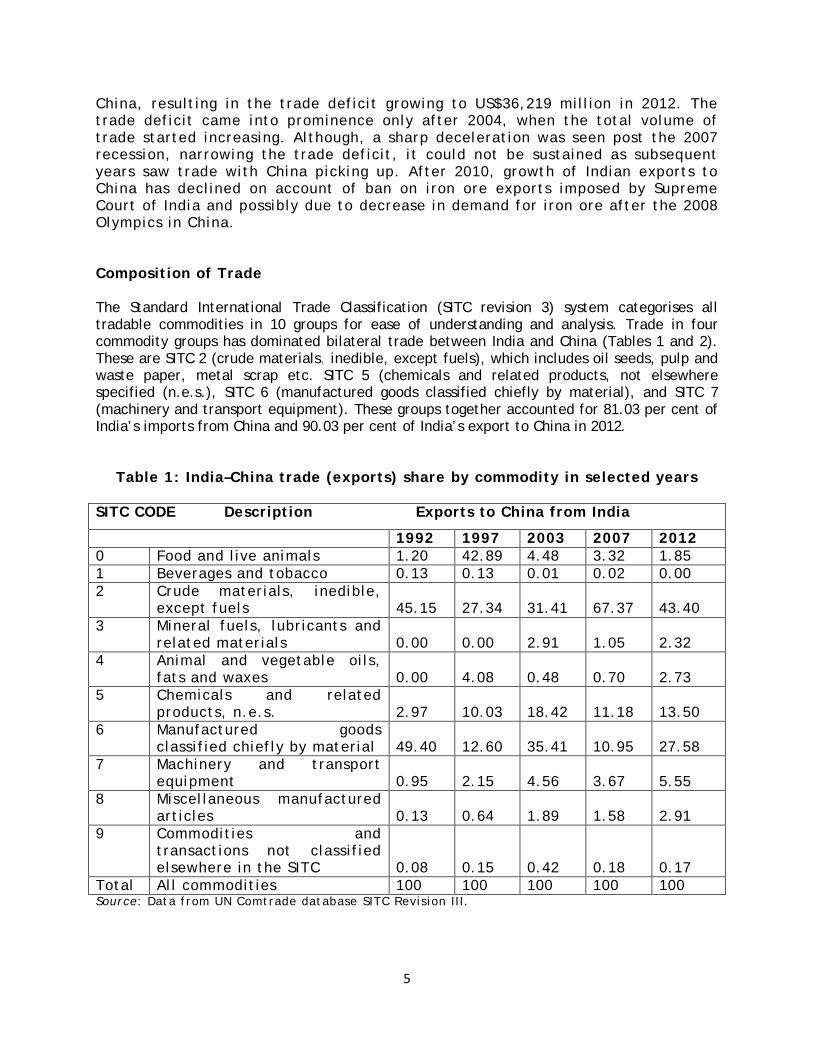
China, resulting in the trade deficit growing to US$36,219 million in 2012. The trade deficit came into prominence only after 2004, when the total volume of trade started increasing. Although, a sharp deceleration was seen post the 2007 recession, narrowing the trade deficit, it could not be sustained as subsequent years saw trade with China picking up. After 2010, growth of Indian exports to China has declined on account of ban on iron ore exports imposed by Supreme Court of India and possibly due to decrease in demand for iron ore after the 2008 Olympics in China. Composition of Trade The Standard International Trade Classification (SITC revision 3) system categorises all tradable commodities in 10 groups for ease of understanding and analysis. Trade in four commodity groups has dominated bilateral trade between India and China (Tables 1 and 2). These are SITC 2 (crude materials, inedible, except fuels), which includes oil seeds, pulp and waste paper, metal scrap etc. SITC 5 (chemicals and related products, not elsewhere specified (n.e.s.), SITC 6 (manufactured goods classified chiefly by material), and SITC 7 (machinery and transport equipment). These groups together accounted for 81.03 per cent of India’s imports from China and 90.03 per cent of India’s export to China in 2012.
Table 1: India–China trade (exports) share by commodity in selected years SITC CODE Description Exports to China from India
1992 1997 2003 2007 2012 0 Food and live animals 1.20 42.89 4.48 3.32 1.85 1 Beverages and tobacco 0.13 0.13 0.01 0.02 0.00 2 Crude materials, inedible,
except fuels 45.15 27.34 31.41 67.37 43.40 3 Mineral fuels, lubricants and
related materials 0.00 0.00 2.91 1.05 2.32 4 Animal and vegetable oils,
fats and waxes 0.00 4.08 0.48 0.70 2.73 5 Chemicals and related
products, n.e.s. 2.97 10.03 18.42 11.18 13.50 6 Manufactured goods
classified chiefly by material 49.40 12.60 35.41 10.95 27.58 7 Machinery and transport
equipment 0.95 2.15 4.56 3.67 5.55 8 Miscellaneous manufactured
articles 0.13 0.64 1.89 1.58 2.91 9 Commodities and
transactions not classified elsewhere in the SITC 0.08 0.15 0.42 0.18 0.17
Total All commodities 100 100 100 100 100 Source: Data from UN Comtrade database SITC Revision III.
6
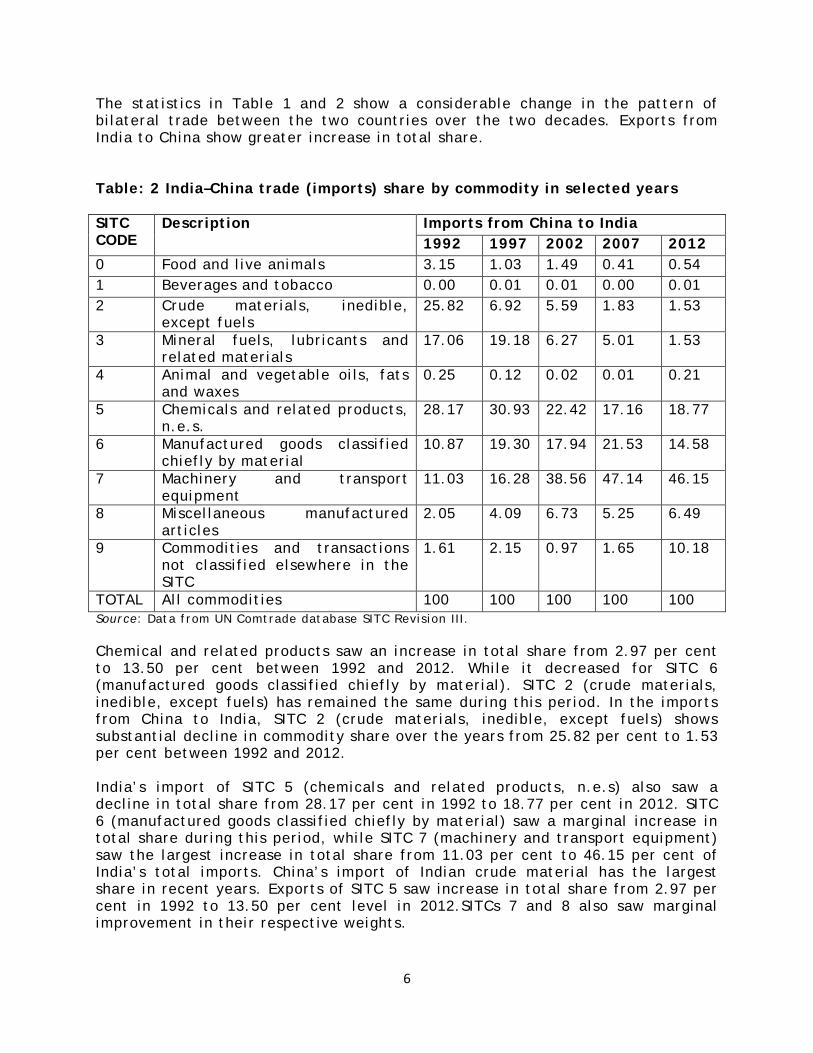
The statistics in Table 1 and 2 show a considerable change in the pattern of bilateral trade between the two countries over the two decades. Exports from India to China show greater increase in total share. Table: 2 India–China trade (imports) share by commodity in selected years SITC CODE
Description Imports from China to India 1992 1997 2002 2007 2012
0 Food and live animals 3.15 1.03 1.49 0.41 0.54 1 Beverages and tobacco 0.00 0.01 0.01 0.00 0.01 2 Crude materials, inedible,
except fuels 25.82 6.92 5.59 1.83 1.53
3 Mineral fuels, lubricants and related materials
17.06 19.18 6.27 5.01 1.53
4 Animal and vegetable oils, fats and waxes
0.25 0.12 0.02 0.01 0.21
5 Chemicals and related products, n.e.s.
28.17 30.93 22.42 17.16 18.77
6 Manufactured goods classified chiefly by material
10.87 19.30 17.94 21.53 14.58
7 Machinery and transport equipment
11.03 16.28 38.56 47.14 46.15
8 Miscellaneous manufactured articles
2.05 4.09 6.73 5.25 6.49
9 Commodities and transactions not classified elsewhere in the SITC
1.61 2.15 0.97 1.65 10.18
TOTAL All commodities 100 100 100 100 100 Source: Data from UN Comtrade database SITC Revision III. Chemical and related products saw an increase in total share from 2.97 per cent to 13.50 per cent between 1992 and 2012. While it decreased for SITC 6 (manufactured goods classified chiefly by material). SITC 2 (crude materials, inedible, except fuels) has remained the same during this period. In the imports from China to India, SITC 2 (crude materials, inedible, except fuels) shows substantial decline in commodity share over the years from 25.82 per cent to 1.53 per cent between 1992 and 2012. India’s import of SITC 5 (chemicals and related products, n.e.s) also saw a decline in total share from 28.17 per cent in 1992 to 18.77 per cent in 2012. SITC 6 (manufactured goods classified chiefly by material) saw a marginal increase in total share during this period, while SITC 7 (machinery and transport equipment) saw the largest increase in total share from 11.03 per cent to 46.15 per cent of India’s total imports. China’s import of Indian crude material has the largest share in recent years. Exports of SITC 5 saw increase in total share from 2.97 per cent in 1992 to 13.50 per cent level in 2012.SITCs 7 and 8 also saw marginal improvement in their respective weights.
7
These tables show the changes in exports and imports of both countries over time for share of commodity. They also let us see the dominance of commodities in each period and the shrinkage too. This evolving trade pattern should be examined intensively for a more critical perspective as to how China gained the upper hand in trade while India lagged. Intensity of Trade Many statistical indices are available to measure trade between two nations. One of the most popular methods is the trade intensity index (Brown 1949; Kojima 1964). The index appears in two forms, the export intensity index (XII) and import intensity index (MII). They are defined as follows:
𝑋𝑋𝑋𝑋𝑋𝑋𝑋𝑋 =𝑥𝑥𝑋𝑋𝑥𝑥 / 𝑋𝑋𝑋𝑋𝑋𝑋
𝑀𝑀𝑥𝑥𝑋𝑋 /( 𝑀𝑀𝑋𝑋–𝑀𝑀𝑋𝑋𝑋𝑋 )
and
𝑀𝑀𝑋𝑋𝑋𝑋𝑋𝑋 = 𝑚𝑚𝑋𝑋𝑥𝑥 / 𝑀𝑀𝑋𝑋𝑋𝑋
𝑋𝑋 𝑥𝑥𝑋𝑋 /( 𝑋𝑋𝑋𝑋 – 𝑋𝑋 𝑋𝑋𝑋𝑋 )
whereXII i is the country i’s export intensity index, MII i the country i’s import intensity index, xij the country i’s exports to country j, Xiw the country i’s total exports to the world, Mjw the country j’s total imports from the world, Mw the world total imports, Miw the country i’s total imports from the world, mij the country i’s imports from country j, Xjw the country j’s total exports to the world, Xw the world total exports. Export and import intensity indices reflect the ratio of the share of country i’s trade with country j relative to the share of the world with country j. An index of greater (less) than unity has been interpreted as an indication of larger (smaller) than expected trade flow between two parties. Table 3 demonstrates that all export and import intensity indices with three exceptions are smaller than unity. That means India and China are trading less than they should. Thus there is great potential for trade to expand between the two countries. It also shows substantial increase in trade between the two countries in the past decades. China imported relatively more from India up to 2003, and between 2007 and 2012, India imported more than China. Till 2003, the export intensity of India was more than that of China, but after 2003 China’s export intensity accelerated vis-à-vis India. This table clearly shows the implications of trade intensity that is in China’s favour and gives some idea about the huge trade deficit.
8
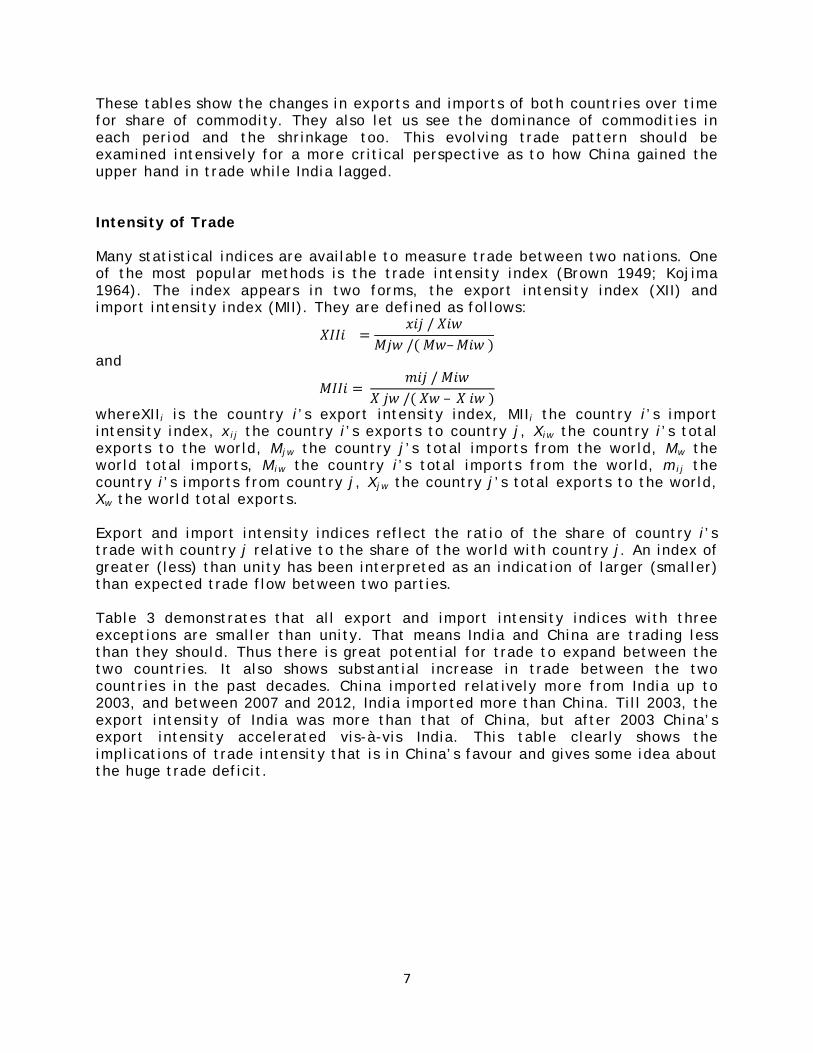
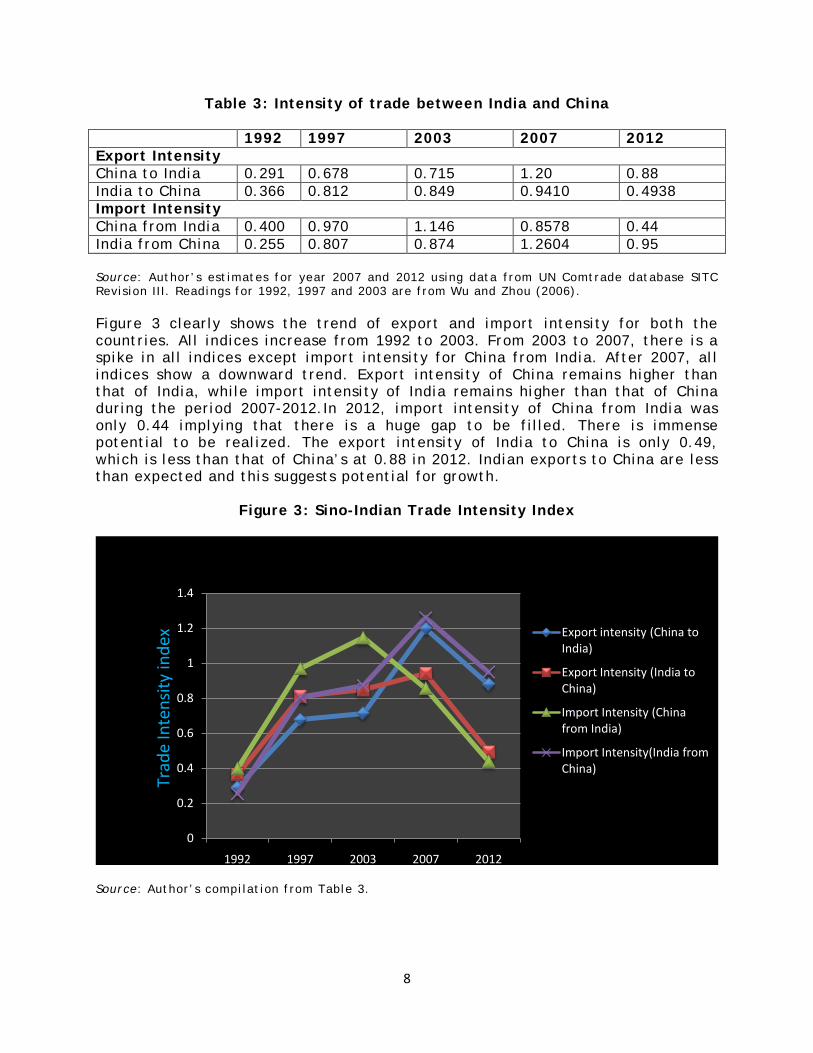
Table 3: Intensity of trade between India and China 1992 1997 2003 2007 2012 Export Intensity China to India 0.291 0.678 0.715 1.20 0.88 India to China 0.366 0.812 0.849 0.9410 0.4938 Import Intensity China from India 0.400 0.970 1.146 0.8578 0.44 India from China 0.255 0.807 0.874 1.2604 0.95 Source: Author’s estimates for year 2007 and 2012 using data from UN Comtrade database SITC Revision III. Readings for 1992, 1997 and 2003 are from Wu and Zhou (2006). Figure 3 clearly shows the trend of export and import intensity for both the countries. All indices increase from 1992 to 2003. From 2003 to 2007, there is a spike in all indices except import intensity for China from India. After 2007, all indices show a downward trend. Export intensity of China remains higher than that of India, while import intensity of India remains higher than that of China during the period 2007-2012.In 2012, import intensity of China from India was only 0.44 implying that there is a huge gap to be filled. There is immense potential to be realized. The export intensity of India to China is only 0.49, which is less than that of China’s at 0.88 in 2012. Indian exports to China are less than expected and this suggests potential for growth.
Figure 3: Sino-Indian Trade Intensity Index
Source: Author’s compilation from Table 3.
0
0.2
0.4
0.6
0.8
1
1.2
1.4
1992 1997 2003 2007 2012
Export intensity (China to India)
Export Intensity (India to China)
Import Intensity (China from India)
Import Intensity(India from China)
Trad
eIn
tens
ity in
dex
9
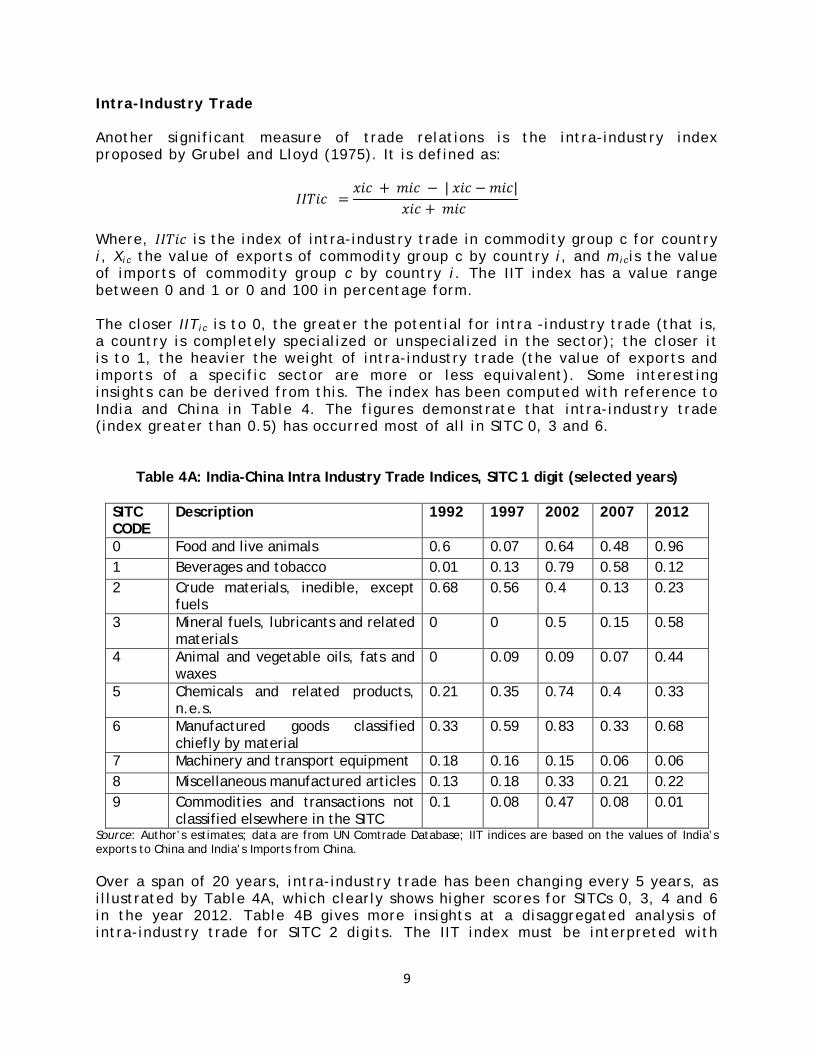
Intra-Industry Trade Another significant measure of trade relations is the intra-industry index proposed by Grubel and Lloyd (1975). It is defined as:
𝑋𝑋𝑋𝑋𝐼𝐼𝑋𝑋𝐼𝐼 =𝑥𝑥𝑋𝑋𝐼𝐼 + 𝑚𝑚𝑋𝑋𝐼𝐼 − | 𝑥𝑥𝑋𝑋𝐼𝐼 − 𝑚𝑚𝑋𝑋𝐼𝐼|
𝑥𝑥𝑋𝑋𝐼𝐼 + 𝑚𝑚𝑋𝑋𝐼𝐼
Where, 𝑋𝑋𝑋𝑋𝐼𝐼𝑋𝑋𝐼𝐼 is the index of intra-industry trade in commodity group c for country i, Xic the value of exports of commodity group c by country i, and micis the value of imports of commodity group c by country i. The IIT index has a value range between 0 and 1 or 0 and 100 in percentage form. The closer IITic is to 0, the greater the potential for intra -industry trade (that is, a country is completely specialized or unspecialized in the sector); the closer it is to 1, the heavier the weight of intra-industry trade (the value of exports and imports of a specific sector are more or less equivalent). Some interesting insights can be derived from this. The index has been computed with reference to India and China in Table 4. The figures demonstrate that intra-industry trade (index greater than 0.5) has occurred most of all in SITC 0, 3 and 6.
Table 4A: India-China Intra Industry Trade Indices, SITC 1 digit (selected years)
SITC CODE
Description 1992 1997 2002 2007 2012
0 Food and live animals 0.6 0.07 0.64 0.48 0.96 1 Beverages and tobacco 0.01 0.13 0.79 0.58 0.12 2 Crude materials, inedible, except
fuels 0.68 0.56 0.4 0.13 0.23
3 Mineral fuels, lubricants and related materials
0 0 0.5 0.15 0.58
4 Animal and vegetable oils, fats and waxes
0 0.09 0.09 0.07 0.44
5 Chemicals and related products, n.e.s.
0.21 0.35 0.74 0.4 0.33
6 Manufactured goods classified chiefly by material
0.33 0.59 0.83 0.33 0.68
7 Machinery and transport equipment 0.18 0.16 0.15 0.06 0.06 8 Miscellaneous manufactured articles 0.13 0.18 0.33 0.21 0.22 9 Commodities and transactions not
classified elsewhere in the SITC 0.1 0.08 0.47 0.08 0.01
Source: Author’s estimates; data are from UN Comtrade Database; IIT indices are based on the values of India’s exports to China and India’s Imports from China. Over a span of 20 years, intra-industry trade has been changing every 5 years, as illustrated by Table 4A, which clearly shows higher scores for SITCs 0, 3, 4 and 6 in the year 2012. Table 4B gives more insights at a disaggregated analysis of intra-industry trade for SITC 2 digits. The IIT index must be interpreted with
10
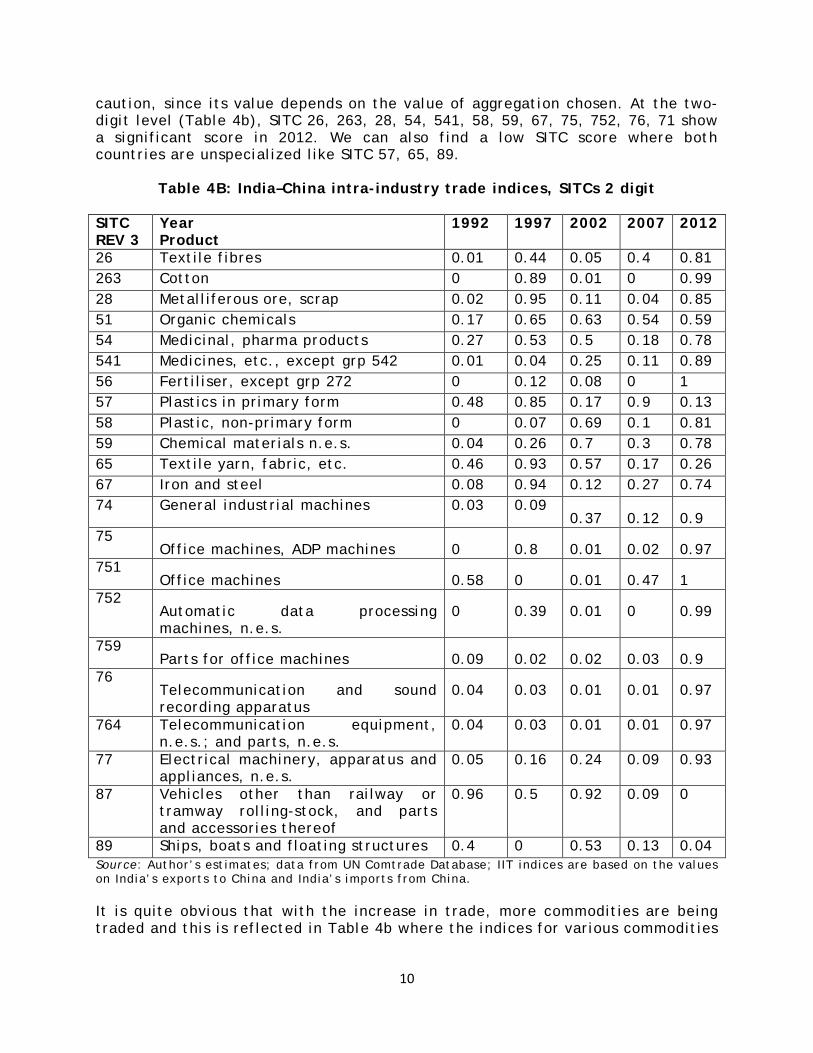
caution, since its value depends on the value of aggregation chosen. At the two-digit level (Table 4b), SITC 26, 263, 28, 54, 541, 58, 59, 67, 75, 752, 76, 71 show a significant score in 2012. We can also find a low SITC score where both countries are unspecialized like SITC 57, 65, 89.
Table 4B: India–China intra-industry trade indices, SITCs 2 digit SITC REV 3
Year Product
1992 1997 2002 2007 2012
26 Textile fibres 0.01 0.44 0.05 0.4 0.81 263 Cotton 0 0.89 0.01 0 0.99 28 Metalliferous ore, scrap 0.02 0.95 0.11 0.04 0.85 51 Organic chemicals 0.17 0.65 0.63 0.54 0.59 54 Medicinal, pharma products 0.27 0.53 0.5 0.18 0.78 541 Medicines, etc., except grp 542 0.01 0.04 0.25 0.11 0.89 56 Fertiliser, except grp 272 0 0.12 0.08 0 1 57 Plastics in primary form 0.48 0.85 0.17 0.9 0.13 58 Plastic, non-primary form 0 0.07 0.69 0.1 0.81 59 Chemical materials n.e.s. 0.04 0.26 0.7 0.3 0.78 65 Textile yarn, fabric, etc. 0.46 0.93 0.57 0.17 0.26 67 Iron and steel 0.08 0.94 0.12 0.27 0.74 74 General industrial machines 0.03 0.09
0.37 0.12 0.9 75
Office machines, ADP machines 0 0.8 0.01 0.02 0.97 751
Office machines 0.58 0 0.01 0.47 1 752
Automatic data processing machines, n.e.s.
0 0.39 0.01 0 0.99
759 Parts for office machines 0.09 0.02 0.02 0.03 0.9
76 Telecommunication and sound recording apparatus
0.04 0.03 0.01 0.01 0.97
764 Telecommunication equipment, n.e.s.; and parts, n.e.s.
0.04 0.03 0.01 0.01 0.97
77 Electrical machinery, apparatus and appliances, n.e.s.
0.05 0.16 0.24 0.09 0.93
87 Vehicles other than railway or tramway rolling-stock, and parts and accessories thereof
0.96 0.5 0.92 0.09 0
89 Ships, boats and floating structures 0.4 0 0.53 0.13 0.04 Source: Author’s estimates; data from UN Comtrade Database; IIT indices are based on the values on India’s exports to China and India’s imports from China. It is quite obvious that with the increase in trade, more commodities are being traded and this is reflected in Table 4b where the indices for various commodities
11
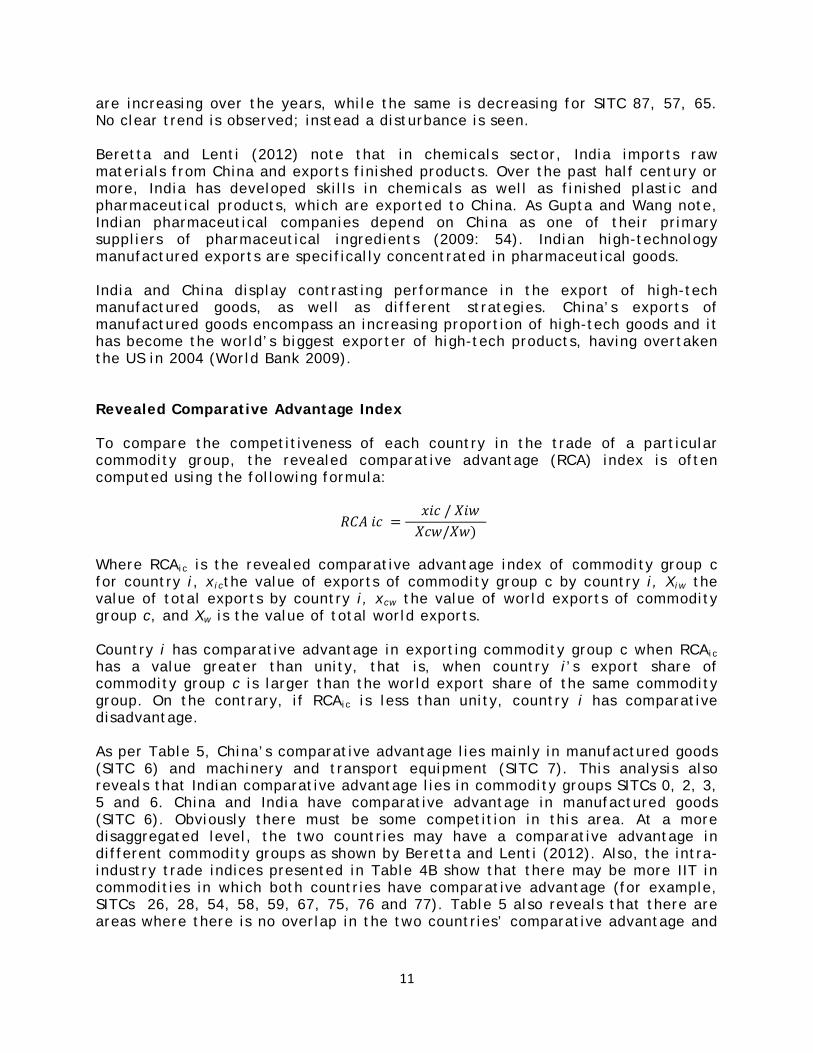
are increasing over the years, while the same is decreasing for SITC 87, 57, 65. No clear trend is observed; instead a disturbance is seen. Beretta and Lenti (2012) note that in chemicals sector, India imports raw materials from China and exports finished products. Over the past half century or more, India has developed skills in chemicals as well as finished plastic and pharmaceutical products, which are exported to China. As Gupta and Wang note, Indian pharmaceutical companies depend on China as one of their primary suppliers of pharmaceutical ingredients (2009: 54). Indian high-technology manufactured exports are specifically concentrated in pharmaceutical goods. India and China display contrasting performance in the export of high-tech manufactured goods, as well as different strategies. China’s exports of manufactured goods encompass an increasing proportion of high-tech goods and it has become the world’s biggest exporter of high-tech products, having overtaken the US in 2004 (World Bank 2009). Revealed Comparative Advantage Index To compare the competitiveness of each country in the trade of a particular commodity group, the revealed comparative advantage (RCA) index is often computed using the following formula:
𝑅𝑅𝑅𝑅𝑅𝑅 𝑋𝑋𝐼𝐼 = 𝑥𝑥𝑋𝑋𝐼𝐼 / 𝑋𝑋𝑋𝑋𝑋𝑋 𝑋𝑋𝐼𝐼𝑋𝑋/𝑋𝑋𝑋𝑋)
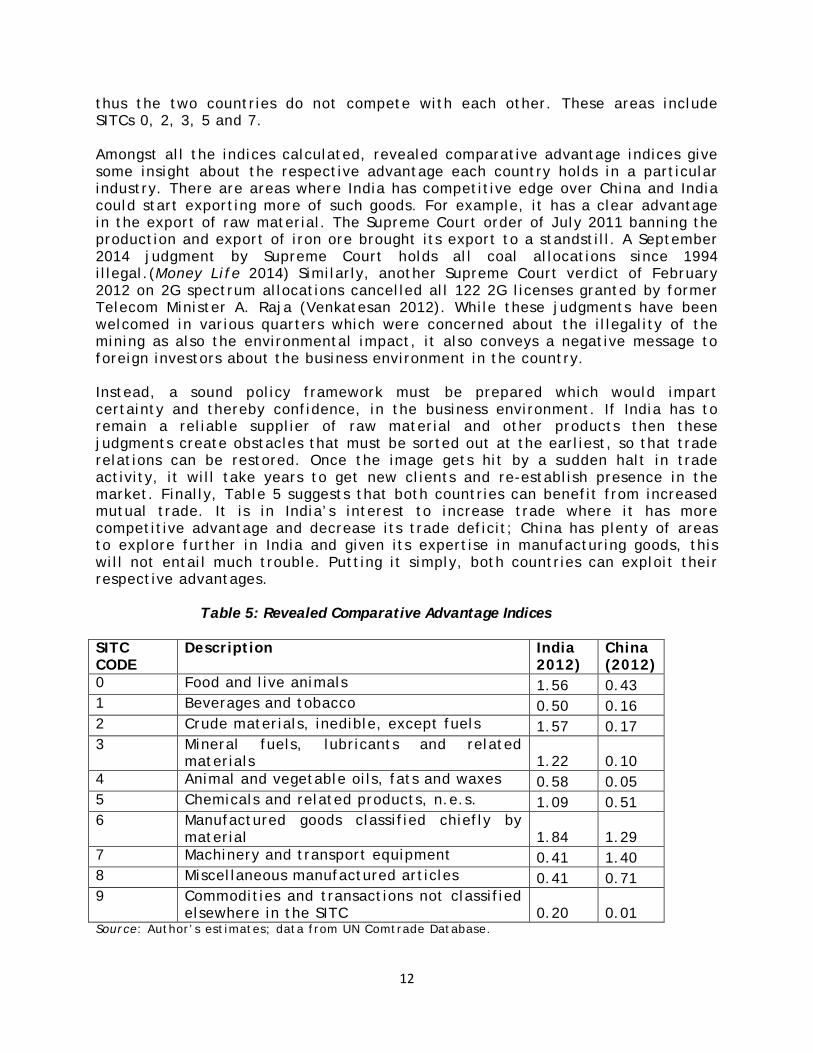
Where RCAic is the revealed comparative advantage index of commodity group c for country i, xicthe value of exports of commodity group c by country i, Xiw the value of total exports by country i, xcw the value of world exports of commodity group c, and Xw is the value of total world exports. Country i has comparative advantage in exporting commodity group c when RCAic has a value greater than unity, that is, when country i’s export share of commodity group c is larger than the world export share of the same commodity group. On the contrary, if RCAic is less than unity, country i has comparative disadvantage. As per Table 5, China’s comparative advantage lies mainly in manufactured goods (SITC 6) and machinery and transport equipment (SITC 7). This analysis also reveals that Indian comparative advantage lies in commodity groups SITCs 0, 2, 3, 5 and 6. China and India have comparative advantage in manufactured goods (SITC 6). Obviously there must be some competition in this area. At a more disaggregated level, the two countries may have a comparative advantage in different commodity groups as shown by Beretta and Lenti (2012). Also, the intra-industry trade indices presented in Table 4B show that there may be more IIT in commodities in which both countries have comparative advantage (for example, SITCs 26, 28, 54, 58, 59, 67, 75, 76 and 77). Table 5 also reveals that there are areas where there is no overlap in the two countries’ comparative advantage and
12
thus the two countries do not compete with each other. These areas include SITCs 0, 2, 3, 5 and 7. Amongst all the indices calculated, revealed comparative advantage indices give some insight about the respective advantage each country holds in a particular industry. There are areas where India has competitive edge over China and India could start exporting more of such goods. For example, it has a clear advantage in the export of raw material. The Supreme Court order of July 2011 banning the production and export of iron ore brought its export to a standstill. A September 2014 judgment by Supreme Court holds all coal allocations since 1994 illegal.(Money Life 2014) Similarly, another Supreme Court verdict of February 2012 on 2G spectrum allocations cancelled all 122 2G licenses granted by former Telecom Minister A. Raja (Venkatesan 2012). While these judgments have been welcomed in various quarters which were concerned about the illegality of the mining as also the environmental impact, it also conveys a negative message to foreign investors about the business environment in the country. Instead, a sound policy framework must be prepared which would impart certainty and thereby confidence, in the business environment. If India has to remain a reliable supplier of raw material and other products then these judgments create obstacles that must be sorted out at the earliest, so that trade relations can be restored. Once the image gets hit by a sudden halt in trade activity, it will take years to get new clients and re-establish presence in the market. Finally, Table 5 suggests that both countries can benefit from increased mutual trade. It is in India’s interest to increase trade where it has more competitive advantage and decrease its trade deficit; China has plenty of areas to explore further in India and given its expertise in manufacturing goods, this will not entail much trouble. Putting it simply, both countries can exploit their respective advantages. Table 5: Revealed Comparative Advantage Indices SITC CODE
Description India 2012)
China (2012)
0 Food and live animals 1.56 0.43 1 Beverages and tobacco 0.50 0.16 2 Crude materials, inedible, except fuels 1.57 0.17 3 Mineral fuels, lubricants and related
materials 1.22 0.10 4 Animal and vegetable oils, fats and waxes 0.58 0.05 5 Chemicals and related products, n.e.s. 1.09 0.51 6 Manufactured goods classified chiefly by
material 1.84 1.29 7 Machinery and transport equipment 0.41 1.40 8 Miscellaneous manufactured articles 0.41 0.71 9 Commodities and transactions not classified
elsewhere in the SITC 0.20 0.01 Source: Author’s estimates; data from UN Comtrade Database.
13
Policy Implications and Recommendations Trade was an important contributor of China and India’s high GDP growth in the last two decades. As our analysis (using the trade intensity index) shows, bilateral trade between both countries is still below its potential. While China has more export intensity to India, there is enough room for India to increase its share in bilateral trade. Intra-industry trade indices show that trade has been changing every 5 years. The closer the IIT index is to zero, the greater is the potential to increase trade. This analysis shows that it can be increased in SITC 1 (beverages and tobacco), 2 (crude materials, inedible, except fuels), 7 (machinery and transport equipment), 8 (miscellaneous manufactured articles). The need of the hour is to increase trade in commodity groups that have seen more collaboration in recent years. Comparative advantage indices reveal the advantage each country holds in a respective commodity. This opportunity is to be exploited. From the policy perspective, this is most important—if India is to increase its share in bilateral trade, then it has to export more commodities in the areas discussed in Table 5. One of the most important variables in trade is the exchange rate. Changes in exchange rates lead to gains and losses to partner countries and therefore this aspect has to be analysed carefully. There are some concerns about the impact of the yuan’s revaluation on bilateral trade, but no serious research has been conducted so far. There is one study which concludes that if there is one per cent deprecation of the rupee vis-à-vis the yuan, it is likely to reduce India’s imports from China by around 0.43 per cent and vice versa (Arunachalaramanan and Golait 2011). There is a great deal of literature suggesting that China adopts currency manipulation strategy to get the upper hand in trade vis-à-vis the United States. This has to be studied empirically, in a far more rigorous manner; in the case of India, the study cited above has shown that the appreciation of the yuan has been instrumental in trade deficit (Arunachalaramanan and Golait 2011). However, we cannot rely on a single study, as no evidence of yuan depreciation harming India’s exports to China is established. Hence, it is necessary to contest and re-examine this relationship carefully. Trade is a multivariate function. The need of the hour is to revive exports—this requires working on all fronts, be it infrastructure, land acquisition, labour laws, project clearing process and other formalities that have become constraints and inhibit production. Working in synergy with all other factors will bring quick results and make India an equal partner in its economic relations with China. Conclusion This paper provides an exposition of the Sino-Indian trade relationship for the last two decades. Both countries have benefited from this economic cooperation
14
in many ways. The results from calculated indices show that India has a huge potential in trade with China and eyebrows need not be raised over the burgeoning trade deficit. Next, growth in trade is also possible if both countries exploit their comparative advantage as shown in many commodities. There is an overlap in a few commodities, so the two countries can trade in areas where there is no overlap in comparative advantage. There is also scope for increased intra-industry trade in some areas where the two countries compete with each other. Both countries can exchange valuable experiences given the different growth strategy each has adopted. India has been able to sustain high growth rate with little investment in infrastructure, while China’s enormous investment in infrastructure made it the factory of the world. After the slowdown, it can still accelerate its economy if the service sector gets a stimulus. India can make a significant contribution in this area. India’s manufacturing sector meanwhile, is still very small in terms of contribution to GDP growth. Both countries can and should learn from each other. The policy implications discussed in the last section tell us how India and China can move forward without harming each other’s interests. REFERENCES Arunachalaramanan, S. and Ramesh Golait. 2011. ‘The Implication of renminbi revaluation on India’s trade: A study’, RBI Working Paper Series 2. Batra, A. 2004. ‘India's global trade potential: The gravity model approach’, Global Economic Review, Vol. 35, No. 3, 327–61. Beretta, S. and R. T. Lenti. 2012. ‘India and China: Trading with the World and Each Other’, Economic & Political Weekly, Vol. 47, No. 44, 35–43. Bergmann, T. 1977. ‘The development models of India, the Soviet Union and China: A comparative analysis.’ Assen: Van Gorcum. Boillot, J., and M. Labbouz. 2006. ‘India – China Trade: Lessons Learned and projections for 2015’, Economic and Political weekly, June 30-July 6, 2893-2901. Brown, A. J. 1949.Applied Economics: Aspects of World Economy in War and Peace. London: George Allen and Unwin. Chen, K. I. and J. S. Uppal. 1971. ‘India and China: Studies in comparative development’. New York: Free Press. Embassy of India, China. 2014. ‘India-China Economic Relations’, http://www.indianembassy.org.cn/DynamicContent.aspx?MenuId=86&SubMenuId=0(accessed on 16 September 2014). Grubel, H. and P. J. Lloyd. 1975. Intra-Industry Trade: The Theory and Measurement of International Trade in Differentiated Products. London: Macmillan Gupta, Anil K. and H. Wang. 2009.‘Getting China and India Right: Strategies for Leveraging the World’s Fastest Growing Economies for Global Advantage.’ San Francisco: Jossey-Bass. Harris, N. 1974. India–China: Underdevelopment and Revolution. Delhi: Vikas Publishing House.
15
Huang, Y. and T. Khanna, T. 2003. ‘Can India overtake China’, Foreign Policy, No. 137, 74–81. Kirkpatrick, C. 1994. ‘Asian Crucible: The Steel Industry in China and India’, Journal of International Development, Vol. 6, No. 2, 255–256. Kojima, K. 1964. ‘The Pattern of International Trade among Advanced Countries’, Hitotsubashi Journal of Economics, Vol. 5, No. 1, 16–36. Maddison, A. 2001. The World Economy: A Millennial Perspective. Paris: Development Centre of the OECD. Mohanty, S.K. 2014. ‘India-China Trade Relationship’ RIS, New Delhi, http://ris.org.in/images/RIS_images/pdf/India%20china%20report.pdf (accessed on 16 September 2014). Money Life. 2014. ‘How to resolve iron ore mining issues’, 19 September, http://www.moneylife.in/article/iron-ore-mining/38854.html (accessed on 20 September 2014). Srinivasan, T. N. 2004. ‘China and India: Economic performance, competition and cooperation: An update’, Journal of Asian Economics, Vol. 15, 613–636. Swamy, S. 1973. ‘Economic Growth in China and India, 1952–1970: A Comparative Appraisal’, Economic Development and Cultural Change, Vol. 21, No4, Part II UN Comtrade Database accessible on http://comtrade.un.org/data/ (accessed on 30 June 2014). Venkatesan, J. 2012. ‘Supreme Court scraps UPA’s ‘illegal’ 2G sale’, The Hindu, 2 February, http://www.thehindu.com/news/national/supreme-court-scraps-upas-illegal-2g-sale/article2853159.ece (accessed on 30 June 2014). World Bank .2009. Information and Communications for Development 2009: Extending Reach and Increasing Impact, http://elibrary.worldbank.org/doi/abs/10.1596/978-0-8213-7605-8 (accessed on 30 June 2014). World Bank. 2014. ‘Data’, accessible at http://data.worldbank.org/. Wu, Y. and Z. Zhou. 2006. ‘Changing bilateral trade between China and India’, Journal of Asian Economics, Vol. 17, No. 3, 509–18.
# 1 - ICS-IIC Roundtable on the Brookings Report: “Addressing the US-China Strategic Distrust” June 2012
OCCASIONAL PAPER SERIES (New):
# 2 - Y J Sithara Fernando, “China’s Relations with the Indian Ocean Region” October 2012
#3 - Madhavi Thampi & Nirmola Sharma, “Catalogue of Materials Related to Modern China in the National Archives of India Part One (Special Collections)” January 2013
#4 - Manmohan Agarwal, “Comparing India and China’s Economic Performance since 1991” February 2013
#5 - Y J Sithara Fernando, “China and the Cooperative Architecture in the South China Sea: Prospects and Problems” August 2013
#6 – Joe Thomas Karackattu, “India–China Economic Relations: Trends, Challenges And Policy Options” December 2013
#7 – Mirza Zulfiqur Rahman, “Territory, Tribes, Turbines: Local Community perceptions and responses to Infrastructure Development along the Sino-Indian Border in Arunachal Pradesh” June 2014