components of biological motion perception
TRANSCRIPT

COMPONENTS OF BIOLOGICAL MOTION PERCEPTION
by
Daniel Robert Saunders
A thesis submitted to the Department of Psychology
in conformity with the requirements for
the degree of Doctor of Philosophy
Queen’s University
Kingston, Ontario, Canada
(May, 2011)
Copyright ©Daniel Robert Saunders, 2011

ii
Abstract
Biological motion perception, defined as the ability to retrieve information from minimal
displays of animal motion, has often been discussed as though it represents a single mechanism.
However, depending on the task and details of the stimuli, there have been divergent results as to
whether this ability is primarily based on motion or form processing, whether it relies more on
local or global information, and whether the knowledge that is applied is learned or innate. These
results can be reconciled by a multi-component framework, with five major components: local
motion invariant processing, structure-from-motion, figure-ground segregation, action
categorization, and style recognition. Several experiments are reported that are motivated by this
framework.
To investigate the sensitivity of the visual system to local motion invariants, performance
was tested on a direction discrimination and a detection task with a point-light walker based on
real motion-capture data or a synthetic walker created by Cutting (Chapter 2). When the walkers
were displayed normally, performance was equal for both stimuli. However, when the walkers
were spatially scrambled, the direction could only be determined for the natural walker,
demonstrating that the invariant is found in subtle features of the local motion trajectories.
Another experiment examined the difference in attentional distribution due to the task
requirements (Chapter 3). Participants looked more often at the feet in a direction task than they
did in a gender task, lending support to the idea that useful information can be derived from the
local motion of the feet.
Finally, Chapter 4 describes a battery of psychophysical tests that assesses each of the
components of biological motion perception as independently as possible. The fact that individual

iii
performance does not correlate between tests is evidence that they measure different underlying
mechanisms, supporting the multi-component framework.
In the concluding chapter, multi-component computational models of biological motion
perception are evaluated within this framework, and the evidence relating the components to
activity in particular brain regions is reviewed.

iv
Acknowledgements
First, I’d like to thank my advisor Niko, who has been a tremendous inspiration and role
model, and who I always felt I could count on. I’m grateful to the faculty of the Psychology
department for creating the stimulating environment that is essential for the development of a
scientist, and for helping me personally on a number of occasions, especially my committee
members and Doug Mewhort, Barrie Frost, Ingrid Johnsrude, and Monica Castelhano.
I’d like to thank my labmates for keeping me company and keeping me sane, and from
whom I learned a lot in the course of our conversations. Many thanks to my best friend Jim
Davies, who is always there with advice and encouragement when I need it most. Thank you to
all my Kingston friends and acquaintances, many of whom have a big part in creating the
community that has made it such a livable city for the last 6 3/4 years. You’re not going to read
this, but you’re the best.
Finally, I’d like to thank my parents, whose love and support is the foundation all this is
built on. I always felt you’d be proud of me no matter what I did, but I hope you’re super-duper
extra proud. Love you guys.

v
Co-Authorship
I. Co-Authorship Declaration
In all cases, the data analysis, interpretation and manuscript preparation were performed by the
author. The experiments of Chapter 4 were designed and conducted by the author. The
experiment of Chapter 3 was designed by the author and carried out by the co-author.
II. Declaration of Previous Publication
This thesis includes three original papers that have been submitted to peer reviewed
journals, as follows:
Thesis chapter Publication title/full citation Publication status
Chapter 2 Saunders, D. R., Suchan, J., & Troje, N. F. (2009). Off on the wrong foot: Local features in biological motion. Perception, 38(4), 522-532.
Published
Chapter 3 Saunders, D. R., Williamson, D. K., & Troje, N. F. (2010). Gaze patterns during perception of direction and gender from biological motion. Journal of Vision, 10(11), 1-10.
Published
Chapter 4 Saunders, D. R. & Troje, N. F. (2011). A battery of tests for assessing biological motion perception. Manuscript submitted for publication to Seeing and Perceiving, February 28, 2011.
Submitted
I certify that I have obtained written permission from the copyright owners to include the above
published materials in my thesis (Appendix). I certify that the above material describes work
completed during my registration as a graduate student at Queen’s University.

vi
Table of Contents
Abstract ............................................................................................................................................ii Acknowledgements......................................................................................................................... iv Co-Authorship ................................................................................................................................. v Table of Contents............................................................................................................................vi List of Figures .................................................................................................................................. x Chapter 1 General Introduction ....................................................................................................... 1
1.1 The significance of biological motion perception.................................................................. 1 1.2 The role of motion and form information .............................................................................. 2 1.3 The role of global and local processes ................................................................................... 6 1.4 The role of knowledge ........................................................................................................... 9 1.5 A hierarchy of biological motion processing....................................................................... 12 1.6 Specificity of local motion invariant processing (Chapter 2) .............................................. 13 1.7 Localization of information for different components (Chapter 3) ..................................... 15 1.8 Assessing biological motion perception components (Chapter 4) ....................................... 15 References.................................................................................................................................. 17
Chapter 2 Specificity of local motion invariant processing ........................................................... 27 2.1 Introduction.......................................................................................................................... 27 2.2 Methods ............................................................................................................................... 32
2.2.1 Participants.................................................................................................................... 32 2.2.2 Stimuli........................................................................................................................... 32 2.2.3 Procedure ...................................................................................................................... 34
2.3 Results.................................................................................................................................. 35 2.3.1 Direction task ................................................................................................................ 35 2.3.2 Detection task................................................................................................................ 36
2.4 Discussion............................................................................................................................ 37 References.................................................................................................................................. 44
Chapter 3 Localization of information for different components .................................................. 48 3.1 Introduction.......................................................................................................................... 48 3.2 Methods ............................................................................................................................... 51
3.2.1 Participants.................................................................................................................... 51 3.2.2 Materials ....................................................................................................................... 52

vii
3.2.3 Stimuli........................................................................................................................... 52 3.2.4 Procedure ...................................................................................................................... 53
3.3 Results.................................................................................................................................. 56 3.3.1 Accuracy ....................................................................................................................... 56 3.3.2 Fixation maps................................................................................................................ 58 3.3.3 Regions of interest ........................................................................................................ 61 3.3.4 Individual gaze patterns and accuracy .......................................................................... 63
3.4 Discussion............................................................................................................................ 63 References.................................................................................................................................. 67
Chapter 4 Assessing biological motion perception components.................................................... 70 4.1 Introduction.......................................................................................................................... 70 4.2 BMLtest: A Comprehensive Assessment of Biological Motion Perception........................ 79
4.2.1 Overview....................................................................................................................... 79 4.2.2 Adaptive threshold procedure ....................................................................................... 80 4.2.3 Coherency test............................................................................................................... 80
4.2.3.1 Introduction............................................................................................................ 80 4.2.3.2 Stimuli.................................................................................................................... 80 4.2.3.3 Procedure ............................................................................................................... 81
4.2.4 Detection test ................................................................................................................ 81 4.2.4.1 Introduction............................................................................................................ 81 4.2.4.2 Stimuli.................................................................................................................... 81 4.2.4.3 Procedure ............................................................................................................... 82
4.2.5 Direction test ................................................................................................................. 82 4.2.5.1 Introduction............................................................................................................ 82 4.2.5.2 Stimuli.................................................................................................................... 82 4.2.5.3 Procedure ............................................................................................................... 83
4.2.6 Distortion test................................................................................................................ 83 4.2.6.1 Introduction............................................................................................................ 83 4.2.6.2 Stimuli.................................................................................................................... 83 4.2.6.3 Procedure ............................................................................................................... 84
4.2.7 Action test ..................................................................................................................... 84 4.2.7.1 Introduction............................................................................................................ 84 4.2.7.2 Stimuli.................................................................................................................... 85

viii
4.2.7.3 Procedure ............................................................................................................... 85 4.2.8 Gender test .................................................................................................................... 85
4.2.8.1 Introduction............................................................................................................ 85 4.2.8.2 Stimuli.................................................................................................................... 85 4.2.8.3 Procedure ............................................................................................................... 86
4.2.9 Identity test.................................................................................................................... 86 4.2.9.1 Introduction............................................................................................................ 86 4.2.9.2 Stimuli.................................................................................................................... 87 4.2.9.3 Procedure ............................................................................................................... 88
4.3 Evaluation of BMLtest – Experiment 1 ............................................................................... 89 4.3.1 Introduction................................................................................................................... 89 4.3.2 Methods ........................................................................................................................ 89
4.3.2.1 Participants............................................................................................................. 89 4.3.2.2 Procedure ............................................................................................................... 89 4.3.2.3 Data analysis .......................................................................................................... 90 4.3.2.4 Apparatus & Stimuli .............................................................................................. 90
4.3.3 Results........................................................................................................................... 90 4.3.3.1 Questionnaire responses......................................................................................... 90 4.3.3.2 Practice and setting effects..................................................................................... 91
4.3.4 Discussion..................................................................................................................... 94 4.4 Evaluation of BMLtest – Experiment 2 ............................................................................... 95
4.4.1 Introduction................................................................................................................... 95 4.4.2 Methods ........................................................................................................................ 95 4.4.3 Results........................................................................................................................... 96 4.4.4 Discussion..................................................................................................................... 98
4.5 General Discussion .............................................................................................................. 99 References................................................................................................................................ 102
Chapter 5 General Discussion...................................................................................................... 110 5.1 Biological motion perception is more than one phenomenon............................................ 110 5.2 Computational models of biological motion perception.................................................... 112 5.3 Functional dissociation and neural localization of components ........................................ 114
5.3.1 Processsing local motion invariants............................................................................ 115 5.3.2 Structure-from-motion ................................................................................................ 116

ix
5.3.3 Figure-ground segregation .......................................................................................... 117 5.3.4 Action categorization .................................................................................................. 117 5.3.5 Style recognition ......................................................................................................... 117
5.4 A multi-component approach to studying biological motion perception........................... 118 References................................................................................................................................ 120
Summary and Conclusions .......................................................................................................... 126

x
List of Figures
Figure 2.1. Mean error rates across twelve participants for the direction task ............................... 35
Figure 2.2. Mean error rates across twelve participants for the detection task ............................... 37
Figure 2.3. Plots of the trajectory of the ankle movement of a walker seen in sagittal view and facing to the right .................................................................................................................... 38
Figure 2.4. Vertical displacement, velocity, and acceleration of the ankle dot over two full gait cycles for the BML walker and Cutting’s walker ................................................................... 39
Figure 2.5. Horizontal displacement, velocity, and acceleration of the ankle dot over two full gait cycles for the BML walker and Cutting’s walker ................................................................... 40
Figure 3.1. The predefined shoulder, pelvis and foot regions of interest........................................ 55
Figure 3.2. The average proportion correct for the direction and gender task................................ 57
Figure 3.3. Fixation map across all participants and all conditions, and corresponding vertical distribution of fixations........................................................................................................... 58
Figure 3.4. Fixation maps for each participant, showing the fixations for the two tasks across all view angles and all gender levels............................................................................................ 60
Figure 3.5 The average number of fixations within the three ROIs for the two tasks .................... 61
Figure 3.6. The average number of fixations during the direction task in the three ROIs for the different view angles............................................................................................................... 62
Figure 4.1. Descriptions of the tests that comprise BMLtest.......................................................... 78
Figure 4.2. Mean test scores in the lab and home settings.............................................................. 92
Figure 4.3. Mean test scores for the first sessions of participants in Experiment 1 and Experiment 2 .............................................................................................................................................. 98
Figure 5.1. Direction discrimination accuracies from an experiment manipulating the global structure and local motion orientation of a point-light walker.............................................. 111

xi
List of Tables
Table 4.1. Experiment 1 home-lab correlation .............................................................................. 94 Table 4.2. Experiment 2 test-retest reliability................................................................................ 96 Table 4.3. Intercorrelations between biological motion tests ........................................................ 97

1
Chapter 1
General Introduction
1.1 The significance of biological motion perception
In 1973, the Swedish psychologist Gunnar Johansson observed that humans are strikingly
sensitive to the motion of living creatures. When exposed to movies consisting of only a handful
of light patches tracking the major joints of a moving person, all observers had a vivid impression
of seeing a human figure. These point-light displays of human motion are the foundation of the
field of biological motion perception, and represent a significant contribution to the study of
vision. Like faces, they are complex social stimuli that can yield rich percepts from relatively
small amounts of information. Unlike still images of faces, there is a dimension of time,
connecting biological motion perception to both basic motion perception and the perception-
action system. Although they contain a great deal of social information, point-light displays can
be carefully controlled, and so bridge the gap between the gratings and bars used in research on
early vision and the high-dimensional visual input present in video footage or the everyday visual
world. There has also been keen interest from the computer vision community, because of the
many potential uses for information about people’s activities that could be automatically
extracted from video cameras (Aggarwal & Cai, 1999; Poppe, 2010).
From the first studies of biological motion perception, researchers have attempted to
describe the processes that make it possible. The proposed mechanisms can be organized
according to three attributes: the emphasis on the motion information in the display as compared
to the form information, the emphasis on global or spatially local information, and whether the
knowledge that is involved is learned or innate. The fact that experimental results vary for these
attributes depending on the task and details of the stimuli is suggestive that biological motion
consists of multiple phenomena, reflecting different underlying mechanisms.

2
1.2 The role of motion and form information
A topic of great interest in biological motion perception has been whether it relies more
on motion information or form information. The point-light stimulus might seem to be inherently
dynamic, and Johansson (1973) reported that naïve observers did not interpret static frames of
point-light displays as human figures. However, later studies found that experienced observers
could see humans in single frames (Cutting, Moore, & Morrison, 1988; Thirkettle, Benton, &
Scott-Samuel, 2009). When the elements of biological motion displays are manipulated in ways
that are known to diminish motion sensitivity, such as randomly changing the polarity of the dots
or representing the elements as changes in texture or contrast, many perceptual tasks are
unaffected (Aaen-Stockdale, Thompson, Hess, & Troje, 2008; Ahlstrom, Blake, & Ahlstrom,
1997). Conversely, unlike simple motion detection, biological motion perception is harmed by
low-light conditions (Grossman & Blake, 1999). From the neuroscience literature, there exist
brain lesion patients who are capable of perceiving biological motion but not simple motion
(McLeod, Dittrich, Driver, Perrett, & Zihl, 1996; Vaina, Lemay, Bienfang, Choi, & Nakayama,
1990), and some fMRI studies have found more consistent activation in form processing areas in
response to biological motion than in motion processing areas (Michels, Lappe, & Vaina, 2005;
Peelen, Wiggett, & Downing, 2006; Thompson, Clarke, Stewart, & Puce, 2005).
The role of local motion, in the context of retrieving the global organization of a point-
light walker, was addressed directly by Beintema and Lappe’s (2002) experiments using a
stimulus they called the sequential position walker. It is derived from a point-light display of
human walking, but instead of tracking the joints, the dots are placed at random positions on the
limbs, and frequently disappear and reappear at a different location. In one condition, dots were
relocated between each frame, and yet observers still identified the display as a human walking
despite the absence of local motion signals, and performed at near-normal levels in determining

3
the walking direction, among other perceptual tasks. When the lifetime of the dots was increased,
enhancing the motion signal, no improvement in performance was detected. The effectiveness of
the sequential position walker for producing an impression of human action was confirmed by
further studies using this display (Beintema, Georg, & Lappe, 2006; Kuhlmann, de Lussanet, &
Lappe, 2009; Michels et al., 2005).
These results, showing that continuous local motion is not necessary for perceiving
biological motion, led Beintema, Georg and Lappe (2006) to the view that form is of greater
importance, and that the only role of motion signals is to segregate the point-light walker from
masking noise. Once it is segregated, biological motion is recognized using a collection of form
templates, with evidence for a particular interpretation accumulating over time. This view was
implemented in a computer model (Lange, Georg, & Lappe, 2006; Lange & Lappe, 2006), in
which time was represented as a learned ordering of static form templates resembling frames of
an animation. Approaches along these lines have been taken in the computer vision applications
with some success (for a review, see Aggarwal & Cai, 1999).
There is also evidence that motion-dependent processes are important for interpreting
biological motion. As in simple motion detection, when the dots that define it are isoluminant the
figure is much less effective (Garcia & Grossman, 2008). Playing a point-light display of human
motion back at non-naturalistic speeds makes perceptual judgments difficult or impossible
(Barclay, Cutting, & Kozlowski, 1978; Beintema, Oleksiak, & van Wezel, 2006), as does adding
a blank interval between frames (Mather, Radford, & West, 1992; Thornton, Rensink, & Shiffrar,
2002). In fMRI studies, point-light walkers activate the motion area hMT/V5+ (Bonda, Petrides,
Ostry, & Evans, 1996; Grossman et al., 2000), and the posterior superior temporal sulcus
(Grossman et al., 2000; Peuskens, Vanrie, Verfaillie, & Orban, 2005; Santi, Servos, Vatikiotis-
Bateson, Kuratate, & Munhall, 2003; Vaina, Solomon, Chowdhury, Sinha, & Belliveau, 2001),
4
which receives input from the motion-driven dorsal stream as well as the ventral stream
(Felleman & Van Essen, 1991).
Assuming that the motion in point-light displays is important for interpreting them, how
is this information used? The main importance of the motion of the dots might be to define the
three-dimensional articulated body structure. Once the viewer has recovered this structure, the
movement can be interpreted in terms of the deformation of it over time. The initial inference of
the rigid segments and joints implicit in a point-light display has been called structure-from-
motion, after the ability to recover the 3-D structure of a fully rigid object when it is presented
from several views (Ullman, 1979), although disambiguating a piecewise-rigid object like the
human body is a somewhat different problem. Johansson (1973; 1976) and Cutting (1981)
described how the rigid connections between point lights could be recovered by determining
whether the motion of one joint could be more simply described within the reference frame of
another. These proposals did not reach the level of detail of a computational algorithm, but later
attempts did (Hoffman & Flinchbaugh, 1982; Webb & Aggarwal, 1982), although their analysis
revealed that additional constraints were needed for the structure to be uniquely specified.
Outside of the context of retrieving the global shape, recent studies have revealed that the
motion trajectories carry valuable information on their own. When the form is destroyed by
spatially scrambling the location of the motion trajectories, the display is still sufficient to
determine the walking direction (Chang & Troje, 2008; Troje & Westhoff, 2006), create an
impression of animacy (Chang & Troje, 2008), and even give reliable cues to the emotion being
portrayed (Chouchourelou, Matsuka, Harber, & Shiffrar, 2006). A different source of motion-
based information is the opponent motion signal created when the dots representing the feet cross,
which some have argued is used for biological motion detection (Casile & Giese, 2005; Thurman
& Grossman, 2008).

5
There is also evidence that human observers are sensitive to the dynamics implicit in a
point-light animation, and their consistency with real-world dynamics (Runeson, 1994; Runeson
& Frykholm, 1983). Point-light gaits played back at different speeds give different impressions of
the size of a walking creature, that are consistent across participants (Jokisch & Troje, 2003), and
observers can identify the correct playback speed for a normal gait (Giese & Lappe, 2002).
Shipley (2003) created point-light displays from motion capture recordings of people walking on
their hands and found that these were more easily perceived in noise than the same displays
inverted, which had a more familiar form but unrealistic dynamics. And Bingham, Schmidt, and
Rosenblum (1995) found that observers could distinguish animate from inanimate events when
they were represented by single dot trajectories. Consistency with realistic dynamics may be what
makes the local motion of the feet compelling and informative, since these trajectories become
much less useful when inverted (Chang & Troje, 2009a; Troje & Westhoff, 2006). It appears that
the human visual system is tuned to certain types of motion that reflect gravity, inertia, friction,
muscle performance, and other constraints of the natural world.
Some studies have directly compared the contribution of motion and form to specific
tasks. Mather and Murdoch (1994) set dynamic cues of a point-light display in opposition to
structural cues in a gender discrimination task and found that the dynamic cues dominated.
Similarly, Troje (2002) compared the effect of removing either the form or the motion
information that specified gender from a point-light display, and found that the loss of motion
information harmed gender discrimination more than loss of structural information. However
participants remained above chance with only the structural cues available, at least when the
point-light walkers were viewed from the front.
Overall, the evidence suggests that the output of simple motion integration mechanisms
such as are found in brain area MT may not be necessary for most biological motion perception

6
tasks, but that motion still contributes, and carries valuable information about the dynamics of the
scene. It is unlikely that an approach based solely on static form templates could fully explain
biological motion perception.
1.3 The role of global and local processes
Another important dimension along which proposed mechanisms for perceiving
biological motion differ is in whether they are spatially localized or distributed across the display.
Results in face perception emphasize the role of global information, which is often referred to as
‘configural’ information in this domain. Configural information has been defined different ways,
including as the spatial relations between pairs of features, or as holistic representations that do
not decompose the image into features (Maurer, Le Grand, & Mondloch, 2002). One result that
supports the importance of configural information is the whole-part advantage (Tanaka & Farah,
1993), in which studied facial features are better recognized when presented in their proper
location within a face, even if it is not the originating face. There is also the composite face effect
(Young, Hellawell, & Hay, 1987), which describes how participants find it more difficult to
recognize the top half or bottom half of faces when they are aligned with the other half of a
different face. In both cases, the overall holistic impression interferes with perception of the local
features, indicating faces are not recognized in terms of their component parts.
Further evidence for configural processing comes from a widely observed property of
face perception, that it is impaired when the face is turned upside-down (for a review see
Valentine, 1988). Several experiments manipulated either the configural or featural information
in face images to determine which contributed more to this characteristic inversion effect. Searcy
and Bartlett (1996) distorted either the spatial relations between features or the features
themselves, and found that participants only detected distortions in the configuration when the

7
faces were presented upright. Freire, Lee, and Symons (2000) swapped facial features between
photographs of individuals or changed the position of their facial features, and found that the
spatial changes were only detected in an upright face. These and other findings led to the view
that only configural processes are orientation-dependent, and so particularly important in face
perception.
Therefore some researchers have interpreted the fact that there is a pronounced inversion
effect for biological motion (Pavlova & Sokolov, 2000; Sumi, 1984) as evidence that it is
primarily recognized through global, configural information, based on the converse proposition
that orientation dependency is an indicator of configural processing. However, as Sekuler,
Gaspar, Gold, and Bennett (2004) pointed out, logically this is not necessarily the case. Another
source of evidence for global processing is experiments where local biological motion features
are made uninformative. For example, when point-light displays are placed in a mask constructed
from dots that move according to the trajectories of dots in the walker (a ‘scrambled walker
mask’), so that the presence of valid local motion does not guarantee the presence of a walker,
participants can still perform a detection task (Bertenthal & Pinto, 1994). Further evidence of
global processing is that when stick figures of human walking are viewed through apertures, such
that the local motion is ambiguous, participants are able to identify it as a person, as they cannot
do for a car or a pair of scissors (Shiffrar, Lichtey, & Chatterjee, 1997). Integration across space
is essential for these abilities to be possible.
However, the local motion of dots in point-light displays can also contribute valuable
information, and this can be affected by inversion. Troje and Westhoff (2006) found that even
when the configuration of a point-light walker was completely disrupted by randomly relocating
the dot trajectories, observers could still judge the direction of walking, but only when the display
was presented in an upright orientation. This implies that there is a distinct inversion effect for

8
local motion features, unlike facial features, and therefore that there are at least two process at
work, one operating on local motion and one more globally. Chang and Troje (2009a) showed
participants pairs of dots following the same trajectories as feet, and there was an inversion effect
for judging the walking direction implied by these dots. The fact that visually-inexperienced baby
chicks show an interest in a scrambled point-light display of a hen, but not when it is inverted
(Vallortigara & Regolin, 2006) also suggests the existence of a local inversion effect. An
alternative type of local motion that may also play a role, but is not affected by inversion, is the
opponent motion signal that is created when two point-lights representing the hands or feet cross
each other in walking viewed from the side (Casile & Giese, 2005; Thurman & Grossman, 2008),
although the fact that scrambling the phase of the dots does not affect performance is an argument
against the importance of this feature (Troje & Westhoff, 2006).
Between these two scopes, that is, the whole walker or individual dot trajectories, there
are processes that operate on an intermediate scale, dealing with relations among groups of dots.
Structure-from-motion uses pairings of points to construct subconfigurations that could be
recognized on their own or built into larger figures. Pinto and Shiffrar (1999) found that when
groups of points representing limbs were randomly placed in a noise mask, they could still be
detected at about the same rate as intact point-light walkers, and were spontaneously described as
human figures (also see Neri, 2009). Movement of point-light limbs in isolation can portray
socially-relevant information, such as the emotion being portrayed by an actor performing a
drinking or knocking action, based only on dots representing the arm and head (Pollick, Paterson,
Bruderlin, & Sanford, 2001), or animacy and the type of gait from a small number of dots
representing only the legs and feet (Todd, 1983).
To identify the spatial distribution of information that is used in a direction
discrimination task, Thurman, Giese and Grossman (2010) employed ‘bubbles’, meaning spatial

9
and temporal samples of a display. The feet and arms were highlighted as particularly important,
specifically when they were crossing the midline (creating an opponent motion signal). However,
in a study which presented walkers in white noise and constructed classification images based on
performance on a forward-backward walking task, Lu and Liu (2006) came to the conclusion that
information from all of the point lights in the display contributed to performance. Besides the
difference in the tasks that were used, these differing conclusions may have been the result of
details of the mapping technique, since bubbles emphasize local features whereas classification
images emphasize holistic information.
From the studies described above, it is apparent that there is a double dissociation in the
displays that are capable of producing an impression of biological motion: some contain only
local motion information, while others contain only global information. This suggests multiple
processes, some of which have a narrow spatial focus while others integrate information across
the entire figure.
1.4 The role of knowledge
A third way to group biological motion perception processes is by the nature of the
knowledge they rely on. Structure-from-motion at first does not appear to require any knowledge
about the human body or its characteristic motion patterns, but promises to reconstruct any
piecewise-rigid object, with biological motion only representing an instance of such an object
(Cutting, 1981; Johansson, 1973, 1976). However upon further analysis, extra assumptions that
apply particularly to the human body were required to fully disambiguate a figure, such as the
fixed axis assumption (Webb & Aggarwal, 1982) or the planarity assumption (Hoffman &
Flinchbaugh, 1982). Although these are simple, bottom-up constraints, they represent domain-
specific knowledge.

10
More detailed knowledge is clearly required for certain demonstrated biological motion
abilities. People can recognize individuals by their walks as represented in point-lights (Cutting &
Kozlowski, 1977; Hill & Pollick, 2000; Loula, Prasad, Harber, & Shiffrar, 2005; Westhoff &
Troje, 2007), and short point-light animations are sufficient to portray gender (Barclay et al.,
1978; Kozlowski & Cutting, 1977; Mather & Murdoch, 1994; Troje, 2002) emotional state
(Clarke, Bradshaw, Field, Hampson, & Rose, 2005; Dittrich, Troscianko, Lea, & Morgan, 1996),
and even the intention to deceive (Runeson & Frykholm, 1983; Sebanz & Shiffrar, 2009). All
these abilities can be grouped under the heading of style recognition, and depend on complex,
top-down representations that are the product of experience, unlike structure-from-motion. This is
also true for the ability to determine the action category from point-light displays (Dittrich, 1993;
Johansson, 1976; Prasad & Shiffrar, 2009).
What form does the knowledge take that is used in style recognition and action
categorization? Some evidence suggests that it is a type of expert pattern recognition, as
described for face perception and other types of visual expertise, for example perception by
professional dog show judges of their specialist breed (Diamond & Carey, 1986). Detection of
point-light walkers in noise improves with practice (Grossman, Blake, & Kim, 2004) and visual
experience (Giese & Poggio, 2003), although this ability may be primed by the evolutionary
relevance of biological motion, since people have difficulty learning arbitrary motion patterns
(Hiris, Krebeck, Edmonds, & Stout, 2005; although see Jastorff, Kourtzi, & Giese, 2006). Only
experts in basketball could distinguish a real from a feigned pass (Sebanz & Shiffrar, 2009). Also
in common with other types of visual expertise, when motion style is exaggerated it is easier to
recognize the individual (Hill & Pollick, 2000) and the action category (Pollick, Fidopiastis, &
Braden, 2001).

11
However, there is reason to think that the knowledge that is used in interpreting local
biological motion trajectories is of a different nature, which is innate and evolutionarily old rather
than the product of learning. Movement of individual dots representing animal motion are
compelling to baby chicks with no previous visual experience (Vallortigara & Regolin, 2006;
Vallortigara, Regolin, & Marconato, 2005), and to human infants within the first few days of life
(Méary, Kitromilides, Mazens, Graff, & Gentaz, 2007; Simion, Regolin, & Bulf, 2008).
Processing of local motion also appears to not be affected by learning (Chang & Troje, 2009b).
This predisposition towards certain types of dynamics and visual stimuli resembles that found in
other domains, such as the result that infants preferentially gaze at face-like objects (Johnson,
Dziurawiec, Ellis, & Morton, 1991); the research on ‘core knowledge’ that infants have of
constraints on the motion of inanimate objects (Spelke, Breinlinger, Macomber, & Jacobson,
1992); and the finding that lab-raised rhesus monkeys could be conditioned to fear the sight of toy
snakes but not toy rabbits (Cook & Mineka, 1989).
This type of innate perceptual knowledge could be entirely in the form of bottom-up
perceptual filters for invariants in the local motion. These invariants would capture aspects of the
dynamics discussed in section 1.2, such as the influence of gravity, that correlate with the
presence of a legged, terrestrial animal, making it function as a ‘life detector’ (Johnson, 2006;
Troje & Westhoff, 2006). The body-based constraints that make structure-from-motion possible
could also be a case of this type of knowledge.
In summary, although knowledge is required for all biological motion processes, the form
of the knowledge that is used to accomplish certain tasks may be quite different, and may not
necessarily require learning.

12
1.5 A hierarchy of biological motion processing
Does biological motion perception depend more on motion or on form processing? Is it
more spatially localized or distributed? Is the knowledge it uses innate or acquired through
learning? The varying answers to these questions that different experiments have provided can be
reconciled by a framework in which there is not one phenomenon of biological motion
perception, but several, representing multiple underlying components. Each distinct biological
motion task calls on a different mixture of these components.
The results reviewed above suggest that there are at least five components (Troje, 2008),
which are more or less distinct and have different levels of reliance on motion, localization, and
innate knowledge:
1. Processing of local motion invariants: Purely motion-based; purely local; innate
knowledge.
2. Structure-from-motion: Motion-based; localized but not as much as the previous
component since it is based on relations between dots rather than single dot trajectories;
knowledge takes the form of limited constraints which may be innate or learned.
3. Figure-ground segregation: Motion-based; in the case of a scrambled walker mask,
dependent on global processing; both learned and innate knowledge may contribute.
4. Action categorization: Unknown whether it is more motion or more form-based; likely
more global than local; learned knowledge.
5. Style recognition: Both form and motion contribute; all levels of localization; learned
knowledge.
These components may be regarded as a hierarchy of processing levels. When a living
creature enters the visual field, the presence of invariants in the motion of their extremities (1.)

13
alerts the viewer and perhaps primes the other components. Then a structure-from-motion
mechanism (2.) recovers the form of the creature. Once the form is obtained, the motion can be
described in terms of the form, assisting in categorizing the action that is being executed (4.).
Subsequently the style of the action (5.) can be recognized based on the possibilities inherent in
the action category. Many of these components can also operate independently of each other, for
example recognizing style from local motion trajectories without recovering the structure
(Chouchourelou et al., 2006), but the output of earlier stages can assist in the judgments of later
stages. The transition between stage (4.) and (5.) resembles the hierarchy of object categorization
described by Rosch and colleagues (1976), in which objects are first categorized at their basic
level (in this case the action being performed, such as ‘dancing’), after which they can be
categorized at the subordinate level (the style of the action, an adverb such as ‘angrily’).
However, the local motion ‘life detector’ bypasses this system to provide superordinate category
information, that a living creature is present.
The purpose of the studies that make up this thesis is to better define the nature of the
processing hierarchy and its components. Chapter 2 assesses the specificity of the local motion
invariant detectors. Chapter 3 explores the localization of information in a style recognition task
compared to the lower level biological motion task of direction discrimination. Chapter 4
investigates the relations among the proposed components, using a battery of tests that assesses
individuals’ abilities on all these components in one session, making it possible to use individual
differences to test for dependencies.
1.6 Specificity of local motion invariant processing (Chapter 2)
Although the ability to extract information from local motion trajectories of point-light
displays is established, as well as the fact that the majority of local information about walking

14
direction is in the foot motion (Troje & Westhoff, 2006), it has not been clear how important the
details of the local motion are to activating this processing stage. What level of distortion can it
tolerate? This is a question of practical importance in the laboratory, since a type of point-light
display that has been in widespread use in biological motion psychophysics since its publication
(Cutting, 1978a, 1978b) has dot motion that is significantly different from motion-captured
walking. It is synthesized from pendular and sinusoidal functions that have been adjusted by eye
to resemble a walker, an approach that was criticized by Runeson (1994) as failing to capture
important features of real human motion.
Chapter 2 presents evidence that the local motion of this display lacks the characteristic
invariants that allow human observers to determine direction and other properties even when the
global structure is disrupted by scrambling. Participants were at chance for determining direction
from a scrambled walker prepared according to Cutting’s algorithm, whereas participants were
above chance for determining the direction of a scrambled walker derived from motion capture
recordings. However when the structure was intact, such that structure-from-motion or other
global processes would be capable of interpreting it, direction performance using Cutting’s
walker was equivalent to the more naturalistic stimulus, as was detection performance.
The conclusion from this study is that observers are sensitive to details of the local
motion when it is the primary source of information, and that the vertical acceleration of the feet
is likely part of the invariant since it is one of the most prominent differences between the two
types of displays. On the other hand, structure-from-motion does not appear to be as sensitive to
distortions in the local motion pattern. This contrast suggests two distinct processes with different
characteristics.

15
1.7 Localization of information for different components (Chapter 3)
The components that are engaged for different tasks differ in their degree of localization,
and for those that do not process the entire display in parallel it is useful to investigate which
regions contain the relevant information for a task. The identified regions are clues to how the
task is accomplished. Since different tasks emphasize different components of biological motion
perception, we would expect that attention will be differentially directed to the areas that are most
informative for the relevant component, and that this difference in attentional focus will be
reflected in eye fixations.
Chapter 3 investigates the localization of information in the display for different
components, by tracking participants’ gaze while they performed a direction task and a gender
task, with identical stimuli in both tasks. For the direction task, the typical viewer fixated more
frequently at the feet, which suggests that they were making use of the local motion invariants
there. By contrast, in the gender task there were relatively less concentration of fixations at the
feet and more fixations at the shoulders, which is congruent with previous research on diagnostic
regions of a point-light walker for determining gender.
1.8 Assessing biological motion perception components (Chapter 4)
The studies in chapters 2 and 3 are based on the assumption of separate components
involved in biological motion processing. Besides the distinct characteristics that are revealed in
those studies, such as the sensitivity of local motion processing to velocity features and the
different information sources used by local invariant extraction and style recognition, it was
necessary to further test the hypothesis of separate components and to develop methods to assess
them.

16
Chapter 4 introduces an online battery of psychophysical tests, called BMLtest, that
efficiently measures multiple components of an individual’s biological motion perception in the
same session. Literature is reviewed showing that many commonly used biological motion tasks
confound measurement of more than one of these underlying components, and this has led to
apparently conflicting results. The tests use tasks that are designed to measure the components as
independently as possible. Each of the levels described in section 1.5 has a corresponding test
based on point-light or stick figure stimuli, with two different style recognition tests: one that
assesses gender discrimination ability and one that assesses person recognition.
Besides providing a resource for future biological motion studies, in particular studies
characterizing the abilities of special populations, BMLtest can be used in individual differences
analyses to test for functional dependencies between processes. 65 young adults completed the
battery of tests. Since there were no significant correlations, it could be concluded that the
underlying constructs measured by each test were relatively disjoint.
The studies described in these chapters are situated within the framework of biological
motion perception as a hierarchy of processing components, and provide support for the
framework. Instead of using a single task to measure biological motion perception, assessments
should target a specific component, whether it is local motion invariant processing, structure-
from-motion, figure-ground segregation, action categorization or style recognition. These
processes differ in terms of their use of motion information, of global and local information, and
of learned or innate knowledge.

17
References
Aaen-Stockdale, C., Thompson, B., Hess, R. F., & Troje, N. F. (2008). Biological motion
perception is cue-invariant. Journal of Vision, 8(8), 1-11.
Aggarwal, J. K., & Cai, Q. (1999). Human motion analysis: A review. Computer Vision and
Image Understanding, 73(3), 428-440.
Ahlstrom, V., Blake, R., & Ahlstrom, U. (1997). Perception of biological motion. Perception,
26(12), 1539-1548.
Barclay, C. D., Cutting, J. E., & Kozlowski, L. T. (1978). Temporal and spatial factors in gait
perception that influence gender recognition. Perception & Psychophysics, 23(2), 145-
152.
Beintema, J. A., Georg, K., & Lappe, M. (2006). Perception of biological motion from limited-
lifetime stimuli. Perception & Psychophysics, 68(4), 613-624.
Beintema, J. A., & Lappe, M. (2002). Perception of biological motion without local image
motion. Proceedings of the National Academy of Sciences of the United States of
America, 99(8), 5661-5663.
Beintema, J. A., Oleksiak, A., & van Wezel, R. J. A. (2006). The influence of biological motion
perception on structure-from-motion interpretations at different speeds. Journal of Vision,
6(7), 712-726.
Bertenthal, B. I., & Pinto, J. (1994). Global processing of biological motions. Psychological
Science, 5(4), 221-225.
Bingham, G. P., Schmidt, R. C., & Rosenblum, L. D. (1995). Dynamics and the orientation of
kinematic forms in visual event recognition. Journal of Experimental Psychology:
Human Perception and Performance, 21(6), 1473-1493.

18
Bonda, E., Petrides, M., Ostry, D., & Evans, A. (1996). Specific involvement of human parietal
systems and the amygdala in the perception of biological motion. Journal of
Neuroscience, 16(11), 3737-3744.
Casile, A., & Giese, M. A. (2005). Critical features for the recognition of biological motion.
Journal of Vision, 5(4), 348-360.
Chang, D. H. F., & Troje, N. F. (2008). Perception of animacy and direction from local biological
motion signals. Journal of Vision, 8(5), 1-10.
Chang, D. H. F., & Troje, N. F. (2009a). Acceleration carries the local inversion effect in
biological motion perception. Journal of Vision, 1(9), 1-17.
Chang, D. H. F., & Troje, N. F. (2009b). Characterizing global and local mechanisms in
biological motion perception. Journal of Vision, 9(5), 1-10.
Chouchourelou, A., Matsuka, T., Harber, K., & Shiffrar, M. (2006). The visual analysis of
emotional actions. Social Neuroscience, 1(1), 63-74.
Clarke, T. J., Bradshaw, M. F., Field, D. T., Hampson, S. E., & Rose, D. (2005). The perception
of emotion from body movement in point-light displays of interpersonal dialogue.
Perception, 34(10), 1171-1180.
Cook, M., & Mineka, S. (1989). Observational conditioning of fear to fear-relevant versus fear-
irrelevant stimuli in rhesus monkeys. Journal of Abnormal Psychology, 98(4), 448-459.
Cutting, J. E. (1978a). Generation of synthetic male and female walkers through manipulation of
a biomechanical invariant. Perception, 7(4), 393-405.
Cutting, J. E. (1978b). Program to generate synthetic walkers as dynamic point-light displays.
Behavior Research Methods & Instrumentation, 10(1), 91-94.
Cutting, J. E. (1981). Coding theory adapted to gait perception. Journal of Experimental
Psychology: Human Perception and Performance, 7(1), 71-87.
19
Cutting, J. E., & Kozlowski, L. T. (1977). Recognizing friends by their walk: Gait perception
without familiarity cues. Bulletin of the Psychonomic Society, 9(5), 353-356.
Cutting, J. E., Moore, C., & Morrison, R. (1988). Masking the motions of human gait. Perception
& Psychophysics, 44(4), 339-347.
Diamond, R., & Carey, S. (1986). Why faces are and are not special: An effect of expertise.
Journal of Experimental Psychology: General, 115(2), 107-117.
Dittrich, W. H. (1993). Action categories and the perception of biological motion. Perception,
22(1), 15-22.
Dittrich, W. H., Troscianko, T., Lea, S. E. G., & Morgan, D. (1996). Perception of emotion from
dynamic point-light displays represented in dance. Perception, 25(6), 727-738.
Felleman, D. J., & Van Essen, D. C. (1991). Distributed hierarchical processing in the primate
cerebral cortex. Cerebral Cortex, 1(1), 1-47.
Freire, A., Lee, K., & Symons, L. A. (2000). The face-inversion effect as a deficit in the encoding
of configural information: Direct evidence. Perception, 29(2), 159-170.
Garcia, J. O., & Grossman, E. D. (2008). Necessary but not sufficient: Motion perception is
required for perceiving biological motion. Vision Research, 48(9), 1144-1149.
Giese, M. A., & Lappe, M. (2002). Measurement of generalization fields for the recognition of
biological motion. Vision Research, 42(15), 1847-1858.
Giese, M. A., & Poggio, T. (2003). Neural mechanisms for the recognition of biological
movements. Nature Reviews Neuroscience, 4(3), 179-192.
Grossman, E. D., & Blake, R. (1999). Perception of coherent motion, biological motion and form-
from-motion under dim-light conditions. Vision Research, 39(22), 3721-3727.
Grossman, E. D., Blake, R., & Kim, C. Y. (2004). Learning to see biological motion: Brain
activity parallels behavior. Journal of Cognitive Neuroscience, 16(9), 1669-1679.

20
Grossman, E. D., Donnelly, M., Price, R., Pickens, D., Morgan, V., Neighbor, G., et al. (2000).
Brain areas involved in perception of biological motion. Journal of Cognitive
Neuroscience, 12(5), 711-720.
Hill, H., & Pollick, F. E. (2000). Exaggerating temporal differences enhances recognition of
individuals from point light displays. Psychological Science, 11(3), 223-228.
Hiris, E., Krebeck, A., Edmonds, J., & Stout, A. (2005). What learning to see arbitrary motion
tells us about biological motion perception. Journal of Experimental Psychology: Human
Perception and Performance, 31(5), 1096-1106.
Hoffman, D. D., & Flinchbaugh, B. E. (1982). The interpretation of biological motion. Biological
Cybernetics, 42(3), 195-204.
Jastorff, J., Kourtzi, Z., & Giese, M. A. (2006). Learning to discriminate complex movements:
Biological versus artificial trajectories. Journal of Vision, 6(8), 791-804.
Johansson, G. (1973). Visual perception of biological motion and a model for its analysis.
Perception & Psychophysics, 14(2), 201-211.
Johansson, G. (1976). Spatio-temporal differentiation and integration in visual motion perception:
Experimental and theoretical analysis of calculus-like functions in visual data processing.
Psychological Research, 38(4), 379-393.
Johnson, M. H. (2006). Biological motion: A perceptual life detector? Current Biology, 16(10),
R376-R377.
Johnson, M. H., Dziurawiec, S., Ellis, H., & Morton, J. (1991). Newborns preferential tracking of
face-like stimuli and its subsequent decline. Cognition, 40(1-2), 1-19.
Jokisch, D., & Troje, N. F. (2003). Biological motion as a cue for the perception of size. Journal
of Vision, 3(4), 252-264.

21
Kozlowski, L. T., & Cutting, J. E. (1977). Recognizing sex of a walker from a dynamic point-
light display. Perception & Psychophysics, 21(6), 575-580.
Kuhlmann, S., de Lussanet, M. H. E., & Lappe, M. (2009). Perception of three-dimensional
biological motion from limited lifetime stimuli. Journal of Vision, 9(10), 1-14.
Lange, J., Georg, K., & Lappe, M. (2006). Visual perception of biological motion by form: A
template-matching analysis. Journal of Vision, 6(8), 836-849.
Lange, J., & Lappe, M. (2006). A model of biological motion perception from configural form
cues. Journal of Neuroscience, 26(11), 2894-2906.
Loula, F., Prasad, S., Harber, K., & Shiffrar, M. (2005). Recognizing people from their
movement. Journal of Experimental Psychology: Human Perception and Performance,
31(1), 210-220.
Lu, H. J., & Liu, Z. L. (2006). Computing dynamic classification images from correlation maps.
Journal of Vision, 6(4), 475-483.
Mather, G., & Murdoch, L. (1994). Gender discrimination in biological motion displays based on
dynamic cues. Proceedings of the Royal Society of London Series B: Biological Sciences,
258(1353), 273-279.
Mather, G., Radford, K., & West, S. (1992). Low-level visual processing of biological motion.
Proceedings of the Royal Society of London Series B: Biological Sciences, 249(1325),
149-155.
Maurer, D., Le Grand, R., & Mondloch, C. J. (2002). The many faces of configural processing.
Trends in Cognitive Sciences, 6(6), 255-260.
McLeod, P., Dittrich, W., Driver, J., Perrett, D., & Zihl, J. (1996). Preserved and impaired
detection of structure from motion by a “motion-blind” patient. Visual Cognition, 3(4),
363-391.
22
Méary, D., Kitromilides, E., Mazens, K., Graff, C., & Gentaz, E. (2007). Four-day-old human
neonates look longer at non-biological motions of a single point-of-light. PLoS ONE,
2(1), e186.
Michels, L., Lappe, M., & Vaina, L. M. (2005). Visual areas involved in the perception of human
movement from dynamic form analysis. Neuroreport, 16(10), 1037-1041.
Neri, P. (2009). Wholes and subparts in visual processing of human agency. Proceedings of the
Royal Society of London Series B: Biological Sciences, 276(1658), 861-869.
Pavlova, M., & Sokolov, A. (2000). Orientation specificity in biological motion perception.
Perception & Psychophysics, 62(5), 889-899.
Peelen, M. V., Wiggett, A. J., & Downing, P. E. (2006). Patterns of fMRI activity dissociate
overlapping functional brain areas that respond to biological motion. Neuron, 49(6), 815-
822.
Peuskens, H., Vanrie, J., Verfaillie, K., & Orban, G. A. (2005). Specificity of regions processing
biological motion. European Journal of Neuroscience, 21(10), 2864-2875.
Pinto, J., & Shiffrar, M. (1999). Subconfigurations of the human form in the perception of
biological motion displays. Acta Psychologica, 102(2-3), 293-318.
Pollick, F. E., Fidopiastis, C., & Braden, V. (2001). Recognising the style of spatially exaggerated
tennis serves. Perception, 30(3), 323-338.
Pollick, F. E., Paterson, H. M., Bruderlin, A., & Sanford, A. J. (2001). Perceiving affect from arm
movement. Cognition, 82(2), B51-B61.
Poppe, R. (2010). A survey on vision-based human action recognition. Image and Vision
Computing, 28(6), 976-990.
Prasad, S., & Shiffrar, M. (2009). Viewpoint and the recognition of people from their movements.
Journal of Experimental Psychology: Human Perception and Performance, 35(1), 39-49.

23
Rosch, E., Mervis, C. B., Gray, W. D., Johnson, D. M., & Boyesbraem, P. (1976). Basic objects
in natural categories. Cognitive Psychology, 8(3), 382-439.
Runeson, S. (1994). Perception of biological motion: The KSD-principle. In G. Jansson, S. S.
Bergstrom & W. Epstein (Eds.), Perceiving Events and Objects (pp. 383-405). Hillsdale,
NJ: Lawrence Erlbaum Associates.
Runeson, S., & Frykholm, G. (1983). Kinematic specification of dynamics as an informational
basis for person-and-action perception: Expectation, gender recognition, and deceptive
intention. Journal of Experimental Psychology: General, 112(4), 585-615.
Santi, A., Servos, P., Vatikiotis-Bateson, E., Kuratate, T., & Munhall, K. (2003). Perceiving
biological motion: Dissociating visible speech from walking. Journal of Cognitive
Neuroscience, 15(6), 800-809.
Searcy, J. H., & Bartlett, J. C. (1996). Inversion and processing of component and spatial-
relational information in faces. Journal of Experimental Psychology: Human Perception
and Performance, 22(4), 904-915.
Sebanz, N., & Shiffrar, M. (2009). Detecting deception in a bluffing body: The role of expertise.
Psychonomic Bulletin & Review, 16(1), 170-175.
Sekuler, A. B., Gaspar, C. M., Gold, J. M., & Bennett, P. J. (2004). Inversion leads to
quantitative, not qualitative, changes in face processing. Current Biology, 14(5), 391-396.
Shiffrar, M., Lichtey, L., & Chatterjee, S. H. (1997). The perception of biological motion across
apertures. Perception & Psychophysics, 59(1), 51-59.
Shipley, T. F. (2003). The effect of object and event orientation on perception of biological
motion. Psychological Science, 14(4), 377-380.

24
Simion, F., Regolin, L., & Bulf, H. (2008). A predisposition for biological motion in the newborn
baby. Proceedings of the National Academy of Sciences of the United States of America,
105(2), 809-813.
Spelke, E. S., Breinlinger, K., Macomber, J., & Jacobson, K. (1992). Origins of knowledge.
Psychological Review, 99(4), 605-632.
Sumi, S. (1984). Upside-down presentation of the Johansson moving light-spot pattern.
Perception, 13(3), 283-286.
Tanaka, J. W., & Farah, M. J. (1993). Parts and wholes in face recognition. Quarterly Journal of
Experimental Psychology Section a-Human Experimental Psychology, 46(2), 225-245.
Thirkettle, M., Benton, C. P., & Scott-Samuel, N. E. (2009). Contributions of form, motion and
task to biological motion perception. Journal of Vision, 9(3), 1-11.
Thompson, J. C., Clarke, M., Stewart, T., & Puce, A. (2005). Configural processing of biological
motion in human superior temporal sulcus. The Journal of Neuroscience, 25(39), 9059-
9066.
Thornton, I. M., Rensink, R. A., & Shiffrar, M. (2002). Active versus passive processing of
biological motion. Perception, 31(7), 837-853.
Thurman, S. M., Giese, M. A., & Grossman, E. D. (2010). Perceptual and computational analysis
of critical features for biological motion. Journal of Vision, 10(12), 1-14.
Thurman, S. M., & Grossman, E. D. (2008). Temporal ‘bubbles’ reveal key features for point-
light biological motion perception. Journal of Vision, 8(3), 1-11.
Todd, J. T. (1983). Perception of gait. Journal of Experimental Psychology: Human Perception
and Performance, 9(1), 31-42.
Troje, N. F. (2002). Decomposing biological motion: A framework for analysis and synthesis of
human gait patterns. Journal of Vision, 2(5), 371-387.

25
Troje, N. F. (2008). Retrieving information from human movement patterns. In T. F. Shipley & J.
M. Zacks (Eds.), Understanding Events: How Humans See, Represent, and Act on Events
(pp. 308-334). New York: Oxford University Press.
Troje, N. F., & Westhoff, C. (2006). The inversion effect in biological motion perception:
Evidence for a ‘life detector’? Current Biology, 16(8), 821-824.
Ullman, S. (1979). Interpretation of structure from motion. Proceedings of the Royal Society of
London Series B: Biological Sciences, 203(1153), 405-426.
Vaina, L. M., Lemay, M., Bienfang, D. C., Choi, A. Y., & Nakayama, K. (1990). Intact
‘biological motion’ and ‘structure from motion’ perception in a patient with impaired
motion mechanisms: A case study. Visual Neuroscience, 5(4), 353-369.
Vaina, L. M., Solomon, J., Chowdhury, S., Sinha, P., & Belliveau, J. W. (2001). Functional
neuroanatomy of biological motion perception in humans. Proceedings of the National
Academy of Sciences of the United States of America, 98(20), 11656-11661.
Valentine, T. (1988). Upside-down faces: A review of the effect of inversion upon face
recognition. British Journal of Psychology, 79, 471-491.
Vallortigara, G., & Regolin, L. (2006). Gravity bias in the interpretation of biological motion by
inexperienced chicks. Current Biology, 16(8), R279-R280.
Vallortigara, G., Regolin, L., & Marconato, F. (2005). Visually inexperienced chicks exhibit
spontaneous preference for biological motion patterns. PLoS Biology, 3(7), 1312-1316.
Webb, J. A., & Aggarwal, J. K. (1982). Structure from motion of rigid and jointed objects.
Artificial Intelligence, 19(1), 107-130.
Westhoff, C., & Troje, N. F. (2007). Kinematic cues for person identification from biological
motion. Perception & Psychophysics, 69(2), 241-253.

26
Young, A. W., Hellawell, D., & Hay, D. C. (1987). Configurational information in face
perception. Perception, 16(6), 747-759.
27
Chapter 2
Specificity of local motion invariant processing1
2.1 Introduction
Humans have a striking ability to detect and extract information from the motion of living
creatures. A major tool to study biological motion was introduced into visual psychology by
Johansson (1973). His point-light displays, which consist of only a few dots moving along with
the major joints of a human in motion, elicit a clear percept of actor and action without being
confounded with other cues, such as clothing or facial information. The ease with which the
human visual system retrieves information from these degraded displays reflects a number of
different processing levels. Troje (2008a) has suggested that the complex phenomenology of
biological motion perception can only be understood if we carefully distinguish between two
different processes in particular. One uses local motion signals directly, in particular for tasks
such as detecting the presence of an animal or inferring its orientation, while another integrates
the articulated motion of a body to infer its structure and how that structure deforms over time.
The majority of work in the field of biological motion perception has focused on this
second process. Early studies proposed models for how hierarchical structures of limbs and joints
could be determined by subtracting motion trajectories from one another (Cutting, 1981;
Johansson, 1973, 1976). Later it was shown that the global form can be recovered even when the
local motion of the dots is rendered entirely uninformative. Point-light displays of walking human
figures can still be detected, at least to some degree, when masked by randomly displaced copies
1 This chapter is reprinted with permission from “Off on the wrong foot: Local features in biological motion” by D. R. Saunders, J. Suchan, and N. F. Troje, 2009. Perception, 38(4), 522-532. Copyright 2009 by Pion Limited, London.
28
of the motion of the dots making it up (Cutting, Moore, & Morrison, 1988), indicating that the
global form is sufficient for detection. On the other hand, this ‘scrambled walker mask’ did prove
to be a much more effective mask than any of the other types of masks used in the study. The loss
of local motion as a cue to the presence of a walker caused a substantial decrease in performance,
suggesting that it does play an important role.
Further experiments with the scrambled walker mask showed that the global structure of
the point-light display is sufficient to determine the direction of walking, and to show the
pronounced inversion effect that seems to be characteristic of biological motion processing
(Bertenthal & Pinto, 1994). Similar results were observed when local motion patterns were
eliminated in a different way, namely by randomly repositioning the dots on the body in every
frame of a motion sequence (Beintema, Georg, & Lappe, 2006; Beintema & Lappe, 2002; Neri,
Morrone, & Burr, 1998).
In contrast to this emphasis on deriving the global, articulated structure from the point-
light display, some researchers have asked whether there might be valuable information used by
the visual system in the local motion alone. Mather, Radford and West (1992) tested performance
on a direction task (asking participants whether the walker was facing left or right) when sets of
dots were removed from the point-light display. Removal of shoulder and hip dots, or elbow and
knee dots, had no effect on performance (which was approximately 90% correct), but removing
the wrist and ankle dots while leaving all other dots resulted in a reduction of performance to
near-chance levels. Troje and Westhoff (2006) also found evidence that motion of the extremities
is important in biological motion perception. However, while the stimuli used by Mather et al.
(1992) still retained most of the coherence of their shape, Troje and Westhoff used spatially
scrambled walkers in their study which entirely lacked coherent global form. They found that
even though observers had no idea what kind of creature they were seeing, they had a clear

29
percept of facing direction – but only if the displays were shown in upright orientation. A
subsequent experiment showed that this inversion effect was dependent only on the orientation of
the trajectory of the ankle dots, while no effect resulted from inverting any of the other
trajectories. The results were not limited to human motion but were also obtained with point-light
displays derived from a walking pigeon and from a walking cat.
Troje and Westhoff (2006) suggested that cues contained in the local motion of an
animal’s feet may play a role as a general detection system that signals the presence of a
terrestrial, articulated animal in the visual environment (see also Johnson, 2006). They
hypothesized that such a system might be evolutionary old and possibly innate rather than being
based on individual learning. Some evidence for this idea has since been demonstrated. For
instance, Vallortigara and Regolin (2006) have shown that newborn chicks already respond
preferentially to upright, but not to inverted, biological motion, but that the particular shape of the
point-light animal (cat or chicken, coherent or scrambled) has no effect on this preference
behaviour (Vallortigara, Regolin, & Marconato, 2005). Simion and colleagues (2008) have shown
that 2-day-old human neonates also prefer upright biological motion over inverted biological
motion. They used point-light displays of chicks, and therefore a shape which is probably as
meaningless to a 2-day-old infant, as a scrambled display. Finally, Chang and Troje (2008)
showed that adult observers consistently rated scrambled point-light displays (of humans, pigeons
and cats) as more animate when presented upright rather than inverted.
In all these studies, observers responded either to scrambled biological motion, or to
biological motion carried by structures they are entirely unfamiliar with. All they could use was
the local motion of the trajectories of individual dots, most likely the dots representing the feet.
Since such local motion alone can specify the direction of walking, affect the impression of
animacy, and control preference behaviour of chicks and human neonates, we must consider the

30
processing of local motion signals as an essential component of biological motion perception.
Destroying the structure by spatially scrambling the walker cannot therefore be considered a
means to eliminate the biological aspect of the motion, as has been assumed in many
psychophysical studies (e.g. Fujimoto, 2003; Thornton, Pinto, & Shiffrar, 1998; Verfaillie, 2000)
and functional imaging studies (e.g. Vaina, Solomon, Chowdhury, Sinha, & Belliveau, 2001).
One reason why the important role of local motion has been overlooked for a long time
relates to the way many researchers in the field have generated their biological motion stimuli. In
1978, James Cutting published a paper in which he described a simple algorithm that would
create a point-light display of a human walking in sagittal view. He was inspired by work in
speech recognition that involved synthesizing auditory stimuli to determine which features
produce a particular judgment in the listener about what phoneme they are hearing, and wanted to
create a point-light stimulus that could be manipulated in a similarly principled way. Using his
walker stimulus, Cutting showed that changing the synthesized relative motion of the hips and
shoulders affected observers’ judgment of the gender of the figure, providing evidence for the
earlier conjecture (Kozlowski & Cutting, 1977) that the center of moment is the critical invariant
which discriminates between male and female walking. Cutting’s walker was a breakthrough for
biological motion research because allowed for both ease of generation of biological motion
displays in laboratories around the world and for unprecedented control over the spatial and
temporal characteristics of the display. The walker was generated by a FORTRAN program
which animated each of the 13 dots with some combination of ellipsoid and pendular motion,
defined within the hierarchical organization of an articulated body. The trajectories of shoulders
and hips were modeled as simple ellipses, while the elbow and knee motions were modeled as
pendulums with the motion of the shoulders and hips, respectively, added to them. He
qualitatively compared the resulting motion pattern to existing knowledge about human gait
31
(Murray, 1967), but the final parameter settings were chosen by eye. Many important results have
been established with this display, and even 30 years after its publication Cutting’s walker is still
widely used (e.g. Hiris, 2007; Lange & Lappe, 2007; Neri et al., 1998; Saygin, Driver, & de Sa,
2008; Thornton & Vuong, 2004).
However, while the general shape of Cutting’s synthetic walker resembles point-light
displays derived directly from human walking, it differs in important ways from recordings of
real human motion, particularly in the critical invariants contained in the kinematics of the feet
(see Figure 2.3). Runeson (1994), among others, warned that such synthesized displays may be
missing information about dynamics, in particular the effect of gravity and the ways the
organism’s musculoskeletal system responds to it. Given the role that the feet seem to play
(Mather et al., 1992; Troje & Westhoff, 2006), we expect that these differences seriously affect
the invariants in the local motion that convey direction and animacy in more natural displays. We
assume that the wide usage of Cutting’s walker is also the reason why the presence of these cues
in normal scrambled biological motion displays was overlooked for such a long time.
In the first experiment of the present study, we compare the performance of human
observers in a direction discrimination experiment between Cutting’s walker and a walking
display derived from recorded human motion, which we will refer to as the BML
(BioMotionLab) walker (Troje, 2008b). Both coherent and scrambled versions of the walkers
were used, but the critical condition is the one in which scrambled walkers are presented and so
decisions must be based entirely on local motion cues.
Whereas in the first experiment we presented local motion without global motion, in the
second experiment we chose a paradigm that makes available global motion but not local motion.
Specifically, we employed a detection task, with coherent versions of the walkers embedded in a

32
mask made of scrambled walkers. Differences as to the presence of the critical cues in the local
motion should only affect Experiment 1, and, specifically, the condition in which scrambled
walkers are used.
2.2 Methods
2.2.1 Participants
Twelve people participated in the experiment (four male, eight female, age 17-44 years,
mean = 20.2 years), all had normal or corrected-to-normal vision. All but one subject had no
experience with biological motion and point-light stimuli, and all were naïve with regard to the
purpose of the study. All but one were undergraduate students at Queen’s University. They
received course credit for their participation.
2.2.2 Stimuli
Displays consisted of point-light walkers presented in the center of a 17-inch CRT
monitor, operated with a 100 Hz refresh rate. Each point-light display subtended 6° of visual
angle vertically, with the observer’s viewing distance fixed at 80 cm by means of a chinrest. The
displays consisted of 11 white dots on a black background representing a sagittal view of the
head, elbows, wrists, knees, and ankles, as well as one shoulder and one hip, of a human walking
without forward displacement, as if on a treadmill. Gait frequency was 0.93 Hz.
Scrambled walkers were produced by subtracting from each trajectory its mean position,
and then adding to it a random constant position which would place it within a rectangular range
of 4° × 6° of visual angle. In addition, the trajectory was also randomly offset in time. The result
was that the local motion of each dot’s trajectory remained unchanged, while its position within
the display and its temporal phase with respect to the other dots was randomized.
33
Two different masks were used. The scrambled mask was based on a similar technique
used to create the scrambled walker. The only difference was that depending on the required
number of masking dots, multiple copies of the scrambled walker were used, and the dots
comprising these walkers were randomly distributed over a rectangular range of 9.6° × 9.6° of
visual angle. Scrambled masks were always made from the same walker (BML walker or Cutting
walker) they were intended to mask. The random dot mask was produced by randomly placing
stationary dots within this 9.6° × 9.6° mask area. Each dot was displayed for 300 ms at a given
location, after which it disappeared and then reappeared elsewhere.
The point-light walkers were generated by two different methods.
Cutting’s walker. The animation of Cutting’s walker was created following the
algorithm published in Cutting (1978).
The BML walker. The BML walker was produced from the walks of 50 women and 50
men obtained by means of a motion capture system. Participants were instructed to walk at a
normal pace in a straight line for several steps. Each participant had 41 reflective markers
attached to his or her body, which were tracked in 3-D space by an array of nine high-speed (120
Hz) cameras making up part of a motion capture system (Vicon 512, Oxford Metrics). A
biomechanical model of the human body was then applied to estimate the movement over time of
13 ‘virtual markers’ located inside the body. They included the joint centers of the shoulders,
elbows, wrists, hips, knees, and ankles, as well as the center of the head. One of the shoulder and
one of the hip points were discarded, resulting in an 11-dot display with each point corresponding
to a point in Cutting’s walker. The forward component of the movement was subtracted. Each
trajectory was then transformed into a discrete Fourier expansion. All but the average position
and the first two harmonics, which together represented 98% of the variance, were discarded,

34
resulting in a smoothed, continuous walking loop. The final BML walker was obtained by
averaging these Fourier representations over all 100 individuals (for details see Troje, 2002,
2008b).
2.2.3 Procedure
All participants completed both the detection task and the direction task in two separate
blocks. The order of the two experiments was counterbalanced, so that half of the participants
started with the direction task first and the other half started with the detection task. Before each
experiment participants read the instructions and then completed several practice trials to get
familiar with each task.
Direction task. In each trial either the BML walker or Cutting’s walker was displayed
facing to the left or to the right. The walker was either presented in its coherent shape or was
scrambled. We included trials with coherent walkers to make the task more rewarding for our
participants. The critical condition, however, was the one employing scrambled biological motion
in which only local motion cues can be used to solve the task.
In all cases, walkers were embedded in a random-dot mask consisting of 50, 200, or 750
dots. Participants were instructed to press the left or the right arrow key as quickly as possible to
indicate the direction in which the walkers seemed to face. Each trial was shown until a key was
pressed, or until a maximum duration of 1 s. Between trials, the screen remained blank for 1 s. No
feedback was provided. There were 20 repetitions for each cell in our design, resulting in a total
of 240 trials (2 walkers × 2 directions × 3 mask densities × 20 repetitions).
Detection task. A two-alternative forced-choice design was used. Each trial consisted of
a pair of displays shown sequentially. Each display was presented for 1 s and contained a
scrambled walker mask with 50, 100, or 250 masking dots. In addition, either the first or second

35
interval also contained a coherent walker – either the BML walker or Cutting’s walker. Walkers
were shown in sagittal view, facing randomly either to the left or to the right. Participants pressed
the left arrow key to indicate that the walker was in the first interval, or the right arrow key to
indicate the second interval. There were 20 repetitions for each condition, for a total of 240 trials
(2 walkers × 2 intervals × 3 mask densities × 20 repetitions).
2.3 Results
2.3.1 Direction task
The results of this task are shown in Figure 2.1. For coherent walkers, direction errors were low
and similar between the two walker types. For scrambled walkers, direction errors were generally
higher. In this condition, performance with Cutting’s walker was at chance, while error rates fell
below chance level for the BML walker. Mask density seemed to affect the coherent walkers
much more than the scrambled versions. A three-way repeated-measures ANOVA conducted on
error rates confirmed these observations. It showed significant main effects of walker type,
50 200 750
Number of masking dots
BMLCutting
00.1
0.20.30.4
0.50.6
50 200 750
Number of masking dots
Erro
r rat
e
A B
Figure 2.1. Mean error rates across twelve participants for the direction task. A) The BML walker and Cutting’s walker presented unscrambled; B) the BML walker and Cutting’s walker presented spatially scrambled. In the unscrambled, 50-masking-dot BML condition, all participants had an error rate of 0. In all conditions the masks consisted of static, limited-lifetime dots. The error bars represent ±1 SEM.

36
F(1, 11) = 15.92, p < .01, scrambling, F(1, 11) = 303.26, p < .001, and mask density,
F(2, 22) = 11.31, p < .001. There was also a significant interaction between walker type and
walker scrambling, F(1, 11) = 9.56, p < .05, and a significant interaction between scrambling and
mask density, F(2, 22) = 4.13, p < .05. All other interactions were non-significant. A simple main
effects analysis was conducted to assess the effect of walker type within the scrambled walker
and coherent walker conditions. There was no significant difference between walker types in the
coherent condition, F(1, 11) = 0.44, p = .52, but there was a significant difference between walker
types in the scrambled condition, F(1, 11) = 16.02, p < .01, confirming that the scrambled BML
walker still retained information about its facing direction while Cutting’s walker did not. A one-
sample t test was conducted for Cutting’s walker within the scrambled condition. The average
error rate was not significantly different from 50%, t(11) = 0.84, p = .42. The interaction between
walker scrambling and number of masking dots was due to a significant simple main effect of
number of masking dots within the coherent walker condition, F(2, 22) = 32.54, p < .001, but
there was no effect of number of masking dots in the scrambled walker condition,
F(2, 22) = 2.36, p = .118. The same pattern of results was seen in a three-way repeated-measures
ANOVA performed on d′ values (significant effects of walker type, walker scrambling, and
number of masking dots, with an interaction between walker type and walker scrambling,
F(1, 11) = 7.98, p < .05, as well as between walker scrambling and number of masking dots,
F(2, 22) = 6.18, p < .01, with the average d′ for the scrambled Cutting walker not significantly
different from 0, t(11) = 0.86, p = .41).
2.3.2 Detection task
The results of this task are shown in Figure 2.2. Larger numbers of masking dots caused
more errors, but there was no difference between the BML walker and Cutting’s walker. A two-
way ANOVA conducted on error rate confirms this observation. There was a significant effect of

37
0
0.1
0.2
0.3
0.4
0.5
0.6
50 100 200
Number of masking dots
Erro
r rat
e
BMLCutting
Figure 2.2. Mean error rates across twelve participants for the detection task. Coherent versions of either Cutting’s walker or the BML walker were presented in a scrambled dot mask. The error bars represent ±1 SEM.
number of masking dots, F(2, 22) = 28.55, p < .001, but no other main effect or interaction. The
same pattern of results was seen in a two-way repeated-measures ANOVA performed on d′
values (effect of masking dots, F(2, 22) = 28.89, p < .001, effect of walker type, F(1, 11) = 0.02,
p = .89)
2.4 Discussion
Our results demonstrate that Cutting’s (1978) walker lacks the cues that signal facing
direction in scrambled displays derived from recordings of natural locomotion patterns such as
the BML walker. Performance on the detection task, where only the global shape was available to
identify the presence of the walkers, did not differ between the walker types.
What are the differences between the walker types that account for the differences in
performance? The most obvious differences are in the feet (as represented by the ankles in the
motion capture recordings), which Troje and Westhoff’s (2006) findings suggest are the principal
carriers of direction information. A plot of the trajectory of the ankle (Figure 2.3) shows the

38
-0.4 0 0.40
0.3
Ankle horizontal (m)Ankl
e ve
rtica
l (m
)0
0.3
-0.4 0 0.40
0.3
-0.4 0 0.4 -0.4 0 0.4
Ankl
e ve
rtica
l (m
)
Ankle horizontal (m)
A
-0.4 0 0.40
0.3
Ankle horizontal (m)Ankl
e ve
rtica
l (m
)B C
-0.4 0 0.4-0.4 0 0.40
0.3
Ankle horizontal (m)Ankl
e ve
rtica
l (m
)0
0.3
-0.4 0 0.40
0.3
-0.4 0 0.4 -0.4 0 0.4
Ankl
e ve
rtica
l (m
)
Ankle horizontal (m)
A
-0.4 0 0.4-0.4 0 0.40
0.3
Ankle horizontal (m)Ankl
e ve
rtica
l (m
)B C
Figure 2.3. Plots of the trajectory of the ankle movement of a walker seen in sagittal view and facing to the right. Overall forward displacement was subtracted, leading to a treadmill-like display. A) The ankle trajectories of six randomly selected recordings from the database used to generate the BML walker. B) The ankle trajectory of the BML walker. C) The ankle trajectory of Cutting’s walker.
similarity between the foot movement of the BML walker and that obtained from typical motion
capture recordings. The feet of Cutting’s walker have several differences visible in this figure.
Where the feet of the BML and the real walkers are stopped abruptly by the ground, the foot of
Cutting’s walker appears to extend slightly below the ground. The Cutting foot lacks at
least in part the horizontal asymmetry of the teardrop shape of the real foot movement, and
assumes a more symmetrical shape, almost approaching a horizontal figure eight. Examining the
vertical component of the movement alone, a plot of position, velocity and acceleration over time
(Figure 2.4) reveals more differences. During the swing phase, the feet of Cutting’s walker
decelerate less sharply and for a longer duration. The longer deceleration of Cutting’s walker also
reflects a longer relative duration of the swing phase within the gait cycle.
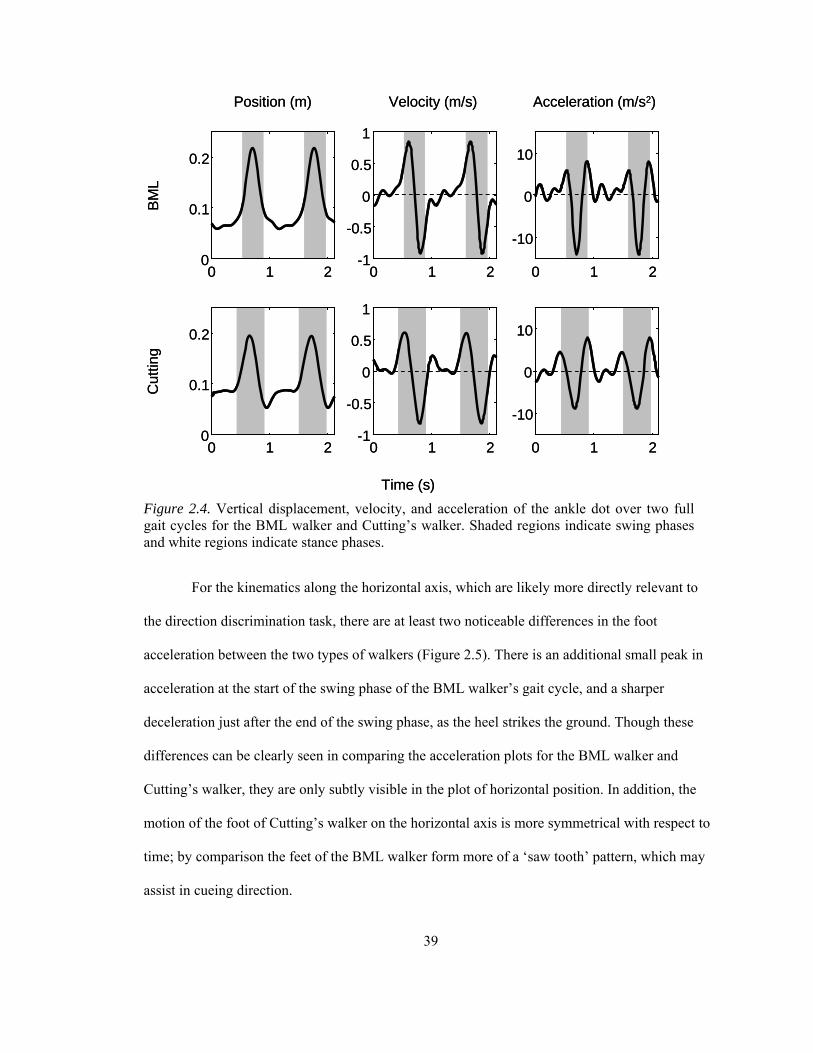
39
Position (m) Velocity (m/s) Acceleration (m/s2)
Time (s)
Cut
ting
BML
For the kinematics along the horizontal axis, which are likely more directly relevant to
the direction discrimination task, there are at least two noticeable differences in the foot
acceleration between the two types of walkers (Figure 2.5). There is an additional small peak in
acceleration at the start of the swing phase of the BML walker’s gait cycle, and a sharper
deceleration just after the end of the swing phase, as the heel strikes the ground. Though these
differences can be clearly seen in comparing the acceleration plots for the BML walker and
Cutting’s walker, they are only subtly visible in the plot of horizontal position. In addition, the
motion of the foot of Cutting’s walker on the horizontal axis is more symmetrical with respect to
time; by comparison the feet of the BML walker form more of a ‘saw tooth’ pattern, which may
assist in cueing direction.
Figure 2.4. Vertical displacement, velocity, and acceleration of the ankle dot over two fullgait cycles for the BML walker and Cutting’s walker. Shaded regions indicate swing phasesand white regions indicate stance phases.
0 1 20
0.1
0.2
1
0 1 2-1
-0.5
0
0.5
0 1 2
-10
0
10
0 1 20
0.1
0.2
0 1 2-1
-0.5
0
0.5
1
0 1 2
-10
0
10
Position (m) Velocity (m/s) Acceleration (m/s2)
Time (s)
Cut
ting
BML
0 1 20
0.1
0.2
1
0 1 2-1
-0.5
0
0.510
0
-10
0 1 2
0 1 20
0.1
0.2
1
0 1 2-1
-0.5
0
0.510
0
-10
0 1 2

40
These differences in the kinematics along both the vertical and the horizontal axes are
particularly relevant in light of the recent finding by Chang and Troje (2009) that the pattern of
acceleration plays a key role in determining the direction of feet motion in isolation. They showed
that the apparent facing direction of a point-light display consisting of feet motion only (of the
BML walker, but also from point light displays of other animals) could be determined from only
brief segments of the motion of the two ankle dots, and that this ability was hampered when the
dot motion was presented upside down. However, when the characteristic acceleration profile was
removed by replacing the motion with a constant-velocity tracing of the same trajectory, there
was no longer an effect of inversion on performance. They concluded that observers make use of
the characteristic pattern of acceleration which the feet follow as the walker responds to gravity in
Figure 2.5. Horizontal displacement, velocity, and acceleration of the ankle dot over two fullgait cycles for the BML walker and Cutting’s walker. Shaded regions indicate swing phases and white regions indicate stance phases.
Position (m) Velocity (m/s) Acceleration (m/s2)
Time (s)
Cut
ting
BML
0 1 2-0.4
-0.2
0
0.2
0.4
0 1 2-4
-2
0
2
4
0 1 2-30
-15
0
15
30
0 1 2-0.4
-0.2
0
0.2
0.4
0 1 2-4
-2
0
2
4
0 1 2-30
-15
0
15
30
Position (m) Velocity (m/s) Acceleration (m/s2)
Time (s)
Cut
ting
BML
0 1 2-0.4
-0.2
0
0.2
0.4 4
0 1 2-4
-2
0
2
30
15
0
-15
0-30
1 2
0 1 2-0.4
-0.2
0
0.2
0.4 4
0 1 2-4
-2
0
2
0 1
30
15
0
-15
-302

41
an energy efficient way. From the present results, it appears that at least some of the features that
characterize the typical acceleration profile of a natural foot are missing in Cutting’s walker.
Johansson (1976) first demonstrated the sensitivity of the human visual system to
deviations from normal biological motion, finding that all of his observers could tell that a point-
light display was produced by a puppet rather than by a person in less than 500 ms. Runeson and
Frykholm (1983) showed that observers can derive the true weight of a box by seeing it lifted,
even if the lifter tries to deceive the observer by acting as though the box is heavier or lighter than
it actually is. Runeson (1994) argued that to ensure point-light displays contain all the
information that may be perceptually relevant, recordings of real motion should be used, and “we
must require that even its finer details are intact.” (p. 392) He pointed out that Cutting’s walker
has “no involvement of dynamic factors such as mass, elasticity, energetic processes, or neural
mechanisms, nor are any of the law of motion taken into account.” (p. 392)
The finding that direction of the scrambled walker could be determined for the BML
walker but not for Cutting’s walker may explain a discrepancy between two previous results.
Troje and Westhoff (2006) found a 64% accuracy, significantly above chance, for the direction
task using the scrambled walker masked by random flickering dots, whereas Lange and Lappe
(2007) found that participants in their study viewing a scrambled walker display did not perform
significantly better than chance on the direction task. Troje and Westhoff used the BML walker to
generate its point-light display, while Lange and Lappe used Cutting’s walker.
Increasingly, biological motion perception studies use motion-capture-derived stimuli
(e.g. Ikeda, Blake, & Watanabe, 2005; Jastorff, Kourtzi, & Giese, 2006) as this technology
becomes more accessible. New techniques other than conversion to a point-light display are also
being explored for controlling the non-motion cues in a scene (e.g. Kuhlmann & Lappe, 2006).

42
However, there is still a large body of research which is based on Cutting’s walker. For most of
these studies, Cutting’s walker is probably an appropriate approximation. In particular, it can be
used to study the mechanisms underlying perceptual organization of the individual dots into a
coherent shape. However in other cases, the use of Cutting’s walker may have produced results
different from the ones a real walker would have revealed. Caution needs to be exercised
particularly in experiments in which a scrambled walker is used as a ‘non-biological’ control
stimulus in order to eventually conclude that a phenomenon must be based exclusively on
coherent structure rather than on local information. For instance, Fujimoto and Yagi (2008)
showed that a coherent walker induces apparent motion in a flickering background, but a
scrambled walker does not. The difference between the two displays is certainly the presence
versus the absence of coherent shape, and it can therefore be concluded that coherent shape is
able to induce background motion. However, from this experiment it cannot be excluded that
information in the local motion (for instance, of the feet) could also induce background motion.
Other examples of experiments that follow a logic that is potentially vulnerable to the particular
kind of walker used are the work of Thornton and Vuong (2004) on the effect of coherent and
scrambled flanker stimuli, and the work of Saygin, Driver, and de Sa (2008) on sensitivity to
audio-visual asynchrony in point-light displays.
Further studies will investigate in detail which aspects of the motion of the extremities
are used to determine direction, and what role they play in detection of biological motion, in
biological motion perception in the visual periphery, and in perception of animacy. Our
conclusion from the present study is that Cutting’s (1978) walker differs in systematic and
perceptually relevant ways from real human motion. Invariants contained in the local motion
alone, without the possibility of deriving structure from the display, can play an important role in

43
perception of biological motion, but this role may not be detected in experiments that employ
Cutting’s walker since it does not represent these invariants realistically.
44
References
Beintema, J. A., Georg, K., & Lappe, M. (2006). Perception of biological motion from limited-
lifetime stimuli. Perception & Psychophysics, 68(4), 613-624.
Beintema, J. A., & Lappe, M. (2002). Perception of biological motion without local image
motion. Proceedings of the National Academy of Sciences of the United States of
America, 99(8), 5661-5663.
Bertenthal, B. I., & Pinto, J. (1994). Global processing of biological motions. Psychological
Science, 5(4), 221-225.
Chang, D. H. F., & Troje, N. F. (2008). Perception of animacy and direction from local biological
motion signals. Journal of Vision, 8(5), 1-10.
Chang, D. H. F., & Troje, N. F. (2009). Acceleration carries the local inversion effect in
biological motion perception. Journal of Vision, 1(9), 1-17.
Cutting, J. E. (1978). Generation of synthetic male and female walkers through manipulation of a
biomechanical invariant. Perception, 7(4), 393-405.
Cutting, J. E. (1981). Coding theory adapted to gait perception. Journal of Experimental
Psychology: Human Perception and Performance, 7(1), 71-87.
Cutting, J. E., Moore, C., & Morrison, R. (1988). Masking the motions of human gait. Perception
& Psychophysics, 44(4), 339-347.
Fujimoto, K. (2003). Motion induction from biological motion. Perception, 32(10), 1273-1277.
Fujimoto, K. & Yagi, A. (2008) Biological motion alters coherent motion perception. Perception,
37, 1783-1789.
Hiris, E. (2007). Detection of biological and nonbiological motion. Journal of Vision, 7(12), 1-16.
Ikeda, H., Blake, R., & Watanabe, K. (2005). Eccentric perception of biological motion is
unscalably poor. Vision Research, 45(15), 1935-1943.

45
Jastorff, J., Kourtzi, Z., & Giese, M. A. (2006). Learning to discriminate complex movements:
Biological versus artificial trajectories. Journal of Vision, 6(8), 791-804.
Johansson, G. (1973). Visual perception of biological motion and a model for its analysis.
Perception & Psychophysics, 14(2), 201-211.
Johansson, G. (1976). Spatio-temporal differentiation and integration in visual motion perception:
Experimental and theoretical analysis of calculus-like functions in visual data processing.
Psychological Research, 38(4), 379-393.
Kozlowski, L. T., & Cutting, J. E. (1977). Recognizing sex of a walker from a dynamic point-
light display. Perception & Psychophysics, 21(6), 575-580.
Kuhlmann, S., & Lappe, M. (2006). Recognition of biological motion from blurred natural
scenes. Perception, 35(11), 1495-1506.
Lange, J., & Lappe, M. (2007). The role of spatial and temporal information in biological motion
perception. Advances in Cognitive Psychology, 3(4), 419-428.
Mather, G., Radford, K., & West, S. (1992). Low-level visual processing of biological motion.
Proceedings of the Royal Society of London Series B: Biological Sciences, 249(1325),
149-155.
Murray, M. P. (1967). Gait as a total pattern of movement. American Journal of Physical
Medicine, 46(1), 290-332.
Neri, P., Morrone, M. C., & Burr, D. C. (1998). Seeing biological motion. Nature, 395(6705),
894-896.
Runeson, S. (1994). Perception of biological motion: The KSD-principle. In G. Jansson, S. S.
Bergstrom & W. Epstein (Eds.), Perceiving Events and Objects (pp. 383-405). Hillsdale,
NJ: Lawrence Erlbaum Associates.

46
Runeson, S., & Frykholm, G. (1983). Kinematic specification of dynamics as an informational
basis for person-and-action perception: Expectation, gender recognition, and deceptive
intention. Journal of Experimental Psychology: General, 112(4), 585-615.
Saygin, A. P., Driver, J., & de Sa, V. R. (2008). In the footsteps of biological motion and
multisensory perception: Judgments of audiovisual temporal relations are enhanced for
upright walkers. Psychological Science, 19(5), 469-475.
Simion, F., Regolin, L., & Bulf, H. (2008). A predisposition for biological motion in the newborn
baby. Proceedings of the National Academy of Sciences of the United States of America,
105(2), 809-813.
Thornton, I. M., Pinto, J., & Shiffrar, M. (1998). The visual perception of human locomotion.
Cognitive Neuropsychology, 15(6-8), 535-552.
Thornton, I. M., & Vuong, Q. C. (2004). Incidental processing of biological motion. Current
Biology, 14(12), 1084-1089.
Troje, N. F. (2008a). Biological motion perception. In A. Basbaum, M. Bushnell, D. Smith, G.
Beauchamp, S. Firestein, P. Dallos, D. Oertel, R. Masland, T. Albright, J. Kaas & E.
Gardner (Eds.), The Senses: A Comprehensive Reference (Vol. 2, pp. 231-238):
Academic Press.
Troje, N. F. (2008b). Retrieving information from human movement patterns. In T. F. Shipley &
J. M. Zacks (Eds.), Understanding Events: How Humans See, Represent, and Act on
Events (pp. 308-334). New York: Oxford University Press.
Troje, N. F., & Westhoff, C. (2006). The inversion effect in biological motion perception:
Evidence for a ‘life detector’? Current Biology, 16(8), 821-824.

47
Vaina, L. M., Solomon, J., Chowdhury, S., Sinha, P., & Belliveau, J. W. (2001). Functional
neuroanatomy of biological motion perception in humans. Proceedings of the National
Academy of Sciences of the United States of America, 98(20), 11656-11661.
Vallortigara, G., & Regolin, L. (2006). Gravity bias in the interpretation of biological motion by
inexperienced chicks. Current Biology, 16(8), R279-R280.
Vallortigara, G., Regolin, L., & Marconato, F. (2005). Visually inexperienced chicks exhibit
spontaneous preference for biological motion patterns. PLoS Biology, 3(7), 1312-1316.
Verfaillie, K. (2000). Perceiving human locomotion: Priming effects in direction discrimination.
Brain and Cognition, 44(2), 192-213.

48
Chapter 3
Localization of information for different components2
3.1 Introduction
Human vision can extract much high-level information from the motion of living
creatures, even when all visual cues are removed except for the movement of the major joints.
Experiments using these point-light displays have shown that we are sensitive to the gender,
heading direction, identity, and even the emotional state and personality of the producer of the
motion (Blake & Shiffrar, 2007; Troje, 2008a). However, more remains to be learned about
which parts of the display are most informative for these different abilities. Determining the
primary areas from which information is gathered will provide important clues to how each
perceptual task is performed.
In this study, we observed the effect of differing task instructions on eye movement
patterns when viewing the same set of biological motion point-light walker stimuli. We used two
commonly studied biological motion tasks: determining the direction in which a walker is facing,
and determining the gender of the walker. The facing direction can be derived from different
sources. One of them is the articulated structure of the body revealed by the dynamic
configuration of subsets of dots (Bertenthal & Pinto, 1994; Troje, 2002). Like the explicit
structure of a static stick-figure, the motion-mediated structure of a point-light display clearly
indicates whether a sagittal-view figure is facing left or right. A second source of information
2 This chapter is reprinted by permission from “Gaze patterns during perception of direction and gender
from biological motion” by D. R. Saunders, D. K., Williamson, and N. F. Troje, (2010). Journal of Vision,
10(11), 1-10. Copyright 2010 by the Association for Research in Vision and Ophthalmology.

49
about facing direction is the local motion of individual dots, in particular the ones representing
the extremities. Both Mather, Radford and West (1992) and Thurman and Grossman (2008)
found that removal of central dots in the displays did not harm walking direction judgment,
whereas removal of dots representing the extremities did. Other experiments showed that the feet
are sufficient for the perception of direction by making the overall form of the point-light walker
inaccessible, whether by inverting all the dot trajectories of the walker except for the feet (Troje
& Westhoff, 2006) or by showing the feet in isolation (Chang & Troje, 2009). Although Pinto
and Shiffrar (1999) argued that the importance of the extremities may be limited to determining
direction, the hypothesis they addressed involved the configuration of the extremities rather than
the intrinsic local motion of the extremities, since the local motion was made uninformative by
the study’s use of simultaneous scrambled walker masks. Therefore the study did not contradict
the premise that local motion of the extremities is relevant to more than judging walking
direction.
For the task of judging a point-light walker’s gender, a number of structural and
kinematic cues have been suggested, most involving the shoulders and hips. Murray, Kory, and
Sepic (1970) described greater lateral movement of the hips during walking in women as
compared to men, observations that were later quantified by motion capture studies (Cho, Park, &
Kwon, 2004; Smith, Lelas, & Kerrigan, 2002). Several researchers manipulated structural and
kinematic properties of synthetic point-light displays in order to investigate which inform gender
judgments. Barclay, Cutting and Kozlowski (1978) and Cutting, Proffitt and Kozlowski (1978)
showed that observers required movement in the dots of the walkers to correctly determine
gender, but framed the movement differences as mediating underlying differences in the body
structure, in particular in the relative width of shoulders and hips. However, in another study
using a synthetic walker, Mather and Murdoch (1994) showed that even with structure held

50
constant, lateral shoulder and hip movement could produce specific gender impressions. In
contrast to these studies evaluating individual candidate cues to gender, Kozlowski and Cutting
(1977) removed subsets of dots from point-light walkers derived from videotaped motion, and
found that participants were above chance at judging gender with every subset. This view of
gender information being distributed across the body was supported by Troje’s (2002) creation of
caricatured male and female walks using a linear ‘walker space’. However, the differences
between the extreme male and extreme female walk were most visible in the frontoparallel
movements of hips and shoulders.
The importance of different regions of a visual display to a perceptual judgment can be
studied using eye movements. The location of central fixation is a good proxy for the focus of
attention (Findlay & Gilchrist, 2003), and it is known that eye movement strategies change
depending on the task, with relatively more fixations occurring in regions that are more
informative for the task (Buswell, 1935; Castelhano, Mack, & Henderson, 2009; Yarbus, 1967).
This technique was used by Buchan, Paré, and Munhall (2007) to explore where people look on a
speaking human face when either comprehending the words or judging the emotion being
expressed, and how the fixation locations change as the task became more difficult. Johnson and
Tassinary (2005) observed gaze patterns for biological motion perception of gender, using solid
animated walking figures created with the animation software Poser. Their participants spent the
most time fixating on the waist and hips, followed by the chest, followed by the legs and head.
However, only the specific candidate cues of shoulder swagger and hip sway were varied, and the
walkers were shown only in a frontal view.
We used eyetracking and a point-light walker derived systematically from recorded
human movement (Saunders, Suchan, & Troje, 2009; Troje, 2008b), presented with different
view angles and different degrees of maleness or femaleness, to investigate where viewers were

51
gathering information during a direction and a gender biological motion task. The fact that the
displays were synthesized from real walking patterns allowed us to avoid preconceived ideas of
where directional or gender information was located, while still precisely modulating the
availability of relevant cues.
We hypothesized that there would be a difference between the tasks in the number of
fixations that fell in different regions, with more fixations at the feet in the direction task as
compared to the gender task, and more fixations at the pelvis and shoulders in the gender task as
compared to the direction task. We also hypothesized that task difficulty would have an effect on
fixations in both tasks, with relatively more fixations being directed to informative locations as
the task becomes more difficult. We evaluated these hypotheses using fixation maps and a region-
of-interest analysis on the number of fixations. We also looked at individual differences,
assuming that individuals would demonstrate different gaze strategies and that some strategies
would be more effective than others for each task.
3.2 Methods
3.2.1 Participants
Twenty participants (7 men and 13 women) completed this study, primarily recruited
from an introductory psychology course (several other recruited participants withdrew or did not
complete due to technical problems). Their ages ranged between 17 and 38 (M = 20) and they
were not experienced with biological motion stimuli. Participants were compensated with money
or course credit.

52
3.2.2 Materials
Eye positions during the trials were recorded using a head-mounted EyeLink II system at
a 250 Hz sampling rate. It has a gaze position accuracy of < 0.5°. The stimuli were presented on a
CRT monitor and controlled by a computer running MATLAB and the Psychophysics Toolbox
(Brainard, 1997) which also received eyetracking data.
3.2.3 Stimuli
The stimuli consisted of point-light displays of human walking. They were created from
the walks of 100 individuals, including 50 men and 50 women. Walking sequences were obtained
using a motion capture system (Vicon 512, Oxford Metrics) and data were converted into
Fourier-based representations, before averaging across several walking trials recorded for each
individual (Troje, 2008b). We applied principal component analysis (PCA) to the collection of
averaged individual walks to reduce the dimensionality of the space, and then used discriminant
function analysis to create an axis that best captured gender-specific differences (Troje, 2002). A
unique walker was generated for each trial by first choosing the point on the gender axis
corresponding to the desired level of maleness or femaleness, and then adding a small random
vector in the walker space, orthogonal to the gender axis. This had the effect of producing a novel
animation that was a valid-looking walker with the desired gender level. The point-light displays
consisted of 15 white dots on a black background, 10 cm tall, subtending 9.5° of visual angle at
the viewing distance of 60 cm.
The synthetic walkers were either male or female, with one of three gender levels in units
of standard deviations of the original 100 individuals’ gender scores: 0.5, 1.5, and 2.5, where
larger values indicate more exaggerated gender cues. The gender level affected all the dots of the
walker, changing both static and dynamic properties. For example, the most extreme male walker

53
had a shoulder-to-hip ratio of 2.4, whereas the most extreme female walker had a shoulder-to-hip
ratio of 1.6. The shoulder sway also decreased from extreme male to extreme female, with the
lateral distance traveled over a gait cycle by the dot representing the clavicle decreasing from
0.35 to 0.11° of visual angle. The orientation of the walkers in the horizontal plane was also
varied, with leftward or rightward walkers at one of three view angles: 3°, 30°, and 90°, with 90°
corresponding to a sagittal (side) view and 3° corresponding to a near-frontal view.
To combat ceiling effects by increasing the difficulty, we introduced a mask of linearly
moving dots traveling at 1.7° per second in random directions. The dots had a lifetime of 1
second after which they reappeared at a different location. There were 150 dots on the screen at
any time in a 13° by 13° square centered on the point-light walker.
The walker and surrounding noise could be centered at one of four locations all offset
from the initial fixation mark at the center of the screen by 4.8° of visual angle, shifted either up
and left, up and right, down and left, or down and right. The purpose of this was to force viewers
to make at least one saccade to reach the walker, reducing a possible bias towards fixating the
center of the figure.
3.2.4 Procedure
The study was run in two blocks. The same set of point-light displays was used in both
blocks; only the instructions were different. Following calibration of the eyetracker, participants
were instructed to either identify the gender of the walker (male or female), or the direction the
walker was walking (left or right) in the following trials. After those trials and a short break, they
were given the other set of instructions and continued. The order of the blocks was
counterbalanced across participants.

54
The six gender conditions, six view angle conditions, and four possible offsets from the
center combined to make a total of 144 possible stimuli. Each of them occurred twice, resulting in
a total of 288 trials for each block, with the order randomized within the block.
Trials began with a central fixation point that also served the purpose of drift correction
for the eyetracker. Once the participant had fixated this point, that is, their eyes were relatively
stationary, they pressed the spacebar and the fixation point disappeared to be replaced by the
walker. The walker was displayed for 2 seconds, with the eyetracker collecting eye position data,
after which the participant was prompted to press one of the arrow keys on the computer’s
keyboard to indicate their judgment of either the gender or the direction of the walker, depending
on which of the two blocks they were running.
Data analysis We analyzed the eyetracking position data to determine fixation locations.
To detect saccades, we first smoothed the instantaneous eye velocity information with a moving
average window 40 ms in width. Then we determined a saccade velocity threshold for each trial
separately by computing the median and standard deviation of eye movement velocity after
removing data points over 50 °/s, and labeling all samples with velocities of more than 3 standard
deviations above the median as part of a saccade. All samples between the saccade periods were
labeled ‘fixations’, even though by examination of eye velocity plots there was some movement
during fixation periods, indicating possible microsaccades, fixation drift, or pursuit eye
movements. Therefore the eye gaze events that we distinguished might be more accurately called
saccades and non-saccades. However we will refer to the latter as fixations for the rest of the
paper. The location of a fixation was defined as the average eye position during the fixation
period.

For visualization purposes, we constructed fixation maps (Wooding, 2002) for different
sets of conditions. We began with a matrix of all zeros corresponding to individual pixels of the
display, and then progressively added circular Gaussian blobs for each fixation, centered on the
fixation location (independent of fixation duration). These Gaussians had a standard deviation of
27 pixels or 1° of visual angle, roughly the size of the foveola, and equal heights of 1 unit. After
all fixations for the relevant conditions were added to the map, the values at each pixel were
scaled relative to the highest peak in the map, meaning that the darkest part of the image was the
most fixated and corresponded to a value of 1. To compare fixations between the two tasks, we
combined maps, creating dual-color fixation maps, by using the saturation of red at a given point
to indicate fixations in the direction task, and the saturation of blue to indicate fixations in the
gender task. Locations that were fixated frequently in both tasks appeared dark purple or black.
To test our hypotheses about fixation regions quantitatively, we defined three regions of
interest (ROI) relative to the center of the walker (Figure 3.1). The vertical coordinates of the
Figure 3.1. The predefined shoulder, pelvis and foot regions of interest, with the dots of an example point-light walker in frontal and side view respectively superimposed for reference. The rectangles indicating the regions and the lines connecting the dots are for illustration purposes and were not part of the stimuli. 55

56
ROIs were selected to fully contain the pairs of dots that represented either the shoulders, pelvis
or feet across all view angles, gender levels, and frames of the animation, with an additional
margin of approximately 0.5° of visual angle above and below to capture fixations that were near
the dots.
We conducted three-way repeated-measures ANOVAs to investigate the role of task and
difficulty levels on gaze patterns, in the three predefined regions separately. The factors were
Task (Direction or Gender), View Angle (walker rotated 3°, 30° or 90° from front-facing), and
Gender Level (0.5, 1.5 and 2.5, with 2.5 being the most distinctively male or female). We used as
a dependent measure the number of fixations that fell into each of the three ROIs, making a total
of three 2 × 3 × 3 ANOVAs. All repeated-measures F values were computed using an assumption
of sphericity.
3.3 Results
3.3.1 Accuracy
A repeated-measures analysis of variance applied to the proportion correct showed that
we successfully manipulated the difficulty of the direction and gender tasks (Figure 3.2) by
varying the viewing angle and the degree of maleness or femaleness, respectively. The factors
were Task (direction or gender), View Angle (3°, 30° or 90° offset from a frontal view) and
Gender Level (0.5, 1.5, or 2.5, where larger values are less ambiguous). There was a significant
main effect of Task, F(1, 19) = 170.42, p < .001, with the gender task (M = 0.64) being more
difficult than the direction task (M = 0.86). There were significant interactions between Task and
View Angle, F(2, 38) = 174.84, p < .001, and between Task and Gender Level, F(2, 38) = 44.76,
p < .001.

57
Within the direction task results, a follow-up 3 × 3 repeated-measures ANOVA showed
an effect of View Angle on accuracy, F(2, 38) = 381.36, p < .001, but no effect of Gender Level,
F(2, 38) = 0.43, p = .65. The effect of View Angle was due to accuracy differences between each
pair of view angles, as shown by follow-up pairwise comparisons, p < .003, with the direction of
walkers at near-frontal view angles being most difficult to judge.
Within the gender task results, a follow-up 3 × 3 repeated-measures ANOVA showed an
effect of Gender Level on accuracy, F(2, 18) = 21.01, p < .001, and also View Angle,
F(2, 18) = 63.59, p < .001, with no interaction between View Angle and Gender Level,
F(4, 16) = 2.16, p = .12. Follow-up pairwise tests showed significant differences between gender
accuracy at gender levels 0.5 and 1.5 and between levels 0.5 and 2.5, p < .001, as well as between
1.5 and 2.5, p = .011, with performance improving as the gender of the walkers became more
distinct. Though performance at the 0.5 gender level, the most ambiguous, was close to chance
level (which was 50%), it was still significantly above chance, t(19) = 2.87, p = .01. Follow-up
tests showed that the effect of View Angle was due to significant differences between gender
0.5
0.6
0.7
0.8
0.9
1.0
Direction task Gender task
Pro
porti
on c
orre
ct
3°
0.5
0.6
0.7
0.8
0.9
1.0
Direction task Gender task
Pro
porti
on c
orre
ct
0.51.530°
90° 2.5
Figure 3.2. The average proportion correct for the direction and gender task at A) the different walker view angles, where 90° represents a side view and 3° represents a near-frontal view, and at B) the different gender levels, where 0.5 is most ambiguously male or female and 2.5 is most exaggerated. The error bars represent ±1 SEM.
A B

58
0 0.5 1Fixation frequency
Ver
tical
pos
ition
DirectionGender
A B
Gen
der
Dire
ctio
n
Neither
Both
Figure 3.3. A) Fixation map across all participants and all conditions. The red areas indicate where there were the most fixations in the direction task and the blue where there were the most fixations in the gender task, while dark purple or black areas were frequently fixated in both tasks. B) Corresponding vertical distribution of fixations, showing the average height of the fixation map at each vertical position for the two tasks. Normalized so that the highest peak across both tasks is 1.
accuracy at the 3° and 90° view angles, and between 30° and 90°, p < .001, but not between 3°
and 30°, p = .21. Performance at the 90° view angle was much worse than in the more frontal
conditions, but significantly better than chance, t(19) = 2.76, p = .01. The gender task
performance results fell within the range reported by studies included in a meta-analysis
conducted by Pollick, Kay, Heim, and Stringer (2005): these studies found accuracies for point-
light walker gender tasks between 58% and 76% (M = 71%) for walkers presented from frontal or
oblique views, and between chance level and 72% (M = 66%) for walkers presented in a sagittal
view.
3.3.2 Fixation maps
The dual-color fixation map averaged across conditions and participants (Figure 3.3 A)
showed that in both tasks, participants fixated most often in the area of the point-light walker

59
stretching between and including the pelvis and shoulders. The corresponding plot of the vertical
distribution of fixations (Figure 3.3 B) confirms this. An overall tendency of participants to fixate
more on the feet in the direction task can be seen in the light red areas of the fixation map. Only
in the direction task were there any number of fixations that fell below the pelvis.
Qualifying these overall results, individual dual-color fixation maps (Figure 3.4) showed
a large amount of variation among the 20 participants in where they fixated, and in how their
fixation patterns were between the two tasks. Most participants’ fixations fell horizontally at the
midline of the body on average. Vertically they landed frequently at the pelvis, shoulders, or both.
Some participants did not show much difference in fixation patterns between the two tasks, which
can be seen from their primarily black and dark purple maps, while others changed their fixations
greatly, which can be seen in clearly separated red and blue regions. Of those who did change
their fixation strategy to an appreciable degree, the majority placed a greater emphasis on the feet
in the direction task than in the gender task (and so have red areas near the feet). Some
participants (e.g. #2, #11, #15) also showed a horizontal shift of their typical fixation locations
between the two tasks, but these shifts did not show a consistent pattern across participants.
In the next section these observations are quantified using the average number of
fixations that fell within three pre-defined regions of interest.

60
5
6 7 8 9 10
11 12 13 14 15
16 17 18 19 20
3 2 4 1
Gen
der
Dire
ctio
n
Neither
Both
Figure 3.4. Fixation maps for each participant, showing the fixations for the two tasks across all view angles and all gender levels. The red areas indicate where there were the most fixations in the direction task, and the blue where there were the most fixations in the gender task. Dark purple or black areas were frequently fixated in both tasks.

0.0
0.2
0.4
0.6
0.8
1.0
1.2
Shoulders Pelvis Feet
Ave
rage
num
ber o
f fix
atio
ns i
* Direction task
Gender task
**
Figure 3.5.
The average number of fixations within the three ROIs for the two tasks. The error bars represent ±1 SEM. * indicates significance at the .05 level, ** significance at .01.
3.3.3 Regions of interest
We analyzed the average number of fixations in each ROI. In the foot region, a three-way
repeated measures ANOVA on the average number of fixations, with Task, View Angle, and
Gender Level as factors, showed a significant main effect of Task, F(1, 19) = 10.64, p = .004,
with participants fixating more often on the feet in the direction task (Figure 3.5). There was also
a main effect of View Angle, F(2, 38) = 3.91, p = .03 and an interaction between Task and View
Angle, F(2, 38) = 3.49, p = .04. Follow-up ANOVAs within the direction task and gender task
revealed that the main effect of View Angle was carried exclusively by mean differences in the
direction task, F(2, 38) = 4.13, p = .02, with no effect of View Angle in the gender task,
F(2, 38) = 0.32, p = .73. Pairwise tests in the direction task showed that there were more fixations
on the feet in the 3° than in the 90° (side view) view angle (Figure 3.6), p = .04, but no significant
difference between the number of feet fixations in the 3° and 30° view angles or the 30° and 90°
view angles, p = .10 and p = .07 respectively. A test for a linear trend was significant, p = .04.
61

62
The average number of fixations during the direction task in the three ROIs for the different view angles, where 90° is a side view and 3° is a near frontal view. The error bars
Figure 3.6.
3°
0.0
0.2
0.4
0.6
0.8
1.0
1.2
Shoulders Pelvis Feet
Ave
rage
num
ber o
f fix
atio
ns i
30°90°
*
represent ±1 SEM. * indicates significance at the .05 level.
There was no significant main effect of Gender Level in the foot region, as well as no other
interactions.
Participants fixated more often in the shoulder region during the gender task than during
the direction task, F(1, 19) = 4.89, p = .04 (Figure 3.5). There were no effects of View Angle or
Gender Level in the shoulder region, and no interactions.
In the pelvis region, there was a significant main effect of View Angle on number of
fixations, F(2, 38) = 4.51, p = .02, and no other main effects or interactions. Pairwise tests
indicated more fixations on the pelvis in the 3° (near frontal) view angle than in the 90° view
angle, p = .02. Although differences between the other pairs of view angles
in number of fixations did not reach significance, a test for a linear trend was significant, p = .02,
indicating a pattern of fewer pelvis fixations at the less frontal view angles.
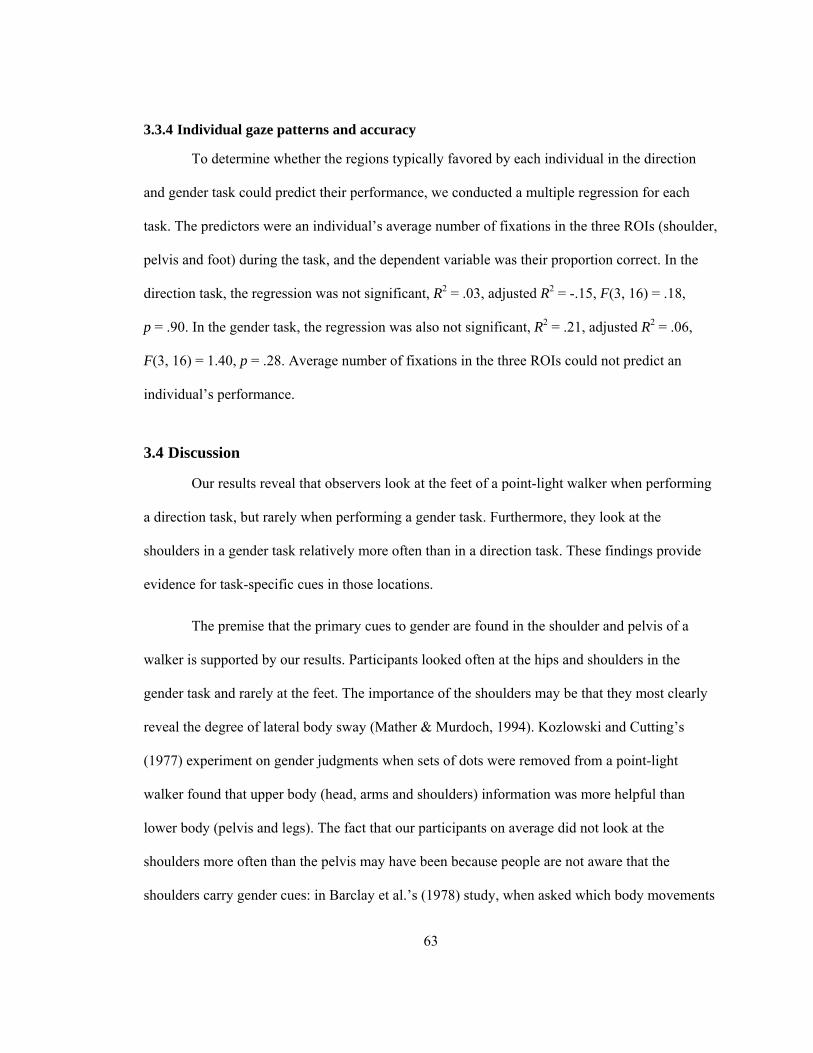
63
3.3.4 Individual gaze patterns and accuracy
To determine whether the regions typically favored by each individual in the direction
and gender task could predict their performance, we conducted a multiple regression for each
task. The predictors were an individual’s average number of fixations in the three ROIs (shoulder,
pelvis and foot) during the task, and the dependent variable was their proportion correct. In the
direction task, the regression was not significant, R2 = .03, adjusted R2 = -.15, F(3, 16) = .18,
p = .90. In the gender task, the regression was also not significant, R2 = .21, adjusted R2 = .06,
F(3, 16) = 1.40, p = .28. Average number of fixations in the three ROIs could not predict an
individual’s performance.
3.4 Discussion
Our results reveal that observers look at the feet of a point-light walker when performing
a direction task, but rarely when performing a gender task. Furthermore, they look at the
shoulders in a gender task relatively more often than in a direction task. These findings provide
evidence for task-specific cues in those locations.
The premise that the primary cues to gender are found in the shoulder and pelvis of a
walker is supported by our results. Participants looked often at the hips and shoulders in the
gender task and rarely at the feet. The importance of the shoulders may be that they most clearly
reveal the degree of lateral body sway (Mather & Murdoch, 1994). Kozlowski and Cutting’s
(1977) experiment on gender judgments when sets of dots were removed from a point-light
walker found that upper body (head, arms and shoulders) information was more helpful than
lower body (pelvis and legs). The fact that our participants on average did not look at the
shoulders more often than the pelvis may have been because people are not aware that the
shoulders carry gender cues: in Barclay et al.’s (1978) study, when asked which body movements

64
they thought best differentiated men and women, all participants mentioned the hips while only
76% mentioned the shoulders. Other candidate cues involve the shoulders and pelvis equally,
such as the shoulder–hip ratio. In contrast to our finding of approximately equal number of
fixations on the shoulders and pelvis, Johnson and Tassinary (2005), also studying gaze patterns
in a gender classification task, observed almost twice as many fixations on the pelvis and lower
torso as on the chest and shoulders. This could be accounted for by the fact that they used solid
models for their walking displays, which, unlike point-light walkers, depicted the size of the waist
and other non-skeletal anatomical measures. Exaggerating this effect, half the trials in their eye
movement analysis only varied the shape of the waist, with the kinematics remaining constant, so
that the only gender information was in the waist–hips area. The present study extends Johnson
and Tassinary (2005) by showing the role of different tasks, and by defining gender levels in
terms of a linear space of motion-captured male and female walking patterns rather than by
varying isolated motion cues such as hip and shoulder sway. We also observed fixations with the
walkers displayed at different view angles.
On average, our participants fixated more often in the region containing the feet when
they performed the direction task than when they performed the gender task. Along with the
frequent fixations on the pelvis and upper body in this task, this points to a contribution of both
local and configural cues in judging direction. Although the present study cannot directly address
the relative importance of these two sources of information, the localized change in attentional
emphasis is predicted by previous findings (Chang & Troje, 2009; Mather et al., 1992; Troje &
Westhoff, 2006) that the local motion of the extremities, in particular the feet, are useful in
perception of direction. A hypothesized aspect of the foot motion that triggers biological motion
processing is the characteristic acceleration profile: Chang and Troje (2009) found that inversion
reduced accuracy in direction judgments from two foot dots, but not when the acceleration profile

65
of the foot movement was distorted. The bottom-most ROI always contained the foot dot, but for
certain walkers the knee dots passed into it during part of the gait cycle. This means that our
findings of increased fixations in this ROI are also consistent with an alternative model, that local
subconfigurations of limbs (Pinto & Shiffrar, 1999) are what are critical for some biological
motion tasks. In either case, the task-related shift in attention to the lower body indicates that
participants likely made use of directional information located there.
Our prediction that increased task difficulty would enhance the difference in gaze
patterns between the two tasks was partially verified. In the direction task the most difficult
condition, in which the walker was displayed at a near-frontal view angle, resulted in the most
foot fixations on average, whereas the sagittal view angle resulted in significantly fewer foot
fixations. Changes to both the gender level and to the view angle affected performance in the
gender task, replicating Mather and Murdoch’s (1994) and Troje’s (2002) finding that the gender
of a point-light walker is easiest to determine in frontal views; however neither gender level nor
view angle affected the number of fixations in the ROIs. This discrepancy between the effect of
task difficulty in the two tasks may be the result of view angle being more immediately accessible
(as reflected in the higher accuracies), allowing the participant to adjust their gaze strategy
dynamically based on the difficulty, whereas in the gender task the 2 second display time may not
have been sufficient to both determine the difficulty of the task and then carry out an appropriate
strategy. Alternatively, 2 seconds may have been more than sufficient to determine the walking
direction in the easier direction task conditions, after which the viewer could explore the display
freely, including areas not necessary for performing the task. This interpretation is supported by
the finding of ceiling and near-ceiling direction performance at the 90° and 30° view angles.
Contrary to our expectations, performance in the two tasks could not be predicted by how
an individual distributed their fixations among the shoulders, pelvis and feet. This may have been

66
due to lack of variability in individual behavior. In the direction task there was relatively low
between-subjects variability in the proportion correct (SD = 0.04) and high variability in the
distribution of fixations, whereas in the gender task there was somewhat higher variability in the
proportion correct (SD = 0.08) and low variability in the regions fixated (almost exclusively the
shoulders and pelvis). This could be improved in future studies by making the direction task more
difficult, and by using a larger walker, so that observers would have to decisively fixate on the
pelvis or shoulders to gather information from them. Nevertheless, the fact that participants
fixated more on the feet in the direction task than in the gender task, and more on the upper body
in the gender task than in the direction task, shows that they sought task-relevant information in
these two areas.
Future eyetracking studies using human motion stimuli should examine the temporal
patterning of fixations. The time dimension is critical for describing gaze behavior when viewing
non-periodic actions; in particular, displays of social interaction. It is already known that there are
predictable temporal and spatial patterns of fixations for normal observers on video of social
scenes, but which are different for people with autism (Klin, Jones, Schultz, Volkmar, & Cohen,
2002). This phenomenon could be further investigated with point-light displays, which offer a
large number of possibilities for controlling aspects of social interaction animations: information
can be removed and altered, and even the degree of interactivity can be modulated.

67
References
Barclay, C. D., Cutting, J. E., & Kozlowski, L. T. (1978). Temporal and spatial factors in gait
perception that influence gender recognition. Perception & Psychophysics, 23(2), 145-
152.
Bertenthal, B. I., & Pinto, J. (1994). Global processing of biological motions. Psychological
Science, 5(4), 221-225.
Blake, R., & Shiffrar, M. (2007). Perception of human motion. Annual Review of Psychology, 58,
47-73.
Brainard, D. H. (1997). The psychophysics toolbox. Spatial Vision, 10(4), 433-436.
Buchan, J. N., Paré, M., & Munhall, K. G. (2007). Spatial statistics of gaze fixations during
dynamic face processing. Social Neuroscience, 2(1), 1-13.
Buswell, G. T. (1935). How people look at pictures: a study of the psychology of perception in
art. Chicago, Ill.: University of Chicago Press.
Castelhano, M. S., Mack, M. L., & Henderson, J. M. (2009). Viewing task influences eye
movement control during active scene perception. Journal of Vision, 9(3), 1-15.
Chang, D. H. F., & Troje, N. F. (2009). Acceleration carries the local inversion effect in
biological motion perception. Journal of Vision, 1(9), 1-17.
Cho, S. H., Park, J. M., & Kwon, O. Y. (2004). Gender differences in three dimensional gait
analysis data from 98 healthy Korean adults. Clinical Biomechanics, 19(2), 145-152.
Cutting, J. E., Proffitt, D. R., & Kozlowski, L. T. (1978). A biomechanical invariant for gait
perception. Journal of Experimental Psychology: Human Perception and Performance,
4(3), 357-372.
Findlay, J. M., & Gilchrist, I. D. (2003). Active vision: The psychology of looking and seeing.
New York: Oxford University Press.
68
Johnson, K. L., & Tassinary, L. G. (2005). Perceiving sex directly and indirectly: Meaning in
motion and morphology. Psychological Science, 16(11), 890-897.
Klin, A., Jones, W., Schultz, R., Volkmar, F., & Cohen, D. (2002). Visual fixation patterns during
viewing of naturalistic social situations as predictors of social competence in individuals
with autism. Archives of General Psychiatry, 59(9), 809-816.
Kozlowski, L. T., & Cutting, J. E. (1977). Recognizing sex of a walker from a dynamic point-
light display. Perception & Psychophysics, 21(6), 575-580.
Mather, G., & Murdoch, L. (1994). Gender discrimination in biological motion displays based on
dynamic cues. Proceedings of the Royal Society of London Series B: Biological Sciences,
258(1353), 273-279.
Mather, G., Radford, K., & West, S. (1992). Low-level visual processing of biological motion.
Proceedings of the Royal Society of London Series B: Biological Sciences, 249(1325),
149-155.
Murray, M. P., Kory, R. C., & Sepic, S. B. (1970). Walking patterns of normal women. Archives
of Physical Medicine and Rehabilitation, 51(11).
Pinto, J., & Shiffrar, M. (1999). Subconfigurations of the human form in the perception of
biological motion displays. Acta Psychologica, 102(2-3), 293-318.
Pollick, F. E., Kay, J. W., Heim, K., & Stringer, R. (2005). Gender recognition from point-light
walkers. Journal of Experimental Psychology-Human Perception and Performance,
31(6), 1247-1265.
Saunders, D. R., Suchan, J., & Troje, N. F. (2009). Off on the wrong foot: Local features in
biological motion. Perception, 38(4), 522-532.

69
Smith, L. K., Lelas, J. L., & Kerrigan, D. C. (2002). Gender differences in pelvic motions and
center of mass displacement during walking: Stereotypes quantified. Journal of Womens
Health & Gender-Based Medicine, 11(5), 453-458.
Thurman, S. M., & Grossman, E. D. (2008). Temporal ‘bubbles’ reveal key features for point-
light biological motion perception. Journal of Vision, 8(3), 1-11.
Troje, N. F. (2002). Decomposing biological motion: A framework for analysis and synthesis of
human gait patterns. Journal of Vision, 2(5), 371-387.
Troje, N. F. (2008a). Biological motion perception. In A. Basbaum, M. Bushnell, D. Smith, G.
Beauchamp, S. Firestein, P. Dallos, D. Oertel, R. Masland, T. Albright, J. Kaas & E.
Gardner (Eds.), The Senses: A Comprehensive Reference (Vol. 2, pp. 231-238):
Academic Press.
Troje, N. F. (2008b). Retrieving information from human movement patterns. In T. F. Shipley &
J. M. Zacks (Eds.), Understanding Events: How Humans See, Represent, and Act on
Events (pp. 308-334). New York: Oxford University Press.
Troje, N. F., & Westhoff, C. (2006). The inversion effect in biological motion perception:
Evidence for a ‘life detector’? Current Biology, 16(8), 821-824.
Wooding, D. S. (2002). Eye movements of large populations: II. Deriving regions of interest,
coverage, and similarity using fixation maps. Behavior Research Methods Instruments &
Computers, 34(4), 518-528.
Yarbus, A. L. (1967). Eye movements and vision. New York: Plenum Press.

70
Chapter 4
Assessing biological motion perception components3
4.1 Introduction
Tools for assessing basic visual capabilities have been available for centuries, and are
widespread and effective. Visual acuity, contrast sensitivity, and color perception are all
measured in clinical settings on a regular basis. However, as social animals one of the main uses
of our visual system is to observe the people around us, and less attention has been paid to
measuring this aspect of vision. Social perception encompasses both static and dynamic stimuli:
we obtain valuable information not only from a person’s posture and facial expression, but also
from their movement. Johansson’s (1973) point-light display isolates important aspects of social
recognition from motion. In this display, a person performing an action, such as walking, is
represented by only a few dots tracking the major joints and head. Nevertheless, the observer
experiences an instantaneous, rich percept of a human in action, including a strong sense of the
movement style. In contrast to more realistic stimuli, point-light displays allow for well
controlled manipulations and a rigorous, quantitative psychophysical approach. Therefore they
have become the basis for the study of the complex social ability known as biological motion
perception.
Biological motion perception is characterized by a number of interesting observations:
like faces, point-light displays are subject to an inversion effect (Pavlova & Sokolov, 2000); they
can be organized in as little as 100 ms (Oram & Perrett, 1996); and they are extremely salient and
3 This chapter is reprinted from “A battery of tests for assessing biological motion perception” by D. R.
Saunders and N. F. Troje, manuscript submitted to Seeing and Perceiving, Feb. 28, 2011.

71
therefore difficult to mask, even with dynamic noise (Cutting, Moore, & Morrison, 1988).
Furthermore, humans are sensitive to biological motion within two days of birth (Simion,
Regolin, & Bulf, 2008); both the dorsal and ventral visual pathways play a part in it (Vaina,
Solomon, Chowdhury, Sinha, & Belliveau, 2001); and perceiving it appears to be possible even in
the absence of simple motion detection ability (McLeod, Dittrich, Driver, Perrett, & Zihl, 1996).
These intriguing properties and the questions they raise have made it important to develop
adequate methods for assessing biological motion perception.
Early demonstrations of biological motion perception simply showed point-light displays
to naïve observers and asked them to describe what they saw, but more sensitive measures were
soon developed. For example, a popular task involves determining the heading direction of a
point-light walker shown in profile view, often superimposed with masking noise consisting of
moving dots with the same size and luminance (e.g. Cutting et al., 1988). However, what is
measured by this task is ambiguous. Past research has suggested that there are at least three
complex perceptual abilities that could contribute to good performance. First, distinguishing the
walker from the noise, a type of figure-ground segregation, appears to be a distinct ability that can
be selectively impaired. For example, Ikeda, Blake and Watanabe (2005) found that detection of
biological motion is particularly poor in the periphery, beyond what could be explained by
decreasing visual acuity. It was later discovered, however, that this phenomenon depended on the
walker being masked by noise dots. In a paradigm that did not require masking noise, Gurnsey,
Roddy, Ouhnana, and Troje (2008) were able to compensate for the worse performance at greater
eccentricities by increasing the size of the stimulus (see also Thompson, Hansen, Hess, & Troje,
2007). Only detecting a walker in masking noise was ‘unscalably poor’. Similarly, in a study
comparing older and younger adults in a direction discrimination task, performance was equal

72
between the two groups except when masking noise was added, in which case the older adults
were significantly worse than the younger adults (Pilz, Bennett, & Sekuler, 2010).
A second ability that can be used to perform the walking direction task is retrieval of
structure from motion (Cutting, 1981; Hoffman & Flinchbaugh, 1982; Johansson, 1976; Webb &
Aggarwal, 1982). Structure-from-motion processing, in the context of a point-light display, infers
the articulated structure of the walker using the local relations of the moving dots representing the
joints. If the motion trajectory of the dot representing the wrist is more simply described in the
reference frame of another dot, such as the elbow, then they are interpreted as being rigidly
connected. In this way, the observer recovers the organizing ‘skeleton’, and the form that is
revealed can then give the direction of walking. With structure-from-motion, the motion relations
play the same role as the explicit connections in an animated stick figure. This process is not
absolutely essential for the perception of biological motion, as was shown by studies in which the
pairwise relations between points were disrupted or absent (Beintema, Georg, & Lappe, 2006;
Beintema & Lappe, 2002; Casile & Giese, 2005; Cutting, 1981); however when these stimuli are
compared to the standard point-light display there is a decrease in performance, indicating that
human observers do make use of information about the hierarchical, articulated structure when it
is available.
Finally, the same direction task can be accomplished using an independent source of
information: the local motion trajectories of the dots, in particular the feet. The first suggestion
that this is the case came from Mather, Radford and West (1992), who observed that removing
the dots representing the hands and feet particularly harmed ability to determine walking
direction. Stronger evidence came with Troje and Westhoff (2006) showing that when the
structure of the point-light walker was destroyed by spatially displacing the dot trajectories to
random locations (that is, ‘scrambling’ the walker) observers could still determine the walking

73
direction at above chance levels. Furthermore, when the trajectory representing the feet was
inverted, participants could no longer perform the task, even if the remaining trajectories were
shown in upright orientation. They concluded that the local motion trajectories of the feet contain
invariants that represent a distinct source of information about the walker. They speculated that
these may be used as an early warning signal for the presence of a terrestrial animal nearby,
which could be predator, prey, or conspecific. Subsequent studies have found that local motion
alone can create an impression of animacy (Chang & Troje, 2008), and that it attracts the interest
of both human infants (Simion et al., 2008) and baby chicks (Vallortigara, Regolin, & Marconato,
2005).
A direction task with masking noise therefore requires at least three distinct abilities, and
all three are confounded in measurements of performance on this task. Biological motion
perception is not a single phenomenon (Troje, 2008), as is implicitly assumed when only a single
task is used to assess it. It is important to conceptually distinguish the different major abilities
involved in biological motion perception, and to devise ways to isolate them experimentally.
Tasks differ in the demands they place on underlying processes, and as a result will exhibit
different properties. For example, local biological motion processing appears to not be affected
by repeated exposure (Chang & Troje, 2009b), whereas more global types of processing are
(Grossman, Blake, & Kim, 2004). In addition to tasks calling on figure-ground segregation,
structure-from-motion, and the processing of local motion invariants, higher-order biological
motion abilities are also often assessed, in particular action recognition (Dittrich, 1993; Olofsson,
Nyberg, & Nilsson, 1997) and perception of high-level stylistic properties relating to identity
(Cutting & Kozlowski, 1977; Loula, Prasad, Harber, & Shiffrar, 2005; Westhoff & Troje, 2007),
emotional state (Dittrich, Troscianko, Lea, & Morgan, 1996; Pollick, Paterson, Bruderlin, &
Sanford, 2001), or biological properties such as sex, weight, or age (Troje, 2002b). Like the

74
lower-level abilities, they are typically measured using point-light displays, in which case good
performance also reflects structure-from-motion ability. The stimuli are also sometimes presented
in a mask of noise dots, requiring figure-ground segregation. Therefore higher-level biological
motion abilities are rarely measured independently of lower-level abilities.
Lack of attention to what a task measures has led to apparent inconsistencies in the
biological motion perception literature. For example, there have been varying answers to the
question of whether people with Autism Spectrum Disorders are impaired in biological motion
perception. Studies in which people judged walking direction of point-light displays have
generally found no differences between ASD participants and controls (Herrington et al., 2007;
Murphy, Brady, Fitzgerald, & Troje, 2009; Saygin, Cook, & Blakemore, 2010), although one
study using adolescents did find impairment (Koldewyn, Whitney, & Rivera, 2010). On the other
hand, a set of studies in which participants labeled the emotion being portrayed by a point-light
actor (Atkinson, 2009; Hubert et al., 2007; Moore, Hobson, & Lee, 1997; Parron et al., 2008)
consistently found lower accuracy in the ASD group. These same studies also found no evidence
of a difference in ability to recognize actions. Taken together, these results suggest a pattern of
relative normalcy in determining structure from motion, but difficulty in interpreting high-level
style properties. However, apart from the combination of action categorization and style
recognition, groups of participants with ASD have rarely been assessed on more than one of these
biological motion tasks at a time. As well, no published study has assessed people with ASD on
their ability to recognize individuals by their walk, which might be expected to be impaired from
their difficulties with face recognition (Klin et al., 1999). All of these tasks might be said to
assess biological motion perception, and all likely have parallels in the day-to-day social world.
Therefore the question of whether people with ASD have deficits in perceiving biological motion

75
will have multiple answers, that should derive from conducting multiple tests on the same sample
of individuals.
Another set of questions that can be clarified by a multiple-ability framework comes from
neuropsychology. Researchers have measured the performance of patients with brain lesions in
biological motion tasks in an attempt to distinguish and localize the underlying cognitive
mechanisms. However nearly all studies use no more than two biological motion tasks, and few
choose the same set. Therefore it can be difficult to interpret the implications of patients who
appear to show dissociations between different abilities. Even patients with deficits in low level
motion detection may be normal in action categorization (McLeod et al., 1996; Vaina, 1994;
Vaina, Cowey, LeMay, Bienfang, & Kikinis, 2002), person identification (Vaina, 1994; Vaina et
al., 2002), sensitivity to scrambling (McLeod et al., 1996), and detection in noise (Billino, Braun,
Bohm, Bremmer, & Gegenfurtner, 2009). Conversely, low-level vision can be preserved while
there are deficits in action categorization and walker identification (Cowey & Vaina, 2000), or
detection in noise (Billino et al., 2009). Two studies also showed dissociations between 2D or 3D
structure-from-motion tasks and biological motion tasks (Battelli, Cavanagh, & Thornton, 2003;
Vaina & Gross, 2004). Most interestingly for the multiple-ability viewpoint, there exist patients
who are impaired in some biological motion tasks and not others: two patients of Schenk and Zihl
(1997), FM1 and FM2, were poor at detecting the walker in noise, but were able to judge
direction and scrambling within the normal range. LM as measured by McLeod et al. (1996) had
normal scores on a scrambling detection task, but not a direction determination task (and in
particular was strongly affected by masking noise), while JL (Battelli et al., 2003) had the inverse
pattern, with normal performance on a direction task but a deficit in identifying the scrambled
walker. Although these are only single cases, they suggest that these tasks call on different
underlying processes. For these latter patients in particular, who would be considered impaired in

76
biological motion perception by some measures but not by others, a spectrum of tasks would
more clearly illuminate the nature of their deficits.
Not only the task but also details of the stimuli can strongly affect biological motion
assessment. A common method of generating point-light displays may have eliminated the role of
local motion invariants in many experiments. Cutting’s (1978) algorithm produces a synthetic
point-light walker animation that broadly resembles a person walking, but differs from real
human motion in the shape and velocity profiles of its local motion trajectories, with this
particularly evident in the feet. Observers are not able to determine direction of walking from the
local motion of this stimulus as they are from displays derived from motion capture recordings
(Saunders, Suchan, & Troje, 2009). Cutting’s walker was used, and continues to be used, in many
studies, including some experiments in which the direction of a scrambled walker is relevant
(Bosbach, Prinz, & Kerzel, 2004; Fujimoto, 2003; Lange & Lappe, 2007; Mather et al., 1992; Pilz
et al., 2010), and where, therefore, the lack of local directional cues almost certainly affected the
measured performance.
Assessment of the abilities of special populations, as well as many other investigations of
biological motion perception, would benefit from a standardized package of biological motion
tasks that is efficient to administer, and that uses motion stimuli derived from recordings of
human movement. This paper introduces such a battery of tests (Figure 4.1), BMLtest (for Bio
Motion Lab). Three of the tests assess figure-ground segregation, structure-from-motion, and
local motion invariant extraction, as independently as possible. For example, only the test of
figure-ground segregation (the Detection test) uses a dynamic dot mask. Additional tests measure
higher-level biological motion abilities: action categorization and style recognition, the latter of
which is divided into gender classification and person identification. In these tests the human
figures are portrayed as animated stick figures rather than point-light displays, so that
77
measurements will be independent of structure-from-motion ability, and even participants who
cannot organize point-light displays can be assessed with them. Finally, the Coherence test
measures simple motion detection ability. The current paper describes the tests that make up
BMLtest, and evaluates it using undergraduate samples.
Besides providing normative data and an estimate of the reliability of the tests, full-
battery data from undergraduate participants can test the hypothesis that these tasks measure
relatively independent constructs. Using the logic of individual differences (e.g. Kosslyn, Brunn,
Cave, & Wallach, 1984; Wilmer, 2008), if there is little correlation between performance on the
tests then it is evidence that they are assessing mostly or entirely independent mechanisms.
Conversely, if individual performance on two tasks is highly correlated, then they share some
underlying mechanisms. This type of data can serve as a complement to other evidence of
independence, such as neuropsychological data, regarding such questions as whether low-level
motion perception relies on distinct pathways from biological motion perception.
Since BMLtest is intended to be used in a variety of settings, Experiment 1 tested the
robustness of performance when the tests are administered via the internet, in a home setting. We
assessed participants twice in counterbalanced order, once at home and once in a lab setting, and
compared the test scores. We also gave participants a questionnaire to determine features of the
home testing environment, a topic which is of increasing interest to psychologists weighing the
advantages and disadvantages of internet-based studies (e.g. Birnbaum, 2004). Given the
evidence from the first experiment in support of the effectiveness of online testing, Experiment 2
relied on home-based internet testing to collect normative data and test-retest reliability estimates
for the final version of BMLtest.
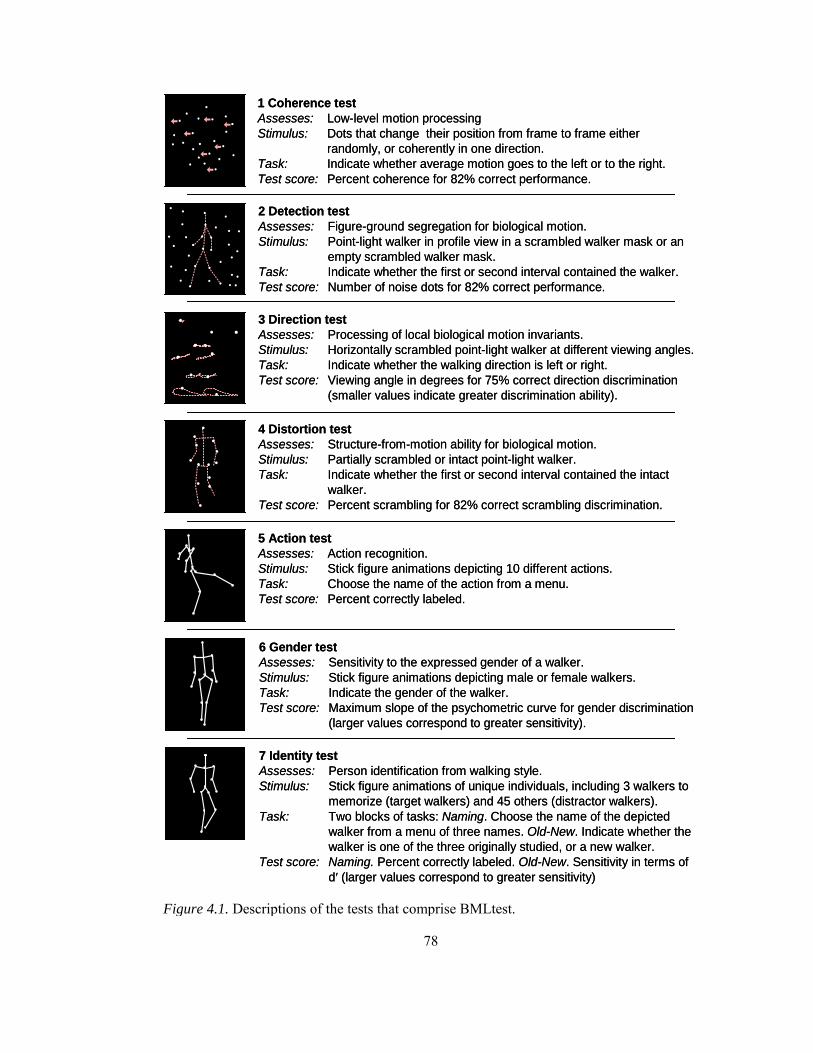
78
Figure 4.1. Descriptions of the tests that comprise BMLtest.
5 Action testAssesses: Action recognition.Stimulus: Stick figure animations depicting 10 different actions.Task: Choose the name of the action from a menu.Test score: Percent correctly labeled.
2 Detection testAssesses: Figure-ground segregation for biological motion.Stimulus: Point-light walker in profile view in a scrambled walker mask or an
empty scrambled walker mask.Task: Indicate whether the first or second interval contained the walker.Test score: Number of noise dots for 82% correct performance.
3 Direction testAssesses: Processing of local biological motion invariants. Stimulus: Horizontally scrambled point-light walker at different viewing angles.Task: Indicate whether the walking direction is left or right.Test score: Viewing angle in degrees for 75% correct direction discrimination
(smaller values indicate greater discrimination ability).
4 Distortion testAssesses: Structure-from-motion ability for biological motion. Stimulus: Partially scrambled or intact point-light walker.Task: Indicate whether the first or second interval contained the intact
walker.Test score: Percent scrambling for 82% correct scrambling discrimination.
6 Gender testAssesses: Sensitivity to the expressed gender of a walker.Stimulus: Stick figure animations depicting male or female walkers.Task: Indicate the gender of the walker.Test score: Maximum slope of the psychometric curve for gender discrimination
(larger values correspond to greater sensitivity).
7 Identity testAssesses: Person identification from walking style. Stimulus: Stick figure animations of unique individuals, including 3 walkers to
memorize (target walkers) and 45 others (distractor walkers).Task: Two blocks of tasks: Naming. Choose the name of the depicted
walker from a menu of three names. Old-New. Indicate whether the walker is one of the three originally studied, or a new walker.
Test score: Naming. Percent correctly labeled. Old-New. Sensitivity in terms of d′ (larger values correspond to greater sensitivity)
1 Coherence testAssesses: Low-level motion processingStimulus: Dots that change their position from frame to frame either
randomly, or coherently in one direction.Task: Indicate whether average motion goes to the left or to the right.Test score: Percent coherence for 82% correct performance.

79
4.2 BMLtest: A Comprehensive Assessment of Biological Motion Perception
4.2.1 Overview
BMLtest is a web application, implemented in Adobe Flash, that assesses multiple
abilities which play a role in biological motion perception (Figure 4.1). After entering their name
and other information, participants are presented with a list of the seven tests that make up the test
battery. Once they have completed a test, that option is disabled. Researchers can instruct
participants to take all of the tests in a particular order, or to take a subset of the tests. The stimuli
in each test appear in the same fixed order across all participants.
Each test begins with a screen containing instruction text and a button to perform a
practice trial. The practice trials are easier versions of the task, designed to familiarize the
participant with the task requirements without providing much training. The participant may
practice until they feel ready, and then click the “Begin” button to start the test. Once a test is
completed, a summary of the results and the performance on individual trials can be accessed
online by the researcher.
In the following descriptions of the individual tasks, stimulus sizes are reported in
degrees of visual angle, under the assumption of a viewing distance of 60 cm, a monitor that
measured 18 inches diagonally, and a screen resolution of 1280 × 1024 pixels. All the stimuli
consist of moving white dots or lines shown on a black background. In the case of the stick
figures, there are dots located at the major joints in addition to the lines. Dots are 6 pixels in
diameter, corresponding to 0.16° under the assumed distance and screen size. Lines are 3 pixels
(0.08°) thick. All point-light walker (and stick figures) are 4° of visual angle in height. Walkers
remain in one place as if on a treadmill.

80
4.2.2 Adaptive threshold procedure
Five of the tests use a QUEST threshold procedure (Watson & Pelli, 1983) to measure a
stimulus intensity threshold, which becomes the test score. The advantage to using a maximum-
likelihood procedure like QUEST is that a high precision can be achieved with a relatively small
number of trials, and it does not require prespecifying a range of thresholds in the population, as
the method of constant stimuli does (Watson & Fitzhugh, 1990). Both are advantages for using
the tests with special populations, such as children, where there might be difficulties in
maintaining focus for long periods of time and where there might be little a priori knowledge of
the distribution of thresholds.
For all tests using the QUEST procedure, a Weibull-shaped psychometric function is
assumed with parameters set based on the suggestions of Watson and Pelli (that is, β = 3.5 and δ
= 0.01). The procedure terminates after a fixed number of trials, as recommended by Anderson
(2003), specifically 40. The initial test intensities, which also determined the mean of the prior
probability distribution, were chosen separately for each test to be approximately one standard
deviation easier than the predicted mean threshold in the population based on pilot data.
4.2.3 Coherency test
4.2.3.1 Introduction
The Coherency tests assesses low-level motion processing, based on the task used by
Newsome and Paré (1988).
4.2.3.2 Stimuli
The display consists of 15 dots which are initially placed at random within a 10 degree-
diameter circular region. At a frame rate of 20 Hz, on each subsequent frame each dot will either
be moved to a randomly chosen new location within the circular region, or displaced by 0.15° to

81
the left or the right. The percent coherence represents the probability that a dot will be selected to
move rather than to be randomly relocated.
4.2.3.3 Procedure
In each trial, the dynamic random dot display is shown for 1 s, with the percent coherence
set by a QUEST procedure as described above. Then the display disappears and participants click
on the button labeled “Left” or “Right” to indicate the direction of motion. A blank screen is
displayed for 1 s before the next trial. The test terminates after 40 trials.
4.2.4 Detection test
4.2.4.1 Introduction
The Detection test assesses the ability to extract biological motion from noise (e.g.
Bertenthal & Pinto, 1994; Cutting et al., 1988), a form of figure-ground segregation.
4.2.4.2 Stimuli
The stimuli consist of point-light displays created from the averaged Fourier-transformed
motion recordings of 50 men and 50 women walking (Troje, 2002a). The motion of a human
shown in profile view and facing either to the left or to the right is represented by 11 dots. The
walker is placed within a mask of scrambled walker noise. This mask consists of a specified
number of dots with the identical movement trajectories of the dots of the walker, with their
average location placed randomly within a square 5 × 5 degree region. The masking dots are the
same size and luminance as the walker dots. When the walker is absent, the number of masking
dots is increased by 11 to match the number of dots in the walker-present display. The walker, if
present, is offset from the center of the mask region by a random value between -0.5 and 0.5°
horizontally, and -1.5 and 1.5 vertically, so that it is not always in the same location but it also

82
remains completely within the masked region. The entire display was offset from the center of the
screen by 4° to the left in the first interval, and 4° to the right in the second interval.
4.2.4.3 Procedure
Two intervals are presented in each trial, with a 0.5 s delay between them. One interval
displays a region of masking noise containing the walker, while the other displays a region of
masking noise alone. The number of masking noise dots is set by a QUEST procedure. The order
of the intervals is randomized. After both intervals are displayed, participants click on a “First” or
“Second” button to indicate which interval contained the walker. A blank screen is displayed for
1 s before the next trial. The test terminates after 40 trials.
4.2.5 Direction test
4.2.5.1 Introduction
The Direction test assesses sensitivity to local biological motion invariants (e.g. Chang &
Troje, 2008, 2009a; Saunders et al., 2009; Troje & Westhoff, 2006), by measuring a participant’s
ability to determine walking direction from a spatially scrambled walker.
4.2.5.2 Stimuli
The stimuli consist of scrambled point-light displays created from averaged motion
capture recordings of human walking (Troje, 2002b). 15 dots represent the movement of the
major joints, as well as the chest and center of the pelvis. In each trial, the horizontal location of
each dot making up the walker is placed randomly within a 3 degree range, approximating the
width of a walker, while the vertical position is unchanged, for example keeping the dots
representing the feet near the bottom of the display. Compared to scrambling vertically and
horizontally, this provides a perceptually stronger local motion direction cue, while still
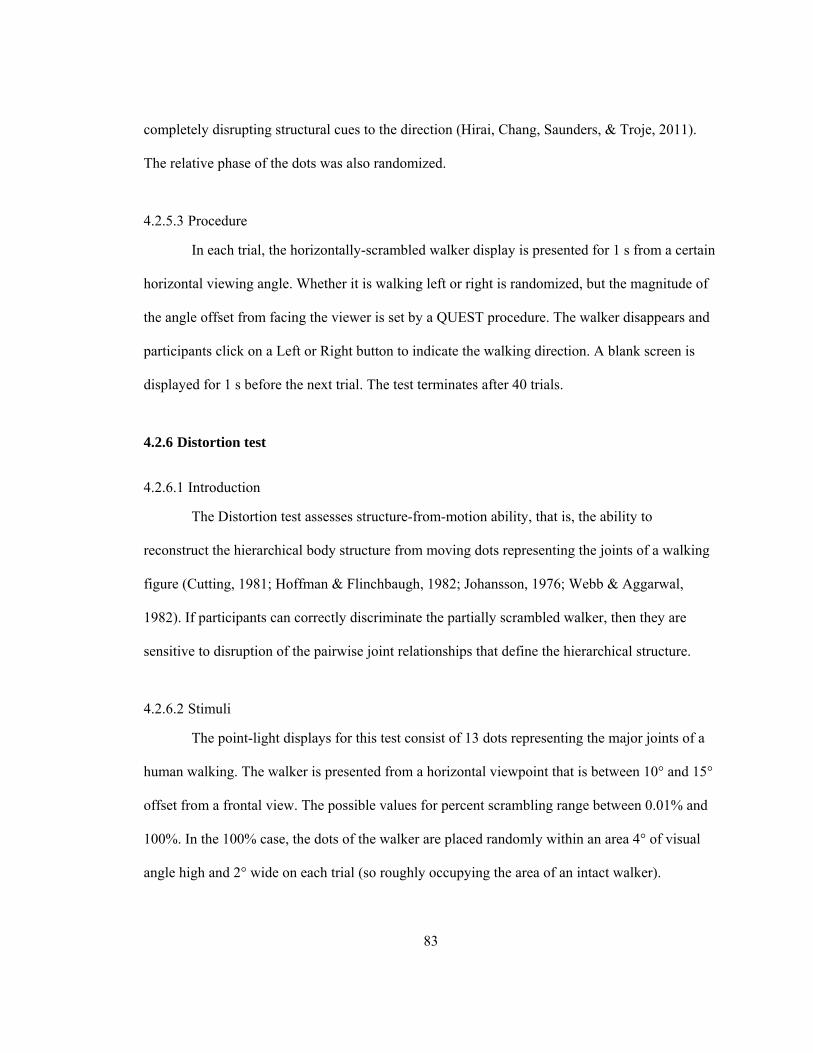
83
completely disrupting structural cues to the direction (Hirai, Chang, Saunders, & Troje, 2011).
The relative phase of the dots was also randomized.
4.2.5.3 Procedure
In each trial, the horizontally-scrambled walker display is presented for 1 s from a certain
horizontal viewing angle. Whether it is walking left or right is randomized, but the magnitude of
the angle offset from facing the viewer is set by a QUEST procedure. The walker disappears and
participants click on a Left or Right button to indicate the walking direction. A blank screen is
displayed for 1 s before the next trial. The test terminates after 40 trials.
4.2.6 Distortion test
4.2.6.1 Introduction
The Distortion test assesses structure-from-motion ability, that is, the ability to
reconstruct the hierarchical body structure from moving dots representing the joints of a walking
figure (Cutting, 1981; Hoffman & Flinchbaugh, 1982; Johansson, 1976; Webb & Aggarwal,
1982). If participants can correctly discriminate the partially scrambled walker, then they are
sensitive to disruption of the pairwise joint relationships that define the hierarchical structure.
4.2.6.2 Stimuli
The point-light displays for this test consist of 13 dots representing the major joints of a
human walking. The walker is presented from a horizontal viewpoint that is between 10° and 15°
offset from a frontal view. The possible values for percent scrambling range between 0.01% and
100%. In the 100% case, the dots of the walker are placed randomly within an area 4° of visual
angle high and 2° wide on each trial (so roughly occupying the area of an intact walker).

84
Scrambling values close to 0.01% produce only slight distortions in the locations of the walker
dots.
Walkers are placed randomly within a 3 × 3 degree region and presented from an
elevated vertical viewpoint such that the walker is tilted forward by 20°. These steps prevent
simple strategies for detecting distortion, such as comparing the second walker to the afterimage
of the first, or observing whether the hip dots are horizontally aligned. The entire display was
offset from the center of the screen by 4° to the left in the first interval, and 4° to the right in the
second interval.
4.2.6.3 Procedure
There are two intervals presented in each trial, with a 0.5 s delay between them. One
interval displays an intact walker and the other displays a partially scrambled walker, each for 1 s.
The percent scrambling is set by a QUEST procedure. The order of the intervals is randomized.
After both intervals are displayed, participants click on a “First was normal” or “Second was
normal” button to indicate which interval they thought contained the intact walker. A blank
screen is displayed for 1 s before the next trial. The test terminates after 40 trials.
4.2.7 Action test
4.2.7.1 Introduction
The Action test assesses action categorization (Dittrich, 1993; Johansson, 1973). The
nature of action categorization from point-light displays has been less carefully studied than other
abilities, but it has been frequently used as a task in special populations, such as brain lesion
patients (e.g. Heberlein, Adolphs, Tranel, & Damasio, 2004; McLeod et al., 1996; Vaina et al.,
2002). The Action test does not use an adaptive threshold procedure.

85
4.2.7.2 Stimuli
The stimuli consist of animations of a stick figure performing an action. The source for
the animations were motion capture recordings of men and women. Three unambiguous
depictions of each of the 10 actions were chosen, and the most representative 1 s segment from
each one was used.
4.2.7.3 Procedure
Each action is presented for 1 s. The point-light display disappears, and the participant
chooses the name of the action from a menu of buttons, consisting of “Catching”, “Climbing
stairs”, ”Jumping”, “Jumping jacks”, “Kicking”, “Lifting”, “Running”, “Sitting”, “Throwing”,
and “Walking”. A blank screen is displayed for 1 s before the next trial. Each action is presented
at three different viewpoints – 0° (facing the viewer), 30° and 90° (facing to the right) – for a total
of 30 trials.
4.2.8 Gender test
4.2.8.1 Introduction
The Gender test assesses sensitivity to the gender of a walker (e.g. Kozlowski & Cutting,
1977; Mather & Murdoch, 1994; Troje, 2002a), which is an example of biological motion style
recognition.
4.2.8.2 Stimuli
The stimuli consist of stick figures of human walking in place as viewed from an angle
randomly selected to be slightly offset from facing the viewer. The animations have a specified
gender level for each trial, which is achieved by using discriminant function analysis to create an
axis in the vector space defined by the motion-captured walking sequences of 50 men and 50

86
women that best captures the differences between male and female walks (Troje, 2002b). The
walkers also have an individual walking style, that is produced by adding a normally-distributed
random vector in the walker space with the same standard deviation as the real walking
sequences. Each participant sees the same set of individuals, but with different gender levels
applied to them according to the adaptive procedure.
4.2.8.3 Procedure
Each walker is presented for 1.5 s. When the walker disappears, the participant chooses
between two buttons labeled “Male” or “Female." On each trial the synthesized gender is either
male or female, with the degree of expression of that gender selected by one of two interleaved
QUEST procedures. Thus the test produces two thresholds at the end, one for detecting maleness
and one for detecting femaleness. There are a total of 80 trials, 40 trials for each staircase, with
the interleaving of male and female trials randomized once but fixed across participants. A blank
screen is displayed for 1 s before the next trial.
Once the two thresholds have been estimated, they represent two points on the
psychometric curve for discriminating male from female walkers. These points are fitted with a
logistic function. The gender test score is then the maximum slope of the curve, representing the
sensitivity. The gender response bias can also be determined from this curve, as the point of
intersection with the 50% correct level.
4.2.9 Identity test
4.2.9.1 Introduction
The Identity test assesses the ability to recognize people by their walking style (e.g.
Cutting & Kozlowski, 1977; Loula et al., 2005; Troje, Westhoff, & Lavrov, 2005). Memory for

87
three walkers is evaluated with a Naming and an Old-New subtest (in memory research terms, a
classification task and a recognition task respectively). Besides measuring person identification,
the Naming subtest assists in encoding the target walkers, since feedback is provided. Although
conceptually linked, the test scores from the two subtests were analyzed separately. The Identity
test did not use an adaptive threshold procedure.
4.2.9.2 Stimuli
The stimuli consist of stick figures depicting individual walking styles in the center of the
screen. To create the walkers, first the three target walkers that the participant must memorize
were generated. The goal was to obtain three random target walkers that shared approximately the
same absolute distinctiveness and the same pairwise similarity. Beginning with the motion
capture recordings of 50 men walking, the movement trajectories for each joint along each
dimension were reduced into a 15 dimensional vector space using principle component analysis
(Troje, 2002a). The similarity between walkers in this space can be approximated by the angle
between the vectors representing them, while the Euclidean distance from the origin, which
represents the average walk, roughly corresponds to the visually distinctiveness of the walk. We
randomly generated three vectors in the walker space at a fixed distance from the origin (and so a
fixed distinctiveness), and at a 120° angle from one another, maximizing and equating the
pairwise distance.
To create the distractor walkers, first an initial set of 150 distractors was produced by
randomly generating normally distributed vectors in the walker space. Therefore these walkers
had the same expected mean distinctiveness as the original population, and the same expected
distance from each of the target walkers. Then we used a pilot experiment to choose the
distractors that would produce a certain range of trial difficulties. The pilot experiment

88
participants were asked to memorize the target walkers, and then had alternating blocks of
Naming and Old-New trials as in the regular test. We then ranked the 150 walkers according to
the number of correct responses they achieved, then discarded the 15 walkers that had the best
performance and picked the 45 easiest walkers that remained to become the distractors.
A different procedure was used to create the stimuli for the first version of the Identity
test, used in Experiment 1, which was less effective at controlling the distinctiveness of the
walkers and the differences among them.
4.2.9.3 Procedure
There are five phases to the test: a memorization phase, a first Naming phase, a first Old-
New phase, a second Naming phase, and a second Old-New phase. Each participant sees the same
target and distractor walkers in the same order.
In the memorization phase, each of the three target walkers is presented with its name
printed below it, for 5 s at both a 0° and a 45° degree viewing angle (corresponding to a frontal
and half-profile view respectively) for a total of 6 presentations. There is a 1 s blank interval
between walkers.
In the Naming phases, on each trial one of the three target walkers is presented at a 0° or
45° viewing angle, with buttons corresponding to the three names underneath. The animation
continues until the participant chooses one of the names, at which point the participant receives
feedback and there is a 1 s blank interval. Each of the two Naming phases had 18 trials.
In the Old-New phases, on each trial either one of the target walkers or a distractor
walker is shown at a 0° or 45° viewing angle. Half of the trials are old and half are new, and each
of the target walkers is shown an equal number of times, whereas none of the distractors are
repeated. The animation continues until the participant clicks on the button marked “Old” (for a

89
target) or “New” (for a distractor) underneath. There is a 1 s blank interval before the next trial.
Each of the two Old-New phases had 45 trials.
4.3 Evaluation of BMLtest – Experiment 1
4.3.1 Introduction
In order to test the robustness of BMLtest in different settings, we had participants
complete a web-based version of the test at home and in the lab, and for each test examined the
correlation between individual performance in the two settings and differences in mean score.
4.3.2 Methods
4.3.2.1 Participants
There were 30 participants (13 male, 17 female), ranging in age from 18 to 42 (M =
22.8). They were primarily Queen’s University undergraduate or post-graduate students, but
several non-students were also included. They reported normal or corrected-to-normal vision.
They were compensated with a modest honorarium.
4.3.2.2 Procedure
Participants were randomly assigned to two groups. One group (‘Home first’) conducted
BMLtest in the home setting first and then later in the lab setting, while the other (‘Lab first’)
encountered the settings in the reverse order. There was an interval of at least 48 hours between
the first and second testing session. Each participant ran the complete battery in each setting, with
the tests in the order in which they are described above. They were instructed to try to reduce
distractions in their home environment, and to complete the tests in one sitting. Upon finishing
the test battery in the home setting, they answered a questionnaire that asked about their computer
hardware, and also included the questions, “Were there any distractions while you were

90
running?”, “At any point during a test did you take a break?” and “Did you notice any phenomena
while running it that seemed to be a problem with the program?”
4.3.2.3 Data analysis
For all analyses we removed only test scores for which QUEST failed to converge to a
threshold, which was defined as an absence of reversals in the last 15 trials and 5 or more trials
spent at the maximum stimulus intensity. Across all tests and participants 2.8% of test scores
were removed.
4.3.2.4 Apparatus & Stimuli
The lab setting was free of interruptions, and had a consistent display that was a CRT
with a display resolution of 1280 × 1024. In both the lab and the home setting participants did not
use a chinrest, but were asked to maintain a distance from the screen of approximately 60 cm.
Because of differing display devices in the home setting, the questionnaire responses were needed
to estimate the range of sizes of the display elements on the retina.
4.3.3 Results
4.3.3.1 Questionnaire responses
According to the post-test questionnaire, the diagonal measurement of the participants’
computer screens in the home setting ranged from 13 inches to over 20 inches, and the screen
resolutions from 1024 × 768 pixels to 1920 × 1200 pixels. Based on these ranges, and assuming
some inconsistency in the distance to the screen, the visual angle of elements could have varied
by as much as a factor of 2. However for a fixed viewing distance, the difference in size due to
computer monitors resolutions would have been relatively small: 90% of the reported resolution

91
and screen size combinations produced between 34 and 41 pixels per degree of visual angle, an
increase of only 24% from the smallest to the largest.
Many participants took the tests on a laptop, judging by the fact that 13 of the 30
participants had a monitor that was less than 15 inches diagonally. Of the 15 who replied to a
question about the clock speed of their computer, the average was 1.98 GHz, and the range was
800 MHz to 2.83 GHz. For all participants and all tests the average framerate was always over 24
frames per second, and examination of framerates for individual trials strongly suggested that
instances of the framerate dropping were rare. In response to the item on the questionnaire about
phenomena in the display, only two reported seeing brief stuttering in the animation. Therefore it
appears that the computers used by the participants at home were adequate for running BMLtest.
Distractions were a frequent occurrence in the home setting. Of the 30 participants, 18
reported at least one source of distraction during the tests. The most commonly mentioned (6 out
of 18) were calls or text messages on their cellphone. Another distraction mentioned more than
once was someone in the room talking to the participant. Other distractions included “music
playing”, “Alert on computer”, “my cat jumping onto the computer desk”, and “eating at the same
time”. Based on responses to the distraction question, at least three participants completed the
battery at work, and at least one in a public library. No participant reported taking a break during
a test, which was corroborated by the rarity of outlier test durations. However 14 of the 30
reported taking a break between tests.
4.3.3.2 Practice and setting effects
The time between the first and second sessions ranged from 2 days to 33 days, with the
median being 5 days. For each test we conducted a mixed-model ANOVA on the mean scores,
with the group (‘Home first’ or ‘Lab first’) as a between-subjects factor and session (‘First’ or

92
Coherence test
0
5
10
15
Lab Home
Detection test
020406080
Lab Home
Direction test
0
20
40
60
Lab Home
Distortion test
02468
Lab Home
Gender test
0.00.10.20.30.4
Lab Home
Identity - Naming
0
50
100
Lab Home
Identity - Old-New
0.0
0.5
1.0
1.5
Lab Home
* *Action test
0
50
100
Lab Home
Figure 4.2. Mean test scores in the lab and home settings. Units for each of the test scores are explained in Figure 4.1. The error bars represent ±1 SEM. * indicates a significant mean difference, p < .05.
‘Second’) as a within-subjects factor. As expected from the random group assignment, none of
the ANOVAs showed a significant main effect of group. However an interaction between the
group and session factors would indicate a difference between performance in the lab and home
settings.
The Coherent, Detection, Direction, Distortion, and Action tests did not have a significant
interaction between group and session, p > .18, corresponding to no evidence for a difference
between lab and home performance (Figure 4.2). The Coherence test had significant improvement
between the first and the second times the participant was tested, F(1, 28) = 4.89, p < .05, as did
the Detection test, F(1, 28) = 4.90, p < .05, and the Action test, F(1, 28) = 7.39, p < .05. The
ANOVA for the Identity – Old-New test did show signs of an interaction, and therefore an effect
of setting, F(1, 28) = 0.78, p = .06, but they did not reach statistical significance. There was
strong evidence for an improvement in performance between the first and second sessions of the
Old-New test (M = 0.86 vs. M = 1.38), F(1, 28) = 18.80, p < .001.

93
On the other hand, the ANOVAs for the Gender and Identity – Naming tests did have
significant interactions between group and session, F(1, 25) = 5.47, p = .028 and F(1, 28) = 9.05,
p = .005 respectively, indicating an influence of testing setting on performance. There was no
main effect of session for the Gender test, F(1, 25) = 0.14, p = .71, so we conducted a paired t test
for Home vs. Lab, averaging between participants for whom the lab session was their first time
and for whom it was their second time. Participants running the test in the lab were significantly
better (had steeper gender discrimination slopes) than participants running the test in their homes
(M = 0.33 vs. M = 0.27), t(26) = 2.36, p < .05. Since the Identity – Naming test had a significant
main effect of session, indicating a practice effect, we conducted separate paired t tests for Home
vs. Lab for the Lab First and Home First participants. There was no difference in mean
performance between the home and lab setting for the Lab First participants, t(14) = 0.52, p = .61,
but performance at home was significantly worse than in the lab setting for the Home First
participants, t(14) = 3.50, p = .003. Therefore there was a benefit for the Naming test both for
running it in the lab vs. home (M = 83% vs. 76%) and for running it a second time vs. the first
time (M = 82% vs. 77%).
In summary, experience appeared to improve performance in the Coherent, Detection,
Action, and both Identity tests, and a lab setting led to better performance in the Gender and
Identity – Naming tests.
A Pearson correlation coefficient between individual performances at home and in the lab
found significant correlations for the Coherent, Detection, Distortion, Action, and both Identity
tests (Table 4.1). Direction and Gender were not significantly correlated. In the case of the
Gender test, both the individual male and female thresholds that are used to compute the slope of
the Gender psychometric curve had highly significant test-retest correlations, at r(28) = .56, p =
.001 and r(28) = .48, p = .007, as did the gender bias, at r(28) = .64, p < .001.

94
Table 4.1
Experiment 1 Home-Lab Correlation
Test r
Coherent .61**
Detection .39*
Direction .26
Distortion .63**
Action .61**
Gender .05
Identity – Naming .60**
Identity – Old-New .47*
* indicates p < .05,
** indicates p < .001
4.3.4 Discussion
The majority of the tests in the battery had similar mean scores in a lab or home setting,
and a significant correlation between scores at home and in the lab, suggesting that the test is
robust to different settings with differing visual and attentional parameters. The two tests that did
show somewhat poorer performance at home were the Gender test and the Identity test, which
may have been more vulnerable to distractions since they required access to high-level
representations of movement styles.
Gender test scores and Direction test scores did not correlate significantly between the
home and the lab. Some aspects of Gender perception were measured adequately, as can be seen
from the male and female test-retest reliability, but estimating the slope of a psychometric curve
generally requires a higher level of precision (Turpin, Jankovic, & McKendrick, 2010), so it is
possible there was not enough variance in this particular population to reliability detect the test-
retest consistency with this sample size. The lack of correlation in the Direction test may have

95
been the result of a floor effect, since 10 out of the 60 thresholds measured for the viewing angle
were the maximum stimulus intensity of 90°, indicating that even for this strongest stimulus
(representing a profile-view scrambled walker) many participants may not have been able to
achieve the target 82% threshold.
4.4 Evaluation of BMLtest – Experiment 2
4.4.1 Introduction
The purpose of Experiment 2 was to estimate the mean and standard deviation of the
scores for all the tests in a particular population (normal undergraduate students), and to estimate
the test-retest reliability of the final version of BMLtest. Experiment 2 also provided data for an
individual differences analysis to examine whether the tests measured different or overlapping
underlying processes. Between Experiment 1 and 2, the method of generating the target and
distractor walkers for the Identity test was changed, and the target threshold for the Direction test
was lowered from 82% to 75%, so that a greater proportion of test subjects could achieve that
performance level within the range of possible stimulus intensities.
4.4.2 Methods
There were 65 new participants (38 female, 27 male), ranging in age from 18 to 43 (M =
19.2), recruited from first year undergraduate Psychology and compensated with either course
credit or an honorarium. They received instructions by email and completed the tests in the
battery in the order in which they are described above using their web browser. They were
instructed to run BMLtest again one week later. Only participants whose second session was
within one day of this criterion were included in the analysis.

96
Test scores were selected for elimination if there was evidence the QUEST procedure had
not converged after 40 trials, as in Experiment 1. One participant’s Direction test score was
eliminated because of a clear loss of attention part way through the task (82% correct in first half,
30% correct in the second half, even though the trials in the second half were easier on average).
Including a further participant who did not complete the Identity test, 1.5% of the test scores were
absent.
4.4.3 Results
The median time to complete the battery was 32 minutes, and 90% of the sessions took
less than 40 minutes including time reading the instructions and practicing.
Test-retest reliabilities for all the tests of the battery were significant at p < .001 (Table
4.2). We examined the correlations between the scores of individuals on different tests (Table
4.3), using only their first sessions because of the effect of practice. A sequential Bonferonni
Table 4.2
Experiment 2 Test-Retest Reliability
Test r
Coherent .46**
Detection .42**
Direction .58**
Distortion .50**
Action .48**
Gender .55**
Identity – Naming .46**
Identity – Old-New .50**
** indicates p < .001

Table 4.3
Experiment 2 Intercorrelations Between Biological Motion Tests
Test 1 2 3 4 5 6 7 8
1. Coherent — .07 .05 .06 .13 -.04 .13 .24
2. Detection — .08 -.28 .30 .00 .33 .32
3. Direction — -.11 -.07 -.10 .17 -.17
4. Distortion — -.26 .24 -.20 -.25
5. Action — -.07 .23 .24
6. Gender — -.03 .15
7. Identity – Naming — .51*
8. Identity – Old-New —
* indicates significance at .05 after correcting using sequential Bonferroni
** indicates p < .001
correction was applied to the tests of significance. Only the correlation between the Naming and
the Old-New subtests of the Identity test was significant. Although all the other correlations were
nonsignificant after correction for multiple comparisons, the Coherent and Direction tests in
particular had little evidence of an association with the other tests, average r2 = 0.014 and 0.015
respectively.
As an additional test of reliability, we compared test scores for the first session of
Experiment 2 with the test scores from the first session of Experiment 1, which used a different
set of participants (Figure 4.3). For all the scores, a t test not assuming equal variance did not
show a significant difference from the previous experiment, with the exception of the Identity –
Naming subtest, t(72.8) = -2.53, p = .014.
There was strong evidence for practice effects in Experiment 2, with a significant mean
improvement between the first and second sessions in the Detection, Direction, Naming and Old-
New tests, paired t tests, p < .005.
97
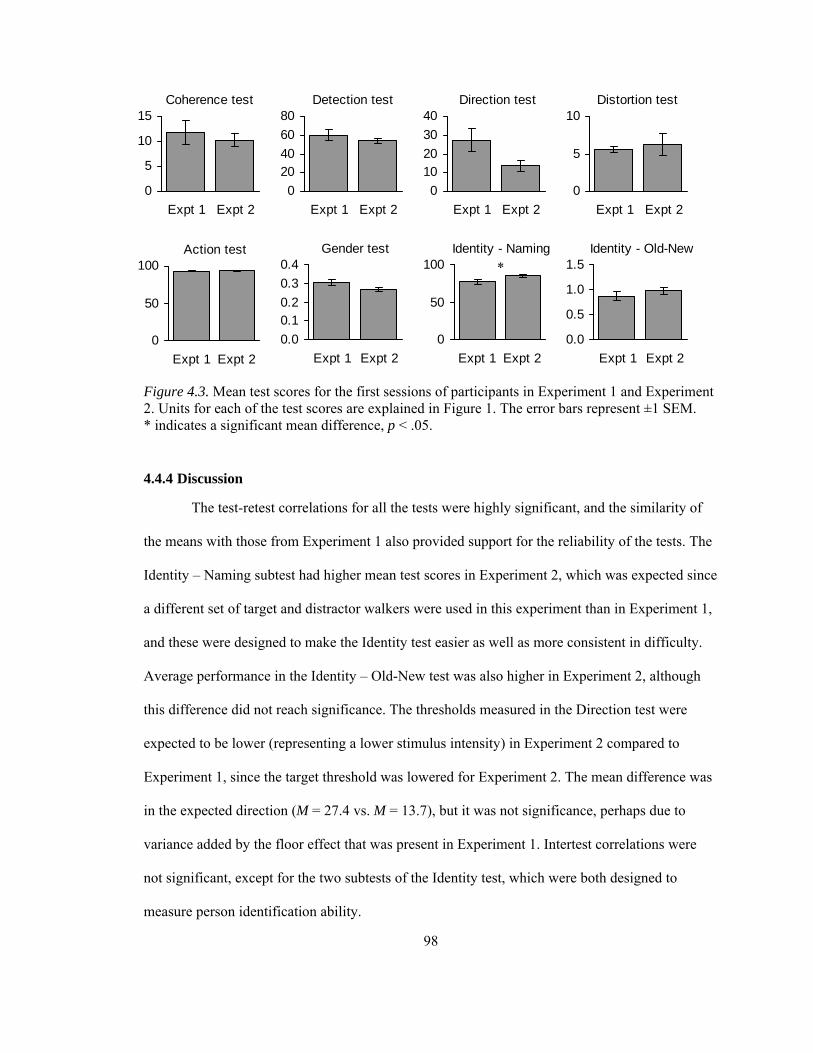
98
Coherence test
0
5
10
15
Expt 1 Expt 2
Detection test
020406080
Expt 1 Expt 2
Direction test
010203040
Expt 1 Expt 2
Distortion test
0
5
10
Expt 1 Expt 2
4.4.4 Discussion
The test-retest correlations for all the tests were highly significant, and the similarity of
the means with those from Experiment 1 also provided support for the reliability of the tests. The
Identity – Naming subtest had higher mean test scores in Experiment 2, which was expected since
a different set of target and distractor walkers were used in this experiment than in Experiment 1,
and these were designed to make the Identity test easier as well as more consistent in difficulty.
Average performance in the Identity – Old-New test was also higher in Experiment 2, although
this difference did not reach significance. The thresholds measured in the Direction test were
expected to be lower (representing a lower stimulus intensity) in Experiment 2 compared to
Experiment 1, since the target threshold was lowered for Experiment 2. The mean difference was
in the expected direction (M = 27.4 vs. M = 13.7), but it was not significance, perhaps due to
variance added by the floor effect that was present in Experiment 1. Intertest correlations were
not significant, except for the two subtests of the Identity test, which were both designed to
measure person identification ability.
Figure 4.3. Mean test scores for the first sessions of participants in Experiment 1 and Experiment 2. Units for each of the test scores are explained in Figure 1. The error bars represent ±1 SEM. * indicates a significant mean difference, p < .05.
Gender test
0.00.10.20.30.4
Expt 1 Expt 2
Identity - Naming
0
50
100
Expt 1 Expt 2
Identity - Old-New
0.0
0.5
1.0
1.5
Expt 1 Expt 2
Action test
0
50
100
Expt 1 Expt 2
*

99
4.5 General Discussion
We have presented two experiments which together suggest that BMLtest is effective in
both a lab and a home setting. The participants were normal university students, a homogenous
population that nevertheless provided an estimate of the distribution of test scores in younger
adults, and a basis to test for relationships between the tasks using individual differences. Some
aspects of BMLtest might need to be adjusted for special populations such as children and people
with autism. However the use of an adaptive threshold procedure for many of the tests means that
a wide range of ability levels can be measured.
Estimated test-retest reliabilities fell below the recommended level for psychological tests
of 0.7 (Urbina, 2004), but they were approximately within the range measured for tests of
memory (Bird, Papadopoulou, Ricciardelli, Rossor, & Cipolotti, 2003) and several visual
perception tests, including the DTVP-A, MVPT-3 and Test of Visual Perceptual Skills (Brown,
Mullins, & Stagnitti, 2008). The test-retest reliability was also likely underestimated because of
the presence of practice effects for several of the tests (McIntire & Miller, 2007). Nevertheless,
based on the measurement error that the test-retest reliability implies, a single administration may
not be sufficient for assessing individual patients, but rather scores from more than one session
should be averaged together. On the other hand, for many studies examining group differences a
single session will suffice. The fact that normal participants typically complete all tests in a little
over 30 minutes, with individual tests taking 2–5 minutes, makes the individual tests and
BMLtest as a whole good candidates to be used in testing sessions alongside other assessment
tools, without requiring expertise in biological motion perception or psychophysics.
The fact that performance on individual tests generally did not predict performance on
other tests is evidence that the tests measure relatively independent abilities. Although
considerations of power mean that all the nonsignificant correlations cannot be confidently
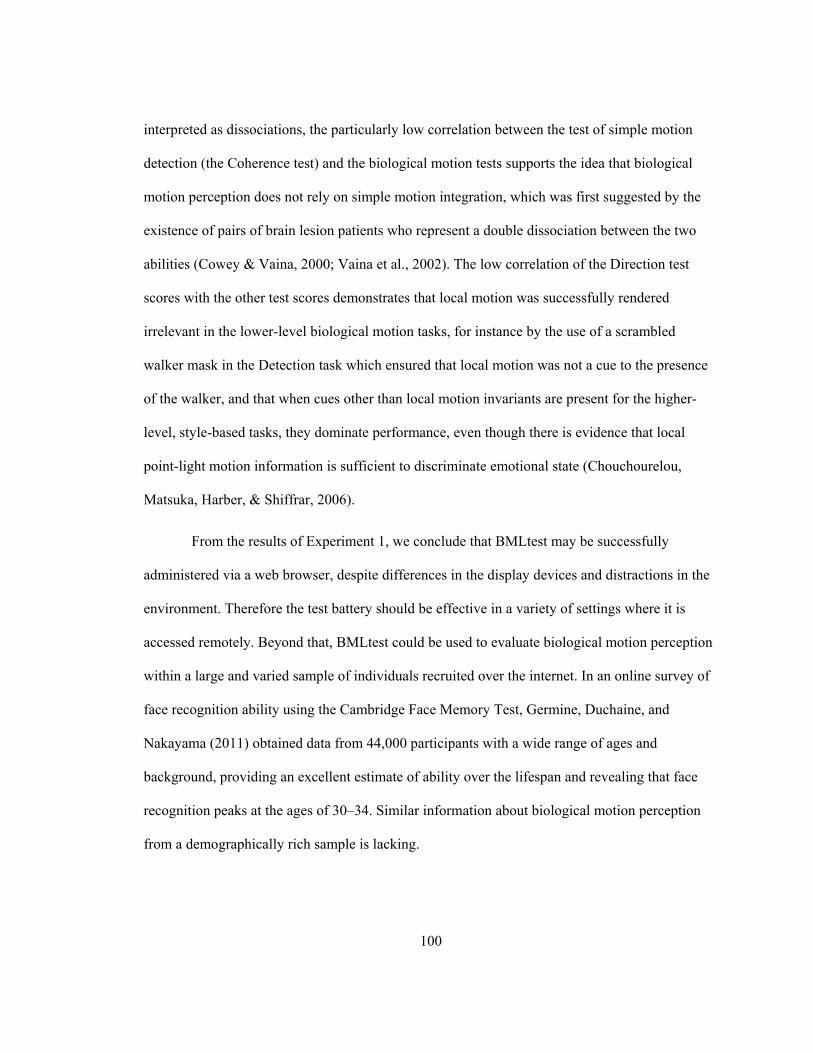
100
interpreted as dissociations, the particularly low correlation between the test of simple motion
detection (the Coherence test) and the biological motion tests supports the idea that biological
motion perception does not rely on simple motion integration, which was first suggested by the
existence of pairs of brain lesion patients who represent a double dissociation between the two
abilities (Cowey & Vaina, 2000; Vaina et al., 2002). The low correlation of the Direction test
scores with the other test scores demonstrates that local motion was successfully rendered
irrelevant in the lower-level biological motion tasks, for instance by the use of a scrambled
walker mask in the Detection task which ensured that local motion was not a cue to the presence
of the walker, and that when cues other than local motion invariants are present for the higher-
level, style-based tasks, they dominate performance, even though there is evidence that local
point-light motion information is sufficient to discriminate emotional state (Chouchourelou,
Matsuka, Harber, & Shiffrar, 2006).
From the results of Experiment 1, we conclude that BMLtest may be successfully
administered via a web browser, despite differences in the display devices and distractions in the
environment. Therefore the test battery should be effective in a variety of settings where it is
accessed remotely. Beyond that, BMLtest could be used to evaluate biological motion perception
within a large and varied sample of individuals recruited over the internet. In an online survey of
face recognition ability using the Cambridge Face Memory Test, Germine, Duchaine, and
Nakayama (2011) obtained data from 44,000 participants with a wide range of ages and
background, providing an excellent estimate of ability over the lifespan and revealing that face
recognition peaks at the ages of 30–34. Similar information about biological motion perception
from a demographically rich sample is lacking.

101
Since biological motion perception is more than one phenomenon, a multiple-task battery
is needed to adequately assess it, and to begin to disentangle the underlying processes that make
this ability possible. BMLtest represents such a tool.

102
References
Anderson, A. J. (2003). Utility of a dynamic termination criterion in the ZEST adaptive threshold
method. Vision Research, 43(2), 165-170.
Atkinson, A. P. (2009). Impaired recognition of emotions from body movements is associated
with elevated motion coherence thresholds in autism spectrum disorders.
Neuropsychologia, 47(13), 3023-3029.
Battelli, L., Cavanagh, P., & Thornton, I. M. (2003). Perception of biological motion in parietal
patients. Neuropsychologia, 41(13), 1808-1816.
Beintema, J. A., Georg, K., & Lappe, M. (2006). Perception of biological motion from limited-
lifetime stimuli. Perception & Psychophysics, 68(4), 613-624.
Beintema, J. A., & Lappe, M. (2002). Perception of biological motion without local image
motion. Proceedings of the National Academy of Sciences of the United States of
America, 99(8), 5661-5663.
Bertenthal, B. I., & Pinto, J. (1994). Global processing of biological motions. Psychological
Science, 5(4), 221-225.
Billino, J., Braun, D. I., Bohm, K. D., Bremmer, F., & Gegenfurtner, K. R. (2009). Cortical
networks for motion processing: Effects of focal brain lesions on perception of different
motion types. Neuropsychologia, 47(10), 2133-2144.
Bird, C. M., Papadopoulou, K., Ricciardelli, P., Rossor, M. N., & Cipolotti, L. (2003). Test-retest
reliability, practice effects and reliable change indices for the recognition memory test.
British Journal of Clinical Psychology, 42, 407-425.
Birnbaum, M. H. (2004). Human research and data collection via the Internet. Annual Review of
Psychology, 55, 803-832.

103
Bosbach, S., Prinz, W., & Kerzel, D. (2004). A Simon effect with stationary moving stimuli.
Journal of Experimental Psychology: Human Perception and Performance, 30(1), 39-55.
Brown, T., Mullins, E., & Stagnitti, K. (2008). The reliability of performance of healthy adults on
three visual perception tests. British Journal of Occupational Therapy, 71(10), 438(410).
Casile, A., & Giese, M. A. (2005). Critical features for the recognition of biological motion.
Journal of Vision, 5(4), 348-360.
Chang, D. H. F., & Troje, N. F. (2008). Perception of animacy and direction from local biological
motion signals. Journal of Vision, 8(5), 1-10.
Chang, D. H. F., & Troje, N. F. (2009a). Acceleration carries the local inversion effect in
biological motion perception. Journal of Vision, 1(9), 1-17.
Chang, D. H. F., & Troje, N. F. (2009b). Characterizing global and local mechanisms in
biological motion perception. Journal of Vision, 9(5), 1-10.
Chouchourelou, A., Matsuka, T., Harber, K., & Shiffrar, M. (2006). The visual analysis of
emotional actions. Social Neuroscience, 1(1), 63-74.
Cowey, A., & Vaina, L. M. (2000). Blindness to form from motion despite intact static form
perception and motion detection. Neuropsychologia, 38(5), 566-578.
Cutting, J. E. (1978). Program to generate synthetic walkers as dynamic point-light displays.
Behavior Research Methods & Instrumentation, 10(1), 91-94.
Cutting, J. E. (1981). Coding theory adapted to gait perception. Journal of Experimental
Psychology: Human Perception and Performance, 7(1), 71-87.
Cutting, J. E., & Kozlowski, L. T. (1977). Recognizing friends by their walk: Gait perception
without familiarity cues. Bulletin of the Psychonomic Society, 9(5), 353-356.
Cutting, J. E., Moore, C., & Morrison, R. (1988). Masking the motions of human gait. Perception
& Psychophysics, 44(4), 339-347.

104
Dittrich, W. H. (1993). Action categories and the perception of biological motion. Perception,
22(1), 15-22.
Dittrich, W. H., Troscianko, T., Lea, S. E. G., & Morgan, D. (1996). Perception of emotion from
dynamic point-light displays represented in dance. Perception, 25(6), 727-738.
Fujimoto, K. (2003). Motion induction from biological motion. Perception, 32(10), 1273-1277.
Germine, L. T., Duchaine, B., & Nakayama, K. (2011). Where cognitive development and aging
meet: Face learning ability peaks after age 30. Cognition, 118(2), 201-210.
Grossman, E. D., Blake, R., & Kim, C. Y. (2004). Learning to see biological motion: Brain
activity parallels behavior. Journal of Cognitive Neuroscience, 16(9), 1669-1679.
Gurnsey, R., Roddy, G., Ouhnana, M., & Troje, N. F. (2008). Stimulus magnification equates
identification and discrimination of biological motion across the visual field. Vision
Research, 48(28), 2827-2834.
Heberlein, A. S., Adolphs, R., Tranel, D., & Damasio, H. (2004). Cortical regions for judgments
of emotions and personality traits from point-light walkers. Journal of Cognitive
Neuroscience, 16(7), 1143-1158.
Herrington, J. D., Baron-Cohen, S., Wheelwright, S. J., Singh, K. D., Bullmore, E. I., Brammer,
M., et al. (2007). The role of MT+/V5 during biological motion perception in Asperger
Syndrome: An fMRI study. Research in Autism Spectrum Disorders, 1(1), 14-27.
Hirai, M., Chang, D. H. F., Saunders, D. R., & Troje, N. F. (2011). Body configuration modulates
the usage of local cues to direction in biological motion perception. Manuscript submitted
for publication.
Hoffman, D. D., & Flinchbaugh, B. E. (1982). The interpretation of biological motion. Biological
Cybernetics, 42(3), 195-204.

105
Hubert, B., Wicker, B., Moore, D. G., Monfardini, E., Duverger, H., Da Fonseca, D., et al.
(2007). Brief report: Recognition of emotional and non-emotional biological motion in
individuals with autistic spectrum disorders. Journal of Autism and Developmental
Disorders, 37(7), 1386-1392.
Ikeda, H., Blake, R., & Watanabe, K. (2005). Eccentric perception of biological motion is
unscalably poor. Vision Research, 45(15), 1935-1943.
Johansson, G. (1973). Visual perception of biological motion and a model for its analysis.
Perception & Psychophysics, 14(2), 201-211.
Johansson, G. (1976). Spatio-temporal differentiation and integration in visual motion perception:
Experimental and theoretical analysis of calculus-like functions in visual data processing.
Psychological Research, 38(4), 379-393.
Klin, A., Sparrow, S. S., de Bildt, A., Cicchetti, D. V., Cohen, D. J., & Volkmar, F. R. (1999). A
normed study of face recognition in autism and related disorders. Journal of Autism and
Developmental Disorders, 29(6), 499-508.
Koldewyn, K., Whitney, D., & Rivera, S. M. (2010). The psychophysics of visual motion and
global form processing in autism. Brain, 133, 599-610.
Kosslyn, S. M., Brunn, J., Cave, K. R., & Wallach, R. W. (1984). Individual differences in mental
imagery ability: A computational analysis. Cognition, 18(1-3), 195-243.
Kozlowski, L. T., & Cutting, J. E. (1977). Recognizing sex of a walker from a dynamic point-
light display. Perception & Psychophysics, 21(6), 575-580.
Lange, J., & Lappe, M. (2007). The role of spatial and temporal information in biological motion
perception. Advances in Cognitive Psychology, 3(4), 419-428.

106
Loula, F., Prasad, S., Harber, K., & Shiffrar, M. (2005). Recognizing people from their
movement. Journal of Experimental Psychology: Human Perception and Performance,
31(1), 210-220.
Mather, G., & Murdoch, L. (1994). Gender discrimination in biological motion displays based on
dynamic cues. Proceedings of the Royal Society of London Series B: Biological Sciences,
258(1353), 273-279.
Mather, G., Radford, K., & West, S. (1992). Low-level visual processing of biological motion.
Proceedings of the Royal Society of London Series B: Biological Sciences, 249(1325),
149-155.
McIntire, S. A., & Miller, L. A. (2007). Foundations of psychological testing: A practical
approach (2nd ed.). Thousand Oaks, Calif.: Sage Publications.
McLeod, P., Dittrich, W., Driver, J., Perrett, D., & Zihl, J. (1996). Preserved and impaired
detection of structure from motion by a ‘‘motion-blind’’ patient. Visual Cognition, 3(4),
363-391.
Moore, D. G., Hobson, R. P., & Lee, A. (1997). Components of person perception: An
investigation with autistic, non-autistic retarded and typically developing children and
adolescents. British Journal of Developmental Psychology, 15, 401-423.
Murphy, P., Brady, N., Fitzgerald, M., & Troje, N. F. (2009). No evidence for impaired
perception of biological motion in adults with autistic spectrum disorders.
Neuropsychologia, 47(14), 3225-3235.
Newsome, W. T., & Paré, E. B. (1988). A selective impairment of motion perception following
lesions of the middle temporal visual area (MT). Journal of Neuroscience, 8(6), 2201-
2211.

107
Olofsson, U., Nyberg, L., & Nilsson, L. G. (1997). Priming and recognition of human motion
patterns. Visual Cognition, 4(4), 373-382.
Oram, M. W., & Perrett, D. I. (1996). Integration of form and motion in the anterior superior
temporal polysensory area (STPa) of the macaque monkey. Journal of Neurophysiology,
76(1), 109-129.
Parron, C., Da Fonseca, D., Santos, A., Moore, D. G., Monfardini, E., & Deruelle, C. (2008).
Recognition of biological motion in children with autistic spectrum disorders. Autism,
12(3), 261-274.
Pavlova, M., & Sokolov, A. (2000). Orientation specificity in biological motion perception.
Perception & Psychophysics, 62(5), 889-899.
Pilz, K. S., Bennett, P. J., & Sekuler, A. B. (2010). Effects of aging on biological motion
discrimination. Vision Research, 50(2), 211-219.
Pollick, F. E., Paterson, H. M., Bruderlin, A., & Sanford, A. J. (2001). Perceiving affect from arm
movement. Cognition, 82(2), B51-B61.
Saunders, D. R., Suchan, J., & Troje, N. F. (2009). Off on the wrong foot: Local features in
biological motion. Perception, 38(4), 522-532.
Saygin, A. P., Cook, J., & Blakemore, S. J. (2010). Unaffected perceptual thresholds for
biological and non-biological form-from-motion perception in autism spectrum
conditions. Plos One, 5(10).
Schenk, T., & Zihl, J. (1997). Visual motion perception after brain damage: II. Deficits in form-
from-motion perception. Neuropsychologia, 35(9), 1299-1310.
Simion, F., Regolin, L., & Bulf, H. (2008). A predisposition for biological motion in the newborn
baby. Proceedings of the National Academy of Sciences of the United States of America,
105(2), 809-813.

108
Thompson, B., Hansen, B. C., Hess, R. F., & Troje, N. F. (2007). Peripheral vision: Good for
biological motion, bad for signal noise segregation? Journal of Vision, 7(10), 1-7.
Troje, N. F. (2002a). Decomposing biological motion: A framework for analysis and synthesis of
human gait patterns. Journal of Vision, 2(5), 371-387.
Troje, N. F. (2002b). The little difference: Fourier based synthesis of gender-specific biological
motion. In R. P. Würtz & M. Lappe (Eds.), Dynamic Perception (pp. 115-120). Berlin:
AKA Press.
Troje, N. F. (2008). Biological motion perception. In A. Basbaum, M. Bushnell, D. Smith, G.
Beauchamp, S. Firestein, P. Dallos, D. Oertel, R. Masland, T. Albright, J. Kaas & E.
Gardner (Eds.), The Senses: A Comprehensive Reference (Vol. 2, pp. 231-238):
Academic Press.
Troje, N. F., & Westhoff, C. (2006). The inversion effect in biological motion perception:
Evidence for a ‘life detector’? Current Biology, 16(8), 821-824.
Troje, N. F., Westhoff, C., & Lavrov, M. (2005). Person identification from biological motion:
Effects of structural and kinematic cues. Perception & Psychophysics, 67(4), 667-675.
Turpin, A., Jankovic, D., & McKendrick, A. (2010). Identifying steep psychometric function
slope quickly in clinical applications. Vision Research, 50(23), 2476-2485.
Urbina, S. (2004). Essentials of psychological testing. Hoboken, N.J.: John Wiley & Sons.
Vaina, L. M. (1994). Functional segregation of color and motion processing in the human visual
cortex: Clinical evidence. Cerebral Cortex, 4(5), 555-572.
Vaina, L. M., Cowey, A., LeMay, M., Bienfang, D. C., & Kikinis, R. (2002). Visual deficits in a
patient with ‘kaleidoscopic disintegration of the visual world’. European Journal of
Neurology, 9(5), 463-477.

109
Vaina, L. M., & Gross, C. G. (2004). Perceptual deficits in patients with impaired recognition of
biological motion after temporal lobe lesions. Proceedings of the National Academy of
Sciences of the United States of America, 101(48), 16947-16951.
Vaina, L. M., Solomon, J., Chowdhury, S., Sinha, P., & Belliveau, J. W. (2001). Functional
neuroanatomy of biological motion perception in humans. Proceedings of the National
Academy of Sciences of the United States of America, 98(20), 11656-11661.
Vallortigara, G., Regolin, L., & Marconato, F. (2005). Visually inexperienced chicks exhibit
spontaneous preference for biological motion patterns. PLoS Biology, 3(7), 1312-1316.
Watson, A. B., & Fitzhugh, A. (1990). The method of constant stimuli is inefficient. Perception
& Psychophysics, 47(1), 87-91.
Watson, A. B., & Pelli, D. G. (1983). QUEST: A Bayesian adaptive psychometric method.
Perception & Psychophysics, 33(2), 113-120.
Webb, J. A., & Aggarwal, J. K. (1982). Structure from motion of rigid and jointed objects.
Artificial Intelligence, 19(1), 107-130.
Westhoff, C., & Troje, N. F. (2007). Kinematic cues for person identification from biological
motion. Perception & Psychophysics, 69(2), 241-253.
Wilmer, J. B. (2008). How to use individual differences to isolate functional organization,
biology, and utility of visual functions; with illustrative proposals for stereopsis. Spatial
Vision, 21(6), 561-579.
110
Chapter 5
General Discussion
5.1 Biological motion perception is more than one phenomenon
The results presented in Chapters 2 and 3 support the assertion by Troje and Westhoff
(2006) that biological motion perception is not a single phenomenon. Different performance
characteristics were seen when different tasks were used: in the case of Chapter 2, different
sensitivity to the form of local motion trajectories, and in Chapter 3, different patterns of gaze
fixation. The task differences were the result of various underlying processing components
playing a greater or lesser role. Chapter 4 explicitly described a model of the components of
biological motion perception, including processing of local motion invariants, structure-from-
motion, figure-ground segregation, action categorization, and style recognition. It also provided a
tool for assessing the components separately, and so avoiding the confounding that is inherent in
many tasks that are in use.
The central inspiration for this framework was the evidence from Troje and Westhoff
(2006) that there is a separate process of biological motion perception that does not require
configural information, and that has its own distinct inversion effect. There has been subsequent
empirical support for this idea, in addition to the experiments reported here. Local motion
trajectories that are consistent with a living creature are of particular interest to visually
inexperienced newborn chicks (Vallortigara & Regolin, 2006; Vallortigara, Regolin, &
Marconato, 2005) and 2-day-old infants (Simion, Regolin, & Bulf, 2008); they give an
impression of animacy (Chang & Troje, 2008); they can portray emotional state (Chouchourelou,
Matsuka, Harber, & Shiffrar, 2006); and they can be processed preattentively, facilitating
attentional orientation to them (Hirai, Saunders, & Troje, 2010; Jiang, Wang, Zhang, & He,
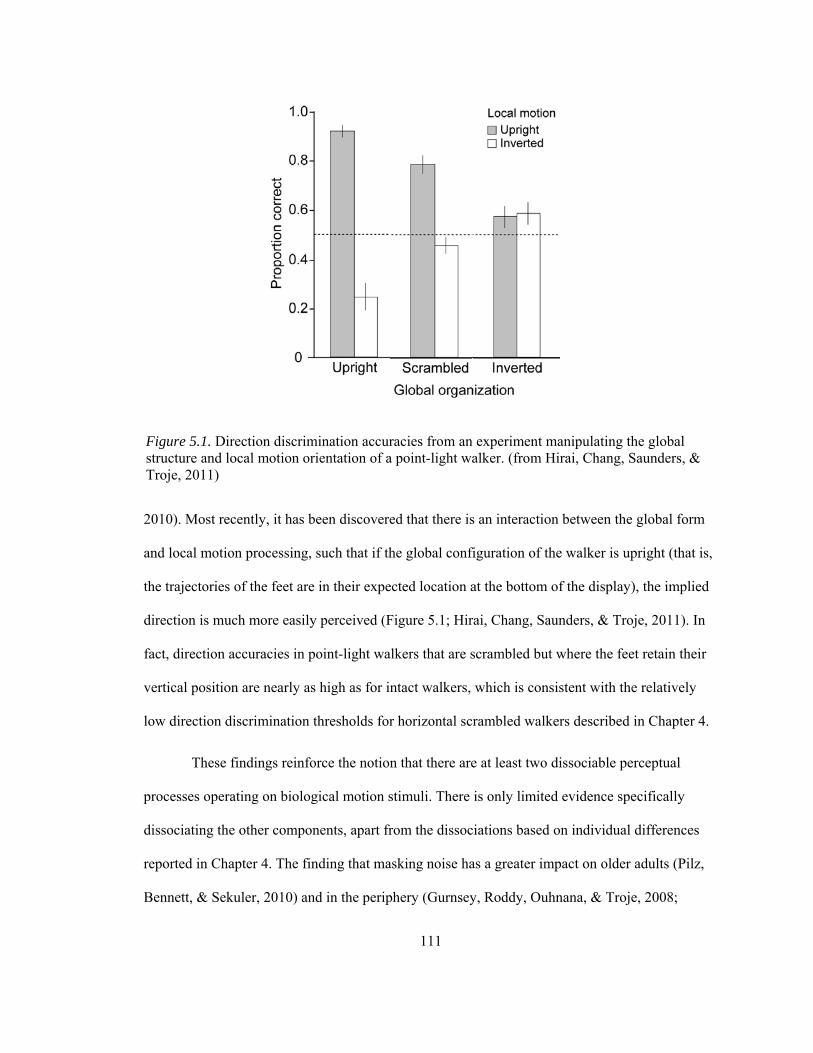
111
Figure 5.1. Direction discrimination accuracies from an experiment manipulating the global structure and local motion orientation of a point-light walker. (from Hirai, Chang, Saunders, & Troje, 2011)
2010). Most recently, it has been discovered that there is an interaction between the global form
and local motion processing, such that if the global configuration of the walker is upright (that is,
the trajectories of the feet are in their expected location at the bottom of the display), the implied
direction is much more easily perceived (Figure 5.1; Hirai, Chang, Saunders, & Troje, 2011). In
fact, direction accuracies in point-light walkers that are scrambled but where the feet retain their
vertical position are nearly as high as for intact walkers, which is consistent with the relatively
low direction discrimination thresholds for horizontal scrambled walkers described in Chapter 4.
These findings reinforce the notion that there are at least two dissociable perceptual
processes operating on biological motion stimuli. There is only limited evidence specifically
dissociating the other components, apart from the dissociations based on individual differences
reported in Chapter 4. The finding that masking noise has a greater impact on older adults (Pilz,
Bennett, & Sekuler, 2010) and in the periphery (Gurnsey, Roddy, Ouhnana, & Troje, 2008;

112
Thompson, Hansen, Hess, & Troje, 2007) suggests that figure-ground segregation is a distinct
stage, while Chapter 2 demonstrated that structure-from-motion is not sensitive to the dynamics
of local features in the same way that local motion processing is. Further studies should
investigate the degree of dissociation between these components.
5.2 Computational models of biological motion perception
To achieve a detailed understanding of how biological motion perception is
accomplished, this basic outline of a hierarchy of five processing stages should be filled in with
computational models of the components and how they interact. As an example of a model of a
single component, Hoffman and Flinchbaugh (1982) and Webb and Aggarwal (1982) presented
algorithms for computing structure-from-motion. In terms of the interaction of components, there
are only two major computational models of biological motion perception in the psychological
literature: Lange and Lappe’s (2006) and Giese and Poggio’s (2003). However neither provides a
full account of the components that are discussed here.
Lange and Lappe’s (2006) model (also see Lange, Georg, & Lappe, 2006) is based on
matching frames of biological motion to a library of static form templates. By definition, it is
incapable of using information from motion signals, and so cannot account for processing of local
motion invariants, or any sensitivity to dynamics. The only representation of time is as a learned
ordering of templates. The creators acknowledge that unlike humans, the model is not capable of
determining direction from scrambled motion, or distinguishing between Cutting’s walker and a
motion-capture-based point-light display (Lange & Lappe, 2007), which have different perceptual
properties for humans, as described in Chapter 2.
The two tasks Lange and Lappe’s model has been shown to be capable of accomplishing
are a direction discrimination task and a forward-backward walking discrimination task. For the

113
direction task, the library consists of two sets of templates, one for walking to the left and one for
walking to the right, with each template representing a pose that occurs during the walking action.
The first stage activates templates based on the current frame, eventually selecting one as the best
match, while the second stage of the model integrates the templates over time to make an overall
judgment of ‘left’ or ‘right’. This task might be considered a type of action categorization, but to
recognize the full range of actions that humans are familiar with, and the range of styles in which
each action can be performed, would require a combinatorial explosion of static form templates.
The model is also not capable of making use of structure-from-motion, since motion processing is
needed to infer the pairwise relationships between points, and it is not clear how the model could
segregate a point-light display from scrambled walker noise, although it has some tolerance to
masking by limited-lifetime static noise dots (Lange & Lappe, 2006). Nevertheless, this model
does represent a proposal of how biological motion could be processed through multiple stages to
recognize its global form.
Giese and Poggio’s (2003) computational model also processes biological motion via
static templates, but in addition includes a separate mechanism which integrates local motion
signals, and so provides a better fit for the multi-component model. Raw visual input is processed
in two parallel streams, analogous to the dorsal and ventral streams of the visual system (Mishkin,
Ungerleider, & Macko, 1983). Each stream consists of several stages at which the activation of
units in the earlier stage is aggregated and simplified, resulting in receptive fields that increase in
scale from highly localized to the entire display. The information from the form and motion
pathways is only integrated at the final stage. This feed-forward neural network model can be
trained on different actions and walking styles, and it achieved good performance in
distinguishing among point-light depictions of walking, running and limping, and among the
walking patterns of four individuals. It could also detect a figure within a scrambled walker mask.

114
Although it does not include a role for structure-from-motion, or a separate figure-ground
segregation stage, Giese and Poggio’s model can be regarded as a step towards filling in the
framework, with the components roughly mapping to units in the model at the different spatial
scales and in the different streams. It demonstrates how responses to local features could be
summed to create a global impression, and it incorporates critical features that are based on local
motion, similar to the local motion invariants explored in Chapter 2. Unlike Lange and Lappe’s
model, it has been demonstrated to be capable of action categorization and person identification,
although with small datasets so that the true extent of its abilities are not yet known.
The multi-component framework described in this thesis is not a computational model,
but it provides constraints for such models, and a way to clarify future psychophysical and
neuroscience research in terms of components that should be studied and assessed separately – for
instance by a battery of tests as described in Chapter 4.
5.3 Functional dissociation and neural localization of components
The focus of this thesis has largely been behavioral data, but the components of
biological motion perception can be further illuminated by results from neuroscience. Chapter 4
reviewed neuropsychological findings that suggest that biological motion is processed separately
from low-level motion detection, and in addition some patients’ deficits represent dissociations
between different biological motion abilities (McLeod, Dittrich, Driver, Perrett, & Zihl, 1996;
Vaina, 1994; Vaina, Cowey, LeMay, Bienfang, & Kikinis, 2002). The patients whose only
confirmed deficits were in biological motion perception all had damage to the right temporal lobe
(Vaina & Gross, 2004). There have also been valuable investigations using electrophysiology
(Oram & Perrett, 1994, 1996; Perrett et al., 1985) and ERP data (Hirai, Fikushima, & Hiraki,
2003; Hirai & Hiraki, 2006; Jokisch, Daum, Suchan, & Troje, 2005; Wheaton, Pipingas,

115
Silberstein, & Puce, 2001), as well as repetitive TMS (Grossman, Battelli, & Pascual-Leone,
2005), but the tool best suited for localizing these components in the brain is functional brain
imaging. Below, fMRI and PET results are reviewed that suggest brain areas associated with each
of the components, with the nonoverlap of implicated areas providing further evidence for
dissociations.
5.3.1 Processing local motion invariants
Few imaging studies of biological motion perception have identified regions involved in
extracting invariants from local motion, because most take the approach of contrasting brain
activation due to viewing normal point-light walkers with activation due to scrambled walkers
(Bonda, Petrides, Ostry, & Evans, 1996; Grossman et al., 2000; Peelen, Wiggett, & Downing,
2006; Peuskens, Vanrie, Verfaillie, & Orban, 2005). Both stimuli in this contrast contain valid
local motion invariants, so the activity in regions that process local motion invariants will be
cancelled out. The posterior superior temporal sulcus (pSTS) was most frequently singled out as
selective for biological motion processing.
One study did investigate activation due to local motion, in a 2 × 2 design where either
the configuration or kinematics of a point-light display was disrupted, or both (Jastorff & Orban,
2009). They identified the pITS, pMTG, pSTG and pSTS as selective for the kinematics of a
point-light display of human action, including the scrambled condition. One other study, Jiang
and He (2007), contrasted upright with inverted scrambled point-light walkers, and found
relatively greater activation in V3/V3a and pIPS in the upright condition. Further fMRI
experiments are needed to interpret these results and clarify the areas that are responsible for
processing local motion signals.

116
5.3.2 Structure-from-motion
Since one major difference between the intact and scrambled display is the lack of valid
pairwise rigidity, the studies that contrast the two and find activation in the pSTS raise the
question of whether this area might primarily be associated with structure-from-motion
processing. Peuskens et al. (2005) compared activation to non-biological articulated dot displays
versus activation to human point-light displays. The activation in right STS when the dot motion
represented a human walking compared to activation in right STS due to the non-biological
articulated display was much lower. Another study using articulated non-biological displays also
found no activation in pSTS, but activation in pITS, ITG and FFA/FBA (Pyles, Garcia, Hoffman,
& Grossman, 2007). Furthermore, pSTS responds equally well to Beintema & Lappe’s (2002)
sequential-position walker, which cannot be interpreted using structure-from-motion (Michels,
Lappe, & Vaina, 2005). Finally, it appears that pSTS does not respond exclusively to human body
motion, but also to mouth movements (Puce, Allison, Bentin, Gore, & McCarthy, 1998) and the
sound of footsteps (Bidet-Caulet, Voisin, Bertrand, & Fonlupt, 2005). It has been suggested that
the real selectivity of pSTS is to the presence of intentional action (Saxe, Xiao, Kovacs, Perrett, &
Kanwisher, 2004).
Better candidates for structure-from-motion processing may be the extrastriate body area
(EBA) and fusiform body area (FBA). The EBA overlaps the previously highlighted pITS region
(Pyles et al., 2007), and was found by both Jastorff and Orban (2009) and Jiang and He (2007) to
be responsive to intact but not scrambled walkers, as was the FBA. However this interpretation is
complicated by the fact that these areas are also selective for still photographs of human bodies
(Downing, Jiang, Shuman, & Kanwisher, 2001; Peelen & Downing, 2005).

117
5.3.3 Figure-ground segregation
Like local motion invariant processing, figure-ground segregation of point-light walkers
in noise masks has not been localized directly using functional imaging. Although one of the
striking characteristics of biological motion is how difficult it is to mask (Cutting, Moore, &
Morrison, 1988), only Grossman et al. (2004) have used a stimulus that included masking noise.
Rather than using a whole-brain contrast, they took a region of interest approach, limiting the
activity that was analyzed to the functionally located pSTS and FFA regions. Therefore brain
regions involved in figure-ground segregation could not be freely identified, but the study did
determine that there is less activation in pSTS and the FFA when the walker is masked, and that
this discrepancy is reduced as participants gain practice with the masked walker stimulus.
5.3.4 Action categorization
One result that speaks to localization of action categorization is Jastorff and Orban’s
(2009) report of activation due to viewing complex, varied actions such as aerobics and boxing as
opposed to walking displays. Although their participants were not asked to identify the action,
there was a distinct different in the brain regions that were activated, with pSTS only responding
in the case of complex actions, but EBA and FBA responding to both complex actions and the
basic, repeated walking action. This constitutes further evidence that pSTS may not be critically
involved in many commonly used biological motion tasks involving point-light displays of
walking.
5.3.5 Style recognition
The ability to determine the style of an action from body movements, as acquired through
experience, was examined by Calvo-Merino, Glaser, Grezes, Passingham, and Haggard (2005).
They used fMRI to determine the regions that were activated while observing videos of ballet or

118
capoeira dance performances, with the observers being experts in one of the two dance forms or
non-experts. They found greater activation in premotor areas when participants viewed a dance
style corresponding to their own expertise, as well as the intraparietal sulcus, the right superior
parietal lobe, and left pSTS. Non-experts showed no significant differences in activation between
the two stimuli. This may indicate that visual representations of motion style is primarily located
in the premotor cortex, as predicted by mirror neuron theory (Rizzolatti & Craighero, 2004;
Rizzolatti, Fadiga, Gallese, & Fogassi, 1996). However one study of observation of mouth actions
suggested that there are two distinct action categorization systems: one for actions the observer
has personally experienced, which relies on mirror neuron areas, and a distinct system for actions
that the observer has not performed him- or herself (Buccino et al., 2004).
In summary, there is only limited fMRI evidence to date that isolates regional activity
due to the components of biological motion processing proposed here, but activation in pSTS
appears to be related to processing of complex human activity, while structure-from-motion may
be associated with the EBA and FBA. Recognition of specific styles of motion is associated with
the premotor cortex, when the viewer is experienced in the action that is portrayed.
5.4 A multi-component approach to studying biological motion perception
This thesis has outlined and provided evidence for at least five distinct components of
biological motion perception. There could very well be more components: for example, as
suggested by the test battery results of Chapter 4 in which Gender test results did not correlate
with Identity test results, person recognition may use additional abilities beyond basic style
recognition. Nevertheless, the present framework represents an advance over the treatment of
biological motion perception as a single phenomenon even when assessed by very different tasks.

119
The components function as stages in a processing hierarchy, with intermediate
representations generated by one stage serving as input to the next stage, but with the components
capable of useful perceptual judgments on their own. When we observe the actions of others in
everyday life we likely make use of several of these components simultaneously. However to
truly understand biological motion processing, experimenters must carefully construct their task
and stimuli so as not to confound the contributions of several components. Once this becomes
widespread practice, many questions that have had conflicting answers in the biological motion
literature, from its neural concomitants to whether people with autism are impaired in perceiving
it, will be untangled.
120
References
Beintema, J. A., & Lappe, M. (2002). Perception of biological motion without local image
motion. Proceedings of the National Academy of Sciences of the United States of America,
99(8), 5661-5663.
Bidet-Caulet, A., Voisin, J., Bertrand, O., & Fonlupt, P. (2005). Listening to a walking human
activates the temporal biological motion area. Neuroimage, 28(1), 132-139.
Bonda, E., Petrides, M., Ostry, D., & Evans, A. (1996). Specific involvement of human parietal
systems and the amygdala in the perception of biological motion. Journal of
Neuroscience, 16(11), 3737-3744.
Buccino, G., Lui, F., Canessa, N., Patteri, I., Lagravinese, G., Benuzzi, F., et al. (2004). Neural
circuits involved in the recognition of actions performed by nonconspecifics: An fMRI
study. Journal of Cognitive Neuroscience, 16(1), 114-126.
Calvo-Merino, B., Glaser, D. E., Grezes, J., Passingham, R. E., & Haggard, P. (2005). Action
observation and acquired motor skills: An fMRI study with expert dancers. Cerebral
Cortex, 15(8), 1243-1249.
Chang, D. H. F., & Troje, N. F. (2008). Perception of animacy and direction from local biological
motion signals. Journal of Vision, 8(5), 1-10.
Chouchourelou, A., Matsuka, T., Harber, K., & Shiffrar, M. (2006). The visual analysis of
emotional actions. Social Neuroscience, 1(1), 63-74.
Cutting, J. E., Moore, C., & Morrison, R. (1988). Masking the motions of human gait. Perception
& Psychophysics, 44(4), 339-347.

121
Downing, P. E., Jiang, Y. H., Shuman, M., & Kanwisher, N. (2001). A cortical area selective for
visual processing of the human body. Science, 293(5539), 2470-2473.
Giese, M. A., & Poggio, T. (2003). Neural mechanisms for the recognition of biological
movements. Nature Reviews Neuroscience, 4(3), 179-192.
Grossman, E. D., Battelli, L., & Pascual-Leone, A. (2005). Repetitive TMS over posterior STS
disrupts perception of biological motion. Vision Research, 45(22), 2847-2853.
Grossman, E. D., Blake, R., & Kim, C. Y. (2004). Learning to see biological motion: Brain
activity parallels behavior. Journal of Cognitive Neuroscience, 16(9), 1669-1679.
Grossman, E. D., Donnelly, M., Price, R., Pickens, D., Morgan, V., Neighbor, G., et al. (2000).
Brain areas involved in perception of biological motion. Journal of Cognitive
Neuroscience, 12(5), 711-720.
Gurnsey, R., Roddy, G., Ouhnana, M., & Troje, N. F. (2008). Stimulus magnification equates
identification and discrimination of biological motion across the visual field. Vision
Research, 48(28), 2827-2834.
Hirai, M., Chang, D. H. F., Saunders, D. R., & Troje, N. F. (2011). Body configuration modulates
the usage of local cues to direction in biological motion perception. Submitted.
Hirai, M., Fikushima, H., & Hiraki, K. (2003). An event-related potentials study of biological
motion perception in humans. Neuroscience Letters, 344(1), 41-44.
Hirai, M., & Hiraki, K. (2006). The relative importance of spatial versus temporal structure in the
perception of biological motion: An event-related potential study. Cognition, 99(1), B15-
B29.
122
Hirai, M., Saunders, D. R., & Troje, N. F. (2010). Local motion versus global shape in biological
motion: A reflexive orientation task. Journal of Vision, 10(7), 786-786.
Hoffman, D. D., & Flinchbaugh, B. E. (1982). The interpretation of biological motion. Biological
Cybernetics, 42(3), 195-204.
Jastorff, J., & Orban, G. A. (2009). Human functional magnetic resonance imaging reveals
separation and integration of shape and motion cues in biological motion processing.
Journal of Neuroscience, 29(22), 7315-7329.
Jiang, Y., Costello, P., & He, S. (2007). Processing of invisible stimuli: Advantage of upright
faces and recognizable words in overcoming interocular suppression. Psychological
Science, 18(4), 349-355.
Jiang, Y., & He, S. (2007). Isolating the neural encoding of the local motion component in
biological motion. Journal of Vision, 7(9), 551a.
Jiang, Y., Wang, L., Zhang, K., & He, S. (2010). Searching for life motion signals: Visual search
asymmetry in local but not global biological motion processing. Psychological Science,
21(8), 1083-1089.
Jokisch, D., Daum, I., Suchan, B., & Troje, N. F. (2005). Structural encoding and recognition of
biological motion: Evidence from event-related potentials and source analysis.
Behavioural Brain Research, 157(2), 195-204.
Lange, J., Georg, K., & Lappe, M. (2006). Visual perception of biological motion by form: A
template-matching analysis. Journal of Vision, 6(8), 836-849.
Lange, J., & Lappe, M. (2006). A model of biological motion perception from configural form
cues. Journal of Neuroscience, 26(11), 2894-2906.

123
Lange, J., & Lappe, M. (2007). The role of spatial and temporal information in biological motion
perception. Advances in Cognitive Psychology, 3(4), 419-428.
McLeod, P., Dittrich, W., Driver, J., Perrett, D., & Zihl, J. (1996). Preserved and impaired
detection of structure from motion by a “motion-blind” patient. Visual Cognition, 3(4),
363-391.
Michels, L., Lappe, M., & Vaina, L. M. (2005). Visual areas involved in the perception of human
movement from dynamic form analysis. Neuroreport, 16(10), 1037-1041.
Mishkin, M., Ungerleider, L. G., & Macko, K. A. (1983). Object vision and spatial vision: Two
cortical pathways. Trends in Neurosciences, 6(10), 414-417.
Oram, M. W., & Perrett, D. I. (1994). Responses of anterior superior temporal polysensory
(STPa) neurons to ‘biological motion’ stimuli. Journal of Cognitive Neuroscience, 6(2),
99-116.
Oram, M. W., & Perrett, D. I. (1996). Integration of form and motion in the anterior superior
temporal polysensory area (STPa) of the macaque monkey. Journal of Neurophysiology,
76(1), 109-129.
Peelen, M. V., & Downing, P. E. (2005). Selectivity for the human body in the fusiform gyrus.
Journal of Neurophysiology, 93(1), 603-608.
Peelen, M. V., Wiggett, A. J., & Downing, P. E. (2006). Patterns of fMRI activity dissociate
overlapping functional brain areas that respond to biological motion. Neuron, 49(6), 815-
822.

124
Perrett, D. I., Smith, P. A. J., Mistlin, A. J., Chitty, A. J., Head, A. S., Potter, D. D., et al. (1985).
Visual analysis of body movements by neurons in the temporal cortex of the macaque
monkey: A preliminary report. Behavioural Brain Research, 16(2-3), 153-170.
Peuskens, H., Vanrie, J., Verfaillie, K., & Orban, G. A. (2005). Specificity of regions processing
biological motion. European Journal of Neuroscience, 21(10), 2864-2875.
Pilz, K. S., Bennett, P. J., & Sekuler, A. B. (2010). Effects of aging on biological motion
discrimination. Vision Research, 50(2), 211-219.
Puce, A., Allison, T., Bentin, S., Gore, J. C., & McCarthy, G. (1998). Temporal cortex activation
in humans viewing eye and mouth movements. The Journal of Neuroscience, 18(6), 2188-
2199.
Pyles, J. A., Garcia, J. O., Hoffman, D. D., & Grossman, E. D. (2007). Visual perception and
neural correlates of novel ‘biological motion’. Vision Research, 47, 2786-2797.
Rizzolatti, G., & Craighero, L. (2004). The mirror neuron system. Annual Review of
Neuroscience, 27, 169-192.
Rizzolatti, G., Fadiga, L., Gallese, V., & Fogassi, L. (1996). Premotor cortex and the recognition
of motor actions. Cognitive Brain Research, 3(2), 131-141.
Saxe, R., Xiao, D. K., Kovacs, G., Perrett, D. I., & Kanwisher, N. (2004). A region of right
posterior superior temporal sulcus responds to observed intentional actions.
Neuropsychologia, 42(11), 1435-1446.
Simion, F., Regolin, L., & Bulf, H. (2008). A predisposition for biological motion in the newborn
baby. Proceedings of the National Academy of Sciences of the United States of America,
105(2), 809-813.
125
Thompson, B., Hansen, B. C., Hess, R. F., & Troje, N. F. (2007). Peripheral vision: Good for
biological motion, bad for signal noise segregation? Journal of Vision, 7(10), 1-7.
Troje, N. F., & Westhoff, C. (2006). The inversion effect in biological motion perception:
Evidence for a ‘life detector’? Current Biology, 16(8), 821-824.
Vaina, L. M. (1994). Functional segregation of color and motion processing in the human visual
cortex: Clinical evidence. Cerebral Cortex, 4(5), 555-572.
Vaina, L. M., Cowey, A., LeMay, M., Bienfang, D. C., & Kikinis, R. (2002). Visual deficits in a
patient with ‘kaleidoscopic disintegration of the visual world’. European Journal of
Neurology, 9(5), 463-477.
Vaina, L. M., & Gross, C. G. (2004). Perceptual deficits in patients with impaired recognition of
biological motion after temporal lobe lesions. Proceedings of the National Academy of
Sciences of the United States of America, 101(48), 16947-16951.
Vallortigara, G., & Regolin, L. (2006). Gravity bias in the interpretation of biological motion by
inexperienced chicks. Current Biology, 16(8), R279-R280.
Vallortigara, G., Regolin, L., & Marconato, F. (2005). Visually inexperienced chicks exhibit
spontaneous preference for biological motion patterns. PLoS Biology, 3(7), 1312-1316.
Webb, J. A., & Aggarwal, J. K. (1982). Structure from motion of rigid and jointed objects.
Artificial Intelligence, 19(1), 107-130.
Wheaton, K. J., Pipingas, A., Silberstein, R. B., & Puce, A. (2001). Human neural responses
elicited to observing the actions of others. Visual Neuroscience, 18(3), 401-406.
126
Summary and Conclusions
Biological motion perception is more than one phenomenon. It is best studied as a
hierarchy of processing components, ranging from detection of low-level motion invariants to
high-level style recognition. The experiments in this thesis derive from this framework, and from
earlier results showing dissociations between the processes used in different biological motion
perception tasks. In the first study, it was shown that humans are sensitive to the dynamics
portrayed in the local motion trajectories of a point-light walker, such that when the trajectories
are altered (in this case by the substitution of Cutting’s walker for motion-capture-derived data)
they can no longer be used as a source of information (Chapter 2). In the second study, data was
presented showing different eye fixation patterns for different tasks, consistent with the
hypotheses that the tasks call on fundamentally different mechanisms, and that the local motion
of the feet carries directional information (Chapter 3). Finally, a battery of biological motion tests
was introduced, with the purpose of measuring aptitude on these different processing levels
independently and so avoiding the confounds that are inherent in many tasks that are in current
use (Chapter 4). Individual differences data collected using the battery contribute evidence for
these components as distinct constructs. The multi-component framework has clarified a number
of issues in perception of biological motion, and will help to guide future research.

127
Appendix
(Permission to reprint previously published material)
Subject: Article permission
From: Jatinder Padda <[email protected]>
Date: Fri, 08 Apr 2011 10:14:53 +0100
Dear Daniel Saunders
Your PhD - Queen's University, Canada – 2011
Thank you for your request for permission to reproduce in the above publication the
following article:
Saunders D R, Suchan J, Troje N F, 2009, "Off on the wrong foot: Local features in
biological motion" first published in Perception 38(4) 522 – 532
Pion grant non-exclusive English language anthology and quotation rights for distribution
throughout the world in volume editions subject to the following conditions:
That sufficient acknowledgement be given to include title, year, volume, first and last
page numbers and the words Pion Limited, London. This should appear at the end of the
text, or in the acknowledgements."
Yours sincerely Jatinder Padda
--
Jatinder Padda
Publishing Services Manager
Pion Limited
207 Brondesbury Park
London NW2 5JN
UK
tel: 020 8459 0066
fax: 020 8451 6454
Registered in England number 622848. VAT number GB 226868922.

128
Subject: RE: Could I please have permission to reprint Saunders et al 2010 in
my PhD thesis
From: Alice O'Donnell <[email protected]>
Date: Wed, 18 May 2011 16:19:26 -0400
To: Daniel Saunders <[email protected]>
Dear Daniel,
Permission is granted to use Saunders, D. R., Williamson, D. K.,
& Troje, N. F. (2010). Gaze patterns during perception of
direction and gender from biological motion, from Journal of
Vision, 10(11), 1-10., provided that the journal is cited as the
source and ARVO as the copyright holder.
With best wishes,
alice
Alice O'Donnell
Director of Journals,
ARVO
240-221-2930