components of an integrated environmental observatory
TRANSCRIPT
Manuscript in Review at Computers & Geosciences
1
Components of an Integrated Environmental Observatory Information System 1 2 3 1
Keywords: Cyberinfrastructure, Hydrology, Water Resources, Sensor, Data Model, Web Service 16
Jeffery S. Horsburgh, Utah Water Research Laboratory, Utah State University, Logan, Utah, 4 USA 5 6 David G. Tarboton, Utah Water Research Laboratory, Utah State University, Logan, Utah, USA 7 8 David R. Maidment, Center for Research in Water Resources, University of Texas at Austin, 9 Austin, Texas, USA 10 11 Ilya Zaslavsky, San Diego Supercomputer Center, University of California at San Diego, San 12 Diego, California, USA 13 14 15
1 Corresponding author. Address: 8200 Old Main Hill, Logan, UT 84322-8200, Telephone: (435) 797-2946, Fax: (435) 797-3663, Email: [email protected]
Manuscript in Review at Computers & Geosciences
2
Abstract 17
Recently, community initiatives have emerged for the establishment of cooperative large-18
scale environmental observatories. Scientists’ ability to access and use the data collected within 19
observatories to address broad research questions will depend on the successful implementation 20
of cyberinfrastructure. In this paper, we describe the general components of an environmental 21
observatory information system for collecting, storing, and publishing point observations data. 22
We then describe the implementation of prototypes for each of the generalized components 23
within the Little Bear River observatory test bed, as well as across a nation-wide network of 11 24
observatory test bed sites. Together, these components comprise an integrated observatory 25
information system that has enabled us to not only analyze and synthesize our data to advance 26
our understanding of the Little Bear River watershed but also manage and publish all of the 27
observational data that we are collecting on the Internet in simple to use formats that are easily 28
accessible and discoverable by others. 29
1. Introduction 30
Our current knowledge of the physical, chemical, and biological mechanisms controlling 31
water quantity and quality is limited by lack of observations at the spatial density and temporal 32
frequency needed to infer the controlling processes (Montgomery et al., 2007). Many have 33
suggested that new data networks and field experiments that recognize the spatial and temporal 34
heterogeneity of these processes are needed to advance the science of hydrology (Kirchner, 35
2006; Hart and Martinez, 2006). This knowledge that current hydrologic understanding is 36
constrained by a lack of observations at appropriate scales has motivated community initiatives 37
(e.g., http://www.cuahsi.org, http://cleaner.ncsa.uiuc.edu, http://www.watersnet.org/) towards the 38
establishment of large-scale environmental observatories. The goal is to create a network of 39
Manuscript in Review at Computers & Geosciences
3
instrumented sites where data are collected with unprecedented spatial and temporal resolution, 40
aiming at creating greater understanding of the earth’s water and related biogeochemical cycles 41
and enabling improved forecasting and management of water processes. 42
As the amount and complexity of data grows, which will surely be the case within 43
observatories, it becomes increasingly difficult to identify trends and relationships in the data and 44
to derive information that enhances understanding using simple query and reporting tools 45
(Connolly and Begg, 2005). Using data streams from multiple sensors or from multiple sites in a 46
single analysis becomes more difficult when they consist of thousands or even tens or hundreds 47
of thousands of observations. Thus, without tools to manage and manipulate data their utility in 48
fostering process understanding is limited. 49
Additionally, it is difficult for anyone beyond those who collected the data to use them 50
for scientific analyses if they are never published or if semantic and syntactic differences 51
preclude their use in common analyses. Recently, these questions of data availability, 52
organization, publication, visualization, and analysis have come to the forefront within many 53
scientific communities. Hydrologic Information Systems (HIS) are emerging as technology to 54
address these questions in the area of hydrology and water resources. 55
Observatory initiatives will require investments in both capital and information 56
technology infrastructure to manage and enable observing systems. Comprehensive 57
infrastructure being used to capitalize on advances in information technology has been termed 58
“cyberinfrastructure” and integrates hardware for computing, data and networks, digitally-59
enabled sensors, observatories and experimental facilities, and an interoperable suite of software 60
and middleware services and tools (National Science Foundation, 2007). The cyberinfrastructure 61
platform for environmental observatories is expected to include high-performance computing 62
Manuscript in Review at Computers & Geosciences
4
tools and intensive database management for the collection, storage, and dissemination of 63
environmental data; advanced data visualization tools; community-vetted models for system and 64
process synthesis that can be used in near-real time; and collaboration and knowledge 65
networking tools that will help multidisciplinary and geographically dispersed teams of 66
researchers to work together effectively (Montgomery et al., 2007). 67
Within the hydrologic science community, the Consortium of Universities for the 68
Advancement of Hydrologic Science, Inc. (CUAHSI) has been developing cyberinfrastructure to 69
support large-scale environmental observatories (Maidment, 2005; 2008). The CUAHSI HIS 70
project has produced a variety of technologies that are advancing the way hydrologists are 71
storing, accessing, and analyzing environmental data. These include an Observations Data 72
Model (ODM) that provides a persistent storage mechanism for observatory data (Horsburgh et 73
al., 2008a) and Web services that provide remote programmatic access to data (Valentine et al., 74
2007). More information on the CUAHSI HIS project can be found at http://his.cuahsi.org. 75
Although much progress has been made by the CUAHSI HIS project, significant work 76
remains to better define the components required for integrated observatory information systems, 77
the functionality each of these components should have, and the specific technologies available 78
for implementing these components. In this paper we seek to advance the cyberinfrastructure 79
available for supporting environmental observatories. A single class of water resources data is 80
addressed – observational data measured at monitoring points located at a fixed point in space. 81
We focus on data management within observatories and the software required to establish 82
seamless linkages between field sensors, a data storage and management system, applications 83
that publish the data on the Internet, and applications that support data discovery and 84
interpretation. We describe the cyberinfrastructure components required to support this 85
Manuscript in Review at Computers & Geosciences
5
functionality and the functional requirements of each. Finally, we present a case study for the 86
Little Bear River observatory test bed (LBRTB), where instances of the generalized components 87
have been developed and deployed. 88
2. Functionality of an Integrated Observatory Information System 89
2.1. Data Collection and Communication Infrastructure 90
Environmental sensors and network communications infrastructure will play a major part 91
in proposed environmental observatories. An environmental sensor network is an array of sensor 92
nodes and a communications system that allows their data to reach a server (Hart and Martinez, 93
2006). Dynamic variables measured at sensor nodes may include microclimate variables, 94
precipitation chemistry variables, soil variables, stream physical and chemical variables, 95
groundwater variables, snow variables, and many others (WATERS Network, 2008). Many of 96
these variables will be measured and reported in near real time, enabling researchers to conduct 97
predictive modeling of water quantity and quality and enabling feedback within the monitoring 98
systems to adjust operation and adapt monitoring in response to events (Montgomery et al., 99
2008). 100
Real time or near-real time reporting of data requires robust communications 101
infrastructure. Currently available telemetry options include both hard wired (e.g., telephone 102
land lines or Internet connections) and wireless solutions (e.g., cellular phone, radio, satellite). 103
The choice of technology is dependent on the following factors: 1) required data collection and 104
reporting frequency; 2) location and characteristics of the monitoring site; 3) power requirements 105
and availability at remote locations; and 4) equipment and service costs. These factors present 106
challenges for the design and implementation of observatories, and in current practice, 107
Manuscript in Review at Computers & Geosciences
6
communications networks may be made up of a combination of the available technologies to 108
overcome the challenges listed above. 109
2.2. Persistent Data Storage 110
Once observational data are delivered from sensor nodes to a server, they must be parsed 111
into a persistent data store (i.e., database). The key functionality that must be supported includes 112
persistent storage, retrieval, and transaction management (i.e., loading, querying, and editing 113
data). To date, this has been done in a number of ways, ranging from file- and directory-based 114
data structures to complex relational databases. 115
Environmental observations are not self describing, and, because of this, interpretation of 116
observations requires contextual information, or metadata. Metadata is the descriptive 117
information that explains the measurement attributes, their names, units, precision, accuracy, and 118
data layout, as well as the lineage describing how the data was measured, acquired, or computed 119
(Gray et al., 2005). The importance of recording metadata to help others discover and access 120
data products is well recognized (Bose, 2002; Michener et al., 1997; Gray et al., 2005). The data 121
store must capture not only the observation values, but their metadata as well, providing 122
traceable heritage from raw measurements to usable information and allowing observations to be 123
unambiguously interpreted (Horsburgh et al., 2008a). 124
2.3. Quality Assurance, Quality Control, and Data Provenance 125
Before sensor data can be used for most applications and analyses they have to be passed 126
through a set of quality assurance and quality control procedures (Mourad and Bertrand-127
Krajewski, 2002). In-situ sensors operating in harsh conditions often malfunction, many sensors 128
are prone to drift, and data can also become corrupt when they are transmitted over 129
communication networks. Uncorrected errors can adversely affect the value of data for scientific 130
Manuscript in Review at Computers & Geosciences
7
applications, especially if they are to be used by investigators that are not familiar with the 131
measurement methods and conditions that may have caused the anomalies. Several studies have 132
investigated automated anomaly detection in sensor data streams, which is particularly important 133
in real time applications of the data and in detecting instrument malfunctions (Hill et al., 2007; 134
Liu et al., 2007; Mourad and Bertrand-Krajewski, 2002). Although these methods are good at 135
detecting and flagging potentially bad sensor values, they are not always good at fixing them. 136
Producing high quality, continuous data streams from raw sensor output requires 137
correcting for instrument drift, filling missing values where appropriate, and correcting spurious 138
values. It also involves establishing linkages between raw data values and quality controlled 139
data values to maintain data provenance. This process can be time and labor intensive, and tools 140
that better facilitate quality assurance and quality control are needed. 141
2.4. Data Publication and Interoperability 142
Environmental observatories may be operated as cooperative community resources. To 143
become so, observatory data must be published in a way that investigators working both within 144
and across observatories and scientific domains can easily access and interpret the data. One of 145
the biggest challenges in achieving this is heterogeneity within the data formats and vocabularies 146
used to describe the data (Colomb, 1997; Sheth and Larson, 1990). Data publication systems 147
used in observatories must not only transmit data to users, but they must do it in a way that 148
overcomes semantic and syntactic heterogeneity in datasets (Horsburgh et al., 2008b). 149
Web services are applications that pass information between computers over the Internet, 150
usually formatted using a platform independent markup language such as eXtensible Markup 151
Language (XML) (Goodall et al., 2008). Many cyberinfrastructure initiatives are now using 152
Web service-oriented architectures (SOA) (Maidment, 2008; Droegemeier et al., 2005, Youn et 153

Manuscript in Review at Computers & Geosciences
8
al., 2007, others). SOAs rely on a collection of loosely coupled, self-contained services that 154
communicate with each other through the Internet and that can be called from multiple clients 155
(e.g., Excel, Matlab, Visual Studio, etc.) in a standard fashion (Maidment, 2008). Web services 156
can be used to accomplish data publication and interoperability by transmitting data over the 157
Internet in a platform independent format like XML. 158
The proposed network of observatories will require distributed cyberinfrastructure. 159
According the National Research Council (2006), a robust cyberinfrastructure will provide 160
common frameworks, components, modules, and interface models that can be used in multiple 161
observatories or applications. Standardization upon a SOA is the key. Each observatory can 162
publish data using a common set of web services that transmit data using a common language, 163
and all of the underlying processing and complexity (which may be different from one 164
observatory to the next) is hidden from data consumers. In addition, by standardizing the data 165
transmission services and formats, others outside of the observatory community can also publish 166
data using the same tools. 167
2.5. Data Discovery, Visualization, and Analysis 168
Scientists’ ability to find and interpret available datasets will determine how or if the data 169
are used (Horsburgh et al., 2008b). In most cases, scientists want to download data and work 170
with them in their own analysis environment. To do this, they need screening tools to assist 171
them in deciding which data will be useful for their analyses. Map-based, point-and-click access 172
to observational data can be a powerful tool for providing users with data discovery capabilities. 173
Beran and Piasecki (2008) describe a map-based search engine called Hydroseek 174
(http://www.hydroseek.org) that was designed to provide users with a single interface to query 175
and retrieve consistently formatted data from several national hydrologic data providers. Users 176

Manuscript in Review at Computers & Geosciences
9
don’t always know exactly what they are looking for, and the ability to see monitoring sites 177
superimposed upon a map provides them with the spatial context they need to select data they are 178
interested in. Juxtaposition of spatial data and time series of point observations also provides 179
important spatial reference for interpreting the data. For example, knowing the land use 180
distribution or terrain above a stream monitoring site is important in assessing nutrient and 181
sediment concentrations. 182
Many users prefer to visualize datasets so that they have a better understanding of the 183
quality and characteristics of the data before downloading them (Jeong et al., 2006). Tools for 184
querying data and generating simple plots and descriptive statistics are generally adequate for 185
this purpose and can also be useful for users that do not have the expertise to extract data, load it 186
into analysis software, and then develop visualizations or analyses. By providing tools that 187
manipulate the data automatically and do not require specialized software expertise, an 188
observatory information system can extend the reach of the data to less technical users. 189
3. The Little Bear River Environmental Observatory Test Bed: A Case Study 190
As part of the planning process for a network of large-scale environmental observatories, 191
a network of 11 observatory test bed projects was created in 2006 to demonstrate technologies 192
that could be used in the design of a national network of large-scale environmental observatories. 193
The test bed network has been the proving grounds for the CUAHSI HIS. Investigators at each 194
of the test beds participated with the CUAHSI HIS Team in the development and deployment of 195
common HIS capability for publishing observations data. The goal was to create a national 196
network of consistent data and to enable cross-domain analysis within test beds as well as cross-197
test bed sharing and analysis of data. More information about the test beds can be found at the 198
following URL (http://www.watersnet.org/wtbs/index.html). 199
Manuscript in Review at Computers & Geosciences
10
The Little Bear River of northern Utah, USA, was established as one of the test beds to 200
test the hypothesis that high-frequency discharge and water quality data collected at multiple 201
sites using in-situ sensors can improve hydrologic and hydrochemical process understanding. 202
The data intensive nature of this research required development of prototypes for the components 203
of an integrated observatory information system to provide tools for managing the data that are 204
being collected. In addition, components of the CUAHSI HIS were adopted for publishing the 205
LBRTB data in a way that is consistent with all of the other observatory test beds. In the 206
following sections we describe each of the components, the role that they have served, and how 207
the combination of these components has led to an integrated observatory information system for 208
the LBRTB. 209
3.1. Data Collection and Communication Infrastructure: The LBRTB Sensor Network 210
In order to generate the necessary data to enable the investigation of the hypothesis listed 211
above, a sensor network was established that includes seven continuous stream discharge and 212
water quality monitoring sites and 2 weather stations. At each site, a suite of sensors was 213
connected to a Campbell Scientific, Inc. datalogger, and the data are transmitted in near real time 214
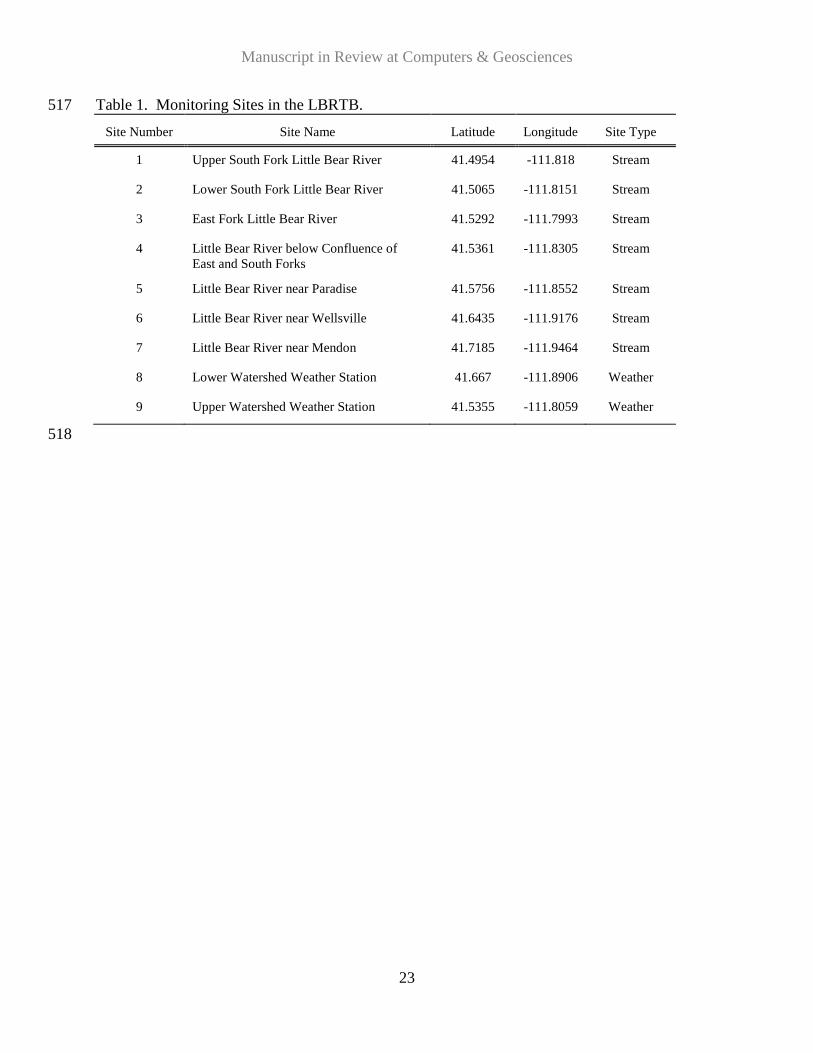
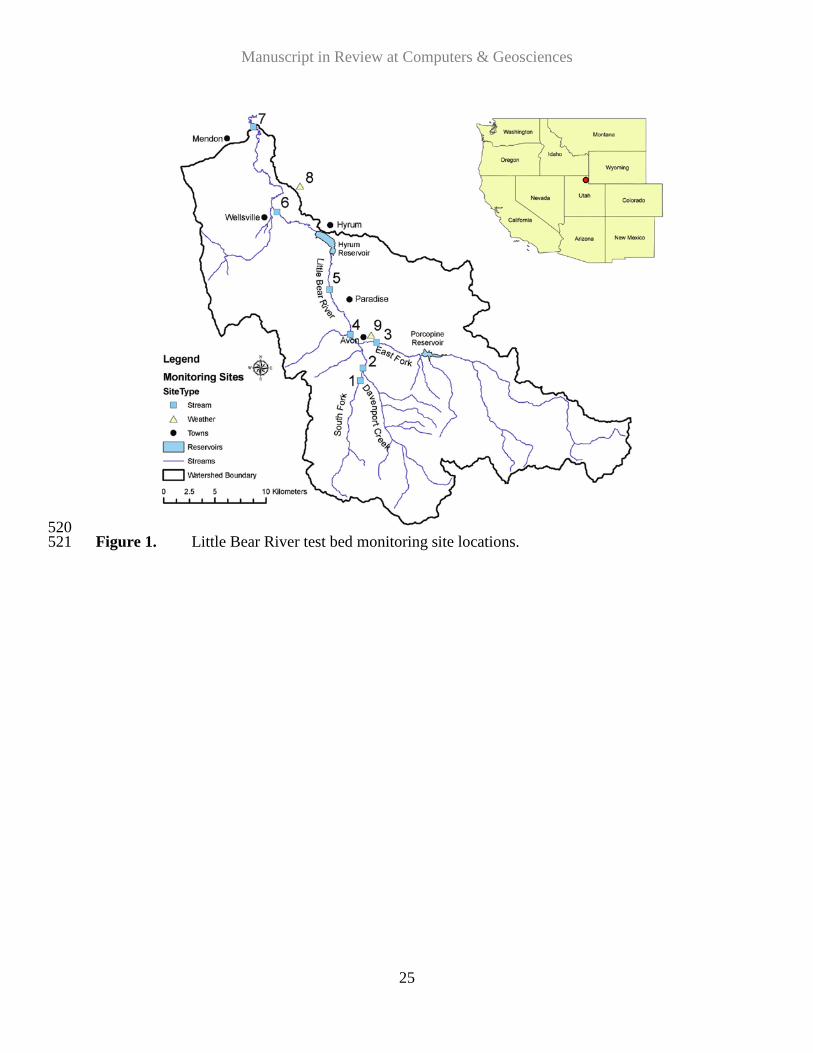
to the Utah Water Research Laboratory (UWRL) via a telemetry network. Table 1 lists the 215
monitoring sites and Figure 1 shows their location within the Little Bear River watershed. Table 216
2 lists the variables measured at each type of monitoring site, the data collection frequency, and 217
the sensors used. 218
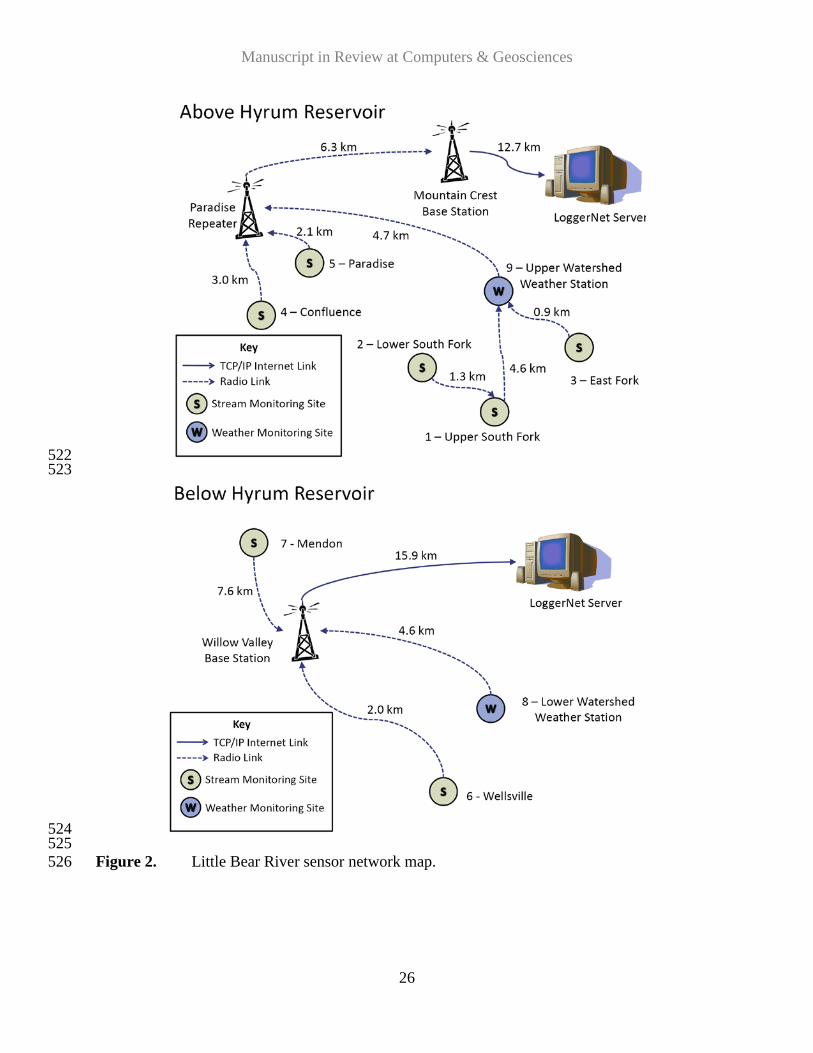
The telemetry network was designed to use a combination of 900 MHz spread spectrum 219
radio links and TCP/IP Internet links to establish communications between the UWRL and each 220
of the sites. The network enables us to monitor site status in real time and to retrieve data from 221
each of the sites. This system was chosen because it eliminated monthly service costs, it had 222
Manuscript in Review at Computers & Geosciences
11
relatively low power requirements, and it maximized the flexibility of the system for accepting 223
new sites onto the existing network. 224
Terrain and vegetation were major challenges in the design of the radio telemetry 225
network. Digital elevation model (DEM) based viewshed analysis using a Geographic 226
Information System (GIS) was used to identify appropriate locations for radio repeaters so that 227
data from the river monitoring sites, which are located at lower elevations with poor line of sight, 228
could be transmitted to one of two remote base stations located at public schools within the 229
watershed. Figure 2 shows the network map for the sensor network and identifies pathways, 230
distances, and link types between each of the remote monitoring sites and the central server 231
located at the UWRL. 232
Communications with the monitoring sites are managed using Campbell Scientific’s 233
LoggerNet software (http://www.campbellsci.com). LoggerNet has enabled configuration of the 234
radio linkages within the telemetry network, encoding of data collection logic into datalogger 235
programs, and monitoring of the status of communications links within the network. The 236
LoggerNet server is programmed to connect hourly to each remote site and download the most 237
recent data to delimited text files, which are then stored in a location accessible on the local 238
Intranet. 239
3.2. Persistent Data Storage: The LBRTB Observations Database 240
Once the sensor data are transmitted to the UWRL, they are parsed into an instance of the 241
CUAHSI HIS Observations Data Model (ODM). ODM is a relational model that was designed 242
to be implemented within a relational database management system (RDBMS) and that defines 243
the persistent structure of the data, including the set of attributes that accompany the data, their 244
names, their data type, and their context (Horsburgh et al., 2008a). ODM also includes a set of 245

Manuscript in Review at Computers & Geosciences
12
controlled vocabularies for many of the data attributes, which are used to ensure that data stored 246
within and across ODM instances are semantically similar. The Little Bear River ODM database 247
serves as the persistent storage mechanism for the LBRTB information system. 248
Because there is opportunity for error each time sensor data are handled, automation is 249
critical to avoiding errors in parsing the datalogger files into the database. Because of this, we 250
developed the ODM Streaming Data Loader (SDL) application, which allows users to map table-251
based datalogger files to the ODM schema and then run the data loading task periodically as new 252
data are received. Through a wizard-based graphical user interface (GUI), users define the 253
location of the datalogger file(s) on disk (or on a network shared folder or website) and then 254
create all of the necessary metadata records within the ODM database so that the data can be 255
loaded. Figure 3 shows the GUI for the ODM SDL. The ODM SDL can then be run manually 256
or on a user defined schedule, and, upon execution, checks each datalogger file for new 257
observations and automatically loads them into the database. The combination of the LoggerNet 258
server, which manages the retrieval of data from the remote sensor nodes, and the ODM SDL, 259
which parses the data into an ODM database, demonstrates automated integration between field 260
sensors and a central observations database that persistently stores the data and its metadata. 261
3.3. Quality Assurance, Quality Control, and Data Provenance: ODM Tools 262
To enable quality assurance and quality control of the sensor data we developed software 263
called ODM Tools that enables data managers to query, visualize, and edit data stored within an 264
ODM database. ODM Tools provides functionality for removing obvious errors, sensor 265
malfunctions, and instrument drift. Users can insert, delete, adjust (by multiplying by or adding 266
a constant value), interpolate, and apply linear drift corrections to data values. Users can also 267
flag data values with qualifying comments, which are then stored with the data in the database. 268
Manuscript in Review at Computers & Geosciences
13
Data editing is performed within a form that has both graphical and tabular views of the 269
data. Figure 4 shows the ODM Tools data editing interface. Several data filters are available for 270
selecting data values that may need to be edited. These include selecting data values above or 271
below a threshold, selecting data values where gaps occur, selecting data where the change from 272
one observation to the next is greater than some value, and selecting data occurring within a 273
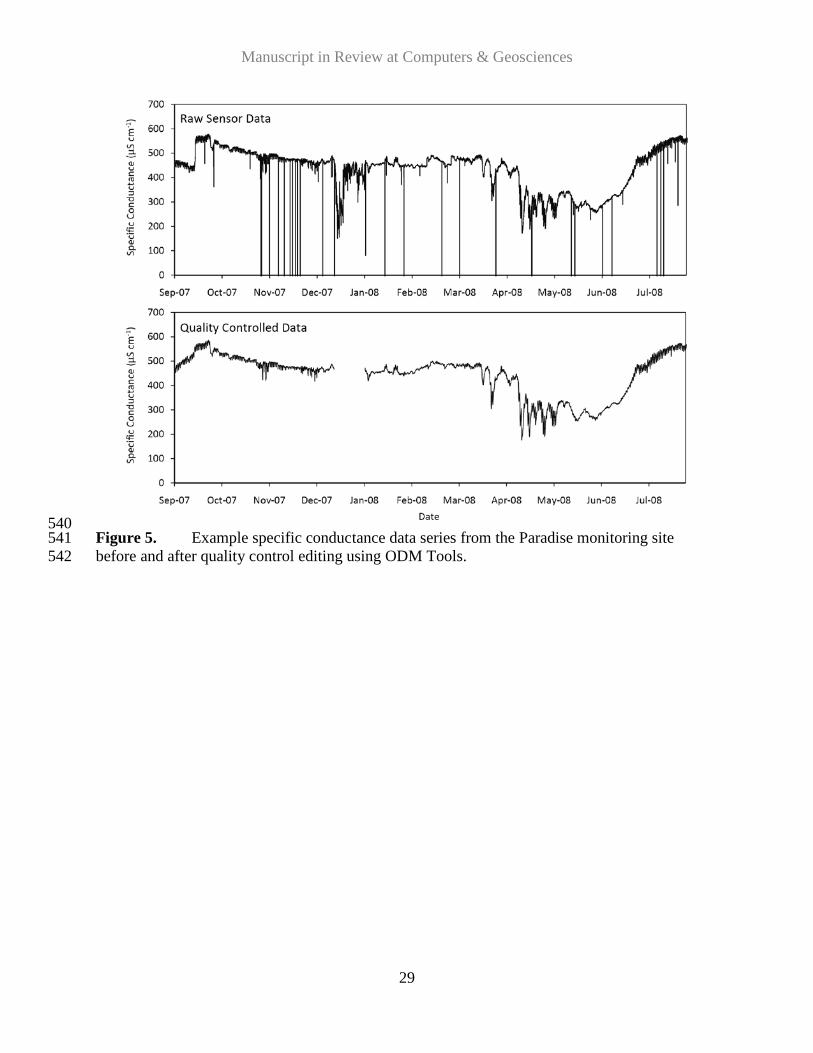
particular time interval. ODM Tools preserves the primary sensor data streams, while any edits 274
are performed on copies derived from these data. ODM and ODM Tools preserve the 275
provenance of the data by maintaining the linkages between derived or quality controlled 276
observations and the raw observations that they were derived from. Figure 5 shows a portion of 277
a specific conductance time series before and after quality control editing using ODM Tools. 278
3.4. Data Publication and Interoperability: The LBRTB Web Services 279
The LBRTB information system has adopted the CUAHSI HIS WaterOneFlow (WOF) 280
web services as the main mechanism for communicating observational data to users. The WOF 281
web services respond to queries using a standard set of web service methods, and transmit data 282
extracted from the LBRTB observations database encoded using Water Markup Language 283
(WaterML) (Zaslavsky et al., 2007). WOF methods include GetSites for returning a list of sites 284
within the database along with the metadata for each site, GetVariableInfo for returning a list of 285
variables within the database along with the metadata for each variable, GetSiteInfo for returning 286
a list of variables with data at a site, and GetValues for returning the time series of data for a site 287
and variable combination. The web service methods can be called from many different 288
programming languages and software applications, including Microsoft Visual Basic, Microsoft 289
Excel, MATLAB, and others from anywhere an Internet connection is available. 290
Manuscript in Review at Computers & Geosciences
14
By adopting the WOF web services and WaterML, the LBRTB data are published in a 291
format that is consistent with all of the other observatory test beds (which have also adopted the 292
WOF web services), creating a network of consistently published scientific data. WaterML 293
serves as a standard data transmission language, ensuring that data retrieved from all of the test 294
beds is syntactically similar and promoting interoperability of the data through the use of 295
standard web services protocols and an XML schema that is platform, application, and 296
programming language independent. The use of ODM as the underlying data model with its 297
controlled vocabularies ensures that when the data from each test bed are encoded using 298
WaterML they are consistently described and semantically similar. 299
One additional advantage to using the WOF web services is that high level search tools 300
like Hydroseek, which is part of CUAHSI’s Central HIS system and is capable of consuming 301
WOF web services, can find and present data to potential users. Simple keyword searches in 302
Hydroseek are now capable of returning observational data from each of the test beds’ web 303
services as well as from national data providers such as the United States Geological Survey and 304
the U.S. Environmental Protection Agency. The significance of this is not just the linkage with 305
Hydroseek, but that through the adoption of a common SOA, application developers can now 306
program against any of the test bed web services as if the data that they present were located on 307
their own machine. 308
3.5. Data Discovery, Visualization, and Analysis: The LBRTB Website, Map Server, 309 and Time Series Analyst 310
311 A website was developed for the LBRTB that provides information about the ongoing 312
research and links to several applications that present the LBRTB data 313
(http://littlebearriver.usu.edu). Included is a listing of monitoring sites along with photographs, 314
site descriptions, and information about the variables being measured and monitoring equipment 315
Manuscript in Review at Computers & Geosciences
15
installed at each one. Links are provided to launch the location of each site in a Google Maps 316
interface. Also included in the website is a listing of the current conditions within the watershed. 317
This listing shows the latest observation of each variable at each site and is invaluable in 318
determining the status of the monitoring and telemetry system. 319
In addition to the website, a light weight map server that plots the locations of the 320
monitoring sites was developed. It enables simple spatial queries by allowing users to select a 321
variable from a drop down list, which then redraws the map showing only monitoring sites with 322
data for the selected variable. It was implemented using Google Maps and so benefits from the 323
Google Maps base map data and JavaScript Application Programmer Interface (API) that enables 324
customization of the mapping components. 325
When a user clicks on a monitoring site in the LBRTB map server, a balloon pops up that 326
provides information about the selected site. The balloon also provides a hyperlink to the Time 327
Series Analyst, which is a simple, Internet-based interface to the LBRTB observations database. 328
Users can select a site, variable, and date range and then generate a variety of plots and summary 329
statistics for the selected data series directly in their Web browser. They can also save the plots 330
as images and download the data used to generate the plots. The LBRTB map server and Time 331
Series Analyst applications are available at the Little Bear River test bed website 332
(http://littlebearriver.usu.edu). 333
Both of these applications were designed to use a direct SQL connection to an ODM 334
database. However, they were also developed to be generic and reusable – i.e., they can be 335
connected to multiple ODM databases. Each one has a simple query interface that allows query 336
parameters to be passed to the application through the URL string. This is useful for launching 337
Manuscript in Review at Computers & Geosciences
16
the application in a specific state (e.g., launching the Time Series Analyst from the map server 338
with a monitoring site pre-selected based on which site the user clicked on in the map). 339
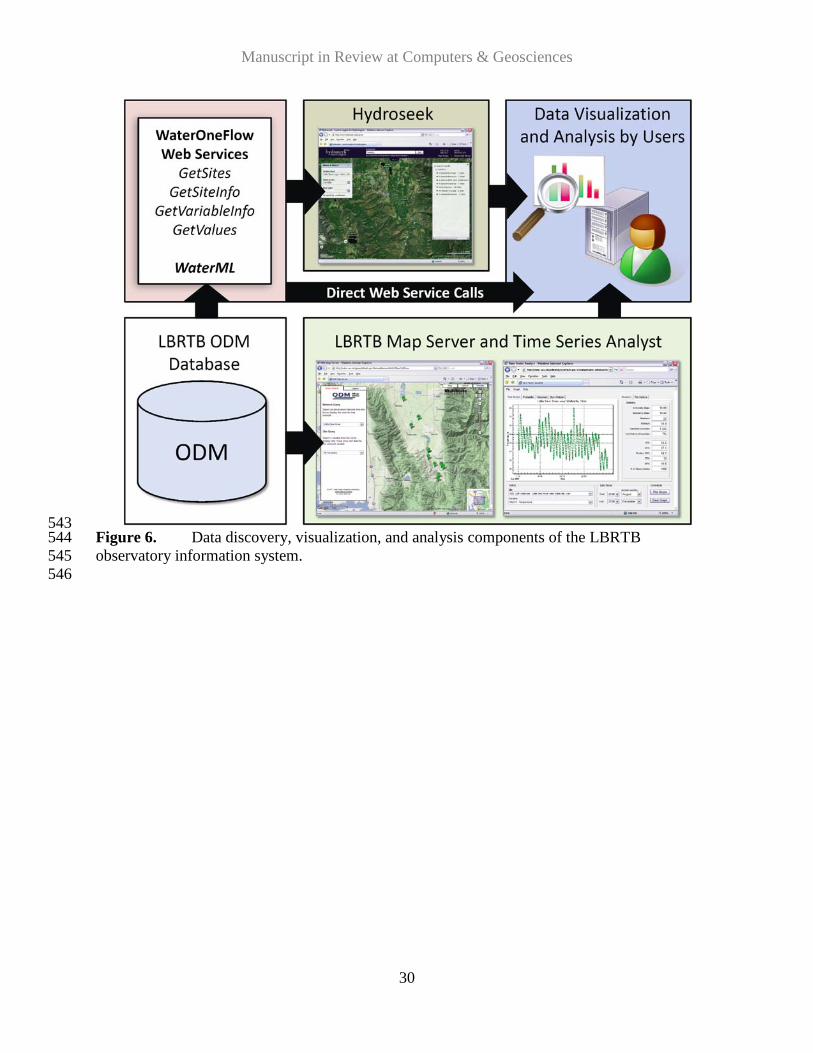
Figure 6 shows the resulting architecture of the LBRTB observatory information system. 340
It illustrates how users can interact with the LBRTB observations database indirectly through the 341
WOF web services, through high level search applications like Hydroseek, and through specific 342
tools that we have built for data discovery, visualization, and analysis, including the LBRTB 343
map server and Time Series Analyst. The flexibility of this system can appeal to a broad range 344
of users, from programmers that want to call the web services to get data for scientific analyses 345
to more casual users that simply want to examine a plot of the data on the Internet. 346
4. Discussion and Conclusions 347
Collection and management of high frequency data present challenges for the community 348
of scientists working toward the establishment of large-scale environmental observatories. In 349
this paper, we have presented the architecture and functional requirements of an observatory 350
information system for collecting, storing, and publishing point observations data. The LBRTB 351
observatory information system is made up of hardware and software components that together 352
demonstrate a specific implementation of the general architecture and advance the 353
cyberinfrastructure available for observatories. The LBRTB information system has enabled the 354
storage and management of all of our test bed data and open and free distribution of the data via 355
simple to use, Internet-based tools. The components of the LBRTB information system are also 356
transferrable, which has been demonstrated by their use at other sites within the network of test 357
beds. Thier applicability may extend beyond observatories to all data-intensive studies where 358
management and publication of observational data is required. 359

Manuscript in Review at Computers & Geosciences
17
The use of ODM and the ODM SDL has enabled automated integration between sensors 360
in the field and a central observations database that persistently stores the data and its metadata. 361
Automation of the data loading task eliminates potential errors and ensures that the database 362
always contains the most recent data. ODM Tools provides graphical tools for transitioning data 363
from raw sensor streams to higher level, quality checked and derived data series that can be 364
confidently used for scientific analyses while preserving the provenance of the data through the 365
editing process. 366
The WOF web services and WaterML serve as a data communication mechanism that is 367
platform, application, and programming language independent, promoting interoperability 368
among all of the observatory test beds. WaterML ensures that data retrieved from all of the test 369
beds is syntactically and semantically similar. Through adoption of a SOA, the test beds have 370
created a national network of consistently published scientific data, and application programmers 371
can program against their web services as if the data were located on their own machine. This is 372
the type of functionality that must be supported within the proposed network of large-scale 373
environmental observatories if they are to be community resources. 374
Data discovery and visualization tools such as the LBRTB map server and the Time 375
Series Analyst provide data users with the ability to quickly screen data to find what they are 376
most interested in. The linkage of the two and their accessibility within a Web browser makes 377
the data more user-friendly to individuals who are not familiar with the Little Bear River 378
watershed and also extends the reach of the data to individuals that may lack the skills to 379
successfully use the web services. 380
Manuscript in Review at Computers & Geosciences
18
Acknowledgments 381
ODM, ODM SDL, ODM Tools and the WOF Web services were developed as part of the 382
CUAHSI HIS project whose goal is to advance information system technology for hydrologic 383
science. These software tools are available from the CUAHSI HIS website http://his.cuahsi.org 384
free of charge under the open-source Berkeley Software Distribution (BSD) license. This work 385
was supported by the National Science Foundation under grants EAR 0413265, EAR 0622374, 386
and CBET 0610075. Any opinions, findings and conclusions or recommendations expressed in 387
this material are those of the authors and do not necessarily reflect the views of the National 388
Science Foundation. 389
Manuscript in Review at Computers & Geosciences
19
References 390
Beran, B., Piasecki, M., 2008. Engineering new paths to water data, Computers and Geosciences, 391 In press. doi:10.1016/j.cageo.2008.02.017. 392
393 Bose, R., 2002. A conceptual framework for composing and managing scientific data lineage, in 394
Proceedings of the 14th International Conference on Scientific and Statistical Database 395 Management, pp. 15-19, IEEE Press, Pascataway, N. J. 396
397 Colomb, R. L., 1997. Impact of semantic heterogeneity on federating databases, The Computer 398
Journal, 40 (5), 235-244, doi:10.1093/comjnl/40.5.235. 399 400 Connolly, T., Begg, C., 2005. Database Systems A Practical Approach to Design, 401
Implementation, and Management, 4th edn., Addison-Wesley, Harlow, U. K. 402 403 Droegemeier, K. K., Brewster, K., Xue, M., Weber, D., Gannon, D., Plale, B., Reed, D., 404
Ramakrishnan, L., Alameda, J., Wilhelmson, R., Baltzer, T., Domenico, B., Murray, D., 405 Ramamurthy, M., Wilson, A., Clark, R., Yalda, S., Graves, S., Ramachandran, R., Rushing, 406 J., Joseph, E., 2005. Service-oriented environments for dynamically interacting with 407 mesoscale weather, Computing in Science & Engineering, 7 (6), 12-29, 408 doi:10.1109/MCSE.2005.124. 409
410 Goodall, J. L., Horsburgh, J. S., Whiteaker, T. L., Maidment, D. R., Zaslavsky, I., 2008. A first 411
approach to Web services for the National Water Information System, Environmental 412 Modelling & Software, 23 (4), 404-411, doi:10.1016/j.envsoft.2007.01.005. 413
414 Gray, J., Liu, D. T., Nieto-Santisteban, M., Szalay, A., DeWitt, D. J., Heber, G., 2005. Scientific 415
data management in the coming decade, SIGMOD Record, 34 (4), 34-41, 416 doi:10.1145/1107499.1107503. 417
418 Hart, J. K., Martinez, K. 2006. Environmental sensor networks: A revolution in earth system 419
science?, Earth-Science Reviews, 78, 177-191, doi:10.1016/j.earscirev.2006.05.001. 420 421 Hill, D. J., Minsker, B., Amir, E., 2007. Real-time Bayesian anomaly detection for 422
environmental sensor data, In: Proceedings: 32nd Congress of the International Association of 423 Hydraulic Engineering and Research (IAHR 2007), Venice, Italy. (Available at 424 http://reason.cs.uiuc.edu/eyal/papers/Bayesian-anomaly-sensor-IAHR07.pdf) 425
426 Horsburgh, J. S., Tarboton, D. G., Maidment, D. R., Zaslavsky, I., 2008a. A relational model for 427
environmental and water resources data, Water Resources Research, 44, W05406, 428 doi:10.1029/2007WR006392. 429
430 Horsburgh, J. S., Tarboton, D. G., Piasecki, M., Maidment, D. R., Zaslavsky, I., Valentine, D., 431
Whitenack, T., 2008b. An integrated system for publishing environmental observations data, 432 Environmental Modelling & Software, doi:10.1016/j.envsoft.2009.01.002 (In Press) 433
434

Manuscript in Review at Computers & Geosciences
20
Jeong, S., Liang, Y., Liang, X., 2006. Design of an integrated data retrieval, analysis, and 435 visualization system: Application in the hydrology domain, Environmental Modelling & 436 Software, 21, 1722-1740, doi:10.1016/j.envsoft.2005.09.007. 437
438 Kirchner, J. W., 2006. Getting the right answers for the right reasons: Linking measurements, 439
analyses, and models to advance the science of hydrology, Water Resources Research, 42, 440 W03S04, doi:10.1029/2005WR004362. 441
442 Liu, Y., Minsker, B., Hill, D., 2007. Cyberinfrastructure technologies to support QA/QC and 443
event-driven analysis of distributed sensing data, In: Proceedings: International Workshop 444 on Advances in Hydroinformatics, Niagara Falls, Canada. (Available at 445 http://colab.ncsa.uiuc.edu/EESHG1/Documents/repository/conference/CyberinfrastructureTe446 chQAQC.pdf
448 ) 447
Maidment, D. R. (Ed.), 2005. Hydrologic Information System Status Report, Version 1, 449 Consortium of Universities for the Advancement of Hydrologic Science Inc, Washington, D. 450 C., 224 p. (Available at http://www.cuahsi.org/docs/HISStatusSept15.pdf) 451
452 Maidment, D. R. (Ed.), 2008. CUAHSI Hydrologic Information System: Overview of Version 453
1.1, Consortium of Universities for the Advancement of Hydrologic Science Inc, 454 Washington, D. C., 92 p. (Available at http://his.cuahsi.org/documents/HISOverview.pdf) 455
456 Michener, W. K., Brunt, J. W., Helly, J. J., Kirchner, T. B., Stafford, S. G., 1997. Nongeospatial 457
metadata for the ecological sciences, Ecological Applications, 7 (1), 330-342, 458 doi:10.1890/1051-0761(1997)007[0330:NMFTES]2.0.CO;2. 459
460 Montgomery, J. L., Harmon, T., Kaiser, W., Sanderson, A., Haas, C. N., Hooper, R., Minsker, 461
B., Schnoor, J., Clesceri, N. L., Graham, W., Brezonik, P., 2007. The WATERS Network: 462 an integrated environmental observatory network for water research, Environmental Science 463 and Technology, 41 (19), 6642-6647. (Available at 464 http://pubs.acs.org/subscribe/journals/esthag/41/i19/pdf/100107feature_waters.pdf) 465
466 Mourad, M., Bertrand-Krajewski, J. L., 2002. A method for automatic validation of long time 467
series of data in urban hydrology, Water Science & Technology, 45 (4-5), 263-270. 468 469 National Research Council, 2008. Integrating Multiscale Observations of U.S. Waters, 470
Committee on Integrated Observations for Hydrologic and Related Sciences, Water Science 471 and Technology Board, Division on Earth and Life Studies, The National Academies Press, 472 Washington, D. C. 473
474 National Science Foundation, 2007. Cyberinfrastructure vision for 21st century discovery, 475
National Science Foundation Cyberinfrastructure Council, NSF 07-28. (Available at 476 http://www.nsf.gov/pubs/2007/nsf0728/index.jsp) 477
478
Manuscript in Review at Computers & Geosciences
21
Sheth, A. P., Larson, J. A., 1990. Federated database systems for managing distributed, 479 heterogeneous, and autonomous databases, Computing Surveys, 22 (3), 480 doi:10.1145/96602.96604. 481
482 Valentine, D., Zaslavsky, I., Whitenack, T., Maidment, D. R., 2007. Design and implementation 483
of CUAHSI WATERML and WaterOneFlow web services, Extended Abstract, Published 484 Collection: Geoinformatics 2007 Bibliography. (Available at 485 http://gsa.confex.com/gsa/2007GE/finalprogram/abstract_122329.htm) 486
487 WATERS Network, 2008. Draft science, education, and design strategy for the WATer and 488
Environmental Research Systems Network, WATERS Network Project Office. (Available at 489 http://www.watersnet.org/docs/SEDS-20080227-draft.pdf) 490
491 Youn, C., Baru, C., Bhatia, K., Chandra, S., Lin, K., Memon, A., Memon, G., Seber, D., 2007. 492
GEONGrid portal: design and implementations, Concurrency and Computation: Practice 493 and Experience, 19 (12), 1597-1607, doi:10.1002/cpe.1129. 494
495 Zaslavsky, I., Valentine, D., Whiteaker, T., (Eds.), 2007. CUAHSI WaterML, OGC Discussion 496
Paper, OGC 07-041r1, Version 0.3.0. (Available at 497 http://www.opengeospatial.org/standards/dp) 498
499
Manuscript in Review at Computers & Geosciences
22
Figure Captions 500
Figure 1. Little Bear River test bed monitoring site locations. 501 502 Figure 2. Little Bear River sensor network map. 503 504 Figure 3. ODM Streaming Data Loader wizard-based graphical user interface. The top panel 505 shows the listing of datalogger files that have been mapped and scheduled to be loaded into the 506 LBRTB ODM database. The bottom panel shows the interface for mapping the individual 507 columns in a single datalogger file to the ODM schema. 508 509 Figure 4. ODM Tools data editing interface. 510 511 Figure 5. Example specific conductance data series from the Paradise monitoring site before and 512 after quality control editing using ODM Tools. 513 514 Figure 6. Data discovery, visualization, and analysis components of the LBRTB observatory 515 information system.516
Manuscript in Review at Computers & Geosciences
23
Table 1. Monitoring Sites in the LBRTB. 517
Site Number Site Name Latitude Longitude Site Type
1 Upper South Fork Little Bear River 41.4954 -111.818 Stream
2 Lower South Fork Little Bear River 41.5065 -111.8151 Stream
3 East Fork Little Bear River 41.5292 -111.7993 Stream
4 Little Bear River below Confluence of East and South Forks
41.5361 -111.8305 Stream
5 Little Bear River near Paradise 41.5756 -111.8552 Stream
6 Little Bear River near Wellsville 41.6435 -111.9176 Stream
7 Little Bear River near Mendon 41.7185 -111.9464 Stream
8 Lower Watershed Weather Station 41.667 -111.8906 Weather
9 Upper Watershed Weather Station 41.5355 -111.8059 Weather
518

Manuscript in Review at Computers & Geosciences
24
Table 2. Sensor Specifications for the LBRTB Monitoring Sites. 519 Site
Type Data Collection
Frequency Variable
Sensor
Stream 30 minutes Water Temperature Hydrolab MiniSonde 5 thermistor
Dissolved Oxygen Hydrolab MiniSonde 5 optical dissolved oxygen sensor
pH Hydrolab MiniSonde 5 reference electrode
Specific Conductance Hydrolab MiniSonde 5 four electrode conductivity sensor
Turbidity Forest Technology Systems DTS-12 Turbidity Sensor
Stage KWK Technologies SPXD-600 Pressure Transducer
Weather 1 hour Air Temperature Campbell Scientific CS215 temperature and relative humidity sensor
Relative Humidity Campbell Scientific CS215 temperature and relative humidity sensor
Solar Radiation Apogee PYR-P silicon pyranometer
Precipitation Texas Electronics TE25 tipping bucket
Barometric Pressure Setra 278 barometric pressure sensor
Wind Speed R. M. Young Wind Sentry Set
Wind Direction R. M. Young Wind Sentry Set
Manuscript in Review at Computers & Geosciences
25
520 Figure 1. Little Bear River test bed monitoring site locations. 521
Manuscript in Review at Computers & Geosciences
26
522 523
524 525
Figure 2. Little Bear River sensor network map.526

Manuscript in Review at Computers & Geosciences
27
527 (a) 528
529
530 (b) 531
532 Figure 3. The ODM Streaming Data Loader wizard-based graphical user interface. Panel 533 (a) shows the listing of datalogger files that have been mapped and scheduled to be loaded into 534 the LBRTB ODM database. Panel (b) shows the interface for mapping the individual columns in 535 a single datalogger file to the ODM schema.536

Manuscript in Review at Computers & Geosciences
28
537 538 Figure 4. ODM Tools data editing interface.539
Manuscript in Review at Computers & Geosciences
29
540 Figure 5. Example specific conductance data series from the Paradise monitoring site 541 before and after quality control editing using ODM Tools.542
Manuscript in Review at Computers & Geosciences
30
543 Figure 6. Data discovery, visualization, and analysis components of the LBRTB 544 observatory information system. 545 546