compliance with global standards: basel, coso, iso, …
TRANSCRIPT
1 | P a g e
COMPLIANCEWITHGLOBALSTANDARDS:BASEL,COSO,ISO,NIST,&SARBOX
TheEnterpriseRiskManagement(ERM)methodsdeployedbyanyorganizationshouldatleastconsider
compliancewithglobalstandardsifnotexactlymirroringCOSO(CommitteeofSponsoringOrganizations
oftheTreadwayCommission,withrespecttotheirorganizingcommitteesatAAA,AICPA,FEI,IMA,and
IIA),InternationalStandardsISO31000:2009,theU.S.Sarbanes–OxleyAct,theBaselIIIrequirementsfor
OperationalRisk(fromtheBaselCommitteethroughtheBankof InternationalSettlements),andNIST
800‐37. The parallels and applications of ROV methodologies closely mirror these regulatory and
internationalstandardsand,attimes,exceedthesestandards.Figures1‐10illustratesomeexamplesof
compliance with ISO 31000:2009, and Figures 11‐20 show compliance with Basel II and Basel III
requirements.Thesefiguresandthesummarylistsbelowassumethatthereaderisalreadyfamiliarwith
theIRMmethodologyemployedbyRealOptionsValuation,Inc.
CompliancewithInternationalStandardsOrganizationISO31000:2009
ThefollowingprovidesaquicksummarypertainingtoISOcompliance:
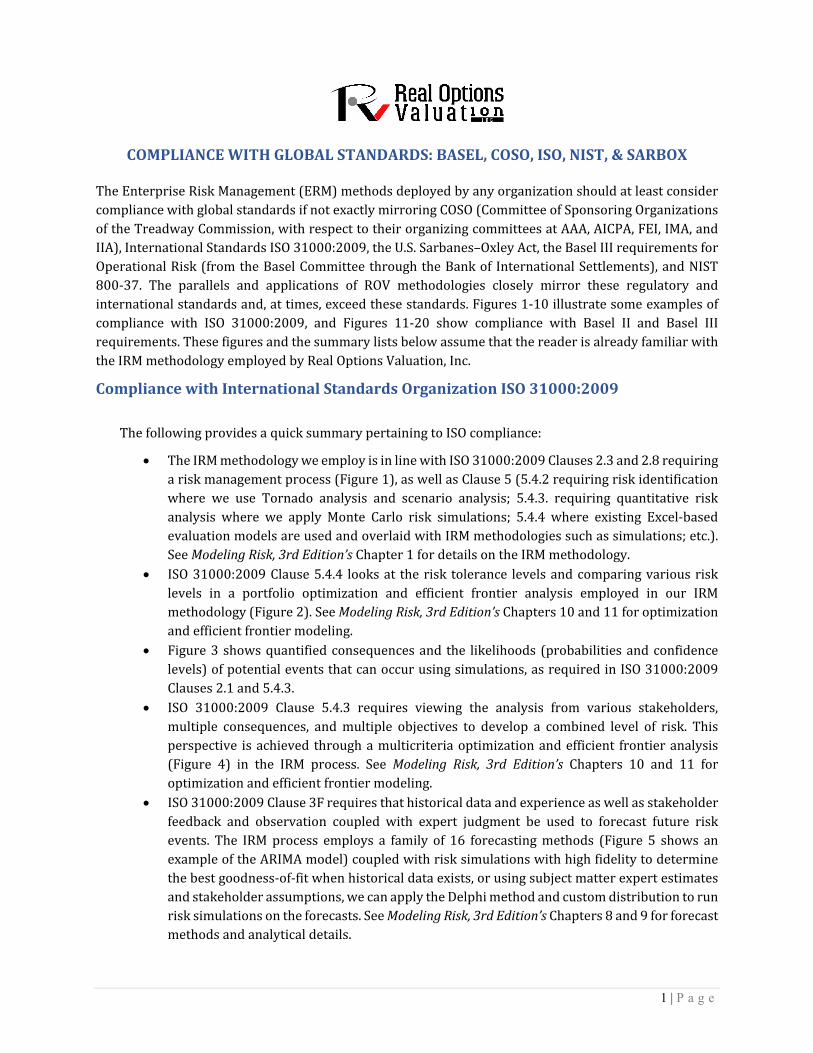
TheIRMmethodologyweemployisinlinewithISO31000:2009Clauses2.3and2.8requiring
ariskmanagementprocess(Figure1),aswellasClause5(5.4.2requiringriskidentification
where we use Tornado analysis and scenario analysis; 5.4.3. requiring quantitative risk
analysis where we apply Monte Carlo risk simulations; 5.4.4 where existing Excel‐based
evaluationmodelsareusedandoverlaidwithIRMmethodologiessuchassimulations;etc.).
SeeModelingRisk,3rdEdition’sChapter1fordetailsontheIRMmethodology. ISO31000:2009Clause5.4.4 looksat therisk tolerance levelsandcomparingvariousrisk
levels in a portfolio optimization and efficient frontier analysis employed in our IRM
methodology(Figure2).SeeModelingRisk,3rdEdition’sChapters10and11foroptimizationandefficientfrontiermodeling.
Figure3showsquantifiedconsequencesand the likelihoods (probabilitiesandconfidence
levels)ofpotentialeventsthatcanoccurusingsimulations,asrequiredinISO31000:2009
Clauses2.1and5.4.3.
ISO 31000:2009 Clause 5.4.3 requires viewing the analysis from various stakeholders,
multiple consequences, andmultiple objectives to develop a combined level of risk. This
perspective isachieved throughamulticriteriaoptimizationandefficient frontieranalysis
(Figure 4) in the IRM process. SeeModeling Risk, 3rd Edition’s Chapters 10 and 11 foroptimizationandefficientfrontiermodeling.
ISO31000:2009Clause3Frequiresthathistoricaldataandexperienceaswellasstakeholder
feedback and observation coupled with expert judgment be used to forecast future risk
events. The IRMprocess employs a family of 16 forecastingmethods (Figure 5 shows an
exampleoftheARIMAmodel)coupledwithrisksimulationswithhighfidelitytodetermine
thebestgoodness‐of‐fitwhenhistoricaldataexists,orusingsubjectmatterexpertestimates
andstakeholderassumptions,wecanapplytheDelphimethodandcustomdistributiontorun
risksimulationsontheforecasts.SeeModelingRisk,3rdEdition’sChapters8and9forforecastmethodsandanalyticaldetails.

2 | P a g e
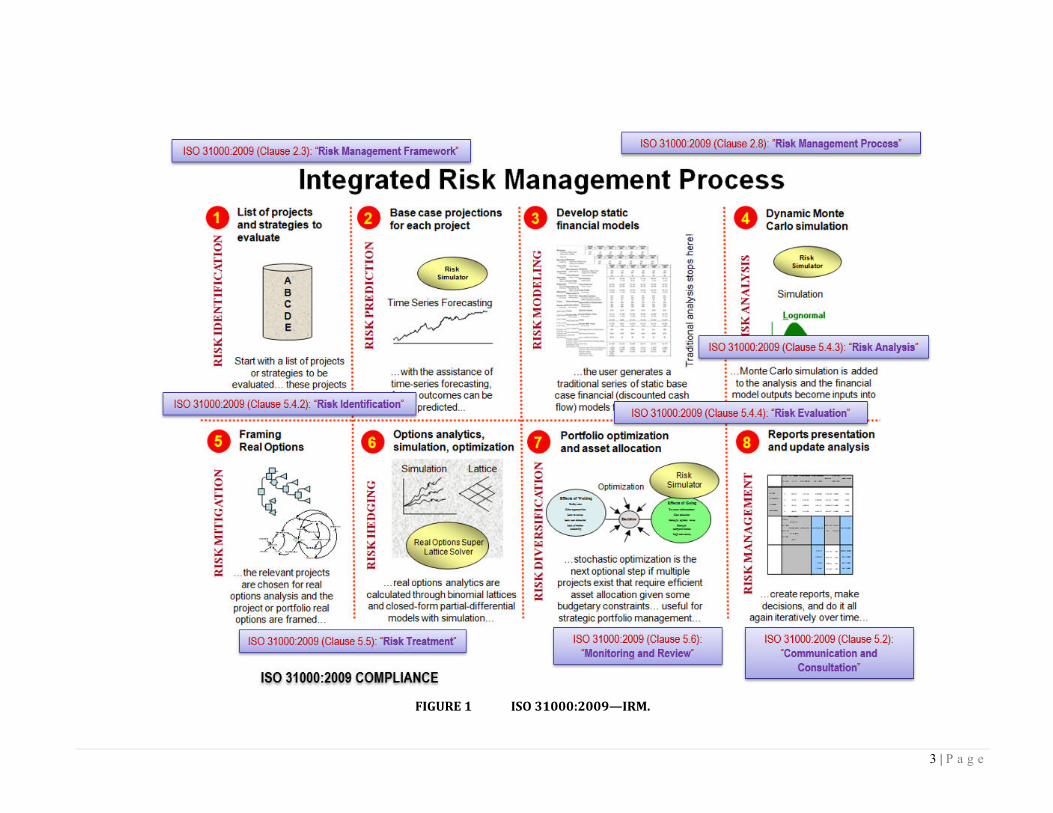
ISO31000:2009Clauses3C,5.4.3,5.5,and5.5.2requireriskevaluationsonrisktreatments,
optionstoexecutewhentherearedifferenttypesofrisks,andselectingandimplementing
variousrisktreatmentstrategicoptionsthatarenotsolelyreliantoneconomics.TheIRM’s
strategic real optionsmethodology allows users tomodelmultiple path‐independent and
path‐dependentimplementationstrategiesoralternatecoursesofactionthataregenerated
tomitigatedownsiderisksandtakeadvantageofupsidepotentials(Figure6).SeeModelingRisk,3rdEdition’sChapters12and13fordetailsonrealoptionsanalysismodelingtechniques.
Figure7illustrateshowISO31000:2009Clauses3D,3E,and5.4.3aresatisfiedusingtheIRM
process of probability distribution fitting of uncertain variables and how their
interdependencies(correlations)areexecuted.
Riskcontrolsarerequired in ISO31000:2009Clauses2.26,4.43,and5.4.3(Figure8).The
controlchartsandRiskEffectivenesscalculationsinPEATERMhelpdecisionmakersidentify
if aparticular riskmitigationstrategyandresponse thatwasenactedhadsufficientlyand
statisticallysignificantlyaffectedtheoutcomesoffutureriskstates.
Scenarios, cascading, and cumulative effects (consequences) are also the focus of ISO
31000:2009 Clause 5.4.2. The IRM method employs Tornado analysis, scenario analysis,
dynamicsensitivityanalysis,andrisksimulations(Figure9)toidentifywhichinput(s)have
thehighestimpactontheorganization’srisksandmodeltheirimpactsonthetotalrisksof
theorganization.
ISO 31000:2009 Clause 5.2 requires proper communication of risk exposures and
consequences,andanunderstandingofthebasisandreasonsofeachrisk.ThePEATERM
Risk Dashboards provide details and insights for a better understanding of the issues
governingeachoftheriskissuesinanorganization(Figure10).
3 | P a g e
FIGURE1 ISO31000:2009—IRM.

4 | P a g e
FIGURE2 ISO31000:2009—risktolerance.

5 | P a g e
FIGURE3 ISO31000:2009—consequencesandlikelihood.

6 | P a g e
FIGURE4 ISO31000:2009—multiplestakeholderobjectivesandconsequences.

7 | P a g e
FIGURE5 ISO31000:2009—historicaldataandfutureforwardforecast.
8 | P a g e
FIGURE6 ISO31000:2009—multipleoptions,strategies,andalternatives.

9 | P a g e
FIGURE7 ISO31000:2009structuredapproach,fitting,andcorrelations.

10 | P a g e
FIGURE8 ISO31000:2009—riskcontrolefficiencyandeffectiveness.

11 | P a g e
FIGURE9 ISO31000:2009—consequences,cascades,andscenarios.

12 | P a g e
FIGURE10 ISO31000:2009—communicationandconsultation.

13 | P a g e
CompliancewithBaselIIandBaselIIIRegulatoryRequirements
ThefollowingprovidesasummaryofBaselIIandBaselIIIcompliancewhenusingtheIRMmethodology:
Figure11showsMonteCarlorisksimulationsappliedtodetermineconfidencelevels,percentiles,
and probabilities of occurrence using historically fitted data or forecast expectations. These
methodsareinlinewithBaselIIandBaselIIIrequirementsSections16and161concerningtheuse
ofhistorical simulations,MonteCarlo simulations, and99thpercentile confidence intervals. See
ModelingRisk,3rdEdition’sChapters5and6fordetailsonsimulationsanddatafittingtechniques. Figure12showsacorrelatedsimulationofaportfolioofassetsandliabilities,whereassetreturns
are correlated against one another in a portfolio and optimization routines were run on the
simulated results.Theseprocessesprovide compliancewithBasel II andBasel III requirements
Sections178, 232, and527(f) involving correlations, Value atRisk orVaRmodels, portfolios of
segments,andpooledexposures(assetsandliabilities).SeeModelingRisk,3rdEdition’sChapter5for correlated simulations and Chapter 7’s case study on Basel II and Basel III Credit, Market,
Operational,andLiquidityRiskswithAssetLiabilityManagementfordetailsonhowVaRmodels
arecomputedbasedonhistoricalsimulationresults.
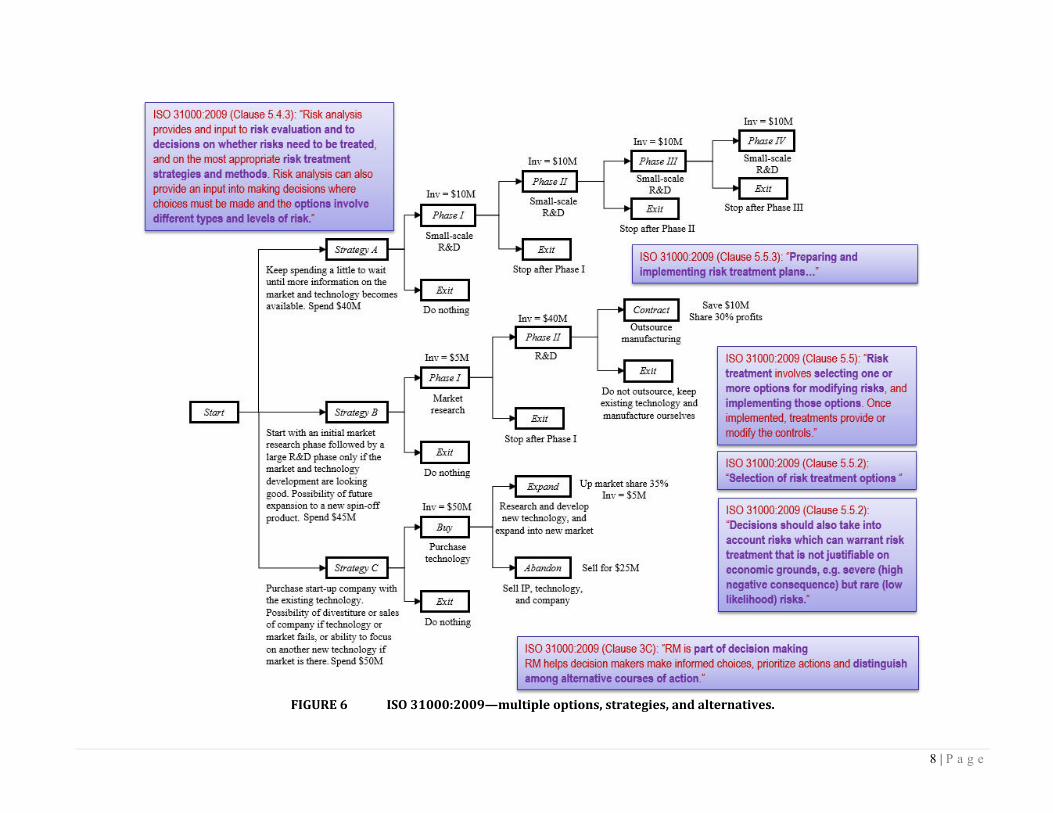
Figure13showsValueatRiskpercentileandconfidencecalculationsusingstructuralmodelsand
simulationresultsthatareinlinewithBaselIIandBaselIIIrequirementsSections179,527(c),and
527(f).Asnotedabove,seeModelingRisk,3rdEdition’sChapter7’scasestudyfordetailsonhowVaRmodelsarecomputedbasedonhistoricalsimulationresults.
Figure14showsthecomputationsofprobabilityofdefault(PD)asrequiredintheBaselAccords,
specificallyBaselIIandBaselIIISection733andAnnex2’sSection16.PDcanbecomputedusing
structuralmodelsorbasedonhistoricaldatathroughrunningbasicratiostomoreadvancedbinary
logisticmodels.ModelingRisk,3rdEdition’sChapter7’scasestudyaswellasChapter14’sCreditandMarketRiskcasestudyprovidemoreinsights intohowPDcanbecomputedusingthesevariousmethods.
Figure15showsthesimulationandgenerationofinterestrateyieldcurvesusingRiskSimulator
andModelingToolkitmodels.ThesemethodsareinlinewithBaselIIandBaselIIIrequirements
Section763requiringtheanalysisofinterestratefluctuationsandinterestrateshocks.
Figure16 showsadditionalmodels for volatile interest rate, financialmarkets, andother liquid
instruments’ instantaneous shocks using Risk Simulator’s stochastic process models. These
analysesconformtoBaselIIandBaselIIIrequirementsSections155,527(a),and527(b).
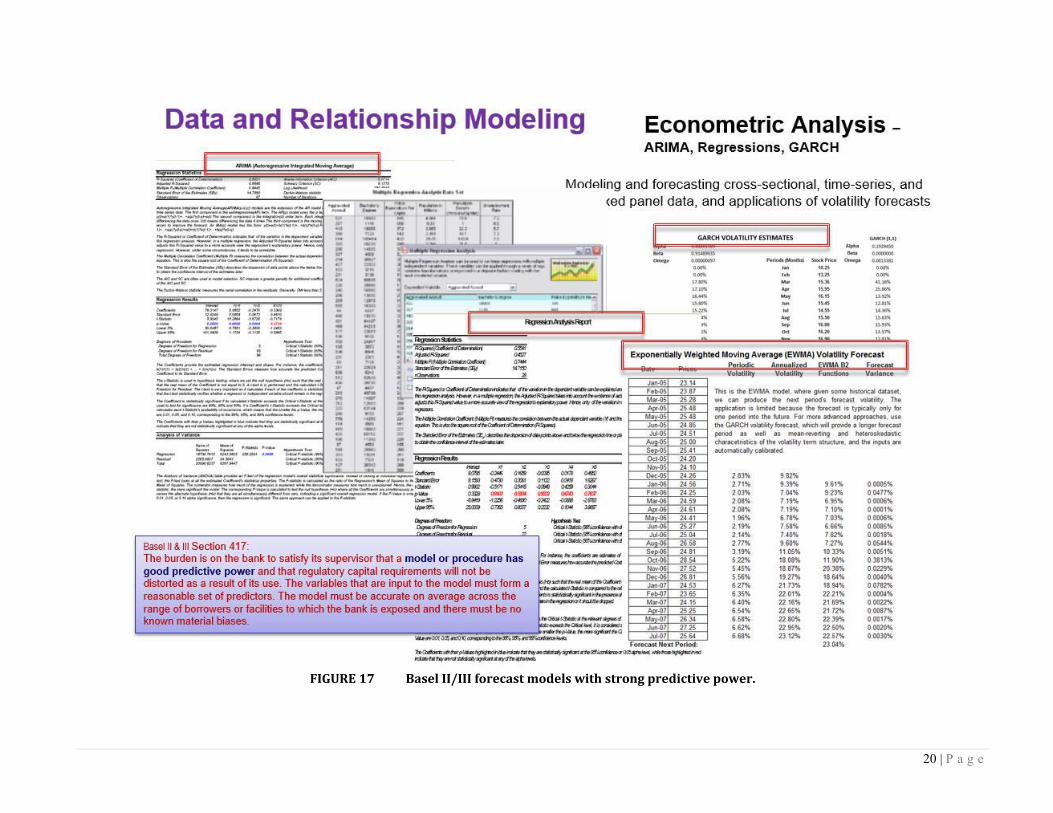
Figure17showsseveralforecastmodelswithhighpredictiveandanalyticalpower,whichisapart
oftheRiskSimulatorfamilyofforecastmethods.SuchmodelingprovidescompliancewithBaselII
andBaselIIIrequirementsSection417requiringmodelsofgoodpredictivepower.
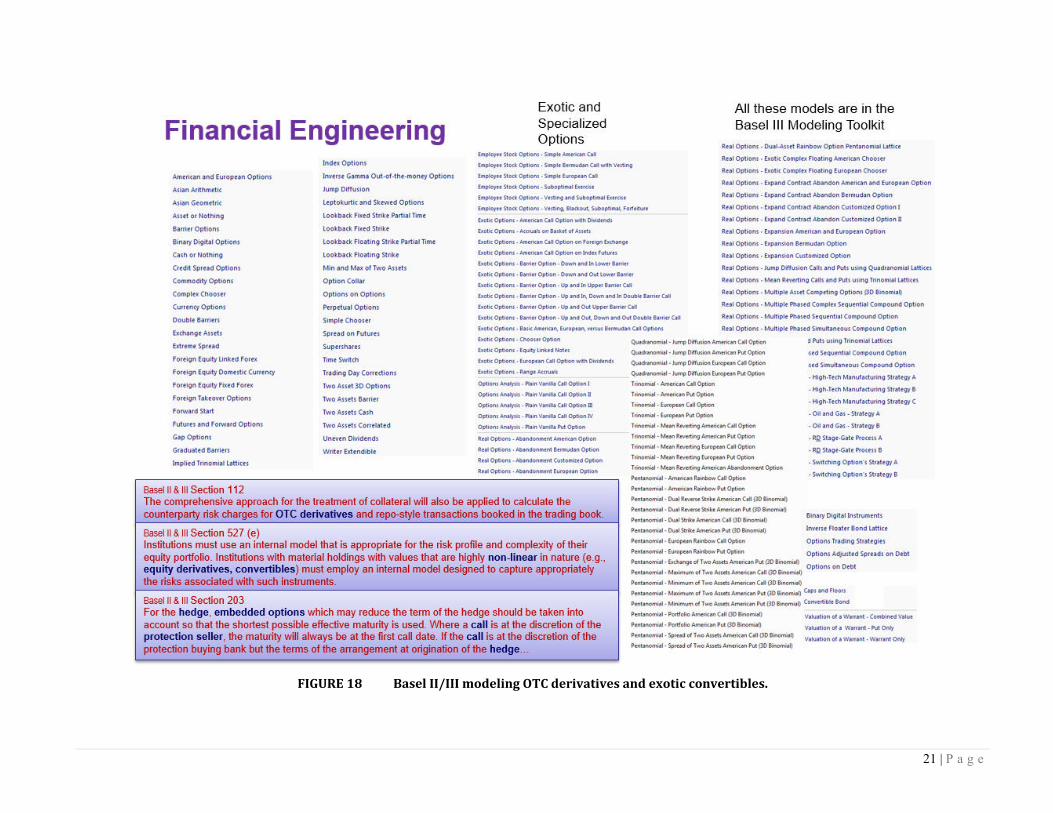
Figure18showsthelistoffinancialandcreditmodelsavailableintheROVModelingToolkitand
ROV Real Options SLS software applications. These models conform to Basel II and Basel III
requirementsSections112,203,and527(e)requiringtheabilitytovalueover‐the‐counter(OTC)
derivatives,nonlinearequityderivatives,convertibles,hedges,andembeddedoptions.
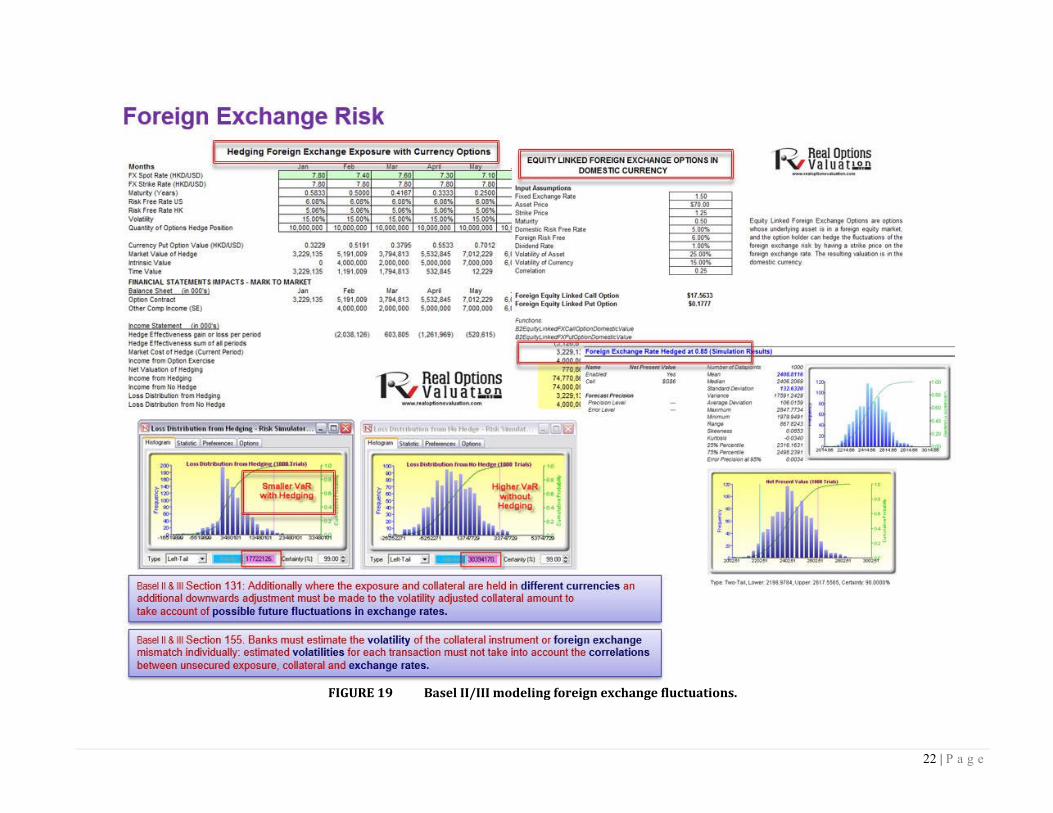
Figure19showsthemodelingofforeignexchangeinstrumentsandhedgestodeterminetheefficacy
and effectiveness of foreign exchange hedging vehicles and their impact on valuation, portfolio
profitability,andVaR,inlinewithBaselIIandBaselIIISections131and155requiringtheanalysis
ofdifferentcurrencies,correlations,volatility,andhedges.
Figure20showstheoption‐adjustedspread(OAS),creditdefaultswaps(CDS),andcreditspread
options(CSO)modelsinROVModelingToolkit.ThesemodelsprovidecompliancewithBaselIIand
BaselIIIrequirementsSections140and713pertainingtomodelingandvaluingcreditderivatives
andcredithedges.

14 | P a g e
FIGURE11 BaselII/IIIconfidencelevels,MonteCarlosimulations,andcreditrisk.

15 | P a g e
FIGURE12 BaselII/IIIcorrelatedportfoliosandcorrelatedsimulations.
16 | P a g e
FIGURE13 BaselII/IIIValueatRiskandpercentiles.

17 | P a g e
FIGURE14 BaselII/IIIcreditriskanalysis.

18 | P a g e
FIGURE15 BaselII/IIIinterestrateriskandmarketshocks.

19 | P a g e
FIGURE16 BaselII/IIIvolatilityandadverseinstantaneousshocks.
20 | P a g e
FIGURE17 BaselII/IIIforecastmodelswithstrongpredictivepower.
21 | P a g e
FIGURE18 BaselII/IIImodelingOTCderivativesandexoticconvertibles.
22 | P a g e
FIGURE19 BaselII/IIImodelingforeignexchangefluctuations.

23 | P a g e
FIGURE20 BaselII/IIIcreditderivativesandhedging.

24 | P a g e
CompliancewithCOSOIntegratedERMFramework
ThefollowingprovidesaquicksummaryofCOSOIntegratedERMFrameworkcompliancewhenusing
theIRMmethodology:
Figure21(16.45)showsthePEATERMmodule’sRiskRegistertabwheremitigationcostsand
benefits(grossrisksreducedtoresidualrisklevels),likelihoodandimpactmeasures,andspreads
withvaryingprecisionlevelsreadyforMonteCarlorisksimulationaresituated,incompliance
withCOSOERMFrameworkSections5&6.
Figure22(16.46)showsthePEATERMmodulewherethelikelihoodandimpactwithinarisk
mapisgenerated,incompliancewithCOSOAT/Exhibit5.13.
Figure 23 (16.47) shows compliance with COSO AT/Exhibit 6.5 and COSO ERM Integrated
FrameworkSection6,whereentity‐wideportfolioandbusinessunit,department,andfunctional
areas’grossandresidualrisksarecomputed.
Figure 24 (16.48) continues by showing a sample of the Risk Dashboard reports also in
compliancewithCOSOAT/Exhibit6.5andCOSOERMIntegratedFrameworkSection6,where
entity‐wideportfolioandbusinessunit,department,andfunctionalareas’grossandresidualrisks
arecomputedandcomparedagainsteachother.
Figure25(16.49)showsthePEATDCFmodule’sefficientfrontiermodel,consistentwithCOSO
AT/Exhibit3.7requiringananalysisofthecapitalinvestmentinrelationtothereturnswithina
diversified(optimized)portfolio.
Figure26(16.50)showsthePEATERMandDCFmodules’simulatedresults,whereValueatRisk,
percentiles,andstatisticalprobabilitiescanbeobtained,incompliancewithCOSOAT/Exhibit5.5
requiringarangeofoutcomesbasedondistributionalassumptions,andCOSOERMIntegrated
Framework Exhibit 5.2 requiring historical or simulated outcomes of future behaviors under
probabilisticmodels.
Figure 27 (16.51) shows compliancewith COSOAT/Exhibit 3.1 requiring the use of scenario
modelingandstresstesting.
Figure28(16.52)showstheCMOLmoduleinPEATwherescenarioanalysis,stresstesting,and
gap analysis are performed, in compliance with COSO AT/Exhibit 5.10, to complement
probabilisticmodels.
Figure29(16.53)showscompliancewithCOSOAT/Exhibits5.8&5.9requiringthemodelingof
operational and credit loss distributionswith back‐testing or historical simulation, sensitivity
analysis,andValueatRiskcalculations.

25 | P a g e
FIGURE21 PEATERMandCOSOIntegratedFramework.

26 | P a g e
FIGURE22 PEATERMheatmapandriskmatrix.

27 | P a g e
FIGURE23 PEATERMportfolioandcorporatevieworresidualrisk.

28 | P a g e
FIGURE24 PEATERMportfolio,businessunit,department,functionview

29 | P a g e
FIGURE25 PEATDCFmodulefeaturingcapitalversusreturnsefficientfrontier

30 | P a g e
FIGURE26 PEATERM&DCFmoduleswithrisksimulationresultswithValueatRisk

31 | P a g e
FIGURE27 PEATERM&DCFmoduleswithscenarioanalysisandheatmapregions

32 | P a g e
FIGURE28 CMOLmodulewithscenarioanalysisandstresstesting

33 | P a g e
FIGURE29 CMOLmodulewithhistoricalsimulation(back‐testing)andValueatRisk
