compliance offset protocol livestock projects · pdf fileoctober 20, 2011 . compliance offset...
TRANSCRIPT
October 20, 2011
Compliance Offset Protocol Livestock Projects
Capturing and Destroying Methane from
Manure Management Systems
Adopted: October 20, 2011
California Environmental Protection Agency
AIR RESOURCES BOARD

(This page left intentionally blank)
Table of Contents Abbreviations and Acronyms ........................................................................................... 2 1 Introduction ............................................................................................................... 4 2 The GHG Reduction Project ..................................................................................... 5
2.1 Background ....................................................................................................... 5 2.2 Project Definition – Quantification Methodology................................................ 5 2.3 Offset Project Operator or Authorized Project Designee ................................... 5
3 Eligibility Rules.......................................................................................................... 6 3.1 Location ............................................................................................................ 6 3.2 Offset Project Commencement ......................................................................... 6 3.3 Project Crediting Period .................................................................................... 6 3.4 Additionality ....................................................................................................... 6 3.5 Regulatory Compliance ..................................................................................... 6
4 Offset Project Boundary – Quantification Methodology ............................................ 7 5 Quantifying GHG Emission Reductions – Quantification Methodology ................... 12
5.1 Quantifying Baseline Methane Emissions ....................................................... 12 5.2 Quantifying Project Methane Emissions ......................................................... 18 5.3 Metered Methane Destruction Comparison..................................................... 23 5.4 Quantifying Baseline and Project Carbon Dioxide Emissions ......................... 24
6 Project Documentation and Monitoring Requirements ............................................ 26 6.1 Biogas Measurement Instrument QA/QC ........................................................ 27 6.2 Monitoring Parameters – Quantification Methodology .................................... 28
7 Reporting Parameters ............................................................................................. 36 7.1 Annual Reporting Requirements ..................................................................... 36 7.2 Document Retention ....................................................................................... 36 7.3 Verification Cycle ............................................................................................ 37
8 Glossary of Terms .................................................................................................. 38 9 References ............................................................................................................. 40 Appendix A Emission Factor Tables – Quantification Methodology ............................ 41 Appendix B Data Substitution – Quantification Methodology .................................... 51
B.1 Missing Data ................................................................................................... 51 Appendix C Project Listing Information ....................................................................... 53 Appendix D Offset Project Data Report Information .................................................... 53
1
List of Tables Table 4.1. Description of all Sources, Sinks, and Reservoirs .......................................... 9 Table 6.1. Project Monitoring Parameters ..................................................................... 29 List of Figures Figure 4.1. General Illustration of the Offset Project Boundary ....................................... 8 List of Equations Equation 5.1. GHG Reductions from Installing a Biogas Control System...................... 12 Equation 5.2. Modeled Baseline Methane Emissions ................................................... 13 Equation 5.3. Modeled Baseline Methane Emissions from Anaerobic Storage/Treatment Systems ........................................................................................................................ 14 Equation 5.4. Modeled Baseline Methane for Non-Anaerobic Storage/Treatment Systems ........................................................................................................................ 15 Equation 5.5. Project Methane Emissions ..................................................................... 19 Equation 5.6. Project Methane Emissions from the Biogas Control System ................. 20 Equation 5.7. Methane Emissions from Venting Events ................................................ 21 Equation 5.8. Project Methane Emissions from the BCS Effluent Pond ........................ 22 Equation 5.9. Project Methane Emissions from Non-BCS Related Sources ................. 23 Equation 5.10. Metered Methane Destruction ............................................................... 24 Equation 5.11. Carbon Dioxide Emission Calculations ................................................. 25 List of Appendix Tables Table A.1. Manure Management System Components ................................................. 41 Table A.2. Livestock Categories and Typical Average Mass (TAM) .............................. 42 Table A.3. Volatile Solids and Maximum Methane Potential by Livestock Category ..... 42 Table A.4. Biogas Collection Efficiency (BCE) by Digester Type .................................. 42 Table A.5. 2007 Volatile Solid Default Values for Dairy Cows, Heifers, Heifers-Grazing and Cows-Grazing by State (kg/day/1000 kg mass) ..................................................... 43 Table A.6.a IPCC 2006 Methane Conversion Factors by Manure Management System Component/Methane Source ‘S’……………………………………………………………..44 Table A.6.b. Biogas Destruction Efficiency Default Values by Destruction Device…….48 Table A.7. CO2 Emission Factors for Fossil Fuel Use……………………………………..49 Table A.8. CO2 Electricity Emission Factors………………………………………………..50

2
Abbreviations and Acronyms ARB
California Air Resources Board
BCS
BDE
Biogas control system Biogas destruction efficiency
CAR Climate Action Reserve
CH4 Methane
CNG Condensed natural gas
CO2 Carbon dioxide
EPA U.S. Environmental Protection Agency
GHG Greenhouse gas
GWP Global Warming Potential
IPCC Intergovernmental Panel on Climate Change
lb Pound
LNG MS
Liquefied natural gas Management system
MT or t Metric ton
N2O Nitrous oxide
NG Natural gas
QA/QC Quality Assurance/Quality Control
Regulation Regulation, title 17, California Code of Regulations, sections 95800 et seq.
scf Standard cubic foot
SSR STP
Source, sink, and reservoirs Standard temperature and pressure

3
TAM VS
Typical average mass Volatile solids
4
1 Introduction The Compliance Offset Protocol Livestock Projects provides methods to quantify and report greenhouse gas (GHG) emission reductions associated with the installation of a biogas control system (BCS) for manure management on dairy cattle and swine farms. The protocol focuses on quantifying the change in methane emissions, but also accounts for effects on carbon dioxide emissions. The protocol is based on the Climate Action Reserve’s Livestock Project Protocol Version 2.21 and includes some clarifications and updates from Version 3.0.2. Offset Project Operators or Authorized Project Designees that install manure biogas capture and destruction technologies use the methods contained in this protocol to quantify and report GHGs. The protocol provides eligibility rules, methods to quantify GHG reductions, offset project-monitoring instructions, and procedures for preparing Offset Project Data Reports. Additionally, all offset projects must submit to annual, independent verification by ARB-accredited verification bodies. Requirements for verification bodies to verify Offset Project Data Reports are provided in the Cap and Trade Regulation (Regulation). This protocol is designed to ensure the complete, consistent, transparent, accurate, and conservative quantification of GHG emission reductions associated with a livestock digester project. The protocol is comprised of both quantification methodologies and regulatory program requirements to develop a livestock project and generate ARB or registry offset credits. AB 32 exempts quantification methodologies from the Administrative Procedure Act (APA)3, however those elements of the protocol are still regulatory. The exemption allows future updates to the quantification methodologies to be made through a public review and Board adoption process but without the need for rulemaking documents. Each protocol identifies sections that are considered quantification and exempt from APA requirements. Any changes to the non-quantification elements of the offset protocols would be considered a regulatory update subject to the full regulatory development process. Those sections that are considered to be a quantification methodology are clearly indicated in the title of the chapter or subchapter if only a portion of that chapter is considered part of the quantification methodology of the protocol.
1 Climate Action Reserve (2009) Livestock Project Protocol Version 2.2. November 3, 2009.
http://www.climateactionreserve.org/wp-content/uploads/2009/03/Livestock-Project-Protocol-Version2.2.pdf (accessed November 3, 2009)
2 Climate Action Reserve (2010) Livestock Project Protocol Version 3.0. September 29, 2010. ] http://www.climateactionreserve.org/wp-content/uploads/2009/03/U.S._Livestock_Project_Protocol_V3.02.pdf (accessed September 29, 2010)
3 Health and Safety Code section 38571
5
2 The GHG Reduction Project
2.1 Background Manure treated and stored under anaerobic conditions decomposes to produce methane, which, if uncontrolled, is emitted to the atmosphere. This predominantly occurs when livestock operations manage waste with anaerobic liquid-based systems (e.g. in lagoons, ponds, tanks, or pits). Within the livestock sector, the primary drivers of methane generation include the amount of manure produced and the fraction of volatile solids that decompose anaerobically. Temperature and the retention time of manure during treatment and storage also affect methane production.
2.2 Project Definition – Quantification Methodology For purposes of this protocol, offset project is defined as the installation of a biogas control system that captures and destroys methane gas from anaerobic manure treatment and/or storage facilities on livestock operations.4 The biogas control system must destroy methane gas that would otherwise have been emitted to the atmosphere in the absence of the offset project from uncontrolled anaerobic treatment and/or storage of manure.5 Captured biogas can be destroyed on-site, or transported for off-site use (e.g. through gas distribution or transmission pipeline), or used to power vehicles. Regardless of how biogas is utilized, the ultimate fate of the methane must be destruction. “Centralized digesters” that integrate waste from more than one livestock operation may also meet the definition of an offset project.6
2.3 Offset Project Operator or Authorized Project Designee The Offset Project Operator or Authorized Project Designee is responsible for project listing, monitoring, reporting and verification. The Offset Project Operator or Authorized Project Designee must submit the information in the Regulation and in Appendices C and D of this protocol. The Offset Project Operator or Authorized Project Designee must have legal authority to implement the offset project.
4 Biogas control systems are commonly called digesters, which may be designed and operated in a variety of ways, from ambient temperature covered lagoons to heated lagoons to mesophilic plug flow or complete mix concrete tank digesters. 5 The installation of a BCS at an existing livestock operation where the primary manure management system is aerobic (produces little to no methane) may result in an increase of the amount of methane emitted to the atmosphere. Thus, the BCS must digest manure that would primarily be treated in an anaerobic system in the absence of the project in order for the project to meet the definition of an offset project. 6 The protocol does not preclude Offset Project Operators or Authorized Project Designees from co-digesting organic matter in the biogas control system. However, the additional organics could impact the nutrient properties of digester effluent, which Offset Project Operators or Authorized Project Designees should consider when assessing the offset project’s associated water quality impacts.
6
3 Eligibility Rules Offset projects that meet the project definition and requirements in section 2.2 must fully satisfy the eligibility requirements in the Regulation in addition to the eligibility rules listed below to be eligible to receive ARB or registry offset credits.
3.1 Location Only projects located in the United States and its territories are eligible under this protocol. In addition, offset projects situated on the following categories of land are only eligible under this protocol if they meet the requirements of this protocol and the Regulation, including the waiver of sovereign immunity requirements of section 95975(l) of the Regulation:
1. Land that is owned by, or subject to an ownership or possessory interest of a Tribe;
2. Land that is “Indian lands” of a Tribe, as defined by 25 U.S.C. §81(a)(1); or 3. Land that is owned by any person, entity, or Tribe, within the external borders of
such Indian lands.
3.2 Offset Project Commencement For this protocol, Offset Project Commencement is defined as the date at which the offset project’s biogas control system (BCS) becomes operational. A BCS is considered operational on the date at which the system begins producing and destroying methane gas upon completion of an initial start-up period. Offset projects may always be submitted for listing prior to their commencement date.
3.3 Project Crediting Period The crediting period for this protocol is ten years.
3.4 Additionality Offset projects must meet the additionality requirements in the Regulation in addition to the requirements below.
3.4.1 Anaerobic Baseline - Quantification Methodology The Offset Project Operator or Authorized Project Designee must demonstrate that the depth of the anaerobic lagoons or ponds prior to the offset project’s implementation were sufficient to prevent algal oxygen production and create an oxygen-free bottom layer; which means at least 1 meter in depth. Greenfield livestock projects (i.e., projects that are implemented at new livestock facilities that have no prior manure management system) are eligible only if the Offset Project Operator or Authorized Project Designee can demonstrate that uncontrolled anaerobic storage and/or treatment of manure is common practice in the industry and geographic region where the offset project is located.

7
3.5 Regulatory Compliance As stated in the Regulation, an Offset Project Operator or Authorized Project Designee must fulfill all applicable local, regional and national requirements on environment impact assessments that apply based on the offset project location. Offset projects must also fulfill all local, regional, and national regulatory requirements that apply based on the offset project location. Offset projects are not eligible to receive ARB or registry offset credits for GHG reductions or GHG removal enhancements that are not in compliance with regulatory requirements.
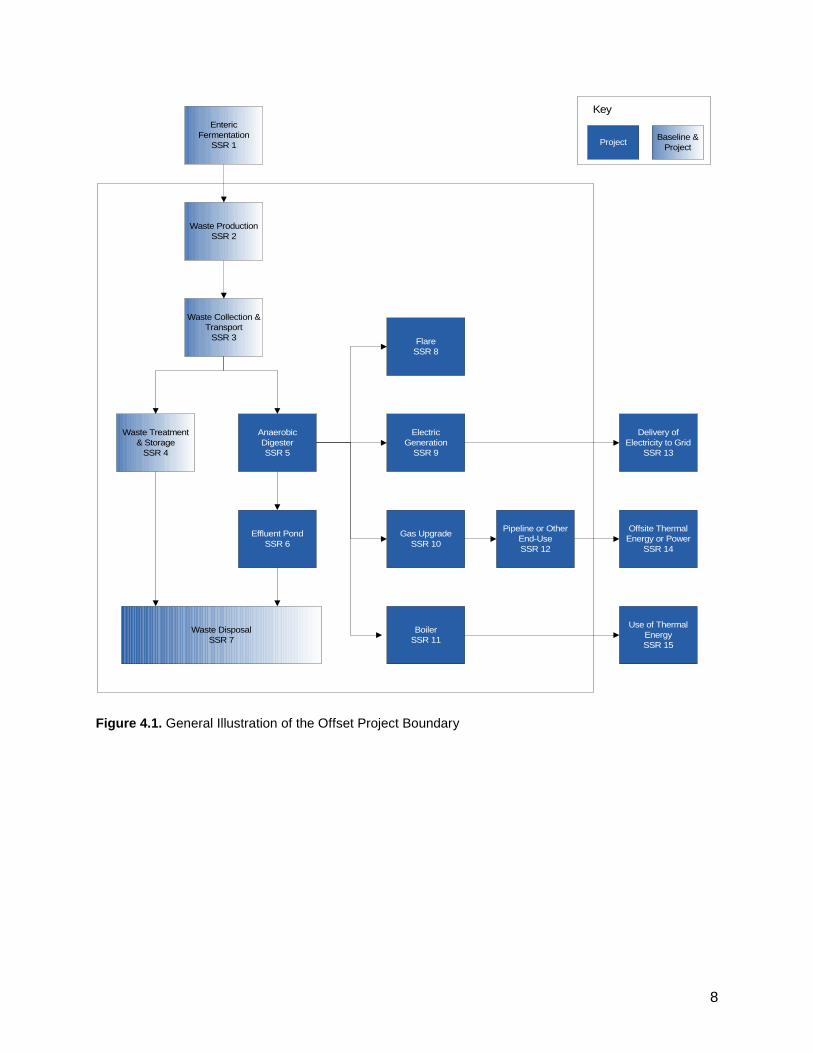
4 Offset Project Boundary – Quantification Methodology The Offset Project Boundary delineates the GHG sources, GHG sinks, and GHG reservoirs (SSRs) that shall be assessed to determine the net change in emissions associated with installing a BCS. For this protocol, the Offset Project Boundary captures sources from waste production to disposal, including off-site manure disposal. However, the calculation procedure only incorporates methane and carbon dioxide, so while nitrous oxide sources are technically within the Offset Project Boundary they are not assessed in the calculation procedure. This protocol does not account for carbon dioxide emission reductions associated with displacing grid-delivered electricity or fossil fuel use. Figure 4.1 provides a general illustration of the Offset Project Boundary, indicating which SSRs are included or excluded from the Offset Project Boundary. All SSRs within the dashed line are accounted for under this protocol. Table 4.1 provides greater detail on each SSR and information for the SSRs and gases from the Offset Project Boundary.
8
Waste ProductionSSR 2
Waste Collection & Transport
SSR 3
Pipeline or Other End-UseSSR 12
Offsite Thermal Energy or Power
SSR 14
Enteric Fermentation
SSR 1
Electric Generation
SSR 9
FlareSSR 8
Gas UpgradeSSR 10
Delivery of Electricity to Grid
SSR 13
Waste Treatment & Storage
SSR 4
Baseline & ProjectProject
Anaerobic DigesterSSR 5
Effluent PondSSR 6
Waste DisposalSSR 7
Key
BoilerSSR 11
Use of Thermal EnergySSR 15
Figure 4.1. General Illustration of the Offset Project Boundary
9
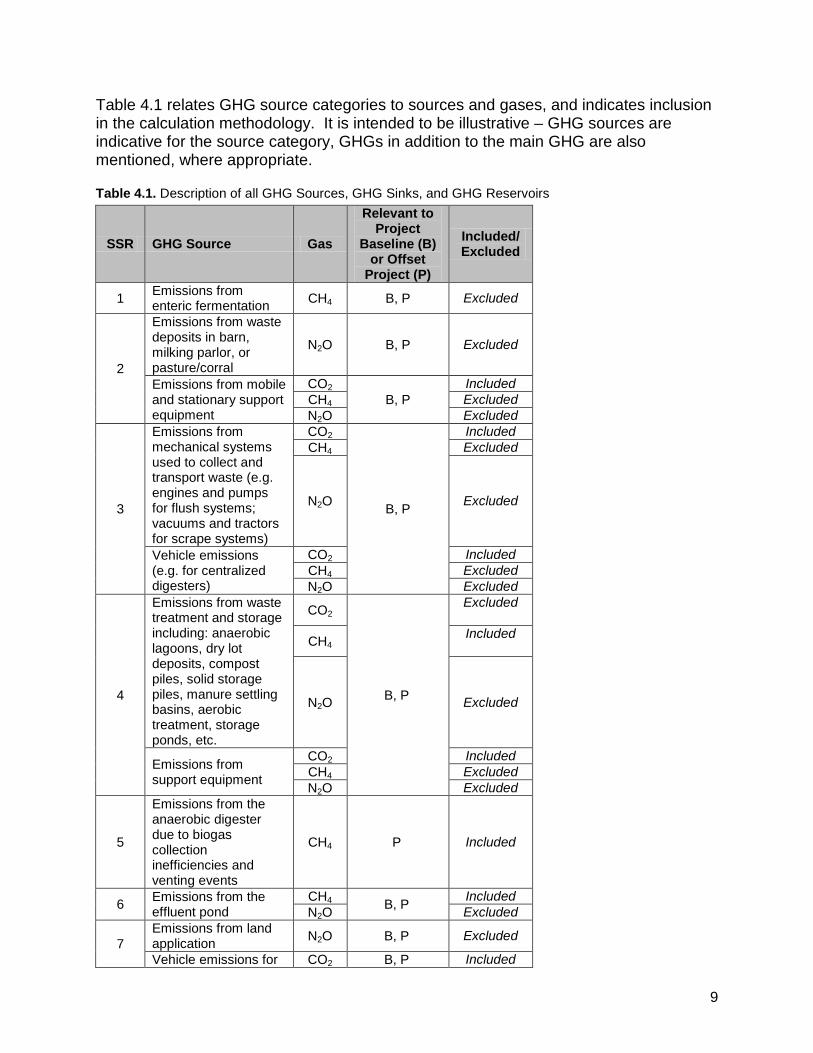
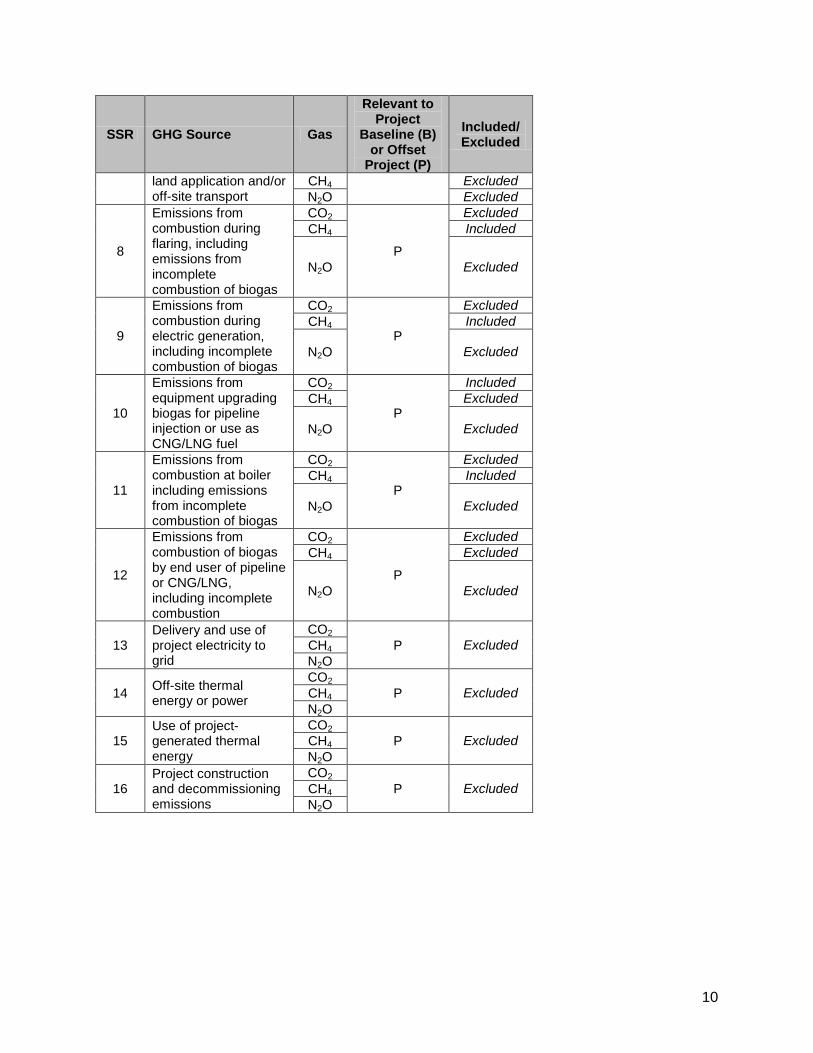
Table 4.1 relates GHG source categories to sources and gases, and indicates inclusion in the calculation methodology. It is intended to be illustrative – GHG sources are indicative for the source category, GHGs in addition to the main GHG are also mentioned, where appropriate. Table 4.1. Description of all GHG Sources, GHG Sinks, and GHG Reservoirs
SSR GHG Source Gas
Relevant to Project
Baseline (B) or Offset
Project (P)
Included/ Excluded
1 Emissions from enteric fermentation CH4 B, P Excluded
2
Emissions from waste deposits in barn, milking parlor, or pasture/corral
N2O B, P Excluded
Emissions from mobile and stationary support equipment
CO2 B, P
Included CH4 Excluded N2O Excluded
3
Emissions from mechanical systems used to collect and transport waste (e.g. engines and pumps for flush systems; vacuums and tractors for scrape systems)
CO2
B, P
Included CH4 Excluded
N2O Excluded
Vehicle emissions (e.g. for centralized digesters)
CO2 Included CH4 Excluded N2O Excluded
4
Emissions from waste treatment and storage including: anaerobic lagoons, dry lot deposits, compost piles, solid storage piles, manure settling basins, aerobic treatment, storage ponds, etc.
CO2
B, P
Excluded
CH4 Included
N2O Excluded
Emissions from support equipment
CO2 Included CH4 Excluded N2O Excluded
5
Emissions from the anaerobic digester due to biogas collection inefficiencies and venting events
CH4 P Included
6 Emissions from the effluent pond
CH4 B, P Included N2O Excluded
7 Emissions from land application N2O B, P Excluded
Vehicle emissions for CO2 B, P Included
10
SSR GHG Source Gas
Relevant to Project
Baseline (B) or Offset
Project (P)
Included/ Excluded
land application and/or off-site transport
CH4 Excluded N2O Excluded
8
Emissions from combustion during flaring, including emissions from incomplete combustion of biogas
CO2
P
Excluded CH4 Included
N2O Excluded
9
Emissions from combustion during electric generation, including incomplete combustion of biogas
CO2
P
Excluded CH4 Included
N2O Excluded
10
Emissions from equipment upgrading biogas for pipeline injection or use as CNG/LNG fuel
CO2
P
Included CH4 Excluded
N2O Excluded
11
Emissions from combustion at boiler including emissions from incomplete combustion of biogas
CO2
P
Excluded CH4 Included
N2O Excluded
12
Emissions from combustion of biogas by end user of pipeline or CNG/LNG, including incomplete combustion
CO2
P
Excluded CH4 Excluded
N2O Excluded
13 Delivery and use of project electricity to grid
CO2 P Excluded CH4
N2O
14 Off-site thermal energy or power
CO2 P Excluded CH4
N2O
15 Use of project-generated thermal energy
CO2 P Excluded CH4
N2O
16 Project construction and decommissioning emissions
CO2 P Excluded CH4
N2O

11
5 Quantifying GHG Emission Reductions – Quantification Methodology7
GHG emission reductions from a livestock offset project are quantified by comparing actual project emissions to baseline emissions at the offset project site. Project baseline emissions are an estimate of the GHG emissions from GHG sources within the Offset Project Boundary that would have occurred in the absence of the livestock offset project. Project emissions are actual GHG emissions that occur at sources within the Offset Project Boundary. Project emissions must be subtracted from the project baseline emissions to quantify the offset project’s total net GHG emission reductions (Equation 5.1), and the total number of GHG reductions submitted for issuance of ARB or registry offset credits must be rounded to the nearest whole ton. The Offset Project Operators or Authorized Project Designee should take note that some equations to calculate project baseline and project emissions are run on a month-by-month basis and activity data monitoring takes place at varying levels of frequency. As applicable, monthly emissions data (for project baseline and offset project) are summed together to calculate annual GHG emission reductions. The current methodology for quantifying the GHG emissions and GHG emission reductions associated with installing a BCS requires the use of both modeled reductions (following Equation 5.2 to Equation 5.4 and Equation 5.6 to Equation 5.9), as well as the utilization of ex-post metered data from the BCS to be used as a check on the modeled GHG reductions. There can be material differences between modeled methane emission reductions and the actual metered quantity of methane that is captured and destroyed by the BCS due to digester start-up periods, venting events, and other BCS operational issues. These operational issues have the potential to result in substantially less methane destruction than is modeled, leading to an overestimation of GHG reductions in the modeled case. To address this issue and maintain consistency with international best practice, ARB requires the modeled methane emission reduction results to be compared to the ex-post metered quantity of methane that is captured and destroyed by the BCS. The lesser of the two values will represent the total methane emission reductions for the reporting period. Equation 5.1 below outlines the quantification methodology for calculating the GHG emission reductions from the installation of a BCS.8
7The entirety of Section 5 is considered a quantification method. 8The calculation procedure only addresses direct emissions sources and does not incorporate reductions in electricity consumption, which impacts indirect emissions associated with power plants owned and operated by entities other than the Offset Project Operator or Authorized Project Designee. Equation 5.1 accounts for any increase in CO2 if the project results in an increase in electricity consumption.

12
Equation 5.1. GHG Reductions from Installing a Biogas Control System
Total GHG Reductions = (Modeled project baseline emissions CH4 – Project emissions CH4) + (project baseline emissions CO2 - Project emissions CO2)
The (Modeled project baseline emissions CH4, – Project emissions CH4) term shall be calculated according to Equation 5.2 to Equation 5.4 and Equation 5.6 to Equation 5.9. The resulting aggregated quantity of methane reductions must then be compared to the ex-post quantity of methane that is metered and destroyed in the biogas collection system, as expressed in Equation 5.10. In the case that the total ex-post quantity of metered and destroyed methane is less than the modeled methane reductions, the metered quantity of destroyed methane will replace the modeled methane reductions. Therefore, the above equation then becomes:
Total GHG Reductions = (Total quantity of metered and destroyed methane) + (Project baseline emissions CO2 – Project emissions CO2)
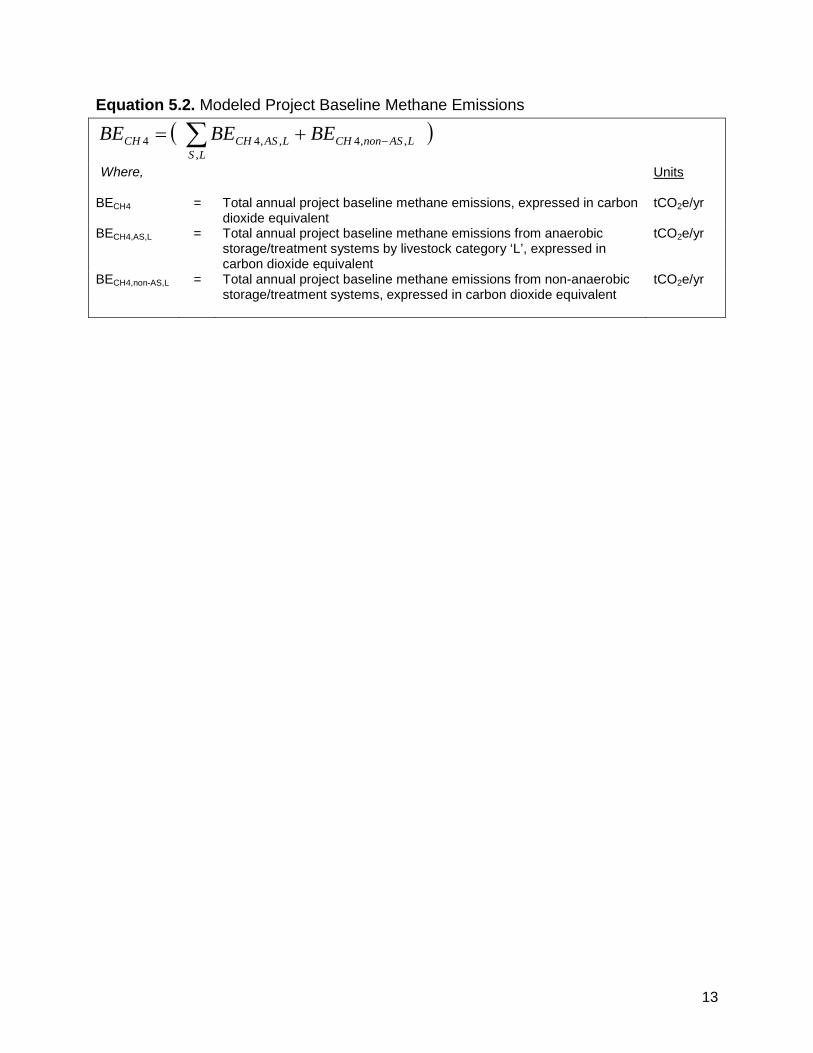
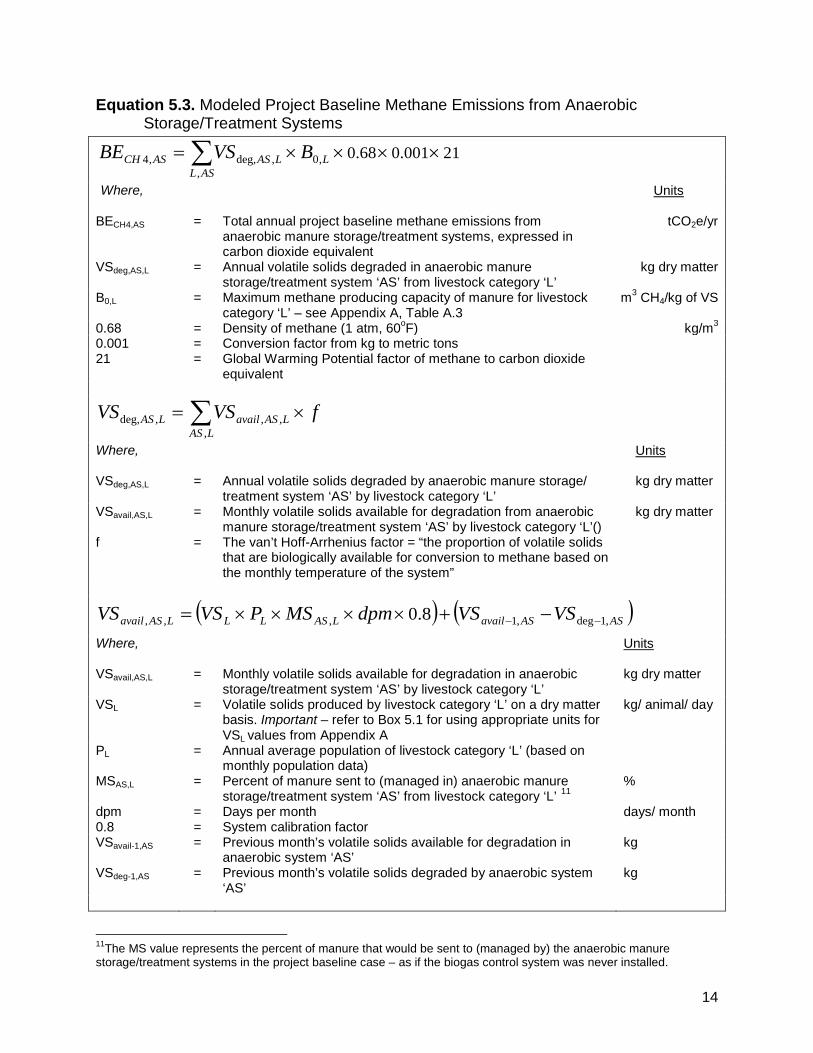
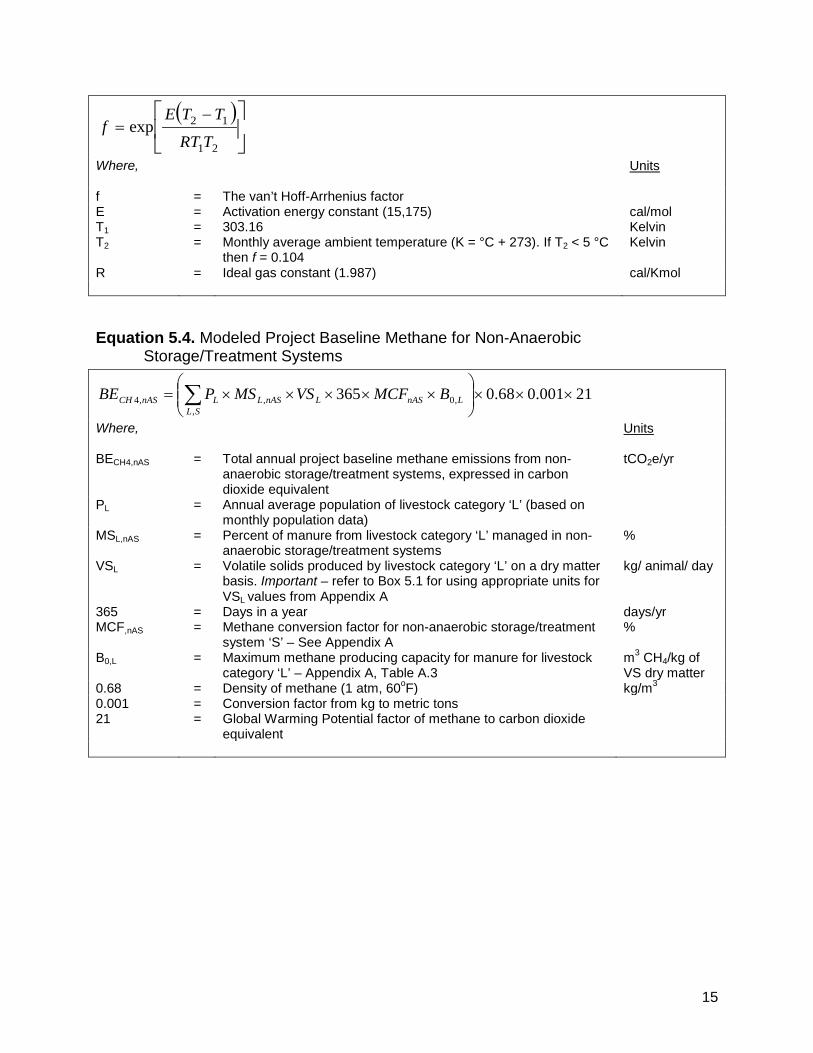
5.1 Quantifying Baseline Methane Emissions Project baseline emissions represent the GHG emissions within the Offset Project Boundary that would have occurred if not for the installation of the BCS. For the purposes of this protocol, project baseline emissions must be calculated according to the manure management system in place prior to installing the BCS. This is referred to as a “continuation of current practices” project baseline scenario. Additionally, project baseline emissions must be calculated each year of the offset project.9 The procedure assumes there is no BCS in the project baseline system. Regarding new livestock operations that install a BCS, a modeled project baseline scenario must be established using the prevailing system type in use for the geographic area, animal type, and farm size that corresponds to their operation. The procedure to determine the modeled project baseline methane emissions follows Equation 5.2, which combines Equation 5.3 and Equation 5.4. Equation 5.3 calculates methane emissions from anaerobic manure storage/treatment systems based on site-specific information on the mass of volatile solids degraded by the anaerobic storage/treatment system and available for methane conversion.10 It incorporates the effects of temperature through the van’t Hoff-Arrhenius ‘f’ factor and accounts for the retention of volatile solids through the use of monthly assessments. Equation 5.4 is less intensive and applies to non-anaerobic storage/treatment systems. Both Equation 5.3 and Equation 5.4 reflect basic biological principles of methane production from available volatile solids, determine methane generation for each livestock category, and account for the extent to which the waste management system handles each category’s manure.
9Conversely, under a “static baseline,” the project baseline emissions would be assessed once before offset project implementation and that value would be used throughout the offset project lifetime. 10Anaerobic storage/treatment systems generally refer to anaerobic lagoons, or storage ponds, etc.
13
Equation 5.2. Modeled Project Baseline Methane Emissions
( )∑ −+=LS
LASnonCHLASCHCH BEBEBE,
,,4,,44
Where,
Units
BECH4 = Total annual project baseline methane emissions, expressed in carbon dioxide equivalent
tCO2e/yr
BECH4,AS,L = Total annual project baseline methane emissions from anaerobic storage/treatment systems by livestock category ‘L’, expressed in carbon dioxide equivalent
tCO2e/yr
BECH4,non-AS,L = Total annual project baseline methane emissions from non-anaerobic storage/treatment systems, expressed in carbon dioxide equivalent
tCO2e/yr
14
Equation 5.3. Modeled Project Baseline Methane Emissions from Anaerobic Storage/Treatment Systems
21001.068.0,
,0,deg,,4 ××××= ∑ASL
LLASASCH BVSBE
Where,
Units
BECH4,AS = Total annual project baseline methane emissions from anaerobic manure storage/treatment systems, expressed in carbon dioxide equivalent
tCO2e/yr
VSdeg,AS,L = Annual volatile solids degraded in anaerobic manure storage/treatment system ‘AS’ from livestock category ‘L’
kg dry matter
B0,L = Maximum methane producing capacity of manure for livestock category ‘L’ – see Appendix A, Table A.3
m3 CH4/kg of VS
0.68 = Density of methane (1 atm, 60oF) kg/m3 0.001 = Conversion factor from kg to metric tons 21 = Global Warming Potential factor of methane to carbon dioxide
equivalent
∑ ×=LAS
LASavailLAS fVSVS,
,,,deg,
Where,
Units
VSdeg,AS,L = Annual volatile solids degraded by anaerobic manure storage/ treatment system ‘AS’ by livestock category ‘L’
kg dry matter
VSavail,AS,L = Monthly volatile solids available for degradation from anaerobic manure storage/treatment system ‘AS’ by livestock category ‘L’()
kg dry matter
f = The van’t Hoff-Arrhenius factor = “the proportion of volatile solids that are biologically available for conversion to methane based on the monthly temperature of the system”
( ) ( )ASASavailLASLLLASavail VSVSdpmMSPVSVS ,1deg,1,,, 8.0 −− −+××××=
Where,
Units
VSavail,AS,L = Monthly volatile solids available for degradation in anaerobic storage/treatment system ‘AS’ by livestock category ‘L’
kg dry matter
VSL = Volatile solids produced by livestock category ‘L’ on a dry matter basis. Important – refer to Box 5.1 for using appropriate units for VSL values from Appendix A
kg/ animal/ day
PL = Annual average population of livestock category ‘L’ (based on monthly population data)
MSAS,L = Percent of manure sent to (managed in) anaerobic manure storage/treatment system ‘AS’ from livestock category ‘L’ 11
%
dpm = Days per month days/ month 0.8 = System calibration factor VSavail-1,AS = Previous month’s volatile solids available for degradation in
anaerobic system ‘AS’ kg
VSdeg-1,AS = Previous month’s volatile solids degraded by anaerobic system ‘AS’
kg
11The MS value represents the percent of manure that would be sent to (managed by) the anaerobic manure storage/treatment systems in the project baseline case – as if the biogas control system was never installed.
15
( )
−=
21
12expTRT
TTEf
Where,
Units
f = The van’t Hoff-Arrhenius factor E = Activation energy constant (15,175) cal/mol T1 = 303.16 Kelvin T2 = Monthly average ambient temperature (K = °C + 273). If T2 < 5 °C
then f = 0.104 Kelvin
R = Ideal gas constant (1.987) cal/Kmol Equation 5.4. Modeled Project Baseline Methane for Non-Anaerobic
Storage/Treatment Systems
21001.068.0365,
,0,,4 ×××
×××××= ∑
SLLnASLnASLLnASCH BMCFVSMSPBE
Where,
Units
BECH4,nAS = Total annual project baseline methane emissions from non-anaerobic storage/treatment systems, expressed in carbon dioxide equivalent
tCO2e/yr
PL = Annual average population of livestock category ‘L’ (based on monthly population data)
MSL,nAS = Percent of manure from livestock category ‘L’ managed in non-anaerobic storage/treatment systems
%
VSL = Volatile solids produced by livestock category ‘L’ on a dry matter basis. Important – refer to Box 5.1 for using appropriate units for VSL values from Appendix A
kg/ animal/ day
365 = Days in a year days/yr MCF,nAS = Methane conversion factor for non-anaerobic storage/treatment
system ‘S’ – See Appendix A %
B0,L = Maximum methane producing capacity for manure for livestock category ‘L’ – Appendix A, Table A.3
m3 CH4/kg of VS dry matter
0.68 = Density of methane (1 atm, 60oF) kg/m3 0.001 = Conversion factor from kg to metric tons 21 = Global Warming Potential factor of methane to carbon dioxide
equivalent
16
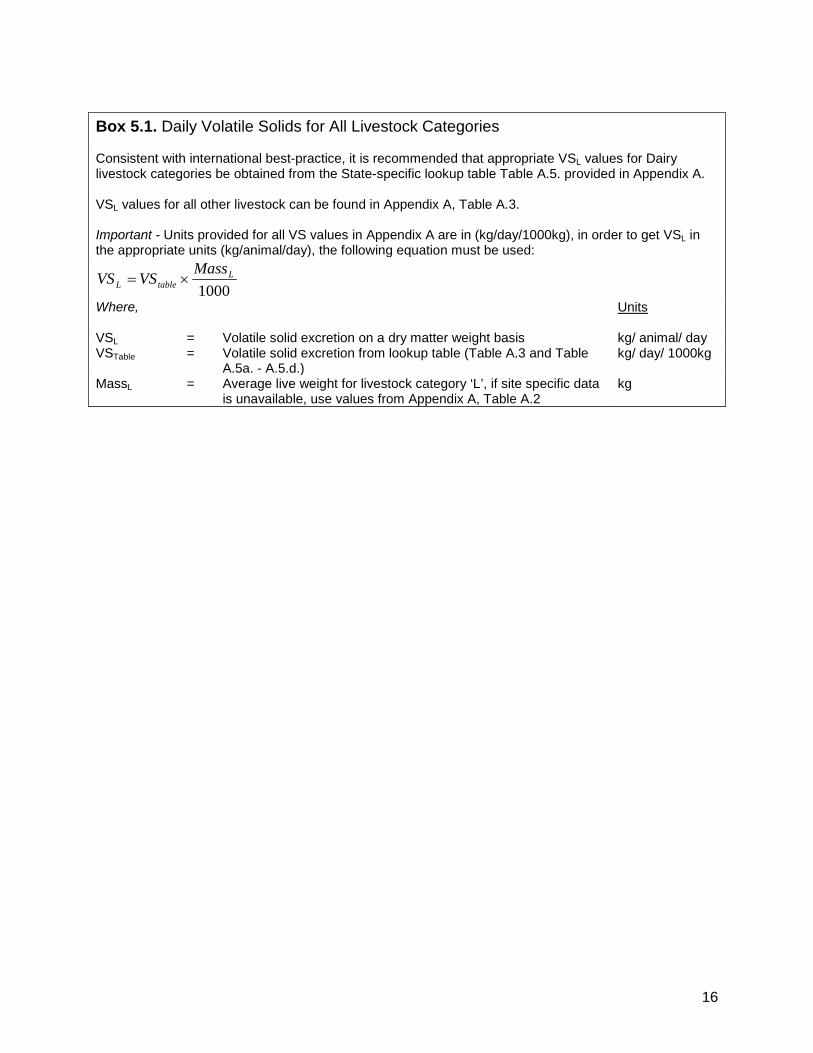
Box 5.1. Daily Volatile Solids for All Livestock Categories Consistent with international best-practice, it is recommended that appropriate VSL values for Dairy livestock categories be obtained from the State-specific lookup table Table A.5. provided in Appendix A.
VSL values for all other livestock can be found in Appendix A, Table A.3.
Important - Units provided for all VS values in Appendix A are in (kg/day/1000kg), in order to get VSL in the appropriate units (kg/animal/day), the following equation must be used:
1000L
tableLMassVSVS ×=
Where,
Units
VSL = Volatile solid excretion on a dry matter weight basis kg/ animal/ day VSTable = Volatile solid excretion from lookup table (Table A.3 and Table
A.5a. - A.5.d.) kg/ day/ 1000kg
MassL = Average live weight for livestock category ‘L’, if site specific data is unavailable, use values from Appendix A, Table A.2
kg
17
5.1.1 Variables for Calculating Project Baseline Methane The calculation procedure uses a combination of site-specific values and default factors. Population – PL The procedure requires the offset project to differentiate between livestock categories (‘L’) – e.g. lactating dairy cows, non-milking dairy cows, heifers, etc. This accounts for differences in methane generation across livestock categories (see Appendix A, Table A.2). The population of each livestock category is monitored on a monthly basis, and for Equation 5.4 averaged for an annual total population.
Volatile Solids – VSL This value represents the daily organic material in the manure for each livestock category and consists of both biodegradable and non-biodegradable fractions. The VS content of manure is a combination of excreted fecal material (the fraction of a livestock category’s diet consumed and not digested) and urinary excretions, expressed in a dry matter weight basis (kg/animal). This protocol requires that the VS value for all livestock categories be determined as outlined in Box 5.1.
MassL This value is the annual average live weight of the animals, per livestock category. This data is necessary because default VS values are supplied in units of kg/day/1000kg mass, therefore the average mass of the corresponding livestock category is required in order to convert the units of VS into kg/day/animal. Site specific livestock mass is preferred for all livestock categories. If site specific data is unavailable, Typical Average Mass (TAM) values can be used (Appendix A, Table A.2).
Maximum methane production – B0,L This value represents the maximum methane-producing capacity of the manure, differentiated by livestock category (‘L’) and diet. Default B0 factors from Appendix A, Table A.3 must be used.
MS The MS value apportions manure from each livestock category to an appropriate manure management system component (‘S’). It reflects the reality that waste from the operation’s livestock categories are not managed uniformly. The MS value accounts for the operation’s multiple types of manure management systems. It is expressed as a percent (%), relative to the total amount of waste produced by the livestock category. As waste production is normalized for each livestock category, the percentage should be calculated as percent of population for each livestock category. For example, a dairy operation might send 85% of its milking cows’ waste to an anaerobic lagoon and 15% could be deposited in a corral. In this situation an MS value of 85% would be assigned to Equation 5.3 and 15% to Equation 5.4. Importantly, the MS value indicates where the waste would be managed in the project baseline scenario – i.e. where the manure would end-up if the digester was never installed.
18
Methane Conversion Factor – MCF Each manure management system component has a volatile solids-to-methane conversion efficiency, which represents the degree to which maximum methane production (B0) is achieved. Methane production is a function of the extent of anaerobic conditions present in the system, the temperature of the system, and the retention time of organic material in the system. For anaerobic lagoons, storage ponds, liquid slurry tanks etc., this protocol requires site-specific calculation of the mass of volatile solids degraded by the anaerobic storage/treatment system. This is expressed as “degraded volatile solids” or “VSdeg” in Equation 5.3, which equals the system’s monthly available VS multiplied by “f,” the van’t Hoff-Arrhenius factor. The ‘f’ factor effectively converts total available VS in the anaerobic manure storage/treatment system to methane-convertible VS, based on the monthly temperature of the system. The multiplication of “VSdeg” by “B0” gives a site-specific quantification of the uncontrolled methane emissions that would have occurred in the absence of a digester – from the anaerobic storage and/or treatment system, taking into account each livestock category’s contribution of manure to that system. This method to calculate methane emissions reflects the site-specific monthly biological performance of the operation’s anaerobic manure handling systems that existed pre-project, as predicted by the van’t Hoff-Arrhenius equation using farm-level data on temperature, VS loading, and system VS retention time. Default MCF values for non-anaerobic manure storage/treatment are available in Appendix A, which are used for Equation 5.4.
5.2 Quantifying Project Methane Emissions Project emissions are actual GHG emissions that occur within the Offset Project Boundary after the installation of the BCS. Project emissions are calculated on an annual, ex-post basis. But like project baseline emissions, some parameters are monitored on a monthly basis. Methane emissions from manure storage and/or treatment systems other than the digester are modeled much the same as in the baseline scenario. As shown in Equation 5.5, project methane emissions equal: The amount of methane created by the BCS that is not captured and destroyed
by the control system, plus Methane from the digester effluent storage pond (if necessary), plus Methane from sources in the waste treatment and storage category other than
the BCS and associated effluent pond. This includes all other manure treatment systems such as compost piles, solids storage, daily spread, etc.
Consistent with ACM0010 and this protocol’s project baseline methane calculation approach, the formula to account for project methane emissions incorporates all
19
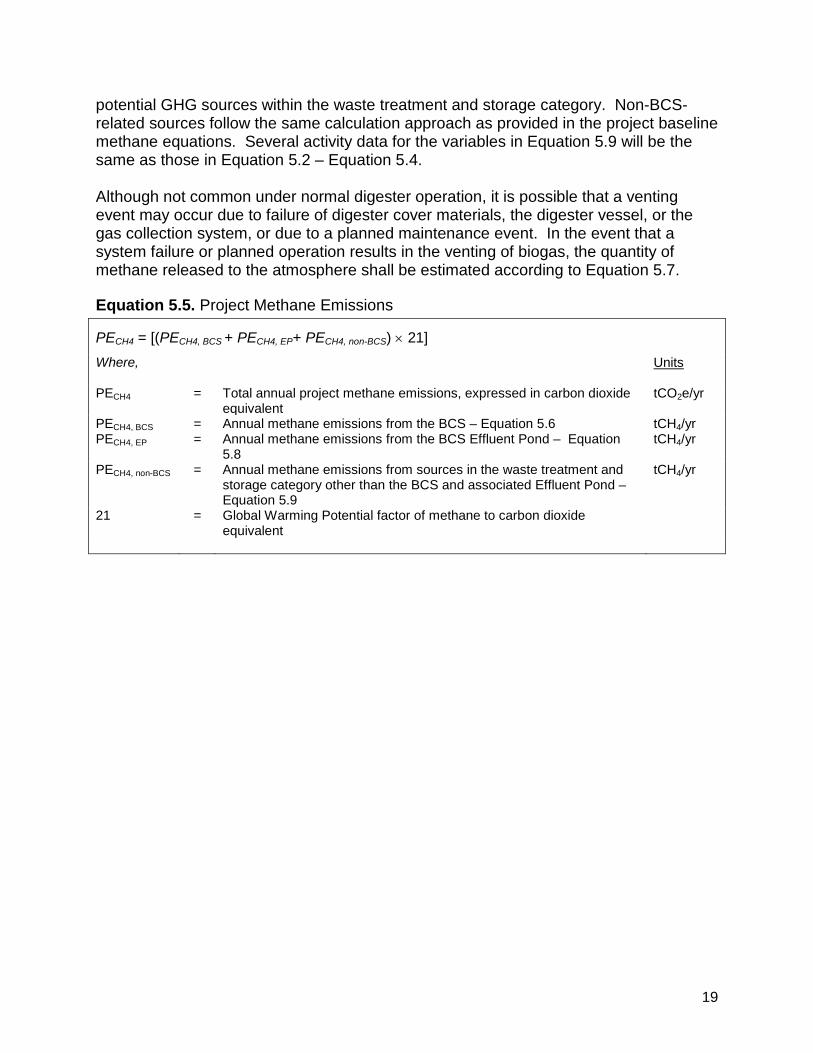
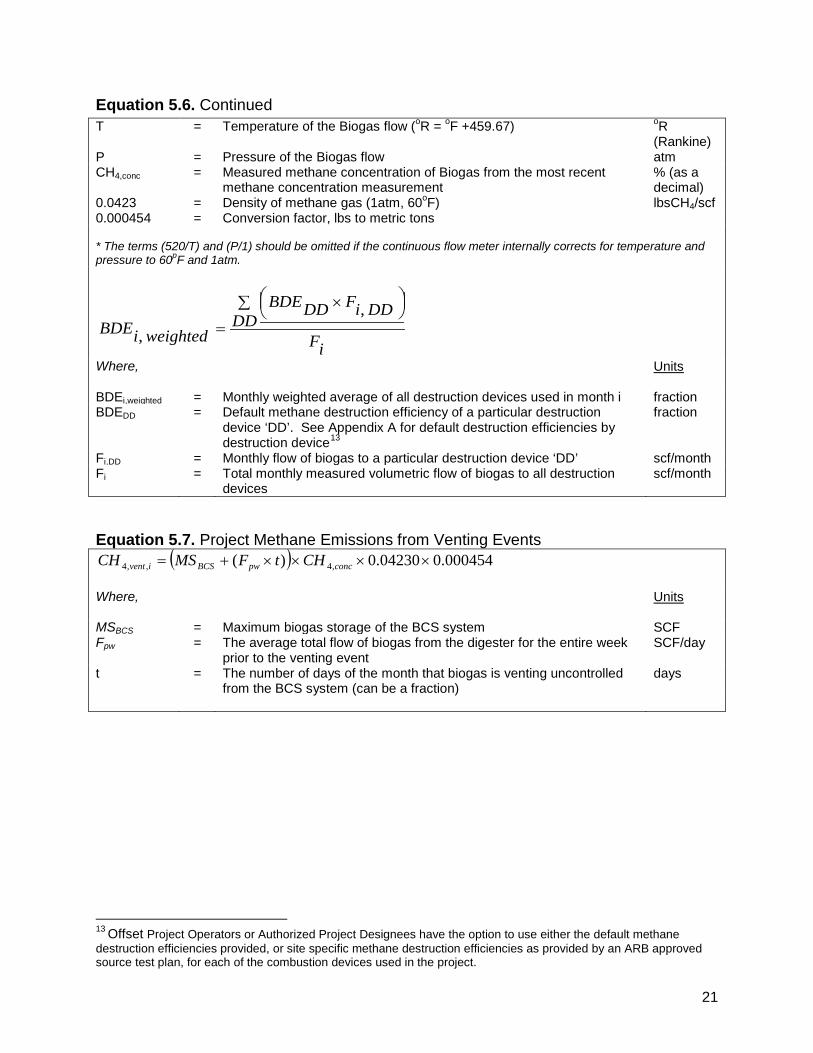
potential GHG sources within the waste treatment and storage category. Non-BCS-related sources follow the same calculation approach as provided in the project baseline methane equations. Several activity data for the variables in Equation 5.9 will be the same as those in Equation 5.2 – Equation 5.4. Although not common under normal digester operation, it is possible that a venting event may occur due to failure of digester cover materials, the digester vessel, or the gas collection system, or due to a planned maintenance event. In the event that a system failure or planned operation results in the venting of biogas, the quantity of methane released to the atmosphere shall be estimated according to Equation 5.7. Equation 5.5. Project Methane Emissions
PECH4 = [(PECH4, BCS + PECH4, EP+ PECH4, non-BCS) × 21] Where,
Units
PECH4 = Total annual project methane emissions, expressed in carbon dioxide equivalent
tCO2e/yr
PECH4, BCS = Annual methane emissions from the BCS – Equation 5.6 tCH4/yr PECH4, EP = Annual methane emissions from the BCS Effluent Pond – Equation
5.8 tCH4/yr
PECH4, non-BCS = Annual methane emissions from sources in the waste treatment and storage category other than the BCS and associated Effluent Pond – Equation 5.9
tCH4/yr
21 = Global Warming Potential factor of methane to carbon dioxide equivalent

20
Equation 5.6. Project Methane Emissions from the Biogas Control System
( ) iventweightediBCSCH CHBDEBCE
PE ,,4,meter4,,4 )1(CH +
−=
Where,
Units
PECH4, BCS = Monthly methane emissions from the BCS, to be aggregated annually tCH4/yr CH4,meter = Monthly quantity of methane collected and metered tCH4/
month BCE = Monthly methane collection efficiency of the BCS. Offset Project
Operators or Authorized Project Designees use the appropriate default value provided in Table A.4
% (as a decimal)
BDEi,weighted = Monthly weighted average of all destruction devices used in month i. % (as a decimal)
CH4,vent,i = The monthly quantity of methane that is vented to the atmosphere due to BCS venting events, as quantified in Equation 5.7 below.
CH4,meter= F × (520/T)π × (P/1)π × CH4,conc × 0.0423 × 0.000454
Where,
Units
CH4,meter = Monthly quantity of methane collected and metered12 tCH4/ month
F = Measured volumetric flow of Biogas per month scf/month
12This value reflects directly measured biogas mass flow and methane concentration in the biogas to the combustion device.
21
Equation 5.6. Continued T = Temperature of the Biogas flow (oR = oF +459.67) oR
(Rankine) P = Pressure of the Biogas flow atm CH4,conc = Measured methane concentration of Biogas from the most recent
methane concentration measurement % (as a decimal)
0.0423 = Density of methane gas (1atm, 60oF) lbsCH4/scf 0.000454 = Conversion factor, lbs to metric tons * The terms (520/T) and (P/1) should be omitted if the continuous flow meter internally corrects for temperature and pressure to 60pF and 1atm.
iFDD
DDiFDDBDE
weightediBDE∑
×
=,
,
Where,
Units
BDEi,weighted = Monthly weighted average of all destruction devices used in month i fraction BDEDD = Default methane destruction efficiency of a particular destruction
device ‘DD’. See Appendix A for default destruction efficiencies by destruction device13
fraction
Fi,DD = Monthly flow of biogas to a particular destruction device ‘DD’ scf/month Fi = Total monthly measured volumetric flow of biogas to all destruction
devices scf/month
Equation 5.7. Project Methane Emissions from Venting Events
( ) 000454.004230.0)( ,4,,4 ××××+= concpwBCSivent CHtFMSCH
Where,
Units
MSBCS = Maximum biogas storage of the BCS system SCF Fpw = The average total flow of biogas from the digester for the entire week
prior to the venting event SCF/day
t = The number of days of the month that biogas is venting uncontrolled from the BCS system (can be a fraction)
days
13 Offset Project Operators or Authorized Project Designees have the option to use either the default methane destruction efficiencies provided, or site specific methane destruction efficiencies as provided by an ARB approved source test plan, for each of the combustion devices used in the project.
22
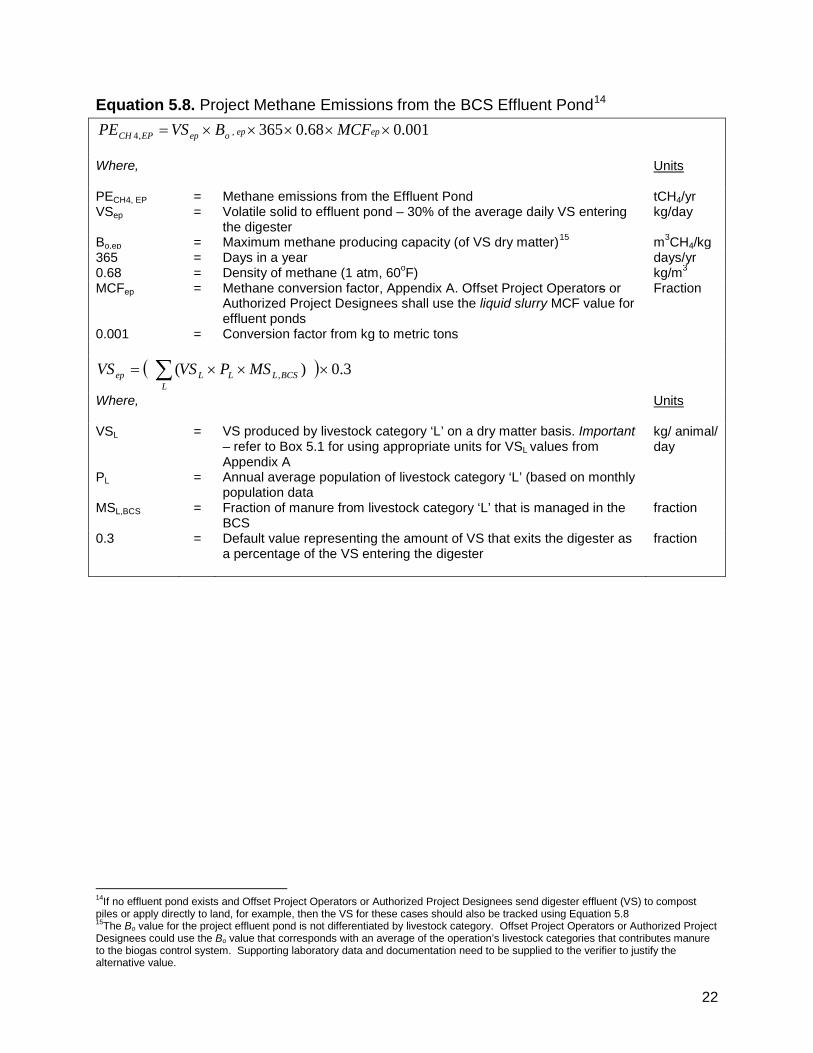
Equation 5.8. Project Methane Emissions from the BCS Effluent Pond14 001.068.0365,,4 ×××××= epepoepEPCH MCFBVSPE
Where,
Units
PECH4, EP = Methane emissions from the Effluent Pond tCH4/yr VSep = Volatile solid to effluent pond – 30% of the average daily VS entering
the digester kg/day
Bo,ep = Maximum methane producing capacity (of VS dry matter)15 m3CH4/kg 365 = Days in a year days/yr 0.68 = Density of methane (1 atm, 60oF) kg/m3 MCFep = Methane conversion factor, Appendix A. Offset Project Operators or
Authorized Project Designees shall use the liquid slurry MCF value for effluent ponds
Fraction
0.001 = Conversion factor from kg to metric tons
( ) 3.0)( , ×××= ∑ BCSLLL
Lep MSPVSVS
Where,
Units
VSL = VS produced by livestock category ‘L’ on a dry matter basis. Important – refer to Box 5.1 for using appropriate units for VSL values from Appendix A
kg/ animal/ day
PL = Annual average population of livestock category ‘L’ (based on monthly population data
MSL,BCS = Fraction of manure from livestock category ‘L’ that is managed in the BCS
fraction
0.3 = Default value representing the amount of VS that exits the digester as a percentage of the VS entering the digester
fraction
14If no effluent pond exists and Offset Project Operators or Authorized Project Designees send digester effluent (VS) to compost piles or apply directly to land, for example, then the VS for these cases should also be tracked using Equation 5.8 15The Bo value for the project effluent pond is not differentiated by livestock category. Offset Project Operators or Authorized Project Designees could use the Bo value that corresponds with an average of the operation’s livestock categories that contributes manure to the biogas control system. Supporting laboratory data and documentation need to be supplied to the verifier to justify the alternative value.

23
Equation 5.9. Project Methane Emissions from Non-BCS Related Sources16
001.0))(( ,4,4 ×
×= ∑ L
LLCHnBCSCH PnBCSsEFPE
Where,
Units
PECH4, nBCS = Methane from sources in the waste treatment and storage category other than the BCS and associated Effluent Pond
tCH4/yr
EFCH4,L = Emission factor for the livestock population from non-BCS-related sources (nBCSs, calculated below)
kgCH4/ head/ yr
PL = Population of livestock category ‘L’ 0.001 = Conversion factor from kg to metric tons
( )
×××××= ∑
SSLSLoLLCH MSMCFBVSnBCSsEF )(68.0365)( ,,,4
Where,
Units
EFCH4,L = Methane emission factor for the livestock population from non-biogas control system related sources (nBCSs)
kgCH4/ head/ yr
VSL = Volatile solids produced by livestock category ‘L’ on a dry matter basis. Important – refer to Box 5.1 for using appropriate units for VSL values from Appendix A
kg/ animal/ day
Bo,L = Maximum methane producing capacity for manure for livestock category ‘L’ (of VS dry matter), Appendix A, Table A.3
m3 CH4/kg
365 = Days in a year days/yr 0.68 = Density of methane (1 atm, 60oF) kg/m3 MCFS = Methane conversion factor for system component ‘S’, Appendix A fraction MSL,S = Percent of manure from livestock category L that is managed in non-
BCS system component ‘S’ fraction
5.3 Metered Methane Destruction Comparison As described above, all offset projects must compare the modeled methane emission reductions for the reporting period, as calculated in Equation 5.2 - Equation 5.4 and Equation 5.6 - Equation 5.9 above, with the actual metered amount of methane that is destroyed in the BCS over the same period. The lesser of the two values is to be used as the total methane emission reductions for the reporting period in question. In order to calculate the metered methane reductions, the monthly quantity of biogas that is metered and destroyed by the BCS must be aggregated over the reporting period. In the event that an Offset Project Operator or Authorized Project Designee is reporting GHG reductions for a period of time that is less than a full year, the total modeled methane emission reductions would be aggregated over this time period and compared with the metered methane that is destroyed in the BCS over the same period of time. For example, if a project is reporting and verifying only 6 months of data, July – December for instance, the modeled emission reductions over this 6 month period would be compared to the total metered biogas destroyed over the same six month
16According to this protocol, non-BCS-related sources means manure management system components (system
component ‘S’) other than the biogas control system and the BCS effluent pond (if used).
24
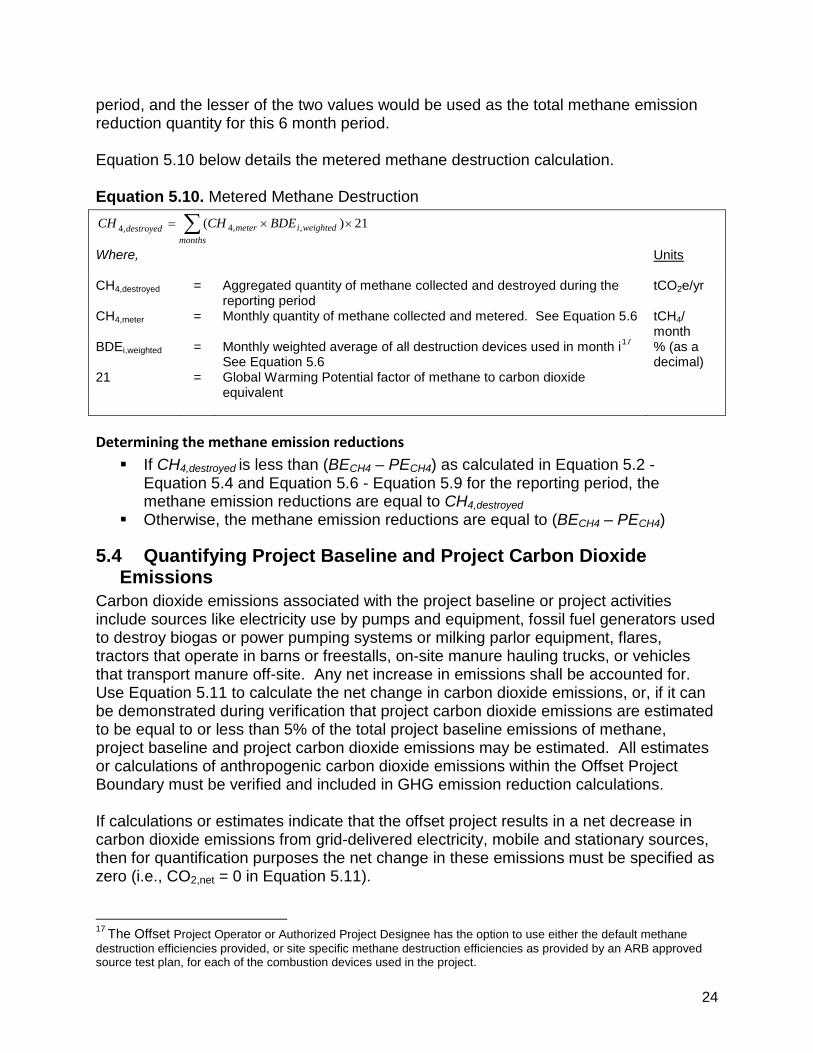
period, and the lesser of the two values would be used as the total methane emission reduction quantity for this 6 month period. Equation 5.10 below details the metered methane destruction calculation. Equation 5.10. Metered Methane Destruction
21)( ,,4,4 ××= ∑months
weightedimeterdestroyed BDECHCH
Where,
Units
CH4,destroyed = Aggregated quantity of methane collected and destroyed during the reporting period
tCO2e/yr
CH4,meter = Monthly quantity of methane collected and metered. See Equation 5.6 tCH4/ month
BDEi,weighted = Monthly weighted average of all destruction devices used in month i17 See Equation 5.6
% (as a decimal)
21 = Global Warming Potential factor of methane to carbon dioxide equivalent
Determining the methane emission reductions If CH4,destroyed is less than (BECH4 – PECH4) as calculated in Equation 5.2 -
Equation 5.4 and Equation 5.6 - Equation 5.9 for the reporting period, the methane emission reductions are equal to CH4,destroyed
Otherwise, the methane emission reductions are equal to (BECH4 – PECH4)
5.4 Quantifying Project Baseline and Project Carbon Dioxide Emissions
Carbon dioxide emissions associated with the project baseline or project activities include sources like electricity use by pumps and equipment, fossil fuel generators used to destroy biogas or power pumping systems or milking parlor equipment, flares, tractors that operate in barns or freestalls, on-site manure hauling trucks, or vehicles that transport manure off-site. Any net increase in emissions shall be accounted for. Use Equation 5.11 to calculate the net change in carbon dioxide emissions, or, if it can be demonstrated during verification that project carbon dioxide emissions are estimated to be equal to or less than 5% of the total project baseline emissions of methane, project baseline and project carbon dioxide emissions may be estimated. All estimates or calculations of anthropogenic carbon dioxide emissions within the Offset Project Boundary must be verified and included in GHG emission reduction calculations. If calculations or estimates indicate that the offset project results in a net decrease in carbon dioxide emissions from grid-delivered electricity, mobile and stationary sources, then for quantification purposes the net change in these emissions must be specified as zero (i.e., CO2,net = 0 in Equation 5.11).
17 The Offset Project Operator or Authorized Project Designee has the option to use either the default methane destruction efficiencies provided, or site specific methane destruction efficiencies as provided by an ARB approved source test plan, for each of the combustion devices used in the project.
25
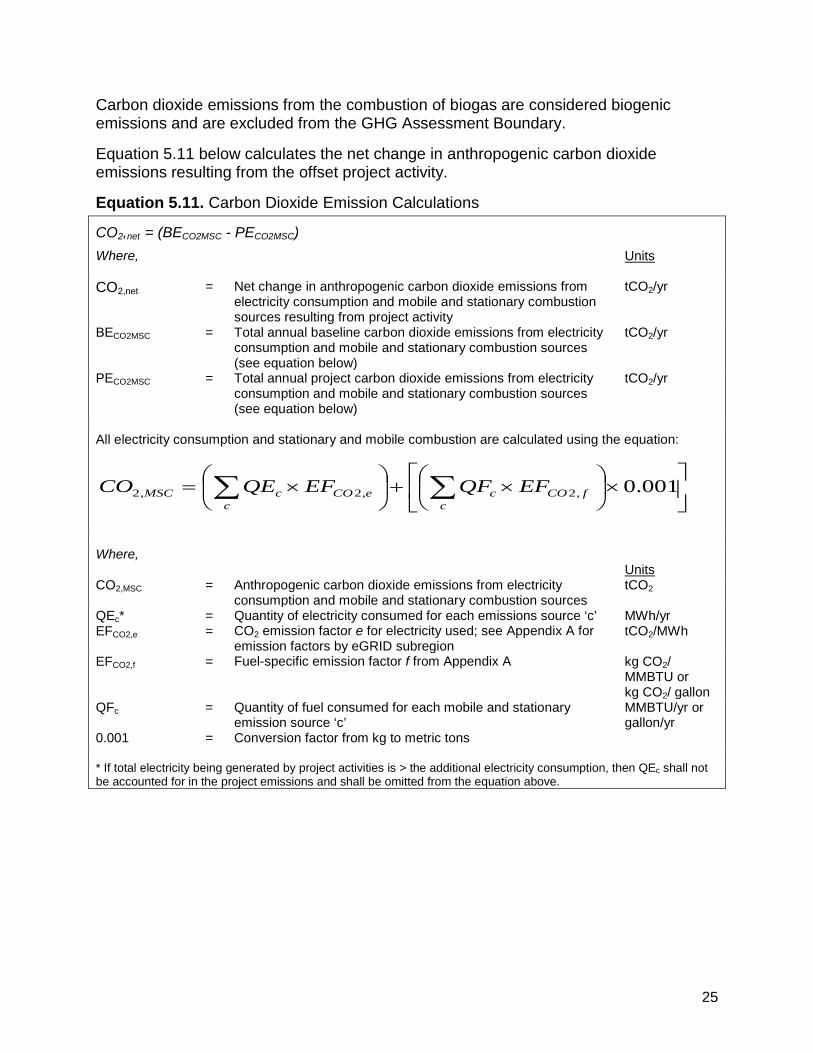
Carbon dioxide emissions from the combustion of biogas are considered biogenic emissions and are excluded from the GHG Assessment Boundary. Equation 5.11 below calculates the net change in anthropogenic carbon dioxide emissions resulting from the offset project activity. Equation 5.11. Carbon Dioxide Emission Calculations
CO2,net = (BECO2MSC - PECO2MSC) Where,
Units
CO2,net = Net change in anthropogenic carbon dioxide emissions from electricity consumption and mobile and stationary combustion sources resulting from project activity
tCO2/yr
BECO2MSC = Total annual baseline carbon dioxide emissions from electricity consumption and mobile and stationary combustion sources (see equation below)
tCO2/yr
PECO2MSC = Total annual project carbon dioxide emissions from electricity consumption and mobile and stationary combustion sources (see equation below)
tCO2/yr
All electricity consumption and stationary and mobile combustion are calculated using the equation:
×
×+
×= ∑∑ 001.0,2,2,2
cfCOc
ceCOcMSC EFQFEFQECO
Where,
Units
CO2,MSC = Anthropogenic carbon dioxide emissions from electricity consumption and mobile and stationary combustion sources
tCO2
QEc* = Quantity of electricity consumed for each emissions source ‘c’ MWh/yr EFCO2,e = CO2 emission factor e for electricity used; see Appendix A for
emission factors by eGRID subregion tCO2/MWh
EFCO2,f = Fuel-specific emission factor f from Appendix A kg CO2/ MMBTU or kg CO2/ gallon
QFc = Quantity of fuel consumed for each mobile and stationary emission source ‘c’
MMBTU/yr or gallon/yr
0.001 = Conversion factor from kg to metric tons * If total electricity being generated by project activities is > the additional electricity consumption, then QEc shall not be accounted for in the project emissions and shall be omitted from the equation above.
26
6 Offset Project Documentation and Monitoring Requirements
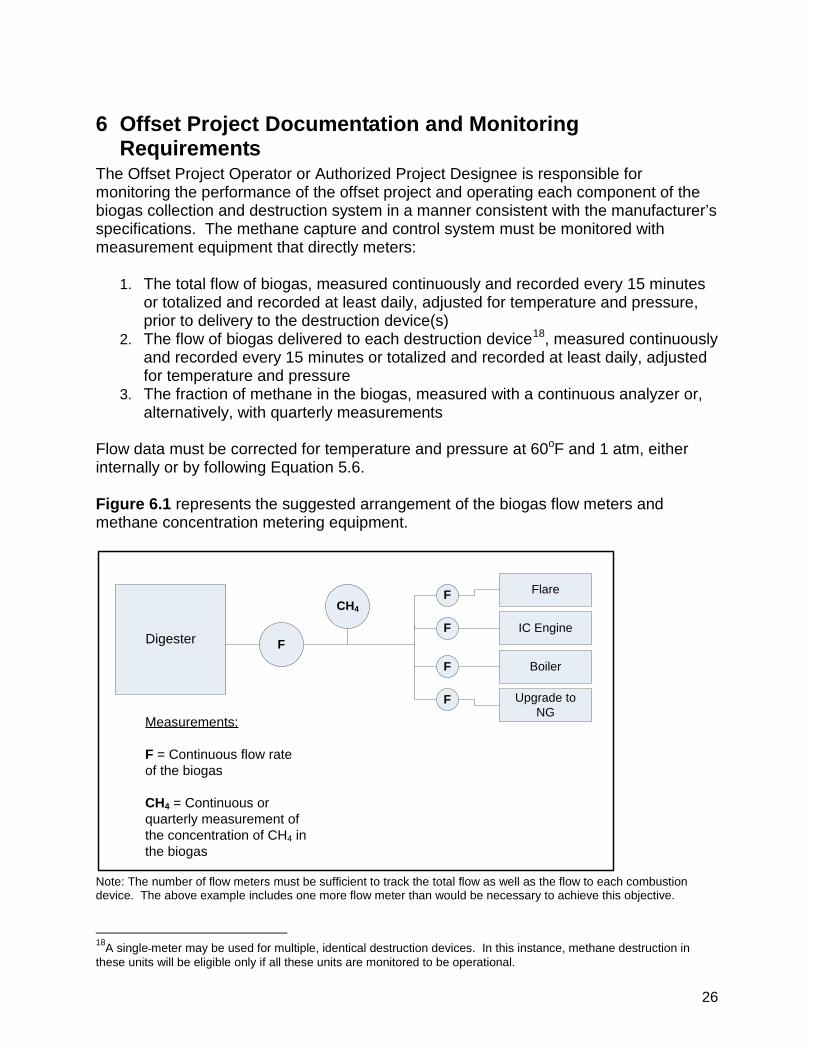
The Offset Project Operator or Authorized Project Designee is responsible for monitoring the performance of the offset project and operating each component of the biogas collection and destruction system in a manner consistent with the manufacturer’s specifications. The methane capture and control system must be monitored with measurement equipment that directly meters:
1. The total flow of biogas, measured continuously and recorded every 15 minutes or totalized and recorded at least daily, adjusted for temperature and pressure, prior to delivery to the destruction device(s)
2. The flow of biogas delivered to each destruction device18, measured continuously and recorded every 15 minutes or totalized and recorded at least daily, adjusted for temperature and pressure
3. The fraction of methane in the biogas, measured with a continuous analyzer or, alternatively, with quarterly measurements
Flow data must be corrected for temperature and pressure at 60oF and 1 atm, either internally or by following Equation 5.6. Figure 6.1 represents the suggested arrangement of the biogas flow meters and methane concentration metering equipment.
Digester F
CH4
Measurements:
F = Continuous flow rate of the biogas
CH4 = Continuous or quarterly measurement of the concentration of CH4 in the biogas
F
F
F
F
Flare
IC Engine
Boiler
Upgrade to NG
Note: The number of flow meters must be sufficient to track the total flow as well as the flow to each combustion device. The above example includes one more flow meter than would be necessary to achieve this objective.
18A single meter may be used for multiple, identical destruction devices. In this instance, methane destruction in these units will be eligible only if all these units are monitored to be operational.

27
Operational activity of the destruction devices shall be monitored and documented at least hourly to ensure actual methane destruction. GHG reductions will not be accounted for or credited during periods in which the destruction device is not operational. If for any reason the destruction device or the operational monitoring equipment (for example, the thermal coupler on the flare or an engine) is inoperable, all metered biogas going to the particular device shall be assumed to be released to atmosphere during the period of inoperability. During the period of inoperability, the destruction efficiency of the device must be assumed to be zero. In Equation 5.10, the monthly biogas destruction efficiency (BDE) value shall be adjusted accordingly. See Box 6.1 for an example BDE adjustment. Box 6.1. Example BDE Adjustment As an example, consider a situation where the primary destruction device is an open flare with a BDE of 96%, and it is found to be inoperable for a period of 5 days of a 30 day month. Assume that the total flow of biogas to the flare for the month is 3,000,000 scf, and that the total flow recorded for the 5 day period of inoperability is 500,000 SCF. In this case the monthly BDE would be adjusted as follows: BDE =[(0.96*2,500,000) +(0.0 * 500,000)] / 3,000,000 = 80%
6.1 Biogas Measurement Instrument QA/QC – Quantification Methodology
All gas flow meters19 and continuous methane analyzers must be: Cleaned and inspected on a quarterly basis, with the activities performed and “as
found/as left condition” of the equipment documented
Field checked by a trained professional for calibration accuracy with the percent drift documented, using either a portable instrument (such as a pitot tube)20 or manufacturer specifications, at the end of but no more than two months prior to the end date of the reporting period21
Calibrated by the manufacturer or a certified calibration service per manufacturer’s specifications or every 5 years, whichever is more frequent
If the field check on a piece of equipment reveals accuracy outside of a +/- 5% threshold, calibration by the manufacturer or a certified service provider is required for that piece of equipment.
19Field checks and calibrations of flow meters shall assess the volumetric output of the flow meter. 20It is recommended that a professional third party calibration service be hired to perform flow meter field checks if using pitot tubes or other portable instruments, as these types of devices require professional training in order to achieve accurate readings. 21Instead of performing field checks, the Offset Project Operators or Authorized Project Designees may instead have equipment calibrated by the manufacturer or a certified calibration service per manufacturer’s specifications, at the end of but no more than two months prior to the end date of the reporting period to meet this requirement.
28
For the interval between the last successful field check and any calibration event confirming accuracy below the +/- 5% threshold, all data from that meter or analyzer must be scaled according to the following procedure. These adjustments must be made for the entire period from the last successful field check until such time as the meter is properly calibrated. For calibrations that indicate the flow meter was outside the +/- 5% accuracy threshold,
the project developer shall estimate total emission reductions using i) the metered values without correction, and ii) the metered values adjusted based on the greatest calibration drift recorded at the time of calibration. The lower of the two emission reduction estimates shall be reported as the scaled emission reduction estimate.
For example, if a project conducts field checks quarterly during a year-long reporting period, only three months of data will be subject at any one time to the penalties above. However, if the Offset Project Operator or Authorized Project Designee feels confident that the meter does not require field checks or calibration on a greater than annual basis, then failed events will accordingly require the penalty to be applied to the entire year’s data. Frequent calibration may minimize the total accrued drift (by zeroing out any error identified), and result in smaller overall deductions. In order to provide flexibility in verification, data monitored up to two months after a field check may be verified. As such, the end date of the reporting period must be no more than two months after the latest successful field check. If a portable instrument is used (such as a handheld methane analyzer), the portable instrument shall be calibrated at least annually by the manufacturer or at an ISO 17025 accredited laboratory.
6.1.1 Missing Data – Quantification Methodology In situations where the flow rate or methane concentration monitoring equipment is missing data, the Offset Project Operator or Authorized Project Designee shall apply the data substitution methodology provided in Appendix B. If for any reason the destruction device monitoring equipment is inoperable (for example, the thermal coupler on the flare or an engine), no emission reductions can be credited for the period of inoperability.
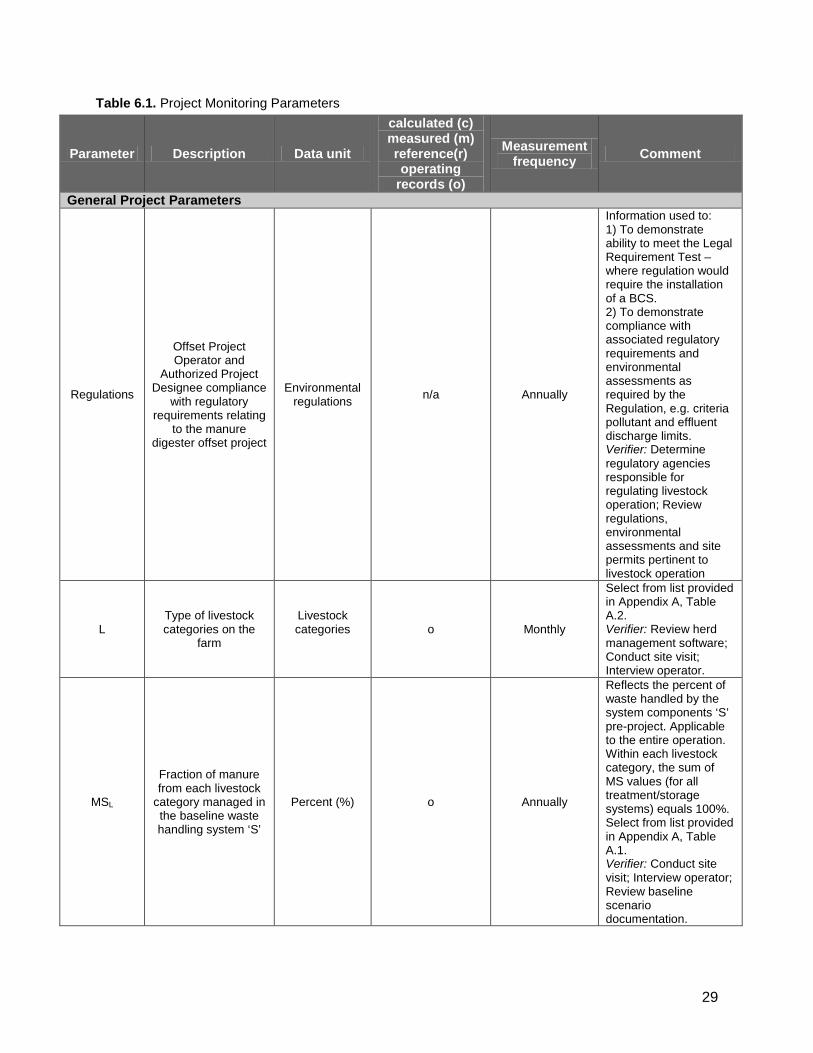
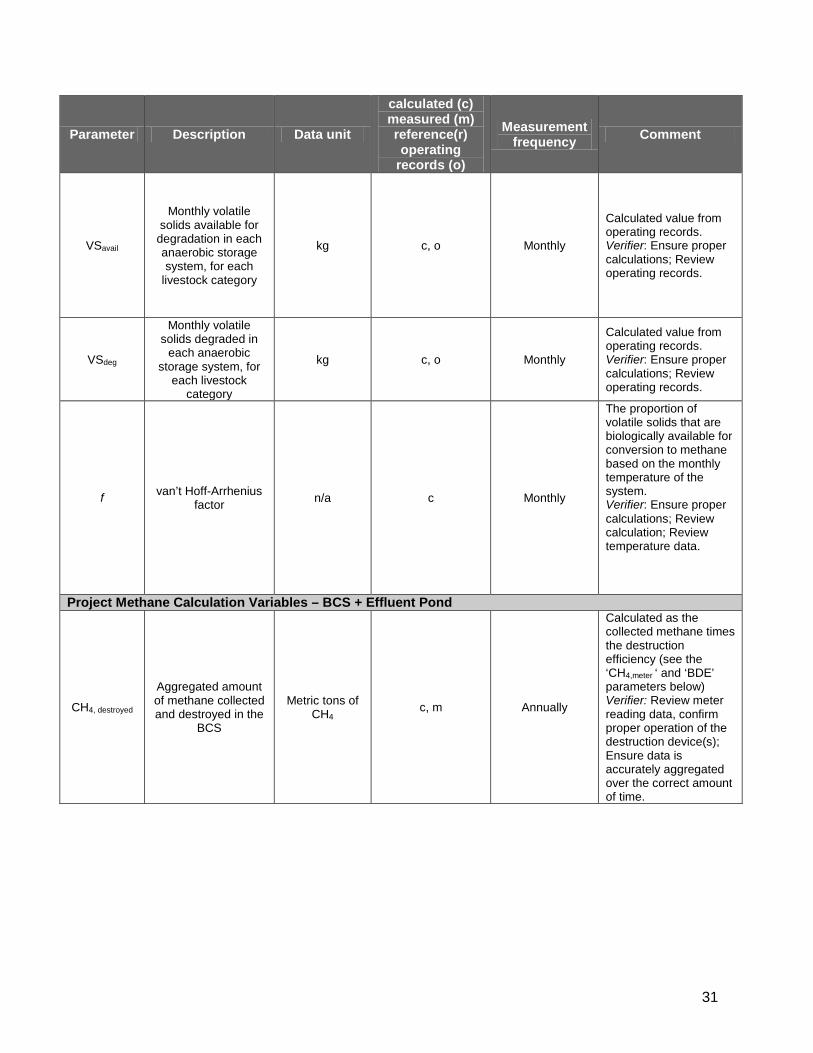
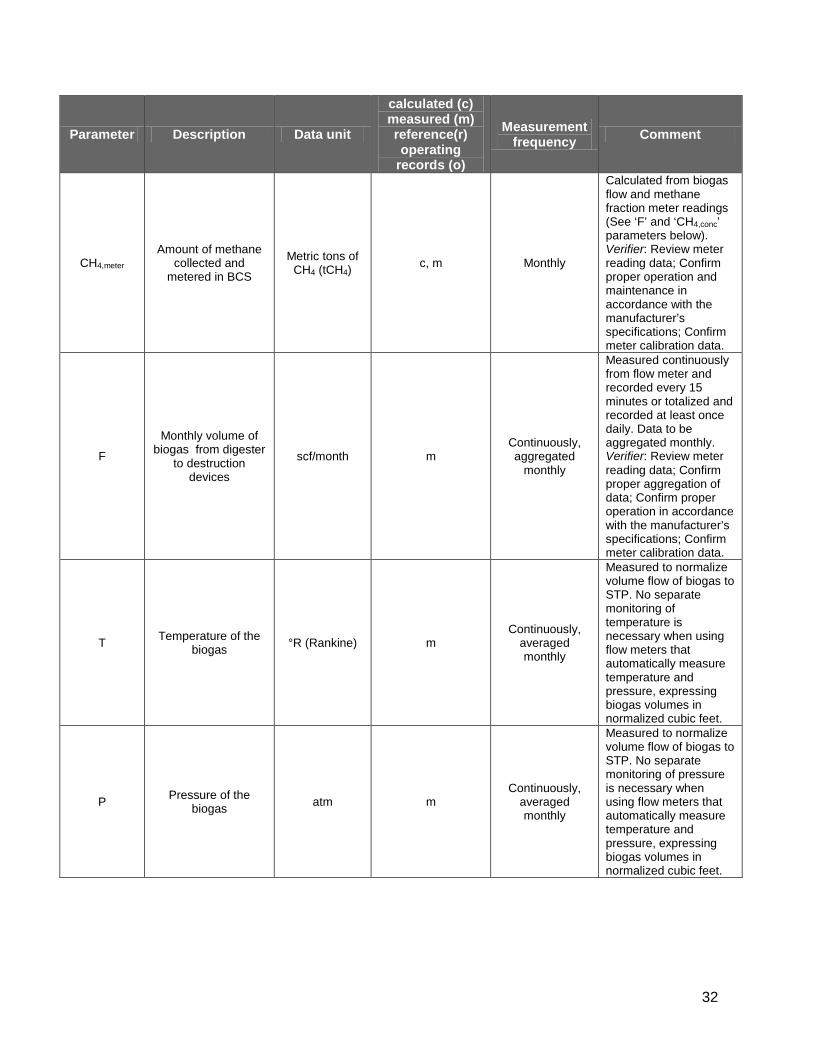
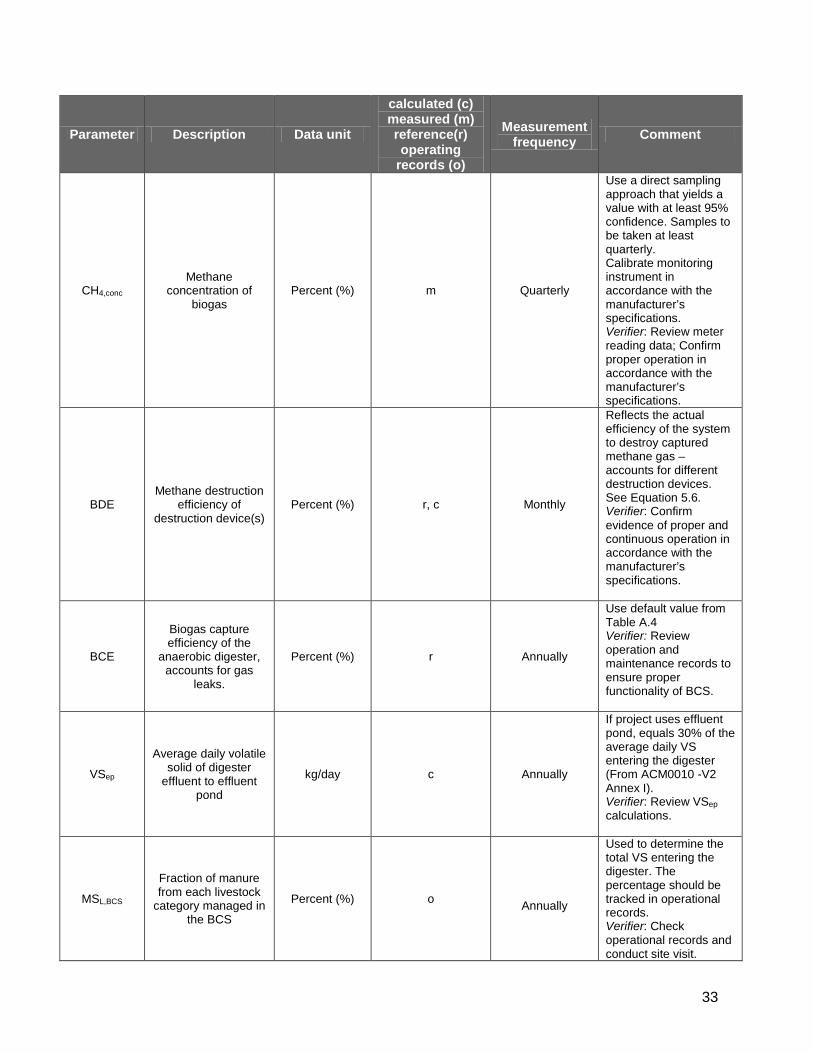
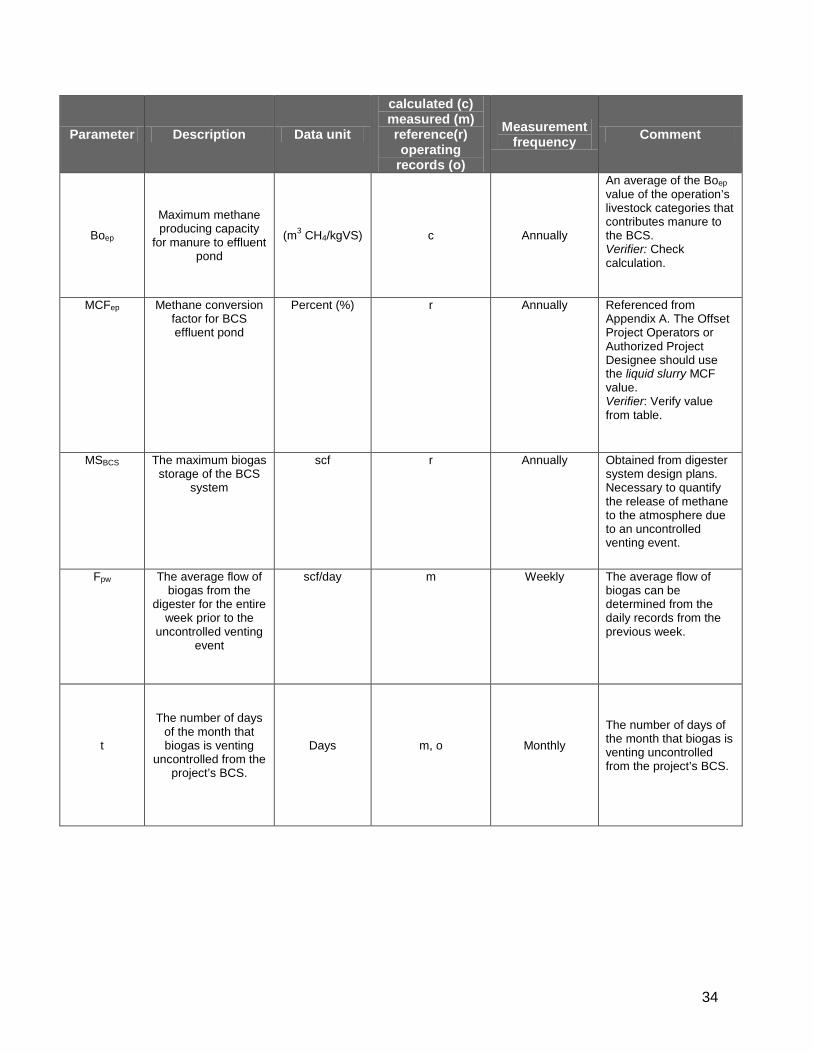
6.2 Monitoring Parameters – Quantification Methodology Provisions for monitoring other variables to calculate project baseline and project emissions are provided in Table 6.1. The parameters are organized by general project factors and then by the calculation methods.
29
Table 6.1. Project Monitoring Parameters
Parameter Description Data unit
calculated (c) measured (m) reference(r) operating
records (o)
Measurement frequency Comment
General Project Parameters
Regulations
Offset Project Operator and
Authorized Project Designee compliance
with regulatory requirements relating
to the manure digester offset project
Environmental regulations n/a Annually
Information used to: 1) To demonstrate ability to meet the Legal Requirement Test – where regulation would require the installation of a BCS. 2) To demonstrate compliance with associated regulatory requirements and environmental assessments as required by the Regulation, e.g. criteria pollutant and effluent discharge limits. Verifier: Determine regulatory agencies responsible for regulating livestock operation; Review regulations, environmental assessments and site permits pertinent to livestock operation
L Type of livestock categories on the
farm
Livestock categories
o Monthly
Select from list provided in Appendix A, Table A.2. Verifier: Review herd management software; Conduct site visit; Interview operator.
MSL
Fraction of manure from each livestock
category managed in the baseline waste handling system ‘S’
Percent (%) o Annually
Reflects the percent of waste handled by the system components ‘S’ pre-project. Applicable to the entire operation. Within each livestock category, the sum of MS values (for all treatment/storage systems) equals 100%. Select from list provided in Appendix A, Table A.1. Verifier: Conduct site visit; Interview operator; Review baseline scenario documentation.

30
Parameter Description Data unit
calculated (c) measured (m) reference(r) operating
records (o)
Measurement frequency Comment
PL Average number of
animals for each livestock category
Population (# head) o Monthly
Verifier: Review herd management software; Review local air and water quality agency reporting submissions, if available (e.g. in CA, dairies with more than 500 cows report farm information to ARB).
MassL Average live weight
by livestock category
kg o, r Monthly
From operating records, or if on-site data is unavailable, from lookup table (Appendix A Table A.2). Verifier: Conduct site visit; Interview livestock operator; Review average daily gain records, operating records.
T
Average monthly temperature at location of the
operation
oC m/o Monthly
Used for van’t Hoff Calculation and for choosing appropriate MCF value. Verifier: Review temperature records obtained from weather service.
Baseline Methane Calculation Variables
B0,L
Maximum methane producing capacity
for manure by livestock category
(m3 CH4/kgVS) r Annually
From Appendix A, Table A.3. Verifier: Verify correct value from table used.
MCFS
Methane conversion factor for manure
management system component ‘S’
Percent (%) r Annually
From Appendix A. Differentiate by livestock category Verifier: Verify correct value from table used.
VSL Daily volatile solid
production
(kg/animal/day) r, c Annually
Appendix A, Table A.3 and Table A.5a-d; see Box 5.1 to convert units from (kg/day/1000kg) to (kg/animal/day). Verifier: Ensure appropriate year’s table is used; Review data units.
31
Parameter Description Data unit
calculated (c) measured (m) reference(r) operating
records (o)
Measurement frequency Comment
VSavail
Monthly volatile solids available for
degradation in each anaerobic storage system, for each
livestock category
kg c, o Monthly
Calculated value from operating records. Verifier: Ensure proper calculations; Review operating records.
VSdeg
Monthly volatile solids degraded in
each anaerobic storage system, for
each livestock category
kg c, o Monthly
Calculated value from operating records. Verifier: Ensure proper calculations; Review operating records.
f van’t Hoff-Arrhenius factor n/a c Monthly
The proportion of volatile solids that are biologically available for conversion to methane based on the monthly temperature of the system. Verifier: Ensure proper calculations; Review calculation; Review temperature data.
Project Methane Calculation Variables – BCS + Effluent Pond
CH4, destroyed
Aggregated amount of methane collected and destroyed in the
BCS
Metric tons of CH4
c, m Annually
Calculated as the collected methane times the destruction efficiency (see the ‘CH4,meter ‘ and ‘BDE’ parameters below) Verifier: Review meter reading data, confirm proper operation of the destruction device(s); Ensure data is accurately aggregated over the correct amount of time.
32
Parameter Description Data unit
calculated (c) measured (m) reference(r) operating
records (o)
Measurement frequency Comment
CH4,meter Amount of methane
collected and metered in BCS
Metric tons of CH4 (tCH4)
c, m Monthly
Calculated from biogas flow and methane fraction meter readings (See ‘F’ and ‘CH4,conc’ parameters below). Verifier: Review meter reading data; Confirm proper operation and maintenance in accordance with the manufacturer’s specifications; Confirm meter calibration data.
F
Monthly volume of biogas from digester
to destruction devices
scf/month m Continuously, aggregated
monthly
Measured continuously from flow meter and recorded every 15 minutes or totalized and recorded at least once daily. Data to be aggregated monthly. Verifier: Review meter reading data; Confirm proper aggregation of data; Confirm proper operation in accordance with the manufacturer’s specifications; Confirm meter calibration data.
T Temperature of the biogas °R (Rankine) m
Continuously, averaged monthly
Measured to normalize volume flow of biogas to STP. No separate monitoring of temperature is necessary when using flow meters that automatically measure temperature and pressure, expressing biogas volumes in normalized cubic feet.
P Pressure of the biogas atm m
Continuously, averaged monthly
Measured to normalize volume flow of biogas to STP. No separate monitoring of pressure is necessary when using flow meters that automatically measure temperature and pressure, expressing biogas volumes in normalized cubic feet.
33
Parameter Description Data unit
calculated (c) measured (m) reference(r) operating
records (o)
Measurement frequency Comment
CH4,conc Methane
concentration of biogas
Percent (%) m Quarterly
Use a direct sampling approach that yields a value with at least 95% confidence. Samples to be taken at least quarterly. Calibrate monitoring instrument in accordance with the manufacturer’s specifications. Verifier: Review meter reading data; Confirm proper operation in accordance with the manufacturer’s specifications.
BDE Methane destruction
efficiency of destruction device(s)
Percent (%) r, c Monthly
Reflects the actual efficiency of the system to destroy captured methane gas – accounts for different destruction devices. See Equation 5.6. Verifier: Confirm evidence of proper and continuous operation in accordance with the manufacturer’s specifications.
BCE
Biogas capture efficiency of the
anaerobic digester, accounts for gas
leaks.
Percent (%) r Annually
Use default value from Table A.4 Verifier: Review operation and maintenance records to ensure proper functionality of BCS.
VSep
Average daily volatile solid of digester
effluent to effluent pond
kg/day c Annually
If project uses effluent pond, equals 30% of the average daily VS entering the digester (From ACM0010 -V2 Annex I). Verifier: Review VSep calculations.
MSL,BCS
Fraction of manure from each livestock
category managed in the BCS
Percent (%) o Annually
Used to determine the total VS entering the digester. The percentage should be tracked in operational records. Verifier: Check operational records and conduct site visit.
34
Parameter Description Data unit
calculated (c) measured (m) reference(r) operating
records (o)
Measurement frequency Comment
Boep
Maximum methane producing capacity
for manure to effluent pond
(m3 CH4/kgVS) c Annually
An average of the Boep value of the operation’s livestock categories that contributes manure to the BCS. Verifier: Check calculation.
MCFep Methane conversion factor for BCS effluent pond
Percent (%) r Annually Referenced from Appendix A. The Offset Project Operators or Authorized Project Designee should use the liquid slurry MCF value. Verifier: Verify value from table.
MSBCS The maximum biogas storage of the BCS
system
scf r Annually Obtained from digester system design plans. Necessary to quantify the release of methane to the atmosphere due to an uncontrolled venting event.
Fpw The average flow of biogas from the
digester for the entire week prior to the
uncontrolled venting event
scf/day m Weekly The average flow of biogas can be determined from the daily records from the previous week.
t
The number of days of the month that biogas is venting
uncontrolled from the project’s BCS.
Days m, o Monthly
The number of days of the month that biogas is venting uncontrolled from the project’s BCS.

35
Parameter Description Data unit
calculated (c) measured (m) reference(r)
operating records (o)
Measurement frequency Comment
Project Methane Calculation Variables – Non-BCS Related Sources
MSL,S
Fraction of manure from each livestock
category managed in non-anaerobic
manure management system component
‘S’
Percent (%) o Monthly
Based on configuration of manure management system, differentiated by livestock category. Verifier: Conduct site visit; Interview operator.
EFCH4,L (nBCSs)
Methane emission factor for the
livestock population from non-BCS-related sources
(kgCH4/head/year) c Annually
Emission factor for all non-BCS storage systems, differentiated by livestock category. See Equation 5.9. Verifiers: Review calculation, operation records.
Baseline and Project CO2 Calculation Variables
EFCO2,f
Fuel-specific emission factor for
mobile and stationary combustion sources
kg CO2/MMBTU
or kg CO2/gallon
r Annually
Refer to Appendix A for emission factors. If biogas produced from digester is used as an energy source, the emission factor is zero. Verifier: Review emission factors.
QFc Quantity of fuel used for mobile/stationary combustion sources
MMBTU/year or
gallon/year o, c Annually
Fuel used by project for manure collection, transport, treatment/storage, and disposal, and stationary combustion sources including supplemental fossil fuels used in combustion device. Verifier: Review operating records and quantity calculation.
EFCO2,e Emission factor for electricity used by
project tCO2/MWh r Annually
Refer to Appendix A for emission factors. If biogas produced from digester is used to generate electricity consumed, the emission factor is zero. Verifier: Review emission factors.
QEc Quantity of electricity
consumed MWh/year o, c Annually
Electricity used by project for manure collection, transport, treatment/storage, and disposal. Verifier: Review operating records and quantity calculation.
36
7 Reporting Parameters General requirements for reprinting and record retention are included in the Regulation. This section includes additional requirements specific to this protocol. A priority of this protocol is to facilitate consistent and transparent information disclosure by Offset Project Operators or Authorized Project Designees.
7.1 Annual Reporting Requirements The Offset Project Operators or Authorized Project Designees must submit an Offset Project Data Report according to the requirements in the Regulation. The Offset Project Data Report must include the information listed in the Regulation and this protocol and cover a single Reporting Period. See the Regulation and Appendix D for specific requirements.
7.2 Document Retention The Offset Project Operator or Authorized Project Designee is required to keep all documentation and information outlined in the Regulation and this protocol. Record retention requirements are set forth in the Regulation.
System Information that shall be retained by the Offset Project Operator or Authorized Project Designee shall include, but is not limited to:
All data inputs for the calculation of the project baseline emissions and project emission reductions
CO2e annual tonnage calculations Relevant sections of the BCS operating permits BCS information (installation dates, equipment list, etc.) Biogas flow meter information (model number, serial number, manufacturer’s
calibration procedures) Cleaning and inspection records for all biogas meters Field check results for all biogas meters Calibration results for all biogas meters Methane monitor information (model number, serial number, calibration
procedures) Biogas flow data (for each flow meter) Biogas temperature and pressure readings (only if flow meter does not correct for
temperature and pressure automatically) Methane concentration monitoring data Destruction device monitoring data (for each destruction device) Destruction device, methane monitor and biogas flow monitor information (model
numbers, serial numbers, calibration procedures) All maintenance records relevant to the BCS, monitoring equipment, and
destruction devices
If using a calibrated portable gas analyzer for CH4 content measurement: Date, time, and location of methane measurement
37
Methane content of biogas (% by volume) for each measurement Methane measurement instrument type and serial number Date, time, and results of instrument calibration Corrective measures taken if instrument does not meet performance
specifications See the Regulation for record-keeping requirements.
7.3 Verification Cycle Offset project verification schedules are set forth in the Regulation.
38
8 Glossary of Terms22 Anaerobic
Pertaining to or caused by the absence of oxygen.
Biogas
Gas that is produced from the breakdown of organic material in the absence of oxygen. Biogas is produced in processes including, but not limited to, anaerobic digestion, anaerobic decomposition, and thermochemical decomposition. These processes are applied to biodegradable biomass materials, such as manure, sewage, municipal solid waste, green waste, and waste from energy crops, to produce landfill gas, digester gas, and other forms of biogas.
Biogas control system (BCS)
A system designed to capture and destroy the biogas that is produced by the anaerobic treatment and/or storage of livestock manure and/or other organic material. Commonly referred to as a “digester.”
Biogenic CO2 emissions
CO2 emissions resulting from the combustion and/or aerobic decomposition of organic matter. Biogenic emissions are considered to be a natural part of the carbon cycle, as opposed to anthropogenic emissions.
22 For terms not defined in this section, the definitions in the Regulation apply.

39
Emission factor
A unique value for determining an amount of a greenhouse gas emitted for a given quantity of activity data (e.g. metric tons of carbon dioxide emitted per barrel of fossil fuel burned).
Flare
A destruction device that uses an open flame to burn combustible gases with combustion air provided by uncontrolled ambient air around the flame.
Livestock project
Installation of a biogas control system that, in operation, causes a decrease in GHG emissions from the baseline scenario through destruction of the methane component of biogas.
Methane (CH4)
A potent GHG with a GWP of 21, consisting of a single carbon atom and four hydrogen atoms.
MMBtu
One million British thermal units.
Mobile combustion
Emissions from the transportation of materials, products, waste, and employees resulting from the combustion of fuels in company owned or controlled mobile combustion sources (e.g. cars, trucks, tractors, dozers, etc.).
Stationary combustion source
A stationary source of emissions from the production of electricity, heat, or steam, resulting from combustion of fuels in boilers, furnaces, turbines, kilns, and other facility equipment.
van’t Hoff-Arrhenius factor
The proportion of volatile solids that are biologically available for conversion to methane based on the monthly temperature of the system.
40
9 References Climate ActionReserve (2009) Livestock Project Protocol Version 2.2. November 3, 2009
http://www.climateactionreserve.org/wp-content/uploads/2009/03/Livestock-Project-Protocol-Version2.2.pdf (accessed November 3, 2009)
Climate ActionReserve (2010) Livestock Project Protocol Version 3.0. September 29, 2010
http://www.climateactionreserve.org/wpcontent/uploads/2009/03/U.S._Livestock_Project_Protocol_V3.02.pdf (accessed September 29, 2010)
EPA Climate Leaders, Stationary Combustion Guidance (2008). http://www.epa.gov/climateleaders/documents/resources/stationarycombustionguidance.pdf (accessed May 2008)
EPA eGRID2007, Version 1.1 Year 2005 GHG Annual Output Emission Rates (2008).
http://www.epa.gov/cleanenergy/documents/egridzips/eGRID2007V1_1_year05_GHGOutputRates.pdf (accessed December, 2008)
41
Appendix A Emission Factor Tables – Quantification Methodology
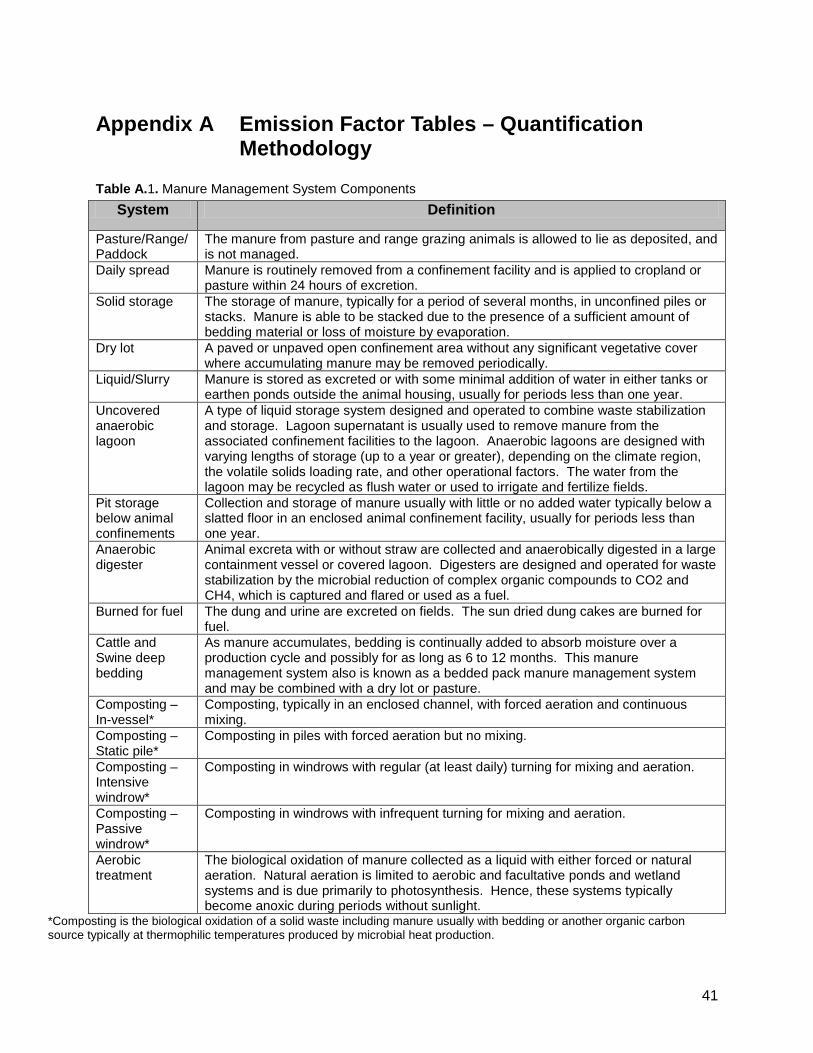
Table A.1. Manure Management System Components
System Definition
Pasture/Range/ Paddock
The manure from pasture and range grazing animals is allowed to lie as deposited, and is not managed.
Daily spread Manure is routinely removed from a confinement facility and is applied to cropland or pasture within 24 hours of excretion.
Solid storage
The storage of manure, typically for a period of several months, in unconfined piles or stacks. Manure is able to be stacked due to the presence of a sufficient amount of bedding material or loss of moisture by evaporation.
Dry lot A paved or unpaved open confinement area without any significant vegetative cover where accumulating manure may be removed periodically.
Liquid/Slurry
Manure is stored as excreted or with some minimal addition of water in either tanks or earthen ponds outside the animal housing, usually for periods less than one year.
Uncovered anaerobic lagoon
A type of liquid storage system designed and operated to combine waste stabilization and storage. Lagoon supernatant is usually used to remove manure from the associated confinement facilities to the lagoon. Anaerobic lagoons are designed with varying lengths of storage (up to a year or greater), depending on the climate region, the volatile solids loading rate, and other operational factors. The water from the lagoon may be recycled as flush water or used to irrigate and fertilize fields.
Pit storage below animal confinements
Collection and storage of manure usually with little or no added water typically below a slatted floor in an enclosed animal confinement facility, usually for periods less than one year.
Anaerobic digester
Animal excreta with or without straw are collected and anaerobically digested in a large containment vessel or covered lagoon. Digesters are designed and operated for waste stabilization by the microbial reduction of complex organic compounds to CO2 and CH4, which is captured and flared or used as a fuel.
Burned for fuel The dung and urine are excreted on fields. The sun dried dung cakes are burned for fuel.
Cattle and Swine deep bedding
As manure accumulates, bedding is continually added to absorb moisture over a production cycle and possibly for as long as 6 to 12 months. This manure management system also is known as a bedded pack manure management system and may be combined with a dry lot or pasture.
Composting – In-vessel*
Composting, typically in an enclosed channel, with forced aeration and continuous mixing.
Composting – Static pile*
Composting in piles with forced aeration but no mixing.
Composting – Intensive windrow*
Composting in windrows with regular (at least daily) turning for mixing and aeration.
Composting – Passive windrow*
Composting in windrows with infrequent turning for mixing and aeration.
Aerobic treatment
The biological oxidation of manure collected as a liquid with either forced or natural aeration. Natural aeration is limited to aerobic and facultative ponds and wetland systems and is due primarily to photosynthesis. Hence, these systems typically become anoxic during periods without sunlight.
*Composting is the biological oxidation of a solid waste including manure usually with bedding or another organic carbon source typically at thermophilic temperatures produced by microbial heat production.
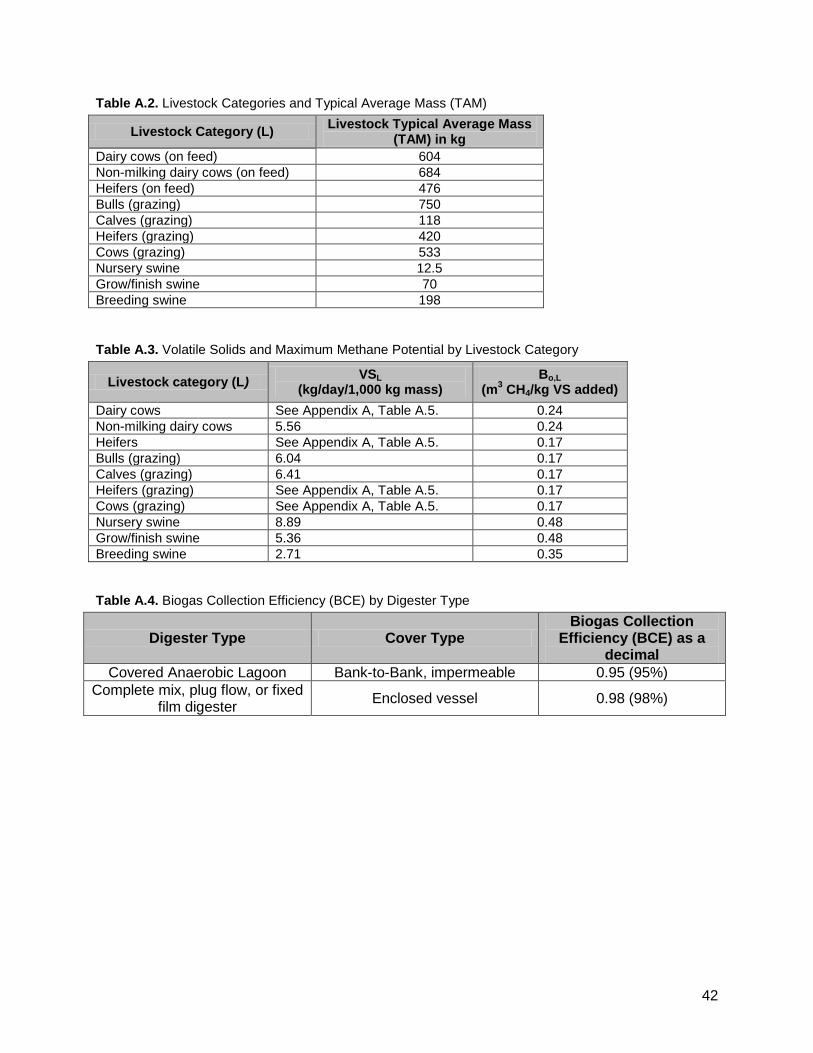
42
Table A.2. Livestock Categories and Typical Average Mass (TAM)
Livestock Category (L) Livestock Typical Average Mass (TAM) in kg
Dairy cows (on feed) 604 Non-milking dairy cows (on feed) 684 Heifers (on feed) 476 Bulls (grazing) 750 Calves (grazing) 118 Heifers (grazing) 420 Cows (grazing) 533 Nursery swine 12.5 Grow/finish swine 70 Breeding swine 198 Table A.3. Volatile Solids and Maximum Methane Potential by Livestock Category
Livestock category (L) VSL (kg/day/1,000 kg mass)
Bo,L (m3 CH4/kg VS added)
Dairy cows See Appendix A, Table A.5. 0.24 Non-milking dairy cows 5.56 0.24 Heifers See Appendix A, Table A.5. 0.17 Bulls (grazing) 6.04 0.17 Calves (grazing) 6.41 0.17 Heifers (grazing) See Appendix A, Table A.5. 0.17 Cows (grazing) See Appendix A, Table A.5. 0.17 Nursery swine 8.89 0.48 Grow/finish swine 5.36 0.48 Breeding swine 2.71 0.35 Table A.4. Biogas Collection Efficiency (BCE) by Digester Type
Digester Type Cover Type Biogas Collection
Efficiency (BCE) as a decimal
Covered Anaerobic Lagoon Bank-to-Bank, impermeable 0.95 (95%) Complete mix, plug flow, or fixed
film digester Enclosed vessel 0.98 (98%)
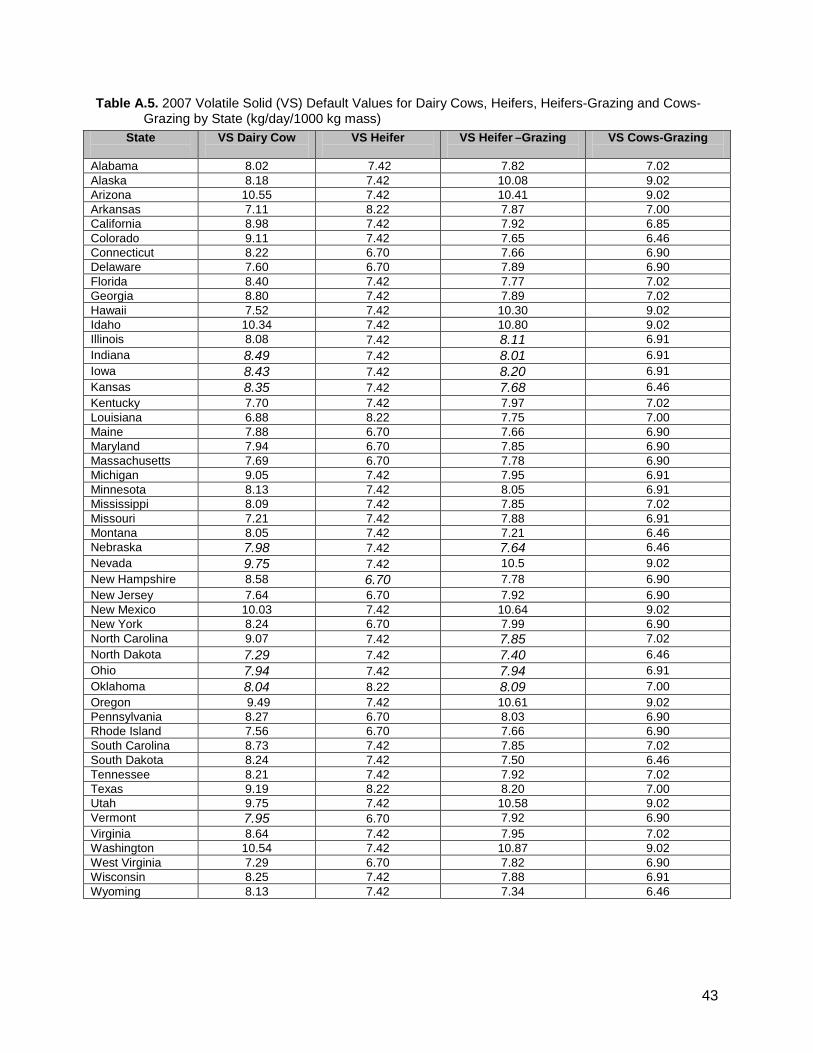
43
Table A.5. 2007 Volatile Solid (VS) Default Values for Dairy Cows, Heifers, Heifers-Grazing and Cows-Grazing by State (kg/day/1000 kg mass)
State
VS Dairy Cow
VS Heifer
VS Heifer –Grazing
VS Cows-Grazing
Alabama 8.02 7.42 7.82 7.02 Alaska 8.18 7.42 10.08 9.02 Arizona 10.55 7.42 10.41 9.02 Arkansas 7.11 8.22 7.87 7.00 California 8.98 7.42 7.92 6.85 Colorado 9.11 7.42 7.65 6.46 Connecticut 8.22 6.70 7.66 6.90 Delaware 7.60 6.70 7.89 6.90 Florida 8.40 7.42 7.77 7.02 Georgia 8.80 7.42 7.89 7.02 Hawaii 7.52 7.42 10.30 9.02 Idaho 10.34 7.42 10.80 9.02 Illinois 8.08 7.42 8.11 6.91 Indiana 8.49 7.42 8.01 6.91 Iowa 8.43 7.42 8.20 6.91 Kansas 8.35 7.42 7.68 6.46 Kentucky 7.70 7.42 7.97 7.02 Louisiana 6.88 8.22 7.75 7.00 Maine 7.88 6.70 7.66 6.90 Maryland 7.94 6.70 7.85 6.90 Massachusetts 7.69 6.70 7.78 6.90 Michigan 9.05 7.42 7.95 6.91 Minnesota 8.13 7.42 8.05 6.91 Mississippi 8.09 7.42 7.85 7.02 Missouri 7.21 7.42 7.88 6.91 Montana 8.05 7.42 7.21 6.46 Nebraska 7.98 7.42 7.64 6.46 Nevada 9.75 7.42 10.5 9.02 New Hampshire 8.58 6.70 7.78 6.90 New Jersey 7.64 6.70 7.92 6.90 New Mexico 10.03 7.42 10.64 9.02 New York 8.24 6.70 7.99 6.90 North Carolina 9.07 7.42 7.85 7.02 North Dakota 7.29 7.42 7.40 6.46 Ohio 7.94 7.42 7.94 6.91 Oklahoma 8.04 8.22 8.09 7.00 Oregon 9.49 7.42 10.61 9.02 Pennsylvania 8.27 6.70 8.03 6.90 Rhode Island 7.56 6.70 7.66 6.90 South Carolina 8.73 7.42 7.85 7.02 South Dakota 8.24 7.42 7.50 6.46 Tennessee 8.21 7.42 7.92 7.02 Texas 9.19 8.22 8.20 7.00 Utah 9.75 7.42 10.58 9.02 Vermont 7.95 6.70 7.92 6.90 Virginia 8.64 7.42 7.95 7.02 Washington 10.54 7.42 10.87 9.02 West Virginia 7.29 6.70 7.82 6.90 Wisconsin 8.25 7.42 7.88 6.91 Wyoming 8.13 7.42 7.34 6.46
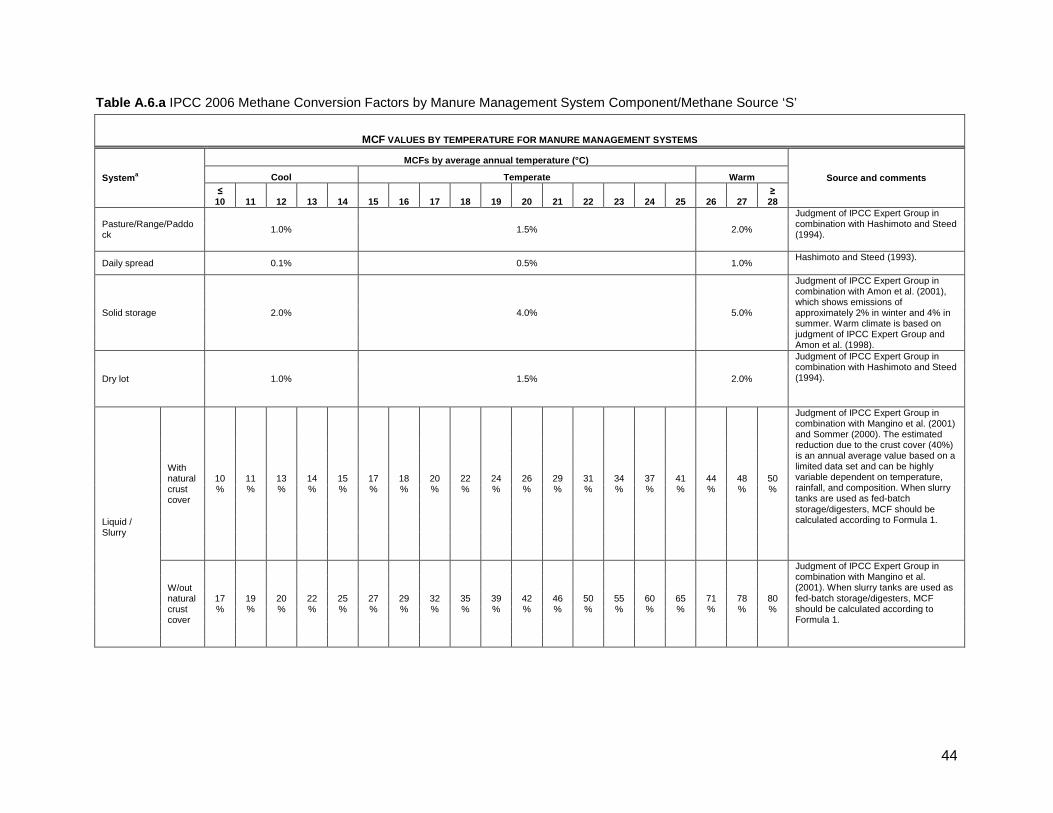
44
Table A.6.a IPCC 2006 Methane Conversion Factors by Manure Management System Component/Methane Source ‘S’
MCF VALUES BY TEMPERATURE FOR MANURE MANAGEMENT SYSTEMS
Systema
MCFs by average annual temperature (°C)
Source and comments Cool Temperate Warm ≤
10 11 12 13 14 15 16 17 18 19 20 21 22 23 24 25 26 27 ≥ 28
Pasture/Range/Paddock 1.0% 1.5% 2.0%
Judgment of IPCC Expert Group in combination with Hashimoto and Steed (1994).
Daily spread 0.1% 0.5% 1.0% Hashimoto and Steed (1993).
Solid storage 2.0% 4.0% 5.0%
Judgment of IPCC Expert Group in combination with Amon et al. (2001), which shows emissions of approximately 2% in winter and 4% in summer. Warm climate is based on judgment of IPCC Expert Group and Amon et al. (1998).
Dry lot 1.0% 1.5% 2.0%
Judgment of IPCC Expert Group in combination with Hashimoto and Steed (1994).
Liquid / Slurry
With natural crust cover
10%
11%
13%
14%
15%
17%
18%
20%
22%
24%
26%
29%
31%
34%
37%
41%
44%
48%
50%
Judgment of IPCC Expert Group in combination with Mangino et al. (2001) and Sommer (2000). The estimated reduction due to the crust cover (40%) is an annual average value based on a limited data set and can be highly variable dependent on temperature, rainfall, and composition. When slurry tanks are used as fed-batch storage/digesters, MCF should be calculated according to Formula 1.
W/out natural crust cover
17%
19%
20%
22%
25%
27%
29%
32%
35%
39%
42%
46%
50%
55%
60%
65%
71%
78%
80%
Judgment of IPCC Expert Group in combination with Mangino et al. (2001). When slurry tanks are used as fed-batch storage/digesters, MCF should be calculated according to Formula 1.

45
Table A.6.a Continued MCF VALUES BY TEMPERATURE FOR MANURE MANAGEMENT SYSTEMS
Systema MCFs by average annual temperature (°C)
Source and comments Cool Temperate Warm
≤ 10 11 12 13 14 15 16 17 18 19 20 21 22 23 24 25 26 27 ≥ 28
Uncovered anaerobic lagoon 66% 68% 70% 71% 73% 74% 75% 76% 77% 77% 78% 78% 78% 79% 79% 79% 79% 80% 80%
Judgment of IPCC Expert Group in combination with Mangino et al. (2001). Uncovered lagoon MCFs vary based on several factors, including temperature, retention time, and loss of volatile solids from the system (through removal of lagoon effluent and/or solids).
Pit storage below animal confinements
< 1 month 3% 3% 3%
Judgment of IPCC Expert Group in combination with Moller et al. (2004) and Zeeman (1994). Note that the ambient temperature, not the stable temperature is to be used for determining the climatic conditions. When pits used as fed-batch storage/digesters, MCF should be calculated according to Formula 1.
> 1 month 17% 19% 20% 22% 25% 27% 29% 32% 35% 39% 42% 46% 50% 55% 60% 65% 71% 78% 80%
Judgment of IPCC Expert Group in combination with Mangino et al. (2001). Note that the ambient temperature, not the stable temperature is to be used for determining the climatic conditions. When pits used as fed-batch storage/digesters, MCF should be calculated according to Formula 1.
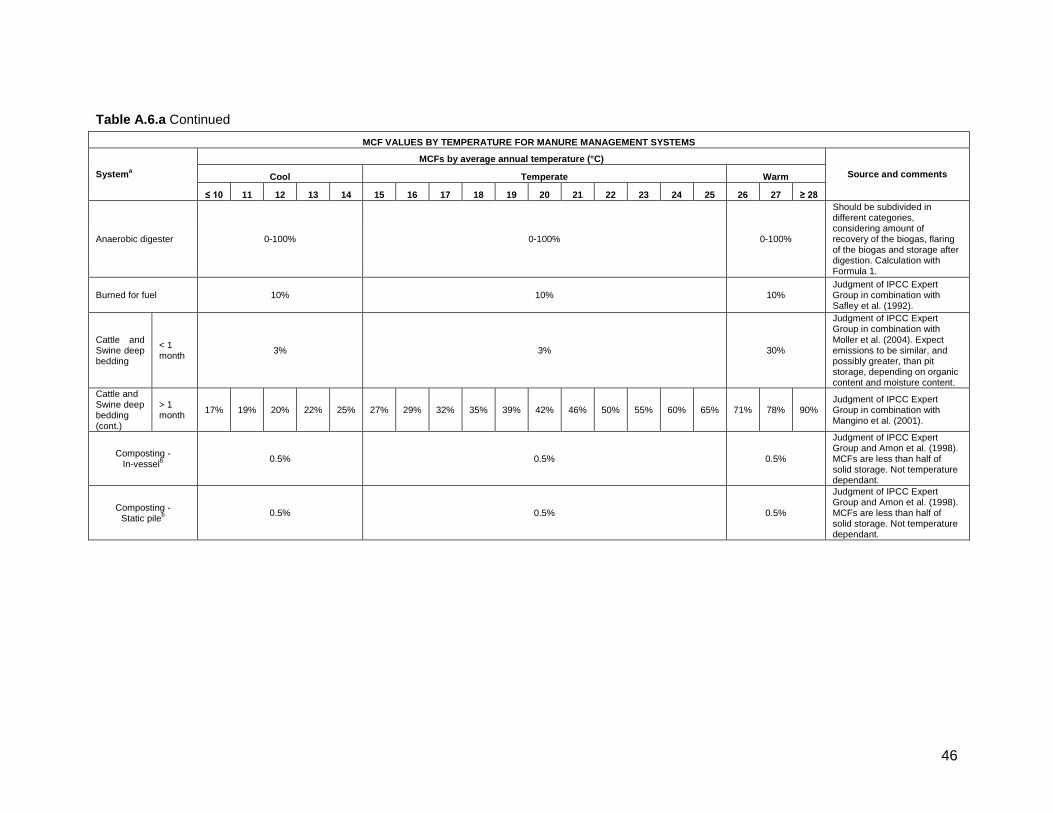
46
Table A.6.a Continued
MCF VALUES BY TEMPERATURE FOR MANURE MANAGEMENT SYSTEMS
Systema MCFs by average annual temperature (°C)
Source and comments Cool Temperate Warm
≤ 10 11 12 13 14 15 16 17 18 19 20 21 22 23 24 25 26 27 ≥ 28
Anaerobic digester 0-100% 0-100% 0-100%
Should be subdivided in different categories, considering amount of recovery of the biogas, flaring of the biogas and storage after digestion. Calculation with Formula 1.
Burned for fuel 10% 10% 10% Judgment of IPCC Expert Group in combination with Safley et al. (1992).
Cattle and Swine deep bedding
< 1 month 3% 3% 30%
Judgment of IPCC Expert Group in combination with Moller et al. (2004). Expect emissions to be similar, and possibly greater, than pit storage, depending on organic content and moisture content.
Cattle and Swine deep bedding (cont.)
> 1 month 17% 19% 20% 22% 25% 27% 29% 32% 35% 39% 42% 46% 50% 55% 60% 65% 71% 78% 90%
Judgment of IPCC Expert Group in combination with Mangino et al. (2001).
Composting - In-vesselb 0.5% 0.5% 0.5%
Judgment of IPCC Expert Group and Amon et al. (1998). MCFs are less than half of solid storage. Not temperature dependant.
Composting - Static pileb 0.5% 0.5% 0.5%
Judgment of IPCC Expert Group and Amon et al. (1998). MCFs are less than half of solid storage. Not temperature dependant.

47
Table A.6.a Continued
Composting - Intensive windrowb 0.5% 1.0% 1.5%
Judgment of IPCC Expert Group and Amon et al. (1998). MCFs are slightly less than solid storage. Less temperature dependant.
Composting – Passive windrowb 0.5% 1.0% 1.5%
Judgment of IPCC Expert Group and Amon et al. (1998). MCFs are slightly less than solid storage. Less temperature dependant.
Aerobic treatment 0% 0% 0%
MCFs are near zero. Aerobic treatment can result in the accumulation of sludge which may be treated in other systems. Sludge requires removal and has large VS values. It is important to identify the next management process for the sludge and estimate the emissions from that management process if significant.
a Definitions for manure management systems are provided in Table A.1. b Composting is the biological oxidation of a solid waste including manure usually with bedding or another organic carbon source typically at thermophilic temperatures produced by microbial heat production.
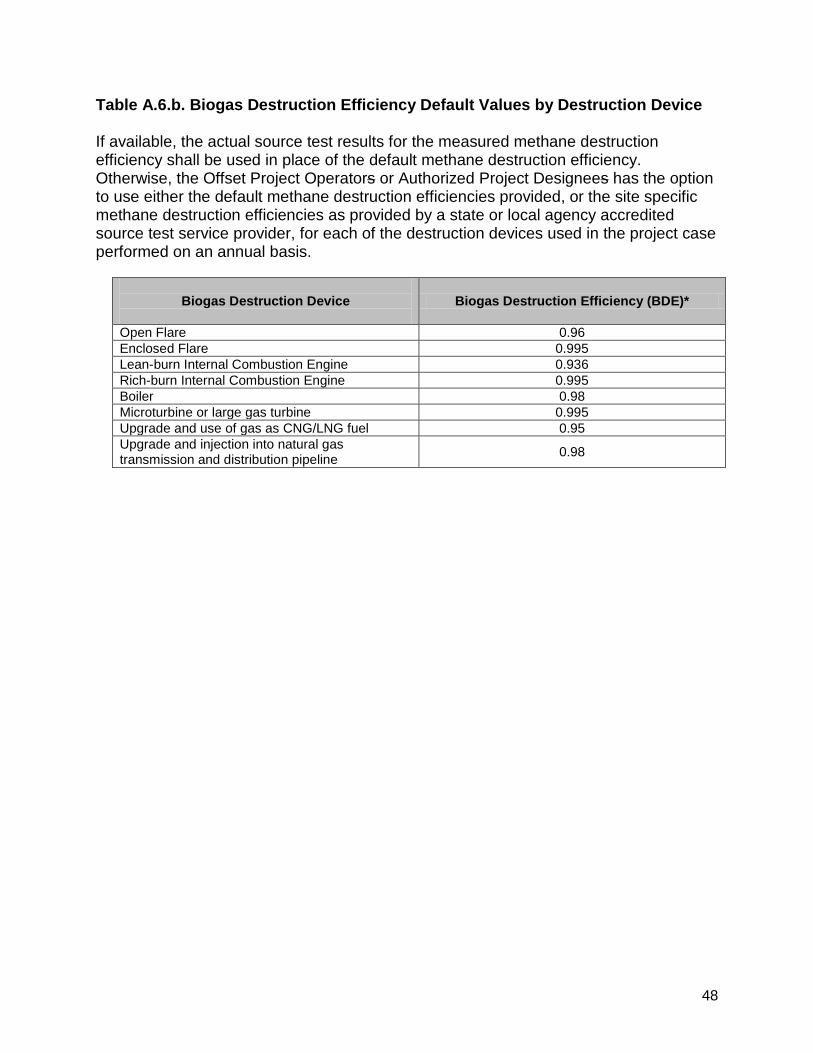
48
Table A.6.b. Biogas Destruction Efficiency Default Values by Destruction Device If available, the actual source test results for the measured methane destruction efficiency shall be used in place of the default methane destruction efficiency. Otherwise, the Offset Project Operators or Authorized Project Designees has the option to use either the default methane destruction efficiencies provided, or the site specific methane destruction efficiencies as provided by a state or local agency accredited source test service provider, for each of the destruction devices used in the project case performed on an annual basis.
Biogas Destruction Device
Biogas Destruction Efficiency (BDE)*
Open Flare 0.96
Enclosed Flare 0.995
Lean-burn Internal Combustion Engine 0.936
Rich-burn Internal Combustion Engine 0.995 Boiler 0.98
Microturbine or large gas turbine 0.995
Upgrade and use of gas as CNG/LNG fuel 0.95 Upgrade and injection into natural gas transmission and distribution pipeline 0.98
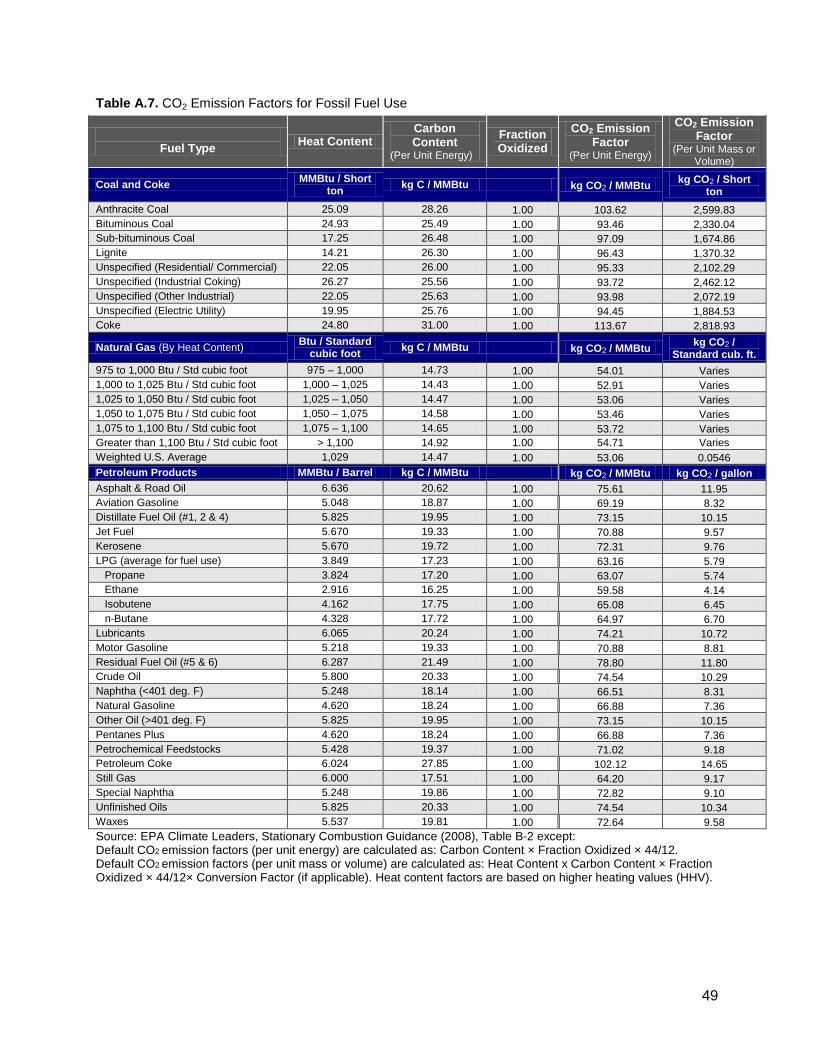
49
Table A.7. CO2 Emission Factors for Fossil Fuel Use
Fuel Type Heat Content
Carbon Content
(Per Unit Energy) Fraction Oxidized
CO2 Emission Factor
(Per Unit Energy)
CO2 Emission Factor
(Per Unit Mass or Volume)
Coal and Coke MMBtu / Short ton kg C / MMBtu kg CO2 / MMBtu kg CO2 / Short
ton Anthracite Coal 25.09 28.26 1.00 103.62 2,599.83 Bituminous Coal 24.93 25.49 1.00 93.46 2,330.04 Sub-bituminous Coal 17.25 26.48 1.00 97.09 1,674.86 Lignite 14.21 26.30 1.00 96.43 1,370.32 Unspecified (Residential/ Commercial) 22.05 26.00 1.00 95.33 2,102.29 Unspecified (Industrial Coking) 26.27 25.56 1.00 93.72 2,462.12 Unspecified (Other Industrial) 22.05 25.63 1.00 93.98 2,072.19 Unspecified (Electric Utility) 19.95 25.76 1.00 94.45 1,884.53 Coke 24.80 31.00 1.00 113.67 2,818.93
Natural Gas (By Heat Content) Btu / Standard cubic foot kg C / MMBtu kg CO2 / MMBtu kg CO2 /
Standard cub. ft. 975 to 1,000 Btu / Std cubic foot 975 – 1,000 14.73 1.00 54.01 Varies 1,000 to 1,025 Btu / Std cubic foot 1,000 – 1,025 14.43 1.00 52.91 Varies 1,025 to 1,050 Btu / Std cubic foot 1,025 – 1,050 14.47 1.00 53.06 Varies 1,050 to 1,075 Btu / Std cubic foot 1,050 – 1,075 14.58 1.00 53.46 Varies 1,075 to 1,100 Btu / Std cubic foot 1,075 – 1,100 14.65 1.00 53.72 Varies Greater than 1,100 Btu / Std cubic foot > 1,100 14.92 1.00 54.71 Varies Weighted U.S. Average 1,029 14.47 1.00 53.06 0.0546 Petroleum Products MMBtu / Barrel kg C / MMBtu kg CO2 / MMBtu kg CO2 / gallon Asphalt & Road Oil 6.636 20.62 1.00 75.61 11.95 Aviation Gasoline 5.048 18.87 1.00 69.19 8.32 Distillate Fuel Oil (#1, 2 & 4) 5.825 19.95 1.00 73.15 10.15 Jet Fuel 5.670 19.33 1.00 70.88 9.57 Kerosene 5.670 19.72 1.00 72.31 9.76 LPG (average for fuel use) 3.849 17.23 1.00 63.16 5.79 Propane 3.824 17.20 1.00 63.07 5.74 Ethane 2.916 16.25 1.00 59.58 4.14 Isobutene 4.162 17.75 1.00 65.08 6.45 n-Butane 4.328 17.72 1.00 64.97 6.70 Lubricants 6.065 20.24 1.00 74.21 10.72 Motor Gasoline 5.218 19.33 1.00 70.88 8.81 Residual Fuel Oil (#5 & 6) 6.287 21.49 1.00 78.80 11.80 Crude Oil 5.800 20.33 1.00 74.54 10.29 Naphtha (<401 deg. F) 5.248 18.14 1.00 66.51 8.31 Natural Gasoline 4.620 18.24 1.00 66.88 7.36 Other Oil (>401 deg. F) 5.825 19.95 1.00 73.15 10.15 Pentanes Plus 4.620 18.24 1.00 66.88 7.36 Petrochemical Feedstocks 5.428 19.37 1.00 71.02 9.18 Petroleum Coke 6.024 27.85 1.00 102.12 14.65 Still Gas 6.000 17.51 1.00 64.20 9.17 Special Naphtha 5.248 19.86 1.00 72.82 9.10 Unfinished Oils 5.825 20.33 1.00 74.54 10.34 Waxes 5.537 19.81 1.00 72.64 9.58 Source: EPA Climate Leaders, Stationary Combustion Guidance (2008), Table B-2 except: Default CO2 emission factors (per unit energy) are calculated as: Carbon Content × Fraction Oxidized × 44/12. Default CO2 emission factors (per unit mass or volume) are calculated as: Heat Content x Carbon Content × Fraction Oxidized × 44/12× Conversion Factor (if applicable). Heat content factors are based on higher heating values (HHV).

50
Table A.8. CO2 Electricity Emission Factors eGRID
eGRID subregion name Annual output emission rates
subregion acronym (lb CO2/MWh) (metric ton CO2/MWh)*
AKGD ASCC Alaska Grid 1,232.36 0.559 AKMS ASCC Miscellaneous 498.86 0.226 AZNM WECC Southwest 1,311.05 0.595 CAMX WECC California 724.12 0.328 ERCT ERCOT All 1,324.35 0.601 FRCC FRCC All 1,318.57 0.598 HIMS HICC Miscellaneous 1,514.92 0.687 HIOA HICC Oahu 1,811.98 0.822 MROE MRO East 1,834.72 0.832 MROW MRO West 1,821.84 0.826 NEWE NPCC New England 927.68 0.421 NWPP WECC Northwest 902.24 0.409 NYCW NPCC NYC/Westchester 815.45 0.370 NYLI NPCC Long Island 1,536.80 0.697 NYUP NPCC Upstate NY 720.80 0.327 RFCE RFC East 1,139.07 0.517 RFCM RFC Michigan 1,563.28 0.709 RFCW RFC West 1,537.82 0.698 RMPA WECC Rockies 1,883.08 0.854 SPNO SPP North 1,960.94 0.889 SPSO SPP South 1,658.14 0.752 SRMV SERC Mississippi Valley 1,019.74 0.463 SRMW SERC Midwest 1,830.51 0.830 SRSO SERC South 1,489.54 0.676 SRTV SERC Tennessee Valley 1,510.44 0.685 SRVC SERC Virginia/Carolina 1,134.88 0.515 Source: U.S. EPA eGRID2007, Version 1.1 Year 2005 GHG Annual Output Emission Rates (December 2008). * Converted from lbs CO2/MWh to metric tons CO2/MWH using conversion factor 1 metric ton = 2,204.62 lbs.
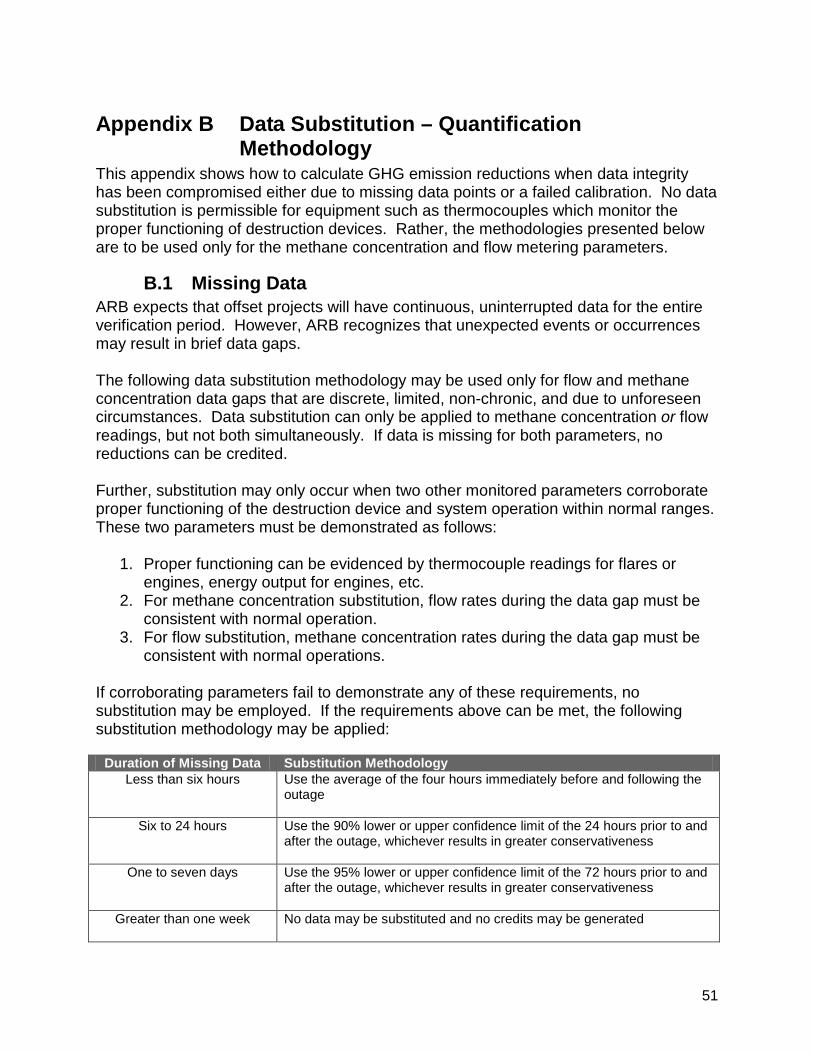
51
Appendix B Data Substitution – Quantification Methodology
This appendix shows how to calculate GHG emission reductions when data integrity has been compromised either due to missing data points or a failed calibration. No data substitution is permissible for equipment such as thermocouples which monitor the proper functioning of destruction devices. Rather, the methodologies presented below are to be used only for the methane concentration and flow metering parameters.
B.1 Missing Data ARB expects that offset projects will have continuous, uninterrupted data for the entire verification period. However, ARB recognizes that unexpected events or occurrences may result in brief data gaps. The following data substitution methodology may be used only for flow and methane concentration data gaps that are discrete, limited, non-chronic, and due to unforeseen circumstances. Data substitution can only be applied to methane concentration or flow readings, but not both simultaneously. If data is missing for both parameters, no reductions can be credited. Further, substitution may only occur when two other monitored parameters corroborate proper functioning of the destruction device and system operation within normal ranges. These two parameters must be demonstrated as follows:
1. Proper functioning can be evidenced by thermocouple readings for flares or engines, energy output for engines, etc.
2. For methane concentration substitution, flow rates during the data gap must be consistent with normal operation.
3. For flow substitution, methane concentration rates during the data gap must be consistent with normal operations.
If corroborating parameters fail to demonstrate any of these requirements, no substitution may be employed. If the requirements above can be met, the following substitution methodology may be applied:
Duration of Missing Data Substitution Methodology Less than six hours Use the average of the four hours immediately before and following the
outage
Six to 24 hours Use the 90% lower or upper confidence limit of the 24 hours prior to and after the outage, whichever results in greater conservativeness
One to seven days Use the 95% lower or upper confidence limit of the 72 hours prior to and after the outage, whichever results in greater conservativeness
Greater than one week No data may be substituted and no credits may be generated

52
Note: It is conservative to use the upper confidence limit when calculating emissions from the BCS (Equation 5.6); however it is conservative to use the lower confidence limit when calculating the total amount of methane that is destroyed in the BCS Equation 5.10.
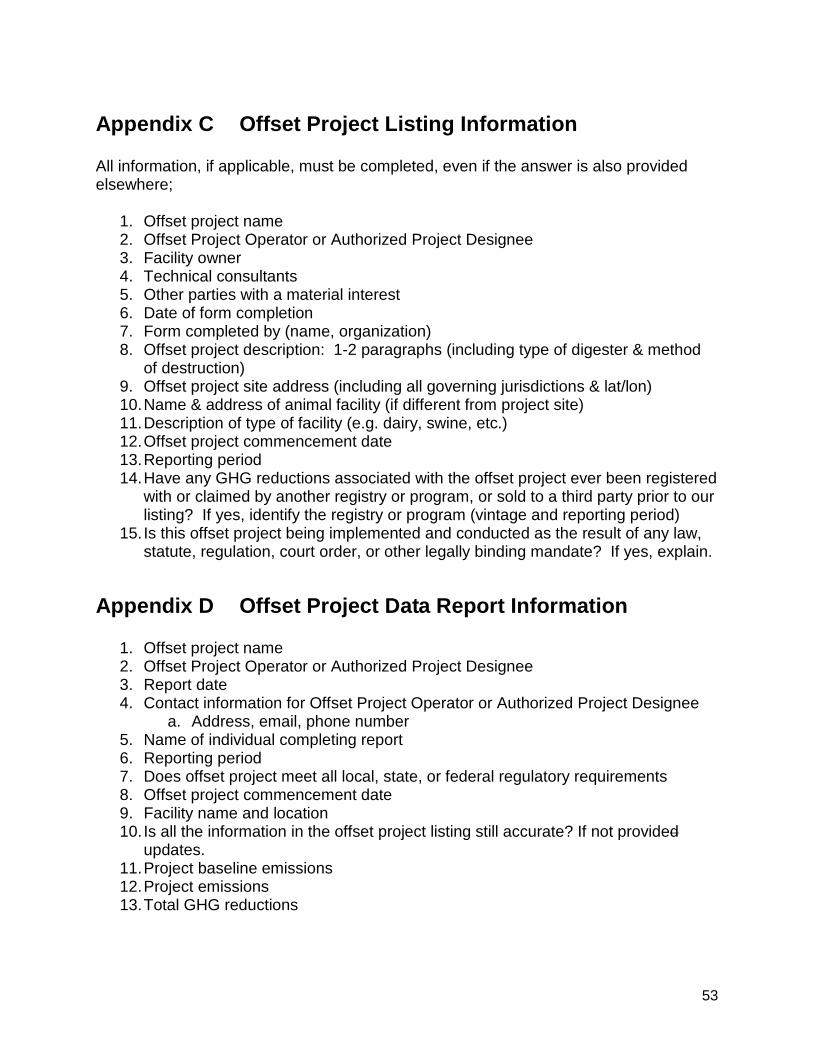
53
Appendix C Offset Project Listing Information All information, if applicable, must be completed, even if the answer is also provided elsewhere;
1. Offset project name 2. Offset Project Operator or Authorized Project Designee 3. Facility owner 4. Technical consultants 5. Other parties with a material interest 6. Date of form completion 7. Form completed by (name, organization) 8. Offset project description: 1-2 paragraphs (including type of digester & method
of destruction) 9. Offset project site address (including all governing jurisdictions & lat/lon) 10. Name & address of animal facility (if different from project site) 11. Description of type of facility (e.g. dairy, swine, etc.) 12. Offset project commencement date 13. Reporting period 14. Have any GHG reductions associated with the offset project ever been registered
with or claimed by another registry or program, or sold to a third party prior to our listing? If yes, identify the registry or program (vintage and reporting period)
15. Is this offset project being implemented and conducted as the result of any law, statute, regulation, court order, or other legally binding mandate? If yes, explain.
Appendix D Offset Project Data Report Information
1. Offset project name 2. Offset Project Operator or Authorized Project Designee 3. Report date 4. Contact information for Offset Project Operator or Authorized Project Designee
a. Address, email, phone number 5. Name of individual completing report 6. Reporting period 7. Does offset project meet all local, state, or federal regulatory requirements 8. Offset project commencement date 9. Facility name and location 10. Is all the information in the offset project listing still accurate? If not provided
updates. 11. Project baseline emissions 12. Project emissions 13. Total GHG reductions