complexity in the lives of looked after children and …...appendix 1. 1. problems experienced in...
TRANSCRIPT
Complexity in the lives oflooked after children and their families in Scotland: 2003 to 2016
2
About the authors: Dr Ruth Woods was a Research Officer in the Scottish Children’s Reporter Administration (SCRA) and led on this research. She is now Lecturer in Psychology, School of Applied Social Studies, Robert Gordon University Email: [email protected] Dr Gillian Henderson is the Information & Research Manager, SCRA; and Honorary Research Fellow in School of Social Work & Social Policy, University of Strathclyde Email: [email protected] Indiya Kurlus is the Research Officer, SCRA Email: [email protected] Pauline Proudfoot is the Operational Development Manager, SCRA Email: [email protected] Nick Hobbs was the Policy & Public Affairs Manager, SCRA, at the time of drafting. He is now the Head of Advice & Investigations, Children’s & Young People’s Commissioner Scotland Email: [email protected] Donald Lamb is the Data Manager, SCRA Email: [email protected]
3
Contents Executive summary 5 1. Introduction 7 1.1. Defining complexity 7 1.2. Types of complexity in child protection 8 1.3. Implications of complexity in legislation and practice 10 1.4. This study 11 2. Societal context – national trends 12 3. Measuring changes in complexity of looked after children’s lives 14
3.1 Methodology 14 3.2. Analysis of differences in complexity in looked after children’s lives between T1 (children born between April 2003 and January 2004) and T2 16 (children born between April 2013 and January 2014) 3.3. Findings – differences in the complexity in looked after children’s lives over time 18
1. Increased complexity 18 2. Decreased complexity 21 3. No change in complexity 22 4. Legal complexity and the operation of the Children’s Hearings System 24 4.1. Measuring changes in legal complexity and the operation of the Hearings System 24 4.2. The changing legislative landscape 24 4.3. Changes to SCRA practice triggered by legislation 27
4.4. Changing patterns of referrals 28 4.5. Frequency of major complex events related to Children’s Hearings 29 5. Discussion and conclusion 31 6. References 35 Table 1. Increases in complexity in looked after children’s lives between T1 19 (children born between April 2003 and January 2004) and T2 (children born between April 2013 and January 2014) Table 2. Decreases in complexity 21 Table 3. No changes in complexity 23 Table 4. Comparison of main legislation 25 Table 5. Comparison of ‘other’ legislation 26 Table 6. Frequencies of complex Children’s Hearings-related events from 2003-04 29 to 2015-16 Figure 1. Summary – % increases in complexity in looked after children’s lives between 18 T1 and T2 Figure 2. Summary of legislation in place at 1998 and 2017 relevant to SCRA’s work 26
4
Figure 3. Children referred to the Reporter on offence and non-offence grounds, 1976 to 28 2015-16 Figure 4. Distribution of complex Children’s Hearings-related events across 31 local authority areas in 2015-16 Appendix 1. 1. Problems experienced in the first three years of their lives by children 41 born in 2003 (T1) and those born in 2013 (T2) 2. Problems experienced by parents in the first three years of their child’s life 42 – for those with children born in 2003 (T1) and those born in 2013 (T2)

5
Executive summary
This research sought to answer the question: Has child protection in Scotland become more complex over time, and if so, how? To do this we examined changes in complexity in:
Society. The Children’s Hearings System and associated legislation and practice. The lives of looked after children aged under three years and their families. To do this we
developed a method to measure changes in complexity in the lives of looked children, and used it to assess complexity in the first three years of the lives of children born in 2003 compared to those born in 2013.
What we found Changing complexity in looked after children’s lives Increases:
Extent of family fragmentation - separation of children from their parents and siblings. This was directly linked to changes in child protection practice resulting in more children aged under three years being removed from their parents’ care.
Residence with child who is not a sibling. Number of changes in Compulsory Supervision Orders (CSOs). Contributory factors were
increases in numbers of children with permanence plans, supervised contact with parents and earlier age of being taken into care.
Number of problems faced by parents, especially criminality. But, the frequencies of many individual parental problems were high over time suggesting a stable population of high risk parents with multiple serious problems. Each of the following parental problems were present in over 50% of the families studied: victim of abuse; perpetrator of abuse; abused drugs; committed an offence; mental illness; inappropriate relationships; difficult childhood; unemployed; and/or was in a volatile relationship.
Presence of legal representatives in Hearings and number of relevant persons - both are directly linked to changes in legislation.
Over the past two decades in Scotland in general (i.e. not specifically amongst families of looked after children), complexity resulting from ethnic diversity and drug and alcohol abuse have increased.
Decreases:
SIMD (Scottish Index of Multiple Deprivation) at birth – the first residence of children born in 2003 had lower SIMD than those born in 2013. This change reflects the increase over time in the number of children who went directly from hospital after birth into foster care, since foster carers tended to live in more affluent areas than did birth parents.
Number of changes of co-residents experienced by child. This again was linked to the increased practice of placing children with foster carers from birth.
6
No changes: Sibling group size Rates of parental separation Rates of problems in extended family Rates of problems for family in community Number of places of residence Number of concurrent residences Number of changes of key worker Number of child problems Number of organisations working with family
We found that inter-agency complexity has, in general, not increased over the time. We also found that many of these types of complexity have remained consistently high (e.g. over 40% of families had problems in their community and extended family, over 70% of parents separated in the first three years of their child’s life, and a fifth of children were premature or had low birth weights). Frequencies of complex Children’s Hearings-related events from 2003-04 to 2015-16 ↑19% - Child Protection Orders ↑87% - Pre-Hearing Panels/ Business meetings ↑115% - Appeals ↑137% - Interim Compulsory Supervision Orders/ Warrants ↑191% - Non Disclosure Orders
↓0.2% - Hearing held ↓2% - children with CSOs ↓8% - applications for proof concluded In addition, there was an 88% increase in the number of pieces of legislation related to the Hearings System between 1998 and 2017.
Conclusion This research has provided evidence to answer conclusively that: Yes - child protection in Scotland has become more complex over time. There are multiple factors that affect the care and protection of children which have become more complex, in particular the extent of problems faced by parents. Legislation and practice changes to protect looked after children have also added complexity to the lives of vulnerable families both directly through their involvement in legal processes and indirectly through increased family fragmentation through interventions to take children into care. This increased complexity in child protection has implications for all those working within the Hearings System, especially for the training of Children’s Panel Members and professionals, and in their decision making to protect vulnerable children. Importantly, it has implications for those families who find themselves involved in an increasingly complex legal system.
7
1. Introduction There exists a widely held view in the UK and elsewhere that child protection and family social work is characterised by complexity. This argument has been put forward for children’s and families’ lives (Ball, 2014; Cree et al., 2016; Daniel, 2015; Hood, 2014, 2015; Mitchell, 2011; O’Connor et al., 2014; Rose et al., 2016), and to society in general (Mitendorf & van Ewijk, 2016; Scottish Executive, 2006). Moreover, there are suggestions that complexity in child protection and families’ lives is growing over time, as a result of changes in levels of social inequality, drug and alcohol use, family fragmentation, professional practice, thresholds for entering care, and legislation (Manning et al., 2014; Parton, 2011; Rowlands & Statham, 2009; Scottish Executive, 2006; Scottish Children’s Reporter Administration, 2017a). The claim that child protection and the lives of vulnerable children are complex is almost a mantra. However, claims about levels of complexity are often made without any clear definition of the term itself (Glenmaye et al., 2004). So while everyone is using the same word, they do not necessarily mean the same thing. Furthermore, the lack of a clear definition hinders efforts to measure levels of complexity. For most looked after children in Scotland, it is the Children’s Hearings System that provides the legal context by which decisions are made on the interventions required to protect their safety and well-being. The Hearings System, the types of cases it deals with, legislation, child protection practice and society have changed over time. It has been argued that these changes mean that the Hearings System has become more complex and with it the work of those organisations involved in it (Scottish Executive, 2006; Scottish Children’s Reporter Administration, 2017a). But, there is little evidence on the impact of these changes to the complexity of the lives looked after children and their families. The objective of this research was to develop clear definitions of complexity in child protection, and to operationalise (i.e. construct a way of measuring) these to provide insights into both current levels of complexity, and whether these levels are changing over time. To our knowledge, this is the first research to do so. This report focuses upon the complexity of looked after children’s lives and their families; and the complexity of legislative and organisational processes, including inter-agency working. 1.1. Defining complexity We might say that the term ‘complexity’ is itself complex. In particular, the words ‘complex’ and ‘complicated’ are often used interchangeably (Holland, 2014) to describe objects with many interconnected parts. What differentiates a complex system from a merely complicated one is the property of emergence. Complex systems have properties which emerge from interactions between the elements of the system, rather than being a consequence of the additive effects of those elements (Holland, 2014). The basic idea here is that ‘the whole is more than the sum of the parts’. An example of this comes from Darlington et al.’s (2004) study of inter-agency working and social complexity. They found that professionals working across agencies experienced a range of problems around communication and information-sharing; role clarity; competing primary focus;
8
competing definitions of problem; and differing access to resources. A key component of these problems is the contrasting ways in which agencies understand and approach the problem. By working together, social complexity is greatly elevated, since all parties must grapple with the interpretations, assumptions and priorities of one another in relation to their own positions. 1.2. Types of complexity in child protection There are many sources of complexity in the realm of child protection. Variables such as family life, changes in children’s lives, and organisational and legal systems that seek to protect children are individually and collectively complex. Family life Firstly, family life has changed in the West in recent years, with increases in rates of cohabitation and fertility without marriage; age at marriage; divorce rate; re-partnering rate; multiple-partner fertility; half and step siblings; and single parent families (Manning et al., 2014). There is evidence that children who come into contact with child protection are particularly likely to be based in families characterised by complexity. A Scottish Children’s Reporter Administration (SCRA) study found that only 21% of children referred to the Children’s Reporter were living with both birth parents (Gault, 2003; cited in Scottish Executive, 2006). Most families involved with social work are complex, unconventional networks built up through multiple partnering, leading to complicated negotiations about roles which conventional families would often take for granted (Saltiel, 2013). Non-traditional family arrangements can create relational complexities for children. For instance, parental contact with children in kinship care can be difficult, linked with complex intergenerational family dynamics (Kiraly & Humphreys, 2015). Parental conflict can entail conflicting interpretations and accounts of events, contributing to social complexity (Saltiel, 2013). Change over time Another kind of complexity in the realm of child protection concerns change over time. Looked after children experience high levels of residential change (O’Connor et al., 2014). Their study found that substance abuse and/or domestic violence could lead to residential complexity. For instance one mother described how she went to a women’s refuge 35 times before her child was 10 years old. Moves arose for various reasons, including becoming homeless, fleeing drug dealers, new relationships, spells in foster care or kinship care. There were also frequent changes of co-residents, main carers, residence with siblings, schools, and local support networks. This type of complexity does not impact substantially upon all looked after children however; Bentley et al. (2016) found that the proportion of looked after children in Scotland with three or more placements in a year was around 6%, which is lower than the rest of the UK. In addition to having complex families and (for some) multiple changes, looked after children often have parents with multiple problems, also described in the literature as complex. These difficulties included substance misuse; mental health problems; domestic abuse; learning disabilities; financial problems, and low education, and often these endure for many years (Ball, 2014; Coates & Howe, 2015; Devaney, 2008; O’Connor et al., 2014). Children may also experience complicating difficulties such as neonatal abstinence syndrome, prematurity, learning disabilities, physical disabilities. The more of such problems, the more likely that children are maltreated (Dodd et al., 2015).
9
These problems may tend to co-occur in particular ways, leading to abuse typologies, or ‘profiles’ of abuse types (Armour et al., 2014). Moreover, problems may have not only a cumulative but also an interactive effect (Anda et al., 2006; cited in Devaney, 2008). Other studies show that child maltreatment correlates with other indicators of social distress, for example infant mortality, juvenile delinquency, violent crime, poverty and drug trafficking (Coulton et al., 1995; cited in Coulton et al., 1999; Kazdin & Whitley, 2006; Wood et al., 2012 cited in Lansford & Deater-Deckard, 2015). For instance, in the USA between 2000 and 2009, rates of child abuse requiring hospital admission and of traumatic brain injury increased in tandem with 90-day mortgage delinquency rates (Wood et al., 2012 cited in Lansford & Deater-Deckard, 2015). Organisational and legislative complexity Moving from children to the professional organisations who seek to help them, several researchers have suggested that child protection, social work practice, and the families they work with are complex systems (Glenmaye et al., 2004; Stevens & Cox, 2008). Commentators have also argued that complexity exists in legislation and government guidance (Daniel, 2015; Parton, 2011) and in professional practice and structures in child protection (Daniel, 2015; GlenMaye et al., 2004; Lindahl & Hunt, 2016 on the USA; Robb, 2014), including inter-agency working (Darlington et al., 2004; Hood, 2014, 2015) and social care more generally (Mitchell, 2011). Complexity as interactions of variables in child protection A feature of complex systems is that the effect of one event within or input into the system will vary, depending on the state of the system at that time. In an influential review of the field, Belsky (1993) argued that child maltreatment arises from transactional processes involving parent, child, community, cultural context and even evolutionarily specified tendencies, such that most if not all factors influencing maltreatment operate in interaction with other factors:
‘Because there is no single cause of the physical abuse and neglect of children, and because these forms of maltreatment arise as a result of a transactional process involving characteristics of parents, children, and the multiple contexts in which they are embedded, the search for "main effects" invariably yields sporadic findings. Under some conditions, for example, a parent's youth will contribute to her dysfunctional parenting; under other conditions it will not. As Bronfenbrenner (1979) so astutely noted, in the ecology of human development—and thus in the etiology of child maltreatment—"the principal main effects are likely to be interactions" (p. 38).’ (Belsky, 1993, p.414)
Belsky suggests that child maltreatment is likely to arise from the interaction of variables in complicated (if not complex) systems. Indeed, numerous studies have found evidence of interactions between variables:
Zuravin (1989b cited in Belsky, 1993) found that parental depression predicted both abuse and neglect. Mason et al. (2016) found that parents’ relationships with their teenage children predicted substance use by their teens, but only in high risk environments. Tucker & Rodriguez (2014) found that social isolation mediated the relationship between stress and abuse risk. Coulton’s et al. (1999) study of neighbourhood and family-level predictors of child maltreatment found that violence in a parent’s family of origin was significantly associated with the parent’s potential to maltreat their own child. They found that this effect

10
interacted with impoverishment in the neighbourhood in which the family resided. Violence in family of origin predicted potential to maltreat much more strongly in relatively wealthy neighbourhoods than in neighbourhoods which were more impoverished. This interaction between neighbourhood impoverishment and parental history meant that violence in parent’s family of origin impacted differently (but still systematically) upon different family systems. Swanson et al. (1990; cited in Chaffin, Kelleher & Hollenberg, 1996) found that associations between many psychiatric disorders (especially anxiety disorders) and interpersonal violence was mediated by substance misuse, such that anxiety disorders were not associated with violence unless substance misuse was also present.
Measuring complexity The examples above demonstrate the classic feature of complicated systems, that the effect of an input on a system varies depending on the state of the other elements in the system. This is a first step towards a complex system—the more interconnections there are, the greater the chance that the system is, in fact, complex as well as complicated (Holland, 2014). In this research we sought as far as possible to define complexity in terms of interconnectedness. This definition of complexity has the advantage of being quantifiable, but the task of identifying all the interconnections that exist in a system is an extremely challenging one. Social scientists who use statistical tools to identify causal relationships in human systems recognise that they cannot (yet) identify and/or measure all the interconnections operating within such systems, and thus that their theories cannot account for all the variability in any given system output (e.g. extent of child maltreatment)—although such models can account for substantial amounts of variation (Winter, n.d.). In the current research we cannot hope to uncover all the interconnections operating in the extensive domain of child protection, and therefore cannot provide a complete measure of complexity as interconnection. Therefore we will (where necessary) measure complexity using volume as a proxy. Volume tends to imply complexity, in that the more elements there are within a system, the more possible interconnections there are. This is particularly likely for social complexity; since people are relational by nature, taking one another into account in various ways (e.g. facilitating; opposing; avoiding). Nevertheless, there may be occasions when it is not appropriate to infer from volume to complexity. For instance, if a Children’s Reporter is assigned a larger number of cases, his/her workload is likely to increase but not necessarily the complexity of the work, since cases will not usually interact directly with one another (except for sibling groups—which are of course common). 1.3. Implications of complexity in legislation and practice Increasing complexity in legislation and/or practice, defined as interconnection, has a range of likely implications. We would expect that typically, the more complicated or complex the system:
the more that interconnections in the system influence one another the harder it is to gain all requisite knowledge about the system the harder it is to understand the system the harder it is to predict the effect of a specific action on the system the easier it is to make mistakes in dealing with the system the more time consuming it is to complete an action involving the system.
11
In general, then, there is reason to believe that increased complexity, whether that be in children’s lives, legislation and/or professional practice, makes the work of SCRA and its partner organisations more difficult and time-consuming. However, this is not inevitably the case. Legislation and professional practice needs to be complex enough to be able to address the complexity of the lives of children and their families. For instance, legislation that does not differentiate sufficiently between distinct types of child maltreatment (i.e. the legal system contains fewer elements than are meaningful ‘on the ground’) may create difficulties for professional practice. As another example, a case conference which includes a representative from education would in some ways be more complex than one without, but if the issue being discussed concerns education (e.g. school refusal), then this additional complexity would be crucial in ensuring a clear understanding of the child’s problems. 1.4. This study This research was carried out to address the question of whether looked after children’s lives and child protection more generally are becoming more complicated over time (as has been suggested by SCRA (2017a) and others) and to clarify the specific areas in which complexity has changed. Our research incorporates three domains of relevance to SCRA: the complexity of children’s lives; legislation; and organisational practice. It is hoped that this research will provide a useful perspective on complexity in child protection in Scotland, that it will be valuable for understanding children’s lives, and for ensuring that Children’s Reporters are well positioned to manage the complexity inherent in their role.
12
2. Societal context - national trends Four domains which can contribute to the complexity of family life in Scotland are outlined in this section, with evidence reviewed as to changes in prevalence in recent years: ethnic minority status, substance misuse, poverty and crime. Ethnicity Possible complicating factors: language problems, need for translator, marginalised communities, culture specific parenting (Henderson et al., 2017). Unfortunately, the 2001 census does not differentiate in any way between different white ethnic groups, whereas the 2011 census does. Therefore we can gain only an approximate sense of how ethnic minority status has changed for Scottish children over the last 15 years or so. This is particularly problematic because it cannot detect the substantial influx of white eastern Europeans, particularly Polish, to Scotland in recent years. Therefore it represents an underestimate of the ethnic minority population, probably particularly in 2001. Number (and percentage) of children aged under 16 years in Scotland who were identified as an ethnicity other than ‘white’:
2001: 29,407 (3.0%) 2011: 53,326 (5.8%)
Note that the 2011 census is detailed enough to indicate that among all those classified as ‘White’, 28,857 are in non-British categories (mostly ‘White: Polish’ and ‘White: Other White’). This is 3.3% of the total white population, and 3.1% of the total child population in Scotland. Country of origin Number (and percentage) of children aged under 16 years in Scotland who were born outside of the UK:
2001: 19,704 (2.0%) 2011: 34,458 (3.8%)
Drug and alcohol abuse Scotland faces a drug problem that may be more serious, and on a more problematic trajectory, than that of the rest of Britain. In 2009-10, the Scottish Government (2011) estimated that there were 59,600 problem drug users (comprising users of opioids, including methadone, and/or benzodiazepines). This represents a rate of 17.15 per 1,000 population aged 15 to 64, which is much higher than those of England (8.40) and Wales (9.08) (Burton et al., 2014). However, definitions of problem drug use vary, with England and Wales focusing on opioids and cocaine, and Scotland on opioids and benzodiazepines (Burton et al., 2014). If the latter is more widely abused than cocaine, then the prevalence difference between the countries of the UK may result (at least partially) from contrasting definitions. In terms of trajectory over time, Scottish Government estimates since 2000 suggest that the number of problem drug users in Scotland has increased substantially, particularly from 2003 (estimated number of 51,582) to 2009-10 (estimated at 59,600) (Scottish Government, 2011). This
13
contrasts with the modest but steady decline in the estimated number of high risk drug users in Britain overall, at least from 2007 onwards (Burton et al., 2014). There has been a worrying increase in the number of drug-related deaths in Scotland. There were 421 drug related deaths in Scotland in 2006 (Johnson, 2015), and in 2016 this had risen to 867 drug-related deaths. This makes Scotland’s drug-death rate higher than those reported in all other EU countries (National Records of Scotland, 2017) and also considerably higher than elsewhere in the UK. In 2016, there were 3,744 drug-related deaths in England and Wales combined (Office for National Statistics, 2017); yet the population of England & Wales is ten times that of Scotland (Office for National Statistics, 2016). Poverty In the ten years to 2011-12, the proportion of children in poverty in Scotland fell ten percentage points on both the ‘before’ and ‘after’ housing costs measures, to 17% before, and 22% after housing costs. However, the poverty rate for children whose parent(s) are out of work remains high (at 54%) (Aldridge & Kenway, 2014). More recently, relative childhood poverty has continued to fall into 2013-14, reaching the lowest levels since the data collection series started in 1994. However, this improvement flattens out once housing costs are taken into account, and material deprivation actually increased (Scottish Government, n.d.). After taking account of housing costs, Scotland has the lowest child poverty rate of any part of the UK. For instance, the figures for Scotland and England in the three years ending 2013-14 were 24% and 31% respectively (Social Mobility & Child Poverty Commission, 2015). Income inequality in Scotland remained at similar levels from 1998-99 to 2013-14 (Scottish Government, n.d.). Crime There is evidence that over the last 20 years in Scotland, crime in general, and male youth crime in particular, has, overall, reduced substantially (Matthews, 2014). This decrease is particularly apparent from 2006 onwards, and in 2015-16 was at the lowest level since 1974 (Scottish Government, 2016a). However, some types of crime have increased. The number of ‘Other sexual crimes’ recorded by the police has increased by 50% between 2013-14 and 2016-17 and is now the largest category of sexual crimes. The growth in ‘Other sexual crimes’ has been driven by increases in cyber enabled crimes1 which now account for more than half of ‘Other sexual crimes’ and 20% of all sexual crimes. The median age of victims of cyber enabled crime is 14 years (Scottish Government, 2017).
1 Cyber enabled crimes are those where the internet has been used to commit the crime, and include crimes such as ‘Communicating indecently’ and ‘Cause to view sexual activity or images’.
14
3. Measuring changes in the complexity of looked after
children’s lives
3.1 Methodology
The children’s lives measurement developed and used in this research drew on Calder et al.’s (2012) National Risk Framework, and Manning et al.’s (2014) study of family complexity. The research team proposed additional variables based on their experiences of working with case files in previous research. Coding took place by researchers sifting through case files on SCRA’s Case Management System (CMS) or in paper files. Variables measured from case files were as follows: categorical data were measured as present or absent, where absent meant either specified in the paper files as not present, or simply not mentioned in the files; continuous data were measured as the number of the variable concerned.
Research variables: Family composition (categorical variables): one parent household; residence with extended
family without parents; residence without extended family or parents; non-residential contact with mother; non-residential contact with father; no contact with mother; no contact with father (this and all previous for minimum of one month duration); supervised contact with parent; permanence plans; legal step parent.
Family composition (continuous variables): total number of half siblings; step siblings; full siblings; full, half or step siblings in different residence for minimum of one month; number of non-sibling children with whom child resides for minimum of one month; maximum number of concurrent places of residence.
Changes experienced by child (continuous variables): Number of different places of residence lasting minimum one month; number of changes in child's co-residents lasting minimum one month; number of bereavements; number of times social worker / key worker changed; number of times a CSO was changed (including 'continued and varied' and 'terminated').
Problems faced by child (categorical variables): born with substance withdrawal; premature birth or low birth weight; developmental delay; mental health difficulties; learning disabilities; behavioural difficulties; physical disability or significant physical illness; failure to thrive; beyond parental control; chaotic setting or lack of routine; first language not English; physical abuse; emotional abuse; sexual abuse; neglect.
Problems faced by parent (categorical variables): victim of violence from partner; perpetrator of violence to partner; victim of emotional or verbal abuse from partner; perpetrator of emotional or verbal abuse to partner; in conflict / volatile relationship; parental separation; victim of non-domestic violence / abuse; perpetrator of non-domestic violence / abuse; alcohol abuse; drug abuse; charged with an offence; breached legal order / agreement; imprisonment; mental health difficulties; learning disabilities; relationships with inappropriate people; refugees / asylum seekers / awaiting deportation; limited or no grasp of English language; abuse and/or social service involvement in childhood; bereavement; unemployment; isolation; already known to services; problems in extended family; financial problems; physical health problems.
15
Accommodation problems experienced by child (categorical variables): dirty / cold / unsafe accommodation; homelessness; problems in community.
Sample A total of 240 children from different families, who were placed on a CSO2 on or prior to their third birthday, were selected randomly from six local authority areas: Aberdeen City, Aberdeenshire, Dundee, Edinburgh, North Lanarkshire and South Lanarkshire. We sought to draw 10 boys and 10 girls from each area who were born between April 2003 and January 2004 (inclusive) – Time 1 (T1); and another ten boys and ten girls from each of these areas born between April 2013 and January 2014 (inclusive) – Time 2 (T2). In some cases, there were fewer than 10 girls and/or boys for specific areas and time points, in which case additional gender-matched cases were randomly selected from other areas included in the study. Ideally, T1 would have been at an earlier point of time than 2003-04. However this was not possible, because data were only available for children who had not yet reached 18 years of age, and because RAD3 data (which were needed for one part of this study) were only available from 2003. The geographical areas were selected to represent Scotland’s diversity (with areas in north, mid and south Scotland; east and west; urban and rural), and to ensure that data collection was practical (T1 data was retrieved from paper files stored in different areas of Scotland.) There were a number of missing cases at T1, and one further case was removed because it was a sibling of another child in the sample. Three cases at T2 had to be removed because incomplete data were available. Therefore the final sample comprised 110 children at T1 (55 girls, 55 boys), and 117 at T2 (58 girls, 59 boys). Procedure The files used included statutory documentation and (particularly) social work reports, among others. All three researchers coded two cases, and then met to discuss disagreements. This led to a number of refinements to the variables and coding instructions, to ensure greater clarity and consistency. Once the final variables and coding instructions were agreed, the three researchers each coded a portion of cases from T1 and T2. For all variables, the only data which were used concerned events that happened during the first three years of the child’s life (or as much of those three years for which data were available). For instance, if social work reports mention that a parent formerly abused drugs but had ceased to do so by the time the child was born, and did not relapse in the first three years of the child’s life, the ‘parental drug abuse’ variable would be recorded as absent. Similarly, siblings whose lives overlapped with the child’s first three years would be included; i.e. all siblings born before the child turned three (including before child was born), but not a sibling born after the child turned three. (If a child had a sibling who died before the child was born, that sibling was not included in counts.) The only exception was the variable pertaining to whether the parent reported, or was known to have experienced abuse or social services involvement themselves as a child or young person. Because of timing of review Hearings, a very small number of T2 cases were missing the final months of social work and health reports data. The maximum amount of time missed was four months. Also, in some cases, a child’s CSO was terminated before the age of three years, with no
2 Both children looked after at home and looked after and accommodated
3 RAD – Referrals Administration Database. SCRA’s historic case management system which was replaced by the
current CMS in 2012-13.
16
further data available (for instance, if child was adopted). In these cases, all available data were coded. Inter-rater reliability Four cases were blind coded by two researchers for the purpose of calculating inter-rater reliability. Variables were grouped and inter-rater reliability was calculated for each group. Reliability was calculated at the group level because: 1. there was insufficient time to second code the number of cases that would be necessary to calculate reliability per item; and 2. it was planned that most statistical analyses of the data would be conducted at the group level (e.g. total number of problems faced by parents). The disadvantage of this approach is that while inter-rater reliability across the group may be high, it remains possible that it could be low for specific variables. For the categorical variables, Cohen’s kappa was calculated. There was a good level of inter-rater agreement for family complexity (categorical items) (kappa = .792), child problems (kappa = .702), parental problems (kappa = .681) and accommodation problems (kappa = .750). For the continuous variables, one-way random intra-class correlation coefficients were calculated (as raters varied). For family composition, the average measure was .901 (95% CI .774 to .957). For number of changes, the average measure was .923 (95% CI .809 to .969). In both cases, therefore, there was a very high level of agreement between first and second raters.
Confidentiality Unique linkage identifiers for cases in the sample were used for the purpose of data collection, and these were destroyed when this was complete. No identifiers (names, dates of birth, post codes, etc.) were collected and used in any data analysis or reporting. Numbers less than five are suppressed in reporting. Data were collated in MS EXCEL and analysed using SPSS. SCRA’s is part of the Scottish Government’s IT network which is a secure system. All data collected and analysed was held in a folder to which only the research team have access, and on encrypted devices. The researchers are all PVG Scheme members in respect of regulated work with children4, and have all been trained on the Data Protection Act 1998. Important point to make on limitations: Note that the current study is cross-sectional in design and therefore cannot demonstrate causality. This is true of many studies in the field (Chaffin et al., 1996). Another limitation of the current study is that it is reliant on official reports, which may be biased, and which do not necessarily use clearly operationalized definitions of variables (Chaffin et al., 1996; see also Belsky, 1993, for more on limitations of studies in this field). 3.2. Analysis of differences in complexity in looked after children’s lives between T1 (children born between April 2003 and January 2004) and T2 (children born between April 2013 and January 2014) Inferential statistics were conducted to assess whether there were significant differences between T1 and T2 data in various measures of complexity in looked after children’s lives. These inferential
4 Section 52 of the Protection of Vulnerable Groups (Scotland) Act 2007

17
statistics enable us to assess how likely it is that any differences which exist in our sample, also exist in the whole population of looked after children. This is essential to reduce the risk of making a Type 1 error; this is when we interpret a difference within our sample as showing a difference in the whole population, whereas it actually arose merely as a result of the sampling process.
Information on the measures of types of complexity used in this study The following variables were measured:
Family complexity: Variables were number of siblings (full and half); whether sibling group was split between residences; whether child resided without either parent; and whether parents separated. Scores for the latter three variables (i.e. excluding number of siblings) were combined into a total family fragmentation score (minimum 0, maximum 3).
Context: SIMD at birth (quintile ranging from 1 [most deprived] to 20 [most affluent]; whether there were problems in extended family; whether there were problems in community.
Instability (child): number of places of residence; number of concurrent residences; number of changes of key worker; number of changes of CSO.
Interagency: number of organisations involved with family; presence of legal representatives at grounds Hearing; number of relevant persons.
Two continuous numerical variables represented the total number of problems ‘present’, as follows:
Number of child problems: number of the following problems experienced by that child during the first three years of their life: substance withdrawal; premature / low birth weight; developmental delay; mental health problems; learning difficulties; physical health; failure to thrive; beyond parental control. Maximum score = 8.
Number of parent problems: number of the following problems experienced by one or both of child’s parents during first three years of child’s life: victim of harm (from partner and/or another person outside home); perpetrator of harm (to partner or another person outwith home but not to child); alcohol abuse; drug abuse; offence; imprisonment; breach of legal order; mental health problems; learning difficulties; inappropriate relationships; refugee / asylum seeker / awaiting deportation; lacks English; problems in own childhood; bereavement; unemployment; financial problems; physical health problems; parental conflict / volatility. Maximum score = 18.
Appendix 1 provides numbers (and percentages) of each child and parent problem at T1 and T2.
Categorical data (e.g. yes / no) and data with only a narrow range of numerical values are analysed using non-parametric tests such as Chi-Squared. Continuous numerical data with a good range is analysed with more powerful parametric t tests5. Results of t tests and Chi-Square tests, as well as descriptive data on T1 and T2, are detailed in Tables 1, 2 and 3.
5 T test assumptions
1. No outliers: The boxplot method was used to identify outliers, and repeated until no outliers remained. There were 5 outliers for total number of siblings; 5 for total family fragmentation score; 3 for SIMD at birth; 8 for number of places of residence; 3 for number of changes of co-residents; 0 for number of parental problems; 1 for number of organisations; 0 for number of CSO changes. T tests were conducted with and without outliers. In all cases, results were very similar, so analyses including outliers are reported here. 2. Normal distribution: A Q-Q plot was used to assess normality. Total number of siblings, number of parental problems and number of CSOs were normally distributed at both time points. Total family fragmentation was slightly positively skewed at T1

18
3.3. Findings - differences in the complexity in looked after children’s lives over time Complexity in the lives of children aged under three years born between April 2003 and January 2004 (T1) and between April 2013 and January 2014 (T2) were measured and compared. This section describes those aspects of complexity that 1. increased between T1 and T2; 2. those that decreased; and 3. those where there was no change. 1. Increased complexity T2 was significantly more complex than T1 with respect to:
Family fragmentation: Number of children residing separately from siblings (a) Family fragmentation: Child not living with either parent (b) Overall family fragmentation score (a+b (above) + c (parental separation)) Residence with child who is not a sibling Number of changes in CSO (including ‘terminated’ and ‘continued and varied’) Number of problems faced by parents Presence of legal representation in Hearings Number of relevant persons
These findings are summarised in Figure 1 and provided in detail in Table 1. Figure 1 shows the changes in terms of percentage increases of means at T1 and T2 in the first three years of the children’s lives on: the number of relevant persons, the presence of legal representatives at grounds Hearings: number of changes of CSOs; number of parent problems; and overall family fragmentation. Figure 1. Summary - % increases in complexity in looked after children’s lives between T1 and T2
only, and number of co-residents was slightly positively skewed at T2 only. SIMD at birth showed slight negative kurtosis at both time points. Number of places of residence and number of organisations were slightly positively skewed at both time points. In all cases deviations from normality were minor, hence the t test, which is robust to such minor deviations, was retained. 3. Equality of variance: This assumption was tested using Levene’s statistic. The variance at T1 and T2 was not significantly different for any of the variables analysed by t test.
0% 10% 20% 30% 40% 50% 60%
Family fragmentation
Parent problems
Changes in CSOs
Presence of legal representation
Number of relevant persons

19
Table 1. Increases in complexity in looked after children’s lives between T1 (children born between April 2003 and January 2004) and T2 (children born between April 2013 and January 2014)
Type of complexity
Measure T1 mean & (SD) OR percentage
T2 mean & (SD) OR percentage
Stat result (with 2 tailed p value)
Significance 95% CIs of difference
Family Family fragmentation (a): sibling group split between residences
55% of sample split from 1+ sibling
69% of sample split from 1+ sibling
χ2 (1) = 4.594, p = .040
*
Family fragmentation (b): child not living with either parent
71% 86% χ2 (1) = 8.080, p = .008
**
Total family fragmentation score (a+b+c)*
2.74 (3.38) 3.38 (1.99) T(225)=2.519, p=.012
* 0.14 to 1.14
Residence with child who is not sibling
17.3% 29.1% χ2 (1) = 4.401, p = .036
*
Instability Number of changes of CSO
1.35 (1.26) 2.06 (1.27) T(225) = 4.256, p < .001
*** 0.38 to 1.05
Parent problems
Number of parent problems /18
7.22 (2.91) 8.36 (3.03) T(213) = 2.796, p = .003
** 0.47 to 1.96
Inter-agency
Presence of legal reps
6.4% 32.5% χ2 (1) = 24.328, p<.001
***
Number of relevant persons
Mean rank 95.91 Mean average 2.06 (1.00)
Mean rank 115.91 Mean average 2.30 (.82)
U(211) = 6,624, p = .0106
*
Significance is recorded as: NS indicates not significant at 5% level; * p <.05; ** p<.01; *** p<.001. 95% CIs (confidence intervals) are only reported for t tests which found a significant difference. *Family Fragmentation (c) parental separation – see Table 3.
The data are now discussed further to try to explain why these increases in complexity have occurred. Family fragmentation changes could arise from shifts in family life, or from shifts in child protection practice. There has been a significant increase from T1 to T2 in the number of children removed
6 A Mann-Whitney non-parametric test was used here because there was a large number of outliers at T1. We only
included cases in which one or more relevant person was on record.
20
from parental care by the age of 3 years (χ2(1)=19.722, p<.001). Taking only those children in the sample who did not spend time in foster or adoptive care, there is no significant difference between T1 and T2 in family fragmentation (t(116)=1.337, p=.184). There is also no significant difference in parental separation between T1 and T2. These findings together would imply that it is child protection practice that has been the main influence on the increase in family fragmentation.
Changes in CSO: We suspected that this change could follow from the significant increase from T1 to T2 in the amount of permanence planning by age of three years (i.e. 40.9% in T1 to 61.5% in T2, χ2(1)=9.660, p=.002). We also considered that supervised parental contact might be related to increased CSO changes, since changes could take the form of alterations to contact conditions. There were indeed significantly more CSO changes for those children who had permanence planning in place by age 3 (Mann-Whitney U(227)=9,986.5, p<.001). Mean rank for children without permanence planning was 81.71, while for those with permanence planning it was 144.35. There were also significantly more CSO changes for children who had supervised contact with one or both parents (Mann-Whitney U(227)=7,048, p<.001). Mean ranks were 61.54 and 128.82 for cases without and with supervised contact respectively. A linear regression found that while both permanence planning (p<.001) and supervised contact (p=.001) contributed significantly to the number of CSO changes in a case, so did time period (p=.012), yielding a model that predicted 28.4% of the variance in CSO change scores ( F(3, 223) = 30.842, p < .001, adjusted R2 = .284). In other words, the increase over time in the number of CSO changes is not only because of changes in that period in permanence planning and supervised contact.
Number of problems faced by parents: This is interesting and supports SCRA’s argument that family complexity is increasing. A series of χ2 analyses were conducted on each individual problem category to explore which problems are becoming more frequent. Because of making multiple comparisons, a Bonferroni correction was applied which rendered the p value required for significance as .003. Only one problem was significant at this stringent level: breaching a legal agreement (χ2 (1) = 10.856, p = .001). One other problem approached significance: committing an offence ( χ2 (1) = 7.273, p = .007). In both cases, rates were higher at T2 than T1. Note that the overall difference in problem frequency between T1 and T2 was likely the result of a combination of many more than just these two problems, as almost all parent problems were more frequent at T2 than T1, just not enough so to reach significance at this stringent level; see ‘parent problems’ in Appendix 1. The only problems which were slightly less frequent at T2 than T1 were: lacks English; unemployment; financial difficulties; and physical health problems (differences not significant)7.
Frequencies of many individual parental problems were high at both time points, suggesting a stable population of high risk parents with multiple serious problems. Parents averaged seven (T1) or eight (T2) serious difficulties over the first three years of their child’s life. The following problems were experienced by one or more parent of more than half of the children in the dataset (combining T1 and T2): parent was a victim of abuse; parent was a perpetrator of abuse; drug
7 Note that the alternative explanation for the difference between T1 and T2 here is that social workers may have come to record these problems more regularly than previously; i.e. it could be an artefact of changes in recording practices, rather than reflecting genuine changes in parent problems.
21
abuse; committed an offence; mental illness; inappropriate relationships; parent had difficult childhood; unemployment; and parents in conflictual and volatile relationship (Appendix 1).
Presence of legal representatives: The significantly increased presence of legal representatives at Hearings held to consider established or accepted grounds at which a substantive decision was made8 is perhaps not surprising after the introduction of provision of legal aid for relevant persons and children by the 2011 Act. It may also be a consequence of the increasing complexity of cases. In T2, 32.5% of such Hearings were attended by a legal representative and in T1 it was 6.4%9. There is also considerable variation between local authorities in the prevalence of legal representatives at Hearings, in T2 this ranged from none in Aberdeen City (in the sample) to 54.2% in Dundee. The number of relevant persons for children born in 2013 was significantly higher than for those born in 2003. The mean rank for number of relevant persons in T1 was 95.91 and in T2 it was 115.91. Again this increase may not be surprising as the 2011 Act introduced a procedure where a person who does not have parental responsibilities for a child10 may be deemed a relevant person and therefore have the duty and right to attend and participate in Hearings.
2. Decreased complexity
T1 was significantly more complex than T2 with respect to: SIMD at birth (i.e. mean SIMD of child’s first residence after birth was lower at T1 than T2) Number of changes of co-residents experienced by child (Table 2).
Table 2. Decreased complexity
Type of complexity
Measure T1 mean & (SD)
T2 mean & (SD)
Stat result (with 2 tailed p value)
Significance 95% CIs of difference
Context SIMD11 at birth
4.77 (4.90) 6.18 (5.37) T(225) = 2.058, p = .040
* -0.05 to -2.75
Instability Number of changes in co-residents
2.74 (1.75) 2.16 (1.65) T(225) = 2.548, p = .011
* -.13 to -1.01
Significance is recorded as: NS indicates not significant at 5% level; * p <.05; ** p<.01; *** p<.001. 95% CIs (confidence intervals) are only reported for t tests which found a significant difference.
We suggest the following explanations for these decreases in complexity. The SIMD finding likely results from an increase over time in the number of children who went directly from hospital after birth into foster care, since foster carers in the sample lived in areas of significantly higher SIMD than did birth parents (t(57.848)=4.486, p<.001). The type of first
8 This specific type of Hearing was used as it is the Hearing that first made the CSO, and using only one type of Hearing
allowed consistency in data collection and enabled comparison. 9 it is important to note that in some cases, a legal representative may have become involved later in the process, e.g.
to represent parents during appeals, but this was not recorded in this research. 10
As defined by s200 of the 2011 Act 11
SIMD – Scottish Index of Multiple Deprivation http://simd.scot/2016/#/simd2016/BTTTTTT/14/-3.5757/55.9803/
22
residence of children after birth has significantly changed from T1 to T2 ( χ2(1)=19.722, p<.001); at T1, 91% of children were with their parent(s) from birth, while this reduced to 67% by T2. Taking only those children whose first place of residence was with their parent(s), there was no significant difference in SIMD between T1 and T2 (t(176)=.457, p=.649).
The finding that number of changes of co-residents decreased from T1 to T2 is also likely to be an artefact of the increased practice of placing children with foster carers from birth; many of these children never lived with their parents. To test for this, the analysis was repeated including only those children who were not placed with foster carers at birth. This analysis did not find a significant difference between the two time periods (t(180)=.832, p=.407) thus supporting our explanation.
3. No change in complexity
There was no significant difference between T1 and T2 with respect to: Sibling group size Rates of parental separation Rates of problems in extended family Rates of problems for family in community Number of places of residence Number of concurrent residences Number of changes of key worker Number of child problems Number of organisations working with family (Table 3)
However, many of these measures of complexity are consistently at high levels at both time points; e.g. across the whole sample, over 40% of cases included problems in the community and extended family, and over 70% of parents separated in the first three years of their child’s life (and furthermore, some were never in a relationship, so the number of children reared by two parents in partnership is lower than this figure suggests).

23
Table 3. No change in complexity
Type of complexity
Measure T1 mean & (SD) OR percentage
T2 mean & (SD) OR percentage
Stat result (with 2 tailed p value)
Significance
Family Number of siblings (full & half)
M=2.04 (1.95) M=2.35 (1.83) T(225)=1.251, p=.212
NS
Family fragmentation (c): parental separation
74% 73% χ2 (1) = .867, p = .868
NS
Context Problems in extended family
44% 46% χ2 (1) = .102, p = .750
NS
Problems in community
46% 37% χ2 (1) = 2.159, p = .142
NS
Instability Number of places of residence
2.91 (1.44) 2.74 (1.25) T(225) = .973, p = .331
NS
Number of concurrent residences
1=73.4% 2=24.8% 3=1.8%
1=76.9% 2=22.2% 3=0.9%
χ2 (1) = .658, exact p = .686
NS
Number of changes of key worker
0=40.9% 1=38.2% 2=16.4% 3=4.5%
0=36.8% 1=43.6% 2=14.5% 3=5.1%
χ2 (1) =.821, p = .844
NS
Child problems
Number of child problems /8
0=45.5% 1=26.4% 2=18.2% 3+=10.0%
0=48.3% 1=31.9% 2=10.3% 3+=9.5%
χ2 (1) = 3.152, p=.369
NS
Inter-agency
Number of organisations involved with family
9.25 (2.65) 9.38 (3.03) T(223) = .331, p = .371
Significance is recorded as: NS indicates not significant at 5% level; * p <.05; ** p<.01; *** p<.001.
The results do not support the argument that inter-agency complexity has increased over the time-frame we have been able to study (except with respect to involvement from the legal profession in Hearings).
24
4. Legal complexity and the operation of the Children’s
Hearings System This chapter compares changes in legislation and associated SCRA practice over two time points 19 years apart; and changes in the Hearings System in terms of patterns of referrals and frequencies of major complex Hearings-related events. This is to assess the extent to which legislative change has affected the practice of Reporters and the operation of the Hearings System.
4.1. Measuring changes in legal complexity and the operation of the Hearings System
Legislation that is pertinent to the Hearings System is compared at two time points: 1. start of 1998 and 2. start of 2017. Rationale: SCRA was established in 1996.
Between 1998 and 2017 there were a number of significant changes, such as: the enactment of
The Scotland Act 1998 which led to the establishment of Scottish Parliament in 1999 (before
that all Scottish legislation went through the UK Parliament); Human Rights Act 1998, which has
had a big impact (every subsequent piece of legislation has had to be drafted in line with the
Human Rights Act); Children’s Hearings (Scotland) Act 2011 (introduced major changes to the
Hearings System); and Children and Young People (Scotland) Act 2014 (although not as yet the
Named Person provision).
The following approach used to assess changes in complexity of legislation and practice: Comparison of the extent of significant legislation in place relevant to SCRA’s work at 1998
and at 2017. Comparison of the Children (Scotland) Act 1995 (the 1995 Act) and the Children’s Hearings
(Scotland) Act 2011 (the 2011 Act). Comparison of SCRA Practice Direction in place at 1998 and at 2017. Trends in the frequency of major complex events related to Children’s Hearings from 1976
to 2015-16 using statistical data produced by the Scottish Office and SCRA. This longer period allowed comparison of the Hearings System before and after 1998.
4.2. The changing legislative landscape
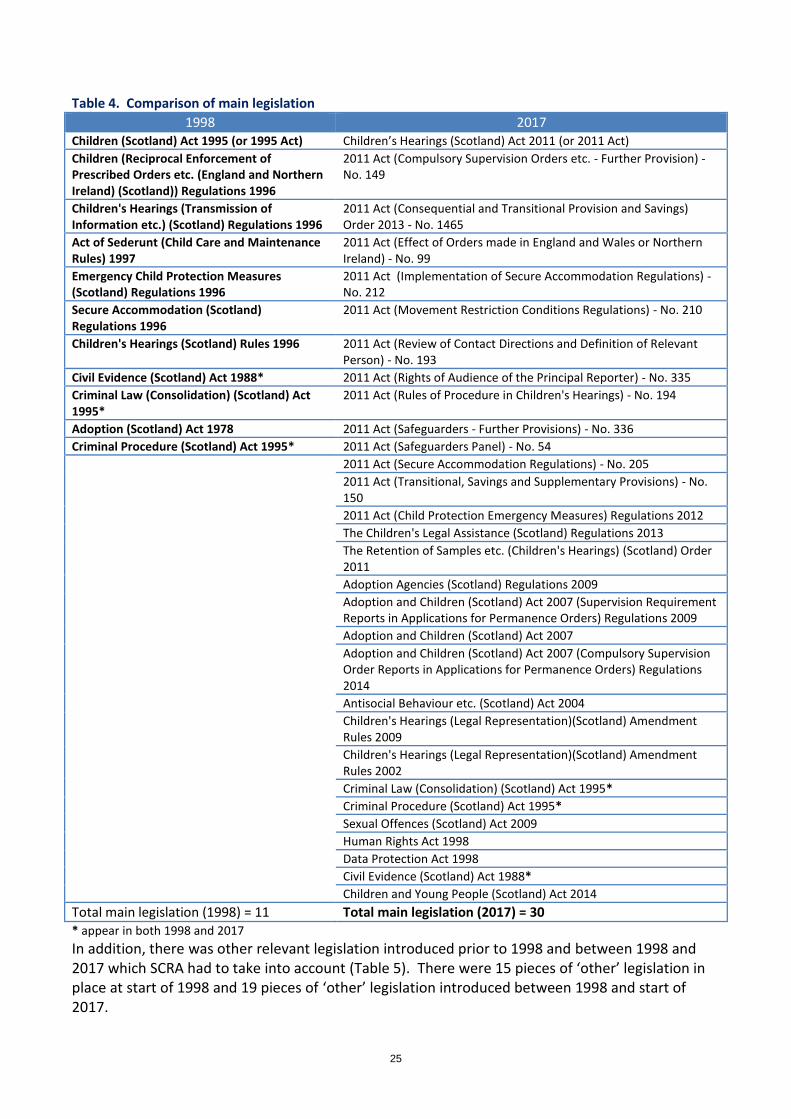
At the start of 1998 there were 11 pieces of legislation that were the most important in the operation of the Hearings System and this had increased to 30 such pieces of legislation at the start of 2017 (Table 4). For the purposes of this analysis, these pieces of legislation were decided to be the most important in terms of their impact, frequency of use, and policy significance.
25
Table 4. Comparison of main legislation
1998 2017 Children (Scotland) Act 1995 (or 1995 Act) Children’s Hearings (Scotland) Act 2011 (or 2011 Act)
Children (Reciprocal Enforcement of Prescribed Orders etc. (England and Northern Ireland) (Scotland)) Regulations 1996
2011 Act (Compulsory Supervision Orders etc. - Further Provision) - No. 149
Children's Hearings (Transmission of Information etc.) (Scotland) Regulations 1996
2011 Act (Consequential and Transitional Provision and Savings) Order 2013 - No. 1465
Act of Sederunt (Child Care and Maintenance Rules) 1997
2011 Act (Effect of Orders made in England and Wales or Northern Ireland) - No. 99
Emergency Child Protection Measures (Scotland) Regulations 1996
2011 Act (Implementation of Secure Accommodation Regulations) - No. 212
Secure Accommodation (Scotland) Regulations 1996
2011 Act (Movement Restriction Conditions Regulations) - No. 210
Children's Hearings (Scotland) Rules 1996 2011 Act (Review of Contact Directions and Definition of Relevant Person) - No. 193
Civil Evidence (Scotland) Act 1988* 2011 Act (Rights of Audience of the Principal Reporter) - No. 335
Criminal Law (Consolidation) (Scotland) Act 1995*
2011 Act (Rules of Procedure in Children's Hearings) - No. 194
Adoption (Scotland) Act 1978 2011 Act (Safeguarders - Further Provisions) - No. 336
Criminal Procedure (Scotland) Act 1995* 2011 Act (Safeguarders Panel) - No. 54
2011 Act (Secure Accommodation Regulations) - No. 205
2011 Act (Transitional, Savings and Supplementary Provisions) - No. 150
2011 Act (Child Protection Emergency Measures) Regulations 2012
The Children's Legal Assistance (Scotland) Regulations 2013
The Retention of Samples etc. (Children's Hearings) (Scotland) Order 2011
Adoption Agencies (Scotland) Regulations 2009
Adoption and Children (Scotland) Act 2007 (Supervision Requirement Reports in Applications for Permanence Orders) Regulations 2009
Adoption and Children (Scotland) Act 2007
Adoption and Children (Scotland) Act 2007 (Compulsory Supervision Order Reports in Applications for Permanence Orders) Regulations 2014
Antisocial Behaviour etc. (Scotland) Act 2004
Children's Hearings (Legal Representation)(Scotland) Amendment Rules 2009
Children's Hearings (Legal Representation)(Scotland) Amendment Rules 2002
Criminal Law (Consolidation) (Scotland) Act 1995*
Criminal Procedure (Scotland) Act 1995*
Sexual Offences (Scotland) Act 2009
Human Rights Act 1998
Data Protection Act 1998
Civil Evidence (Scotland) Act 1988*
Children and Young People (Scotland) Act 2014
Total main legislation (1998) = 11 Total main legislation (2017) = 30 * appear in both 1998 and 2017
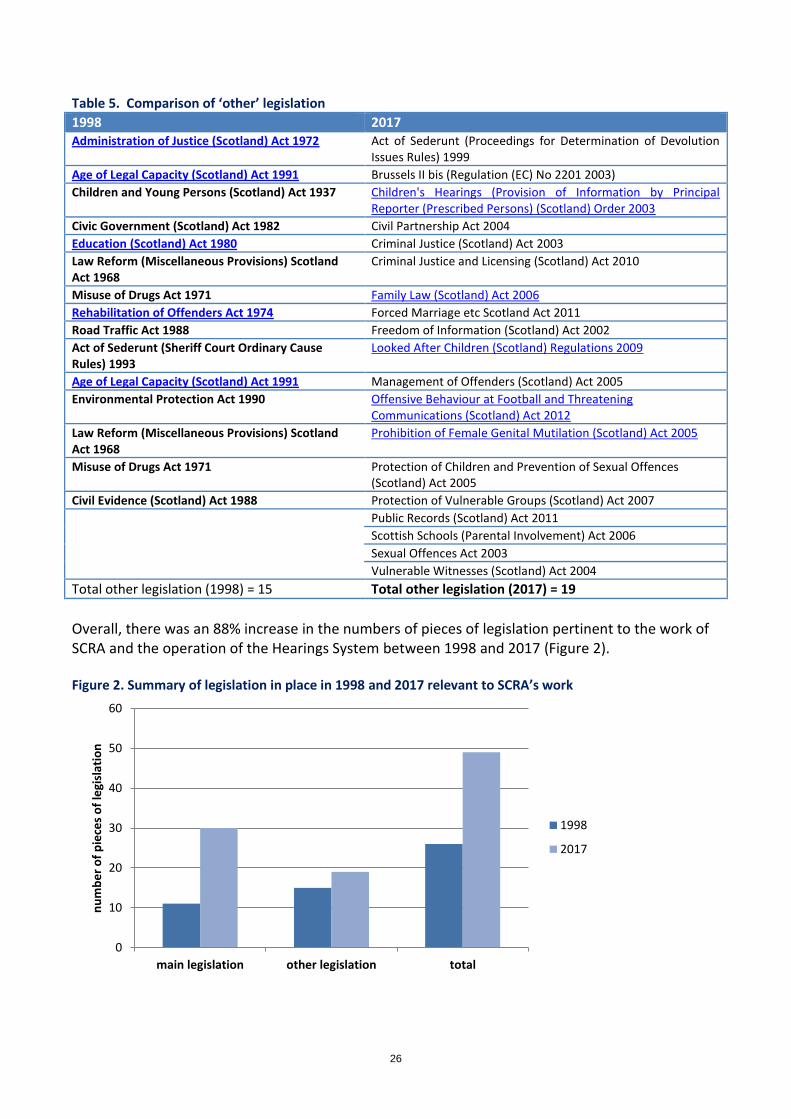
In addition, there was other relevant legislation introduced prior to 1998 and between 1998 and 2017 which SCRA had to take into account (Table 5). There were 15 pieces of ‘other’ legislation in place at start of 1998 and 19 pieces of ‘other’ legislation introduced between 1998 and start of 2017.
26
Table 5. Comparison of ‘other’ legislation 1998 2017 Administration of Justice (Scotland) Act 1972 Act of Sederunt (Proceedings for Determination of Devolution
Issues Rules) 1999
Age of Legal Capacity (Scotland) Act 1991 Brussels II bis (Regulation (EC) No 2201 2003)
Children and Young Persons (Scotland) Act 1937 Children's Hearings (Provision of Information by Principal Reporter (Prescribed Persons) (Scotland) Order 2003
Civic Government (Scotland) Act 1982 Civil Partnership Act 2004
Education (Scotland) Act 1980 Criminal Justice (Scotland) Act 2003
Law Reform (Miscellaneous Provisions) Scotland Act 1968
Criminal Justice and Licensing (Scotland) Act 2010
Misuse of Drugs Act 1971 Family Law (Scotland) Act 2006
Rehabilitation of Offenders Act 1974 Forced Marriage etc Scotland Act 2011
Road Traffic Act 1988 Freedom of Information (Scotland) Act 2002
Act of Sederunt (Sheriff Court Ordinary Cause Rules) 1993
Looked After Children (Scotland) Regulations 2009
Age of Legal Capacity (Scotland) Act 1991 Management of Offenders (Scotland) Act 2005
Environmental Protection Act 1990 Offensive Behaviour at Football and Threatening Communications (Scotland) Act 2012
Law Reform (Miscellaneous Provisions) Scotland Act 1968
Prohibition of Female Genital Mutilation (Scotland) Act 2005
Misuse of Drugs Act 1971 Protection of Children and Prevention of Sexual Offences (Scotland) Act 2005
Civil Evidence (Scotland) Act 1988 Protection of Vulnerable Groups (Scotland) Act 2007
Public Records (Scotland) Act 2011
Scottish Schools (Parental Involvement) Act 2006
Sexual Offences Act 2003
Vulnerable Witnesses (Scotland) Act 2004
Total other legislation (1998) = 15 Total other legislation (2017) = 19
Overall, there was an 88% increase in the numbers of pieces of legislation pertinent to the work of SCRA and the operation of the Hearings System between 1998 and 2017 (Figure 2). Figure 2. Summary of legislation in place in 1998 and 2017 relevant to SCRA’s work
0
10
20
30
40
50
60
main legislation other legislation total
nu
mb
er
of
pie
ces
of
legi
slat
ion
1998
2017
27
It is also important to note that many of SCRA’s case authorities were decided under the 1995 Act. These authorities continue to embody important legal precedents which SCRA may want to either continue to make use of under the 2011 Act or argue should be superseded by the 2011 Act in the best interests of children. It is therefore not the case that Reporters are only required to be knowledgeable in relation to the 2011 Act. To compare and contrast 1995 Act case authorities against the 2011 Act in informing decision making and considerations of evidence requirements, Reporters are required to be aware of the differences and similarities between the 1995 Act (and related legislation) and the 2011 Act. Accordingly, it cannot be assumed that only the 2017 list of legislation is currently considered by SCRA. Looking more closely at the 1995 and 2011 Acts, which did and do underpin the operation of the Hearings System, it can be argued that the 2011 Act is more complex than the 1995 Act: 1995 Act – sections 16 to 93 are specifically in relation to the Hearings System i.e. 78 sections and two relevant schedules. Seven sets of related Rules applied to the 1995 Act. The related Rules include 84 Rules/Regulations in total. 2011 Act – has 206 sections and six schedules. Fifteen sets of related Rules apply to the 2011 Act. The related Rules include 286 Rules/Regulations in total.
4.3. Changes to SCRA practice triggered by legislation
A total of 41 Practice Instruction Notes were issued by SCRA under the 1995 Act. 29 Practice Directions specific to the 2011 Act12 have been issued by SCRA and 16 of the 1995 Act Practice Instructions continue to be reference sources for practice (e.g. Sexual Offences (Scotland) Act 2009, Death of a Child Known to the Reporter, Victims of Youth Crime). Total under 2011 Act = 45.
Examples of increases in complexity of SCRA practice Non-Disclosure – in 1998 there was no Practice Instruction. In January 2009 Practice Instruction on Non-Disclosure was introduced and it amounted to 9,331 words. In 2017, Practice Direction on Non-Disclosure amounted to 16,408 words. Hearings - under the 1995 Act, Practice Instruction listed 18 purposes for Hearings with 42 sub-categories. At 2017, 50 purposes for Hearings are listed in Practice Direction with 52 sub-categories. Under the 1995 Act the total number of recording decisions which could be selected/made in Hearings was 52 with 97 sub-categories. Under the 2011 Act there are 107 available recording decisions for Hearings with 152 sub-categories. In 1998, the Childrens Hearings (Scotland) Rules 1996 contained 33 Rules. The Childrens Hearings (Scotland) Act 2011 (Rules of Procedure in Children’s Hearings) Rules 2013 contain 100 Rules. Grounds for referral – in 1998 there were 12 grounds for referral to the Children’s Reporter. In 2017 there are 17 grounds for referral.
12
Practice Directions issued by the Principal Reporter to Reporters in relation to the Children’s Hearings (Scotland) Act 2011 are available at - http://www.scra.gov.uk/about-scra/role-of-the-reporter/
28
Court – the Act of Sederunt (Child Care and Maintenance Rules) 1997 contained 64 Rules. The amended statutory instrument now contains 81 Rules (after deduction of the revoked 1995 Act Rules).
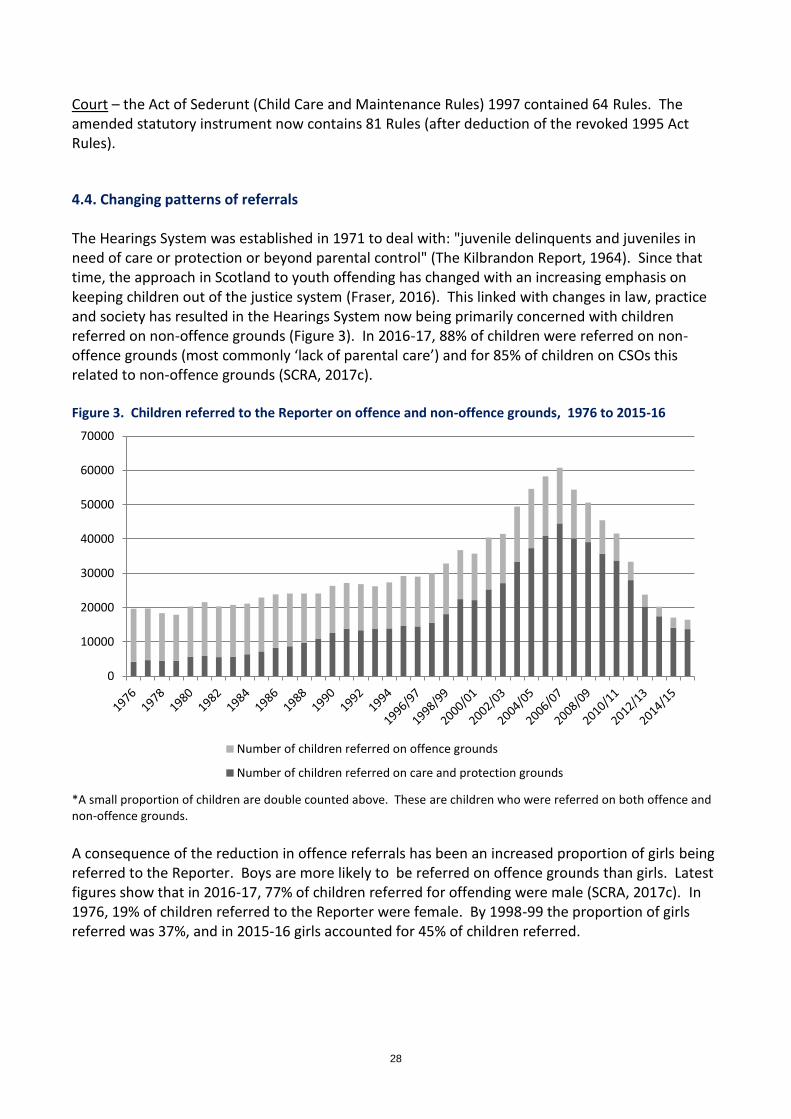
4.4. Changing patterns of referrals The Hearings System was established in 1971 to deal with: "juvenile delinquents and juveniles in need of care or protection or beyond parental control" (The Kilbrandon Report, 1964). Since that time, the approach in Scotland to youth offending has changed with an increasing emphasis on keeping children out of the justice system (Fraser, 2016). This linked with changes in law, practice and society has resulted in the Hearings System now being primarily concerned with children referred on non-offence grounds (Figure 3). In 2016-17, 88% of children were referred on non-offence grounds (most commonly ‘lack of parental care’) and for 85% of children on CSOs this related to non-offence grounds (SCRA, 2017c). Figure 3. Children referred to the Reporter on offence and non-offence grounds, 1976 to 2015-16
*A small proportion of children are double counted above. These are children who were referred on both offence and non-offence grounds.
A consequence of the reduction in offence referrals has been an increased proportion of girls being referred to the Reporter. Boys are more likely to be referred on offence grounds than girls. Latest figures show that in 2016-17, 77% of children referred for offending were male (SCRA, 2017c). In 1976, 19% of children referred to the Reporter were female. By 1998-99 the proportion of girls referred was 37%, and in 2015-16 girls accounted for 45% of children referred.
0
10000
20000
30000
40000
50000
60000
70000
Number of children referred on offence grounds
Number of children referred on care and protection grounds
29
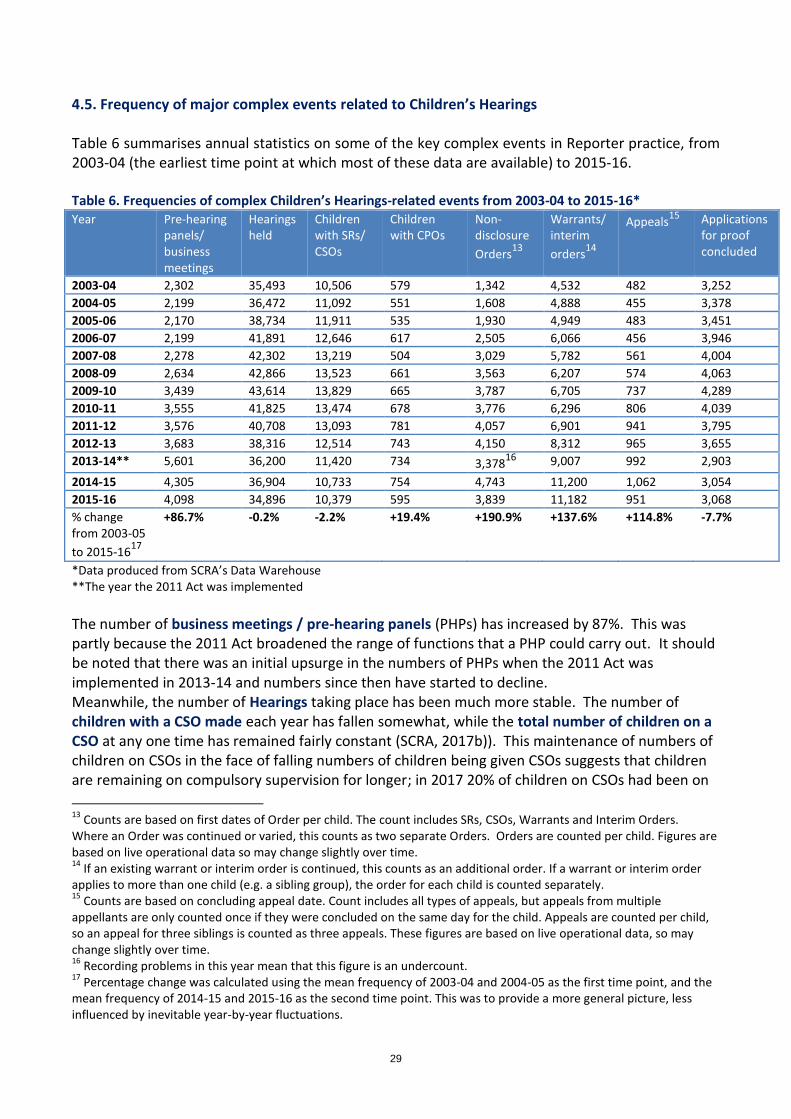
4.5. Frequency of major complex events related to Children’s Hearings Table 6 summarises annual statistics on some of the key complex events in Reporter practice, from 2003-04 (the earliest time point at which most of these data are available) to 2015-16. Table 6. Frequencies of complex Children’s Hearings-related events from 2003-04 to 2015-16* Year Pre-hearing
panels/ business meetings
Hearings held
Children with SRs/ CSOs
Children with CPOs
Non-disclosure
Orders13
Warrants/ interim
orders14
Appeals15
Applications for proof concluded
2003-04 2,302 35,493 10,506 579 1,342 4,532 482 3,252
2004-05 2,199 36,472 11,092 551 1,608 4,888 455 3,378
2005-06 2,170 38,734 11,911 535 1,930 4,949 483 3,451
2006-07 2,199 41,891 12,646 617 2,505 6,066 456 3,946
2007-08 2,278 42,302 13,219 504 3,029 5,782 561 4,004
2008-09 2,634 42,866 13,523 661 3,563 6,207 574 4,063
2009-10 3,439 43,614 13,829 665 3,787 6,705 737 4,289
2010-11 3,555 41,825 13,474 678 3,776 6,296 806 4,039
2011-12 3,576 40,708 13,093 781 4,057 6,901 941 3,795
2012-13 3,683 38,316 12,514 743 4,150 8,312 965 3,655
2013-14** 5,601 36,200 11,420 734 3,37816
9,007 992 2,903
2014-15 4,305 36,904 10,733 754 4,743 11,200 1,062 3,054
2015-16 4,098 34,896 10,379 595 3,839 11,182 951 3,068
% change from 2003-05
to 2015-1617
+86.7% -0.2% -2.2% +19.4% +190.9% +137.6% +114.8% -7.7%
*Data produced from SCRA’s Data Warehouse **The year the 2011 Act was implemented
The number of business meetings / pre-hearing panels (PHPs) has increased by 87%. This was partly because the 2011 Act broadened the range of functions that a PHP could carry out. It should be noted that there was an initial upsurge in the numbers of PHPs when the 2011 Act was implemented in 2013-14 and numbers since then have started to decline. Meanwhile, the number of Hearings taking place has been much more stable. The number of children with a CSO made each year has fallen somewhat, while the total number of children on a CSO at any one time has remained fairly constant (SCRA, 2017b)). This maintenance of numbers of children on CSOs in the face of falling numbers of children being given CSOs suggests that children are remaining on compulsory supervision for longer; in 2017 20% of children on CSOs had been on
13
Counts are based on first dates of Order per child. The count includes SRs, CSOs, Warrants and Interim Orders. Where an Order was continued or varied, this counts as two separate Orders. Orders are counted per child. Figures are based on live operational data so may change slightly over time. 14
If an existing warrant or interim order is continued, this counts as an additional order. If a warrant or interim order applies to more than one child (e.g. a sibling group), the order for each child is counted separately. 15
Counts are based on concluding appeal date. Count includes all types of appeals, but appeals from multiple appellants are only counted once if they were concluded on the same day for the child. Appeals are counted per child, so an appeal for three siblings is counted as three appeals. These figures are based on live operational data, so may change slightly over time. 16
Recording problems in this year mean that this figure is an undercount. 17
Percentage change was calculated using the mean frequency of 2003-04 and 2004-05 as the first time point, and the mean frequency of 2014-15 and 2015-16 as the second time point. This was to provide a more general picture, less influenced by inevitable year-by-year fluctuations.
30
CSOs for at least five years (SCRA, 2017c). The number of children with CPOs has increased by almost 20% over the last 12 years. This may be because of an increasing emphasis on early intervention, meaning that increasing numbers of babies are placed on CPOs at birth, having already been identified as at risk (Whitehead et al., 2009; Henderson & Hanson, 2015). A dramatic change is in the number of Non-Disclosure Orders, which has almost tripled. There were 1,342 such orders in 2003-04, compared with 3,839 in 2015-16. This may be because of increasing desire to avoid risk, a society wide trend which is particularly evident in policy and practice pertaining to children’s safety and wellbeing (Gill, 2007; Woods, 2013; The Guardian, 2015).
The number of applications to the sheriff for proof (due to grounds not being accepted or understood) that were concluded fell by 7.7%. This probably reflects the reduced number of children being given CSOs; indeed, a Pearson product-moment correlation found a strong positive relationship between annual number of applications to the sheriff and annual number of children with new CSOs (r (11) = .897, p<.001). Applications to court for grounds to be established may require several callings (court dates) before the application is determined; for example, in 2016-17 there were 10,546 callings recorded for the 3,189 determined applications. The number of Hearings and callings adds to the complexity and duration of cases. This is illustrated by the difference in time from receipt of referral by the Reporter to Hearing decision to make a CSO: in 2016-17, the median for offence referrals was 53 days against an average of 76 days, whilst the median for care and protection referrals was 111 days against an average of 123 days (SCRA, 2017c). The longer time taken for care and protection cases can be largely attributed to the time for grounds to be established. Over the last 13 years, the number of Interim Compulsory Supervision Orders (ICSOs; formerly Place of Safety Warrants) more than doubled. Table 6 reveals a particularly rapid increase from 2012-13 on. This coincides with the arrival of the 2011 Act, which renamed Warrants as ICSOs, and extended how they could be applied by Hearings and courts. Table 6 also shows that the number of appeals more than doubled from 2003-05 to 2014-16. There are patchy data on appeals available from the early years of the Hearings System which demonstrate the extent of this escalation even more clearly. Appeals were first recorded in 1976, with an annual total of just 19 (Scottish Office, 1979). Figures remained relatively low for 20 years (e.g. 114 appeals were recorded in 1996-97) (SCRA, 2000). Since that time numbers of appeals have climbed steadily, passing 1,000 for the first time in 2014-15. While the number of appeals has increased, the proportion of those which were dismissed has remained roughly constant (which means, of course, that the actual numbers of dismissed appeals are steadily increasing). Reliable data are available for 2011-12 onwards. The percentage of children and young people for whom the Hearing decision was upheld for at least one appeal during the year was 70%, 67%, 62%, 65%, 65% respectively for 2011-12 through to 2015-16.18
18
The percentage of all appeals for which the Hearing decision was upheld is slightly lower. For instance, in 2015-16 this figure was 58%.

31
Some of these processes are subject to substantial regional variation. Figure 4 reveals the proportion of several Hearings-related events occurring in each local authority area in 2015-16. Only data on local authority areas holding more than 2% of the nation’s Hearings are represented individually, for clarity. Glasgow stands out in that it was the site of 18% of Hearings, but 25% of all Non-Disclosure Orders and 36% of all appeals. It thus attracted around twice as many appeals as one would expect given the proportion of Hearings taking place there. This situation contrasts with that of Scotland’s next largest city, Edinburgh, which held 9% of Hearings but only 5% of its appeals. Other local authority areas in which appeals were similarly over-represented (i.e. were at least double the number one would expect based on the proportion of the nation’s Hearings taking place in that local authority area) were Clackmannanshire, West Dunbartonshire and Shetland. Glasgow also had almost 40% more Non-Disclosure Orders than would be expected based on the number of Hearings taking place there. Other local authority areas in which Non-Disclosure Orders were at least 40% over-represented were Fife, Midlothian and the Scottish Borders. Figure 4. Distribution of complex Children’s Hearings related events across local authority areas in 2015-16*
*Data produced from SCRA’s Data Warehouse
0% 20% 40% 60% 80% 100%
Hearings
PHPs
Children with CPOs
Interim orders
Appeals
Non-disclosure
Aberdeen City
Aberdeenshire
Dumfries & Galloway
Dundee
East Ayrshire
Edinburgh, City of
Falkirk
Fife
Glasgow
Highland
North Ayrshire
North Lanarkshire
Renfrewshire
South Ayrshire
South Lanarkshire
West Lothian
Others

32
5. Discussion and conclusion Children’s lives Looked after children under three years old, whether they were born in 2003 or 2013, are more likely to have experienced problems compared to other children. For example: The Hidden Harm Report (Advisory Council on the Misuse of Drugs, 2003) estimated that around 1% of live births in Scotland had neonatal abstinence syndrome, in this study 15% of children were treated for substance withdrawal after birth; and almost a fifth of children in this study were premature and/or had low birth weights, in comparison to the 9% children with low birth weights in the lowest income quintile in the Scottish population (Scottish Government, 2015). However, this study has found that the complexity of problems at a child level for looked after children in the first three years of life has not changed between those born in 2003 (T1) and those born in 2013(T2)19. Parents’ lives Parents of the children born in both 2003 and 2013 experienced high levels of problems in their lives, most commonly substance misuse, mental ill health, being victims or perpetrators of abuse, in volatile relationships, and that they themselves had been neglected or abused as children (all experienced by over a half of parents) (Appendix 1). The rates of problems experienced by the parents of children in this study were much higher than those of the general population. For example, 2.6% of the Scottish adult population have been victims of violent crime (Scottish Government, 2016b) and less than 2% of the adult population have problematic drug use (Burton et al., 2014). In this study about half of parents were victims of physical or emotional abuse and a similar proportion had abused drugs. Overall, parents’ lives at T2 were significantly more complex in terms of the numbers of problems they faced in the first three years of their children’s lives, compared to T1. This appeared to be a cumulative worsening of problems across the board, and particularly those problems related to criminality. Family complexity Turning to family level complexity, there were no changes in complexity in the rates of parental separation (around ¾ of families), and problems within extended family and within the community (just under a half of families) at both T1 and T2. However, we did find increased family fragmentation and this seemed to result from changes in professional practice. While this study cannot demonstrate causality, other research has shown that there is a causal relationship between parental problems and those experienced by their children. Drug use and poor mental health both impact on ability to parent and on children’s well-being. These problems were prevalent in the lives of parents of looked after children born in both 2003 and 2013. This supports other research findings that vulnerable families face complex problems (Daniel, 2015; Hood, 2014, 2015; O’Connor et al., 2014; and others). To our knowledge, this is the first study to quantify complexity in child protection and to measure change in complexity over time. We found that although the complexity of problems in the lives of
19
It should be noted that changes in complexity in children’s lives could have taken place over a longer period than the 10 years in this study.
33
looked after young children themselves has not increased over the 10 year timeframe of this study, the complexity of problems faced by their parents has increased significantly as has family fragmentation. This study has therefore provided evidence that the complexity of the lives of vulnerable families in Scotland are increased in some important respects. Interagency working There was no change, in the first three years of the children’s lives, in the number of organisations working with families, which was an average of nine organisations at both time points. Similarly, numbers of changes of key workers remained constant with around 40% of children having no change in key worker and around 40% having one change within their first three years. These findings do not therefore support the argument that interagency complexity is increasing (Darlington et al., 2004; Hood, 2014, 2015). However, it should be noted that our measure on complexity of interagency working was simply based on the number of organisations working with a family and may not reflect the extent of interagency working. Legislation and practice Some of the increases in complexity in children’s lives were linked to changes in legislation and practice. For example, the increase in family fragmentation (in terms of children separated from both their parents and from their siblings) can largely be explained by changes in child protection practice - 72% children in the sample born in 2013 had been removed from their parent(s)’ care by age of three years compared with 60% of those born in 2003. Not surprisingly, given the extension of the availability of legal aid (s191) and those who can have relevant person status (s81) introduced by the 2011 Act, there were statistically significant increases in the presence of legal representatives in Hearings and in the numbers of relevant persons for children born in 2013 compared to those born in 2003. The greater presence of legal representatives in Hearings has itself been raised as source of complexity, especially the balance between the role of the solicitor representing their client (a relevant person) and the child centred ethos of the Hearing (Porter et al., 2016). However, the increased presence of legal representatives in Hearings may also be a response to the more complex nature of cases i.e. the more complex the case the more likely someone is to need a solicitor to protect their rights. In other words, the increased numbers of legal representatives may be both a cause and a consequence of increased complexity. There was also a statistically significant increase in the number of changes to children’s CSOs between T1 and T2. Some of this can be explained by increases in numbers of children with permanence planning in place by age of three years, more children being removed from their parents’ care, and more children with CSOs with supervised contact conditions with their parents – all of which could be regarded as changes in child protection practice. The volume of legislation that is relevant to SCRA’s work and the operation of the Hearings System has increased by 88% since 1998. This is reflected in the increasing frequency of most types of complex events associated with Children’s Hearings processes despite the number of children on CSOs remaining relatively constant. As noted by Lord Laming (2009) in his review of the protection of children in England:

34
‘Further legislative change is not what is needed to protect children. However, it is vital that all professionals with responsibility for the welfare of children fully understand the legislative framework in relation to safeguarding and child protection, and have a clear understanding of their responsibilities in the process.’
Conclusion The lives of looked after children under three years old are indeed complex but in some respects have in themselves not become more complex over the time-frame studied in this research. There are, however, multiple factors that affect the care and protection of children which have become more complex, in particular the number of problems faced by their parents. The legislative and professional practices in place to protect looked after children in Scotland have also become more complex. These have added complexity to the lives of vulnerable children and their families both directly through their involvement in legal processes and indirectly through increased family fragmentation as a result of interventions to take children into care. They have also added complexity to the work of SCRA and its partner agencies. This increased complexity in child protection has implications for all those working within the Hearings System especially for the training of Children’s Panel Members and professionals, and in their decision making to protect vulnerable children. Importantly, it has implications for those families who find themselves involved in an increasing complex legal system.
35
6. References Advisory Council on the Misuse of Drugs (2003). Hidden Harm: Responding to the Needs of Children of Problem Drug Users, report of an inquiry by the Advisory Council on the Misuse of Drugs. London: Home Office Aldridge, H. & Kenway, P. (2014). Child poverty in Scotland: How child poverty in Scotland has changed compared to England in the last decade. Joseph Rowntree Foundation Referendum briefing, 2nd February. Retrieved on 12/1/2017 from https://www.jrf.org.uk/report/referendum-briefing-child-poverty-scotland Anda, R.F., Felitti, V.J., Brown, D.W., Chapman, D., Dong, M., Dube, S.R. et al. (2006) Insights into intimate partner violence from the Adverse Childhood Experiences (ACE) Study. In: The Physician’s Guide to Intimate Partner Violence and Abuse (eds P.R. Salber & E. Taliaferro). Volcano Press, Volcano, CA. Armour, C., Elklit, A. & Christoffersen, M. N. (2014). A latent-class analysis of childhood maltreatment: Identifying abuse typologies. Journal of Loss and Trauma, 19, 23-39. Doi: 10.1080/15325024.2012.734205 Ball, W. (2014). Providing multi-agency children’s services in an austere climate: Professional narratives on parenting support in Wales. Families, Relationships and Societies, 3, 321-337. Belsky, J. (1993). Etiology of child maltreatment: A developmental-ecological analysis. Psychological Bulletin, 114, 413-434. Bentley, H., O’Hagan, O., Raff, A. & Bhatti, I. (2016). How safe are our children? The most comprehensive overview of child protection in the UK. NSPCC Knowledge and Information Services. Burton, R., Thomson, F., Visintin, C. & Wright, C. (2014). United Kingdom Drug Situation: Annual report to the European Monitoring Centre for Drugs and Drug Addiction. Retrieved on 12/1/2017 from http://www.nta.nhs.uk/uploads/uk-focal-point-report-2014.pdf Calder, M.C., McKinnon, M. & Sneddon, R. (2012). National Risk Framework to Support the Assessment of Children and Young People. Scottish Government. Chaffin, M., Kelleher, K. & Hollenberg, J. (1996). Onset of physical abuse and neglect: Psychiatric, substance abuse, and social risk factors from prospective community data. Child Abuse & Neglect, 20, 191-203. Coates, D. & Howe, D. (2015). Working with families who experience parental mental health and/or drug and alcohol problems in the context of child protection concerns: Recommendations for service improvement. Australian and New Zealand Journal of Family Therapy, 36, 325-341.
36
Coulton, C. J., Korbin, J. E. & Su, M. (1999). Neighborhoods and child maltreatment: A multi-level study. Child Abuse & Neglect, 23, 1019-1040. Cree. V. E., Jain, S. & Hillen, P. (2016). The challenge of measuring effectiveness in social work: A case study of an evaluation of a drug and alcohol referral service in Scotland. British Journal of Social Work, 46, 277-293. Daniel, B. (2015). Why have we made neglect so complicated? Taking a fresh look at noticing and helping the neglected child. Child Abuse Review, 24, 82-94. Darlington, Y., Feeney, J. A. & Rixon, K. (2004). Complexity, conflict and uncertainty: Issues in collaboration between child protection and mental health services. Children and Youth Services Review, 26, 1175-1192. Devaney, J. (2008). Chronic child abuse and domestic violence: Children and families with long-term and complex needs. Child and Family Social Work, 13, 443-453.
Fraser, C. (2016). Children and the Scottish Criminal Justice System. SPICe briefing 16/54. Scottish Parliament. Retrieved on 19/09/2017 from: http://www.parliament.scot/parliamentarybusiness/100004.aspx GlenMaye, L. R., Lewandowski, C. A. & Bolin, B. L. (2004). Defining complexity: The theoretical basis of advanced generalist practice. In A. W. Roy & F. J. Vecchiolla (Eds.), Thoughts on an Advanced Generalist Education. Eddie Bowers Publishing. Gill, T. (2007). No Fear: Growing Up in a Risk Averse Society. Calouste Gulbenkian Foundation Henderson, H. & Hanson, L. (2015). Child Protection Orders. Scottish Children’s Reporter Administration. Retrieved on 19/09/2017 from: http://www.scra.gov.uk/wp-content/uploads/2016/03/Child-Protection-Orders-Research-Report-2015.pdf Henderson, G., Woods, R. & Kurlus, I. (2017). An exploration of ethnic minority communities’ understanding and awareness of child protection and the Children’s Hearings System in Scotland. Scottish Children’s Reporter Administration. Retrieved on 18/09/2017 from: http://www.scra.gov.uk/wp-content/uploads/2017/09/Ethnic-Minority-Research.pdf
Holland, J. H. (2014). Complexity: A Very Short Introduction. Oxford U.P. Hood, R. (2014). Complexity and integrated working in children’s services. British Journal of social Work, 44, 27-43. Hood, R. (2015). How professionals experience complexity: An interpretive phenomenological analysis. Child Abuse Review, 24, 140-152.
Johnson, S. (2015). Scottish drug deaths reach record levels. The Telegraph, 25th August. Retrieved on 12/1/2017 from: http://www.telegraph.co.uk/news/uknews/scotland/11823685/Scottish-drug-deaths-reach-record-levels.html

37
Kazdin, A. E. & Whitley, M. K. (2006). Comorbidity, case complexity, and effects of evidence-based treatment for children referred for disruptive behavior. Journal of Consulting and Clinical Psychology, 74, 455.467. Kiraly, M. & Humphreys, C. (2015). A tangled web: parental contact with children in kinship care. Child and Family Social Work, 20, 106-115. Lansford, J. E., Godwin, J., Tirado, L. M. U., Zelli, A., Al-Hassan, S. M., Bacchini, D., Bombi, A. S., Bornstein, M. H., Chang, L., Deater-Deckard, K., Di Giunta, L., Dodge, K. A., Malone, P. S., Oburu, P., Pastorelli, C., Skinner, A. T., Sorbring, E., Tapanya, S. & Alampay, L. P. (2015). Individual, family, and culture level contributions to child physical abuse and neglect: A longitudinal study in nine countries. Development and Psychopathology, 27, 1417-1428. Lindahl, M. W. & Hunt, L. A. (2016). Reunification in intra-familial child abuse cases: A model for intervention. Family court Review, 54, 288-299. Manning, W. D., Brown, S. L. & Stykes, J. B. (2014). Family complexity among children in the United States. Annals, AAPSS, 654, July, 48-65. Mason, M., Mennis, J., Light, J., Rusby, J., Westling, E., Crewe, S., Way, T., Flay, B. & Zaharakis, N. (2016). Parents, peers, and places: Young urban adolescents’ microsystems and substance use involvement. Journal of Child and Family Studies, 25, 1441-1450. Matthews, B. (2014). Where have all the young offenders gone? Research Briefing 4, Applied Quantitative Methods Network, University of Edinburgh. Retrieved on 12/1/2017 from: https://www.aqmen.ac.uk/sites/default/files/RB4-young-offenders.pdf Mitchell, P. F. (2011). Evidence-based practice in real-world services for young people with complex needs: New opportunities suggested by recent implementation science. Children and Youth Services Review, 33, 207-216. Mitendorf, A. & van Ewijk, H. (2016). Working with social complexity in a neoliberal society: Challenges for social work in Estonia. European Journal of Social Work, 19, 78-91.
National Records of Scotland (2017). Drug-related deaths in Scotland in 2016. Statistics of drug-related deaths in 2016 and earlier years, broken down by age, sex, selected drugs reported, underlying cause of death and NHS Board and Council areas. Retrieved on 15/08/2017 from: https://www.nrscotland.gov.uk/files//statistics/drug-related-deaths/drd2016/16-drug-rel-deaths.pdf
O’Connor, L., Forrester, D., Holland, S. & Williams, A. (2014). Perspectives on children’s experiences in families with parental substance misuse and child protection interventions. Children and Youth Services Review, 38, 66-74. Office for National Statistics (2016). Population estimates for UK, England and Wales, Scotland and Northern Ireland: mid-2015. Retrieved on 12/1/2017 from:
38
https://www.ons.gov.uk/peoplepopulationandcommunity/populationandmigration/populationestimates/bulletins/annualmidyearpopulationestimates/mid2015 Office for National Statistics (2017). Deaths related to drug poisoning in England and Wales: 2016 registrations. Deaths related to drug poisoning in England and Wales from 1993 onwards, by cause of death, sex, age and substances involved in the death. Retrieved on 18/09/2017 from: https://www.ons.gov.uk/peoplepopulationandcommunity/birthsdeathsandmarriages/deaths/bulletins/deathsrelatedtodrugpoisoninginenglandandwales/2016registrations Parton, N. (2011). The increasing length and complexity of central government guidance about child abuse in England: 1974-2010. Unpublished discussion paper, University of Huddersfield. Porter, R., Welsh, V. and Mitchell, F. (2016). The Role of the Solicitor in the Children’s Hearings System. Scottish Legal Aid Board. Retrieved on 19/09/2017 from: http://www.slab.org.uk/permalink/3fd777f6-91f1-11e6-98b9-0015c5f5117d.pdf Robb, L. (2014). Resistance, a complex challenge for practice. WithScotland briefing, accessed on 08/09/2016 from: http://withscotland.org/download/resistance-a-complex-challenge-for-practice Rose, S. M., Hatzenbuehler, S., Gilbert, E., Bouchard, M. P. & McGill, D. (2016). A population health approach to clinical social work with complex patients in primary care. Health & Social Work, 41, 93-100. Rowlands, J. & Statham, J. (2009). Numbers of children looked after in England: A historical analysis. Child and Family Social Work, 14, 79-89. Saltiel, D. (2013). Understanding complexity in families’ lives: the usefulness of ‘family practices’ as an aid to decision-making. Child & Family Social Work, 18, 15-24. Scottish Children’s Reporter Administration (2000). Referrals of Children to Reporters and Children’s Hearings. Covering the period 1st April 1996 to 31st March 1997 inclusive. Statistical Bulletin. No. SCRA/1999/21 Scottish Children’s Reporter Administration (2017a). Corporate Plan 2017-20. Retrieved on 02/08/2017 from: http://www.scra.gov.uk/wp-content/uploads/2017/04/CORPORATE-PLAN-2017-20.pdf Scottish Children’s Reporter Administration (2017b). On-line Statistical Dashboard. Accessed on 16/08/2017: http://www.scra.gov.uk/stats/?areaByMeasures=true&measures%5B%5D=Children%20referred&measures%5B%5D=Children%20referred%20-%20non-offence&measures%5B%5D=Children%20referred%20-%20offence&measures%5B%5D=Children%20subject%20to%20CSOs&area=Scotland Scottish Children’s Reporter Administration (2017c). On-line Statistics 2016-17. Retrieved on 14/08/2017 from: http://www.scra.gov.uk/wp-content/uploads/2017/07/SCRA-Full-Statistical-Analysis-2016-17.pdf
39
Scottish Children’s Reporter Administration (2017d). Fact Sheet 13. Very Young Children Referred to the Reporter. Retrieved on 19/09/2017 from: http://www.scra.gov.uk/wp-content/uploads/2017/08/13-Early-Years.pdf Scottish Executive (2006). Changing lives: Report of the 21st century social work review. Scottish Government (2011). Prevalence of problem drug users. Retrieved on 12/01/2017 from: http://www.gov.scot/Topics/Statistics/Browse/Crime-Justice/TrendPrev Scottish Government (2015). Tackling inequalities in the early years: key messages from 10 years of the growing up in Scotland study. Retrieved on 15/08/2017 from: http://www.gov.scot/Publications/2015/10/7513
Scottish Government (2016a). Volume of crime recorded by police. Retrieved on 12/01/2017 from http://www.gov.scot/Topics/Statistics/Browse/Crime-Justice/TrendVol Scottish Government (2016b). Scottish Crime and Justice Survey 2014/15 Main Findings. Retrieved on 13/07/2017 from: http://www.gov.scot/Publications/2016/03/5269/0 Scottish Government (2017). Recorded Crime in Scotland: Other Sexual Crimes 2013-14 and 2016-17. Retrieved on 19/10/2017 from: http://www.gov.scot/Resource/0052/00525033.pdf
Scottish Government (n.d.) Poverty and income inequality in Scotland: 2013/14. Retrieved on 12/01/2017 from http://www.gov.scot/Resource/0048/00480301.pdf Social Mobility & Child Poverty Commission (2015). State of the Nation 2015: Social mobility and child poverty in Great Britain. Retrieved on 12/01/2017 from: https://www.gov.uk/government/uploads/system/uploads/attachment_data/file/485926/State_of_the_nation_2015__social_mobility_and_child_poverty_in_Great_Britain.pdf Scottish Office (1979). Children’s Hearings Statistics 1976. Social Work Services Group. Statistical Bulletin CH1/1979. Stevens, J. & Cox, P. (2008). Complexity theory: Developing new understandings of child protection in field settings and in residential child care. British Journal of Social Work, 38, 1320–1336. The Guardian (2014). Baby P effect takes children in care numbers to 25-year high, says NAO. Retrieved on 19/09/2017 from: https://www.theguardian.com/society/2014/nov/27/nao-children-care-highest-25-years-baby-p The Kilbrandon Report (1964). HMSO: Edinburgh. Retrieved on 19/09/2017 from: http://www.gov.scot/Resource/Doc/47049/0023863.pdf The Lord Laming (2009). The Protection of Children in England: A Progress Report. London: The Stationery Office. Retrieved on 16/08/2017 from: http://dera.ioe.ac.uk/8646/1/12_03_09_children.pdf
40
Tucker, M. C. & Rodriguez, C. M. (2014). Family dysfunction and social isolation as moderators between stress and child physical abuse risk. Journal of Family Violence, 29, 175-186. Whitehead, I., Lamb, D., Hanson, L., McNiven, G. and Henderson, G. (2009). Children aged under two years referred to the Children’s Reporter. Scottish Children’s Reporter Administration. Available on request from: [email protected] Winter, B. (n.d.). Linear models and linear mixed effects models in R with linguistic applications. Retrieved on 18/4/2017 from https://arxiv.org/ftp/arxiv/papers/1308/1308.5499.pdf Woods, R. (2013). Children’s Moral Lives: An Ethnographic and Psychological Approach. Wiley
Blackwell.

41
Appendix 1 1. Problems experienced in the first three years of their lives by children born in 2003 (T1) and those born in 2013 (T2)
Child problem T1 – children born in 2003 T2 – children born in 2013
No. with problem
% Total cases
No. with problem
% Total cases
Substance withdrawal after birth
17 15.5% 110 18 15.4% 117
Premature/ low birth weight 21 19.1% 110 20 17.2% 116
Developmental delay 19 17.3% 110 26 22.2% 117
Behavioural difficulties 17 15.5% 110 11 9.4% 117
Physical ill health 19 17.3% 110 21 17.9% 117
Failure to thrive 7 6.4% 110 * * 117 *Supressed – low numbers
The problems - mental ill health, learning disability and beyond parental control are not included in the above table as there were less than five children with these problems in both T1 and T2.

42
2. Problems experienced by parents in the first three years of their child’s life – for those with children born in 2003 (T1) and those with children born in 2013 (T2)
Parent problem T1 – children born in 2003 T2 – children born in 2013
No. with problem
% Total cases
No. with problem
% Total cases
Victim of abuse* 67 60.9% 110 76 65.5% 116
Perpetrator of abuse** 52 47.7% 109 67 57.3% 117
Alcohol abuse 47 43.1% 109 52 45.2% 115
Drug abuse 52 47.3% 110 72 63.2% 114
Offending 60 54.5% 110 84 71.8% 117
Imprisonment 31 28.2% 110 44 37.9% 116
Breach of legal order 19 17.4% 109 43 37.1% 116
Mental ill health 61 55.5% 110 77 65.8% 117
Learning difficulties 10 9.1% 110 18 15.4% 117
Relationships with Inappropriate people
54 49.1% 110 65 55.6% 117
Involvement with social work as a child/ victim of abuse or neglect as child
64 59.8% 107 71 60.7% 117
Bereavement of someone close to them
19 17.4% 109 34 29.1% 117
Isolated, lack of social support / networks / extended family help
31 28.4% 109 43 36.8% 117
Financial difficulties 55 50% 110 55 47% 117
Poor physical health 21 19.1% 110 21 17.9% 117
Parents in conflict / volatile relationship
70 64.2% 109 77 65.8% 117
*Parent –victim of abuse One or more of child's parents is a victim of violence, verbal and or emotional abuse
**Parent- perpetrator of abuse One or more of child's parents is a perpetrator of violence, verbal or emotional abuse
The problems – lacks English and refugee/ asylum seeker/ awaiting deportation are not included in the above table as there were less than five children’s parents with these problems in both T1 and T2.

Ruth Woods, Gillian Henderson, Indiya Kurlus, Pauline Proudfoot, Nick Hobbs and Donald Lamb
Scottish Children’s Reporter AdministrationMarch 2018
SCA
N T
HIS
>