complexity-based evaluation of the correlation …
TRANSCRIPT

September 8, 2021 16:43 0218-348X 2150238
OPEN ACCESS
Fractals, Vol. 29, No. 6 (2021) 2150238 (13 pages)c© The Author(s)DOI: 10.1142/S0218348X21502388
COMPLEXITY-BASED EVALUATION OF THECORRELATION BETWEEN HEART AND BRAIN
RESPONSES TO MUSIC
TISARA KUMARASINGHE,∗ ONDREJ KREJCAR,†,‡ ALI SELAMAT,†,‡,§NORAZRYANA MAT DAWI,¶,‡‡,¶¶ ENRIQUE HERRERA-VIEDMA,‖,∗∗
ROBERT FRISCHER†† and HAMIDREZA NAMAZI∗,†,§§,¶¶∗School of Engineering, Monash University
Subang Jaya, Malaysia†Faculty of Informatics and ManagementCenter for Basic and Applied Research
University of Hradec Kralove, Hradec Kralove, Czechia‡Malaysia Japan International Institute of Technology (MJIIT )
Universiti Teknologi Malaysia, Kuala Lumpur, Malaysia§Media and Games Center of Excellence (MagicX )
Universiti Teknologi MalaysiaJohor Bahru, Malaysia
¶Sunway University Business School, Sunway UniversitySubang Jaya, Malaysia
‖Andalusian Research Institute in Data Science andComputational Intelligence
University of Granada, Granada, Spain∗∗Department of Electrical and Computer Engineering
Faculty of Engineering, King Abdulaziz UniversityJeddah, Saudi Arabia
¶¶Corresponding authors.
This is an Open Access article published by World Scientific Publishing Company. It is distributed under the terms of theCreative Commons Attribution-NonCommercial-NoDerivatives 4.0 (CC BY-NC-ND) License which permits use, distributionand reproduction, provided that the original work is properly cited, the use is non-commercial and no modifications oradaptations are made.
2150238-1
Frac
tals
202
1.29
. Dow
nloa
ded
from
ww
w.w
orld
scie
ntif
ic.c
omby
UN
IVE
RSI
DA
D D
E G
RA
NA
DA
on
10/0
6/21
. Re-
use
and
dist
ribu
tion
is s
tric
tly n
ot p
erm
itted
, exc
ept f
or O
pen
Acc
ess
artic
les.

September 8, 2021 16:43 0218-348X 2150238
T. Kumarasinghe et al.
††Institute of Technology and Business in Ceske BudejoviceCeske Budejovice, Czechia
‡‡[email protected]§§[email protected]
Received May 28, 2021Accepted July 20, 2021
Published August 23, 2021
AbstractThe evaluation of the correlation between the activations of various organs has great impor-tance. This work investigated the synchronization of the brain and heart responses to differentauditory stimuli using complexity-based analysis. We selected three pieces of music based on thedifference in the complexity of embedded noise (including white noise, brown noise, and pinknoise) in them. We played these pieces of music for 11 subjects (7 M and 4 F) and computedthe fractal dimension and sample entropy of EEG signals and R–R time series [as heart ratevariability (HRV)]. We found strong correlations (r = 0.9999 in the case of fractal dimensionand r = 0.7862 in the case of sample entropy) among the complexities of EEG signals and HRV.This finding demonstrates the synchronization of the brain and heart responses and auditorystimuli from the complexity perspective.
Keywords : Heart; Heart Rate Variability (HRV); Brain; EEG Signals; Complexity; FractalDimension; Sample Entropy; Music.
1. INTRODUCTION
Physiological systems are very complex under neu-ral regulatory mechanisms.1 Although the natureof the underlying control mechanisms is not fullyunderstood, however, it is very important to quan-tify the coupling between the changes in differentorgans versus the alterations in brain activity. Sincethe chemical and structural entities in the brainwhich control the heart rate are known, it is ofinterest whether this relationship can also be seenin the synchronization of the brain and heart activ-ity. Some researchers evaluated the coupling amongthe alterations of heart rate variability (HRV) andEEG signals employing the same method (e.g. FastFourier Transform,2 multiscale entropy,3 informa-tion theory4). On the other hand, some researchersinvestigated the alterations of EEG signals andHRV using different techniques.5–8 Besides, somestudies examined the variations in heart activityversus brain activity recorded using other methodssuch as fMRI.9 However, there has not been anywork that analyzed the synchronization of HRV,EEG signals, and stimuli employing the same tech-nique. EEG signals and R–R time series (HRV) have
complex structures.10,11 On the other hand, sounds(as auditory stimuli) also have complex structures.Therefore, the fractal theory can investigate thecoupling of EEG and ECG signals versus the alter-ations of the sound (as auditory stimuli).
In general, fractals have repeating patterns thatare distributed on various scales inside them.The fractal dimension quantifies the complexityof fractals.12 Many works applied fractal theoryto quantify the complexity of various biomedicaland bio-signals (e.g. EMG signals,13 GSR signals,14
random genome walks,15,16 speech signals17) andimages (e.g. X-ray images18).
Specifically, some researchers investigated thecomplex structure of EEG signals using fractal the-ory. The works that quantified the alterations inEEG signals’ complexity in external stimulation,19
walking,20 aging,21 and brain diseases22 are worthyof being mentioned. We can also call some studiesthat applied fractal theory to investigate the varia-tions of the complex structure of HRV. The studiesthat evaluated the changes in HRV in normal sub-jects of different ages,23 for the prediction of cardiacdeath,24 to investigate the effect of pharmacological
2150238-2
Frac
tals
202
1.29
. Dow
nloa
ded
from
ww
w.w
orld
scie
ntif
ic.c
omby
UN
IVE
RSI
DA
D D
E G
RA
NA
DA
on
10/0
6/21
. Re-
use
and
dist
ribu
tion
is s
tric
tly n
ot p
erm
itted
, exc
ept f
or O
pen
Acc
ess
artic
les.

September 8, 2021 16:43 0218-348X2150238
Evaluation of the Correlation Between Heart and Brain Activities
adrenergic and vagal modulation,25 during non-REM sleep,26 in patients with the peripheral arte-rial disease,27 diabetes,28 and Chronic ObstructivePulmonary Disease (COPD)29 can be mentioned.
Similarly, other nonlinear analysis methods canbe utilized to study the complexity of EEG signals,HRV, and sound. In this research, we chose sampleentropy for our analysis. The reason for choosingsample entropy is because it is independent of thelength of data and works well in the case of datawith short lengths.30 Since the extracted R–R timeseries for different subjects were short and had dif-ferent lengths, calculating the sample entropy helpsus verify the fractal analysis results. Sample entropyhas been applied widely for the analysis of variousbiomedical and biological time series (e.g. EMG sig-nals,31 speech signals,32 random genome walks,33
PCG signals34). We can also call several studiesthat employed sample entropy to evaluate EEG sig-nals35–37 and HRV.38–40
Since no study has investigated the correlationamong the complexity of HRV, EEG signals, andexternal stimuli, we apply fractal theory and sampleentropy to investigate this synchronization from thecomplexity point of view.
In the following section, we explain our method ofanalysis based on fractal theory and sample entropy.Then, we present the data collection and analysissteps. After that, we will bring the results whichwill be followed by the conclusion and discussion.
2. METHOD
In this study, we want to evaluate the synchro-nization of heart and brain activities. To examinethis correlation in different conditions, we stimu-late subjects using various music as auditory stim-uli. We benefit from the complexity concept asour method of analysis to investigate the correla-tion between the variations of heart rate and brainsignals and also the complexity of auditory stim-uli. Since R–R time series, EEG signals, and audiosignals have complex structures, we utilize fractaltheory to investigate how their complexities arerelated. We calculate the fractal dimension of EEGsignals and HRV, and in this way, we relate theircomplexities. It is known that bigger values of frac-tal exponent indicate greater complexities.41
There have been similar developed techniques forthe calculation of the fractal dimension.42 In thisresearch, we employ the box-counting method forour analysis. In this technique, an object is covered
with boxes in different steps, where all boxes havethe same size (ε) in each step.43 The calculationalgorithm counts the number of used boxes (N) forcoverage of the object in each step, and in the laststep, it calculates the fractal dimension using thefollowing equation44:
FD = limε→0
log N(ε)log 1/ε
. (1)
The general form of fractal dimension of order c isformulated as follows:
FDc = limε→0
1c − 1
log∑N
j=1 rcj
log ε, (2)
where rj indicates the probability of occurrence:
rj = limT→∞
tjT
, (3)
where tj and T , respectively, indicate the time inthe jth bin and whole signals.
In this research, we also employ sample entropyto verify the fractal analysis results. Sample entropycan be used to quantify the complexity of sig-nals. Its main characteristic is its independencefrom the data length.45 Since the recorded ECGsignals from different subjects lead to R–R timeseries with different lengths, sample entropy canovercome this bias (which can affect the calcu-lation). For a signal, {y(1), y(2), y(3), . . . , y(n)},a template vector of length z can be definedas Yz(i) = {y, yi+1, yi+2, . . . , yi+z−1}. The sampleentropy (SamEn) is formulated as follows:
SamEn = −logB
C. (4)
Considering the distance function, d[Yz(i), Yz(j)](i �= j) as Chebyshev distance and ε as the tolerance(0.2×standard deviation of data), B and C indicatethe number of template vector pairs with conditionsin (5) and (6), respectively.
d[Yz+1(i), Yz+1(j)] < ε, (5)
d[Yz(i), Yz(j)] < ε. (6)
As previously mentioned, we also would like tobring the complexity of music (as auditory stimuli)to our analysis. Therefore, we chose three pieces ofmusic with different complexities. These music fileswere obtained from Ref. 46. Hunt et al.46 embed-ded different noises with different levels of complex-ity to the Fur Elise song to change its complexityand create three new pieces of music with variouscomplexities. The noises include white noise, pinknoise, and brown noise with the fractal exponent
2150238-3
Frac
tals
202
1.29
. Dow
nloa
ded
from
ww
w.w
orld
scie
ntif
ic.c
omby
UN
IVE
RSI
DA
D D
E G
RA
NA
DA
on
10/0
6/21
. Re-
use
and
dist
ribu
tion
is s
tric
tly n
ot p
erm
itted
, exc
ept f
or O
pen
Acc
ess
artic
les.

September 8, 2021 16:43 0218-348X2150238
T. Kumarasinghe et al.
Table 1 Fractal Dimension and Sample Entropyof Noises.46
Noise Fractal Exponent Sample Entropy
White noise 1.5 2.2Pink noise 1 1.75Brown noise 0.5 0.25
and sample entropy listed in Table 1. As this tableshows, the fractal dimension and sample entropy ofnoises decrease from white to brown noise, whichindicates the reduction in their complexities. Forfurther information about the generation of noisesand taken procedures for embedding the noises tothe base music, refer Ref. 46.
We play the music files for subjects and theninvestigate the correlation of the complexities ofHRV and EEG signals.
3. DATA COLLECTION ANDANALYSIS
Monash University’s ethics committee approved theexperiment (No. 17454). Eleven students (7 M and4F, 18–22 years old) have attended the experi-ment. They did not drink alcohol/caffeine beforethe experiment. Subjects signed the informed con-sent form and agreed to participate. The experimenthas been done in an isolated room from external dis-turbances.
After obtaining the consent form, we initiated thedata collection while participants sat comfortablyon a chair. We collected EEG and ECG signals usingMuse EEG and Shimmer ECG devices at 256 and128 Hz. The EEG electrodes placement (based onthe 10–20 system) is shown in Fig. 1. Besides, onereference (V) and four recording (LA, RA, LL, RL)electrodes of the ECG device were connected to thesubject’s chest under his/her shirt. Figure 2 showsthe placement of ECG electrodes.
Initially, we recorded the signals during rest for3min. Then, we played the first, second, and thirdmusic. Each music was played for 3 min with consid-ering 1-min rest among different music. We re-ranthe data collection in another session.
Out of 88 sets of recorded data from 11 sub-jects in four conditions (rest and different stimuli),some recorded data have been removed from pro-cessing due to disconnection (or low connection)of recording devices in some periods. First, ourdeveloped code in MATLAB (MathWorks, USA)
Fig. 1 The placement of EEG electrodes.
Fig. 2 The placement of ECG electrodes.
selected R peaks of ECG signals. Then, it gener-ated the R–R interval time series from extractedR peaks. We checked the extracted R peaks visu-ally for better accuracy. A sample raw ECG signalwith extracted R peaks and its R–R time series areshown in Figs. 3a and 3b, respectively.
Since auditory stimuli play a major role in chang-ing the brain’s activity, in this research, we onlyanalyzed the brain’s reaction to these stimuli byanalysis of the recorded EEG signals from TP9 andTP10 electrodes. This selection is due to the posi-tions of these electrodes that are closest to the audi-tory cortex.
After removing the DC offset, we filtered therecorded EEG signals employing a fourth-order
2150238-4
Frac
tals
202
1.29
. Dow
nloa
ded
from
ww
w.w
orld
scie
ntif
ic.c
omby
UN
IVE
RSI
DA
D D
E G
RA
NA
DA
on
10/0
6/21
. Re-
use
and
dist
ribu
tion
is s
tric
tly n
ot p
erm
itted
, exc
ept f
or O
pen
Acc
ess
artic
les.

September 8, 2021 16:43 0218-348X2150238
Evaluation of the Correlation Between Heart and Brain Activities
(a) Sample ECG signal with the extracted R peaks.
(b) Sample generated R–R time series from the ECG signal (a).
Fig. 3 Sample raw ECG signal (a) and R–R time series (b).
Butterworth band-pass filter (1–40 Hz). A samplefiltered EEG signal (1 min) and its frequency infor-mation [using a periodogram power spectral density(PSD) estimate] during rest is shown in Fig. 4.
We computed the fractal dimension and sam-ple entropy of EEG signals and R–R time series.The box-counting algorithm was ran using box sizes1/2, 1/4, 1/8, 1/16, . . . . All the analyses were con-ducted in MATLAB.
We checked the normality of the fractal dimen-sion and sample entropy of the R–R time seriesand filtered EEG signals by running the Anderson–Darling test in MATLAB. In the case of differentgroups of data, the test’s result indicates a failureto reject the null hypothesis. In other words, thedata had normal distributions.
We checked the significance of variations of thecomplexity of signals by running the ANOVA test
(α = 0.05). We also conducted pairwise compar-isons by running the post-hoc Tukey test and effectsize analysis (α = 0.05). We should note that wecomputed Cohen’s d as the effect size. We quanti-fied the correlation between the variations of com-plexities of EEG signals, HRV, and music using thePearson correlation coefficient.
4. RESULT
Figure 5 shows the mean fractal dimension of EEGsignals (a) and added noises to the music files (b).
As shown in Fig. 5a, EEG signals obtained thesmallest fractal dimension while subjects rest. TheEEG signals’ fractal dimension increases in responseto the first music, which is because of the suddenreaction of the resting brain to the music. How-ever, it decreases by playing the second and third
2150238-5
Frac
tals
202
1.29
. Dow
nloa
ded
from
ww
w.w
orld
scie
ntif
ic.c
omby
UN
IVE
RSI
DA
D D
E G
RA
NA
DA
on
10/0
6/21
. Re-
use
and
dist
ribu
tion
is s
tric
tly n
ot p
erm
itted
, exc
ept f
or O
pen
Acc
ess
artic
les.
September 8, 2021 16:43 0218-348X2150238
T. Kumarasinghe et al.
(a)
(b)
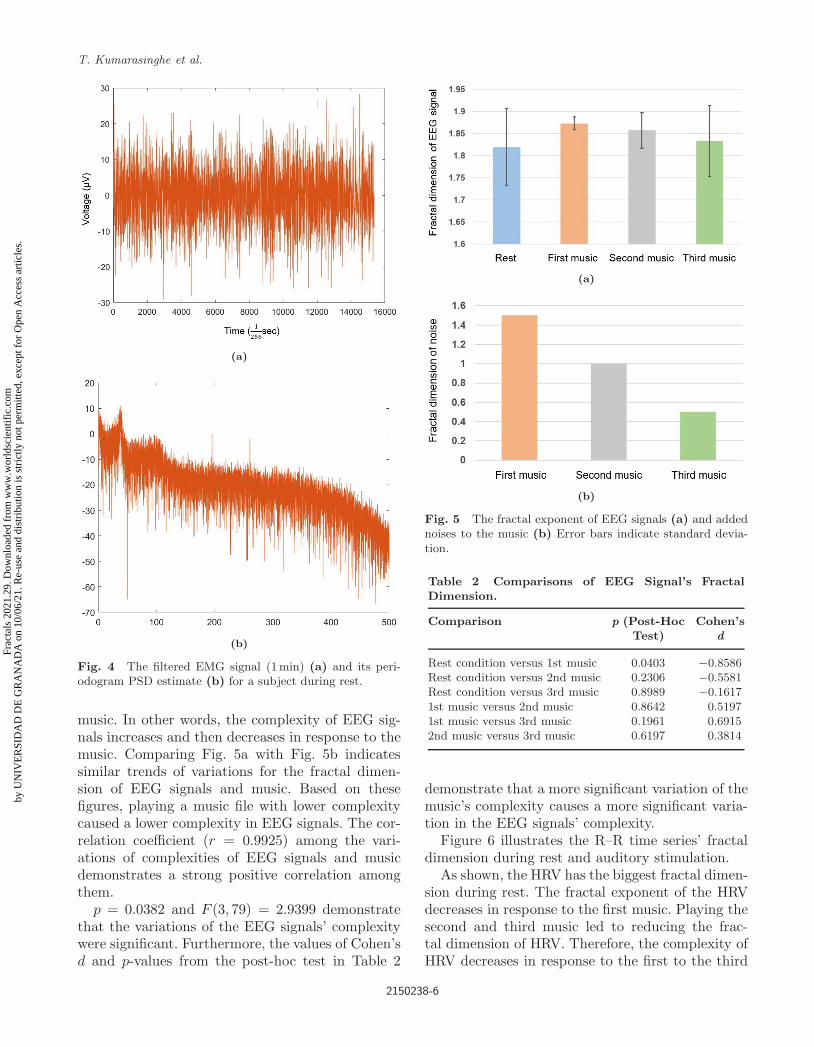
Fig. 4 The filtered EMG signal (1min) (a) and its peri-odogram PSD estimate (b) for a subject during rest.
music. In other words, the complexity of EEG sig-nals increases and then decreases in response to themusic. Comparing Fig. 5a with Fig. 5b indicatessimilar trends of variations for the fractal dimen-sion of EEG signals and music. Based on thesefigures, playing a music file with lower complexitycaused a lower complexity in EEG signals. The cor-relation coefficient (r = 0.9925) among the vari-ations of complexities of EEG signals and musicdemonstrates a strong positive correlation amongthem.
p = 0.0382 and F (3, 79) = 2.9399 demonstratethat the variations of the EEG signals’ complexitywere significant. Furthermore, the values of Cohen’sd and p-values from the post-hoc test in Table 2
(a)
(b)
Fig. 5 The fractal exponent of EEG signals (a) and addednoises to the music (b) Error bars indicate standard devia-tion.
Table 2 Comparisons of EEG Signal’s FractalDimension.
Comparison p (Post-Hoc Cohen’sTest) d
Rest condition versus 1st music 0.0403 −0.8586Rest condition versus 2nd music 0.2306 −0.5581Rest condition versus 3rd music 0.8989 −0.16171st music versus 2nd music 0.8642 0.51971st music versus 3rd music 0.1961 0.69152nd music versus 3rd music 0.6197 0.3814
demonstrate that a more significant variation of themusic’s complexity causes a more significant varia-tion in the EEG signals’ complexity.
Figure 6 illustrates the R–R time series’ fractaldimension during rest and auditory stimulation.
As shown, the HRV has the biggest fractal dimen-sion during rest. The fractal exponent of the HRVdecreases in response to the first music. Playing thesecond and third music led to reducing the frac-tal dimension of HRV. Therefore, the complexity ofHRV decreases in response to the first to the third
2150238-6
Frac
tals
202
1.29
. Dow
nloa
ded
from
ww
w.w
orld
scie
ntif
ic.c
omby
UN
IVE
RSI
DA
D D
E G
RA
NA
DA
on
10/0
6/21
. Re-
use
and
dist
ribu
tion
is s
tric
tly n
ot p
erm
itted
, exc
ept f
or O
pen
Acc
ess
artic
les.

September 8, 2021 16:43 0218-348X2150238
Evaluation of the Correlation Between Heart and Brain Activities
Fig. 6 R–R time series’ fractal dimension. Error bars indi-cate standard deviation.
music. Since the heart has less reaction to the musiccompared to the brain, therefore, we cannot see anyincrement in the complexity of HRV after playingthe first music for subjects. Comparing Fig. 6 withFig. 5b indicates similar trends of variations for thefractal dimension of HRV and the fractal dimen-sion of noises in the music. Based on these figures,playing a music file with lower complexity causeda lower complexity in HRV. The correlation coeffi-cient (r = 0.9951) between the changes of the com-plexity for HRV and music demonstrates a strongcorrelation among them.
Furthermore, comparing the complexities of HRV(Fig. 6) and EEG signals (Fig. 5a) demonstratessimilar trends in the case of stimulations. In otherwords, the changes in brain and heart responsesto music are correlated; playing music with highercomplexity causes higher complexity in EEG sig-nals and HRV. In addition, the correlation coeffi-cient (r = 0.9999) states a strong correlation amongthe complexities of EEG signals and R–R timeseries. This finding demonstrates the synchroniza-tion among heart and brain responses.
p = 0.4597 and F (3, 79) = 0.8712 indicate thatthe alterations in the complexity of HRV wereinsignificant. This result was expected since, in gen-eral, the heart has less reaction to the music com-pared to the brain, which is the main processingunit of the body (and showed a significant responseto the music). The effect sizes in Table 3 statethat a more significant change in the music’s com-plexity causes a more significant alteration in theHRV’s complexity. Furthermore, the post-hoc testfindings in this table demonstrate no significant dif-ference in the complexity of the R–R time seriesbetween different conditions. As can be seen, mak-ing a larger alteration in music’s complexity causes
Table 3 Comparisons of R–R Time Series’ FractalDimension.
Comparison p (Post-Hoc Cohen’sTest) d
Rest condition versus 1st music 0.8276 0.2698Rest condition versus 2nd music 0.6678 0.3251Rest condition versus 3rd music 0.4102 0.49071st music versus 2nd music 0.9927 0.08421st music versus 3rd music 0.9072 0.22992nd music versus 3rd music 0.9791 0.1204
a more significant alteration in R–R time series’complexity. In this research, we look for the cou-pling among the changes in the complexity of EEGsignals and HRV, not the significance of variationsin response to different music. The difference inthe complexity of HRV between different groupscould become significant if we change the tempoand specifically the volume of different music. How-ever, to make the experiment pleasant for the par-ticipants, we kept the volume low.
As was mentioned previously, since the HRV ofsubjects had various lengths, to verify the frac-tal analysis results, we also computed the sampleentropy of EEG signals and R–R time series in var-ious conditions. Figure 7 illustrates the EEG sig-nals’ sample entropy (a) and the sample entropy ofadded noises to music files (b).
As can be seen in Fig. 7a, during rest, EEG sig-nals had the smallest sample entropy. By playingthe first music, the EEG signals’ entropy increases.By playing second and third music for participants,the EEG signals’ entropy decreases. Therefore, EEGsignals’ complexity increases in response to the firstmusic. As was indicated, this result is due to thesudden reaction of the resting brain to the music.After that, by playing other music files to sub-jects, the complexity of their EEG signals decreases.Comparing Fig. 7a with Fig. 7b indicates simi-lar trends of variations. The correlation coefficient(r = 0.9968) indicates a strong correlation betweenthe complexities of EEG signals and music. There-fore, like the fractal analysis results, the alterationsin the complexities of EEG signals and music aresynchronized.
p = 0.0143 and F (3, 79) = 3.7434 state the sig-nificant variations in the EEG signals’ entropy. Theeffect sizes and p-values from the post-hoc test inTable 4 demonstrate that a more significant varia-tion in the music’s complexity causes a more signif-icant change in the EEG signals’ complexity.
2150238-7
Frac
tals
202
1.29
. Dow
nloa
ded
from
ww
w.w
orld
scie
ntif
ic.c
omby
UN
IVE
RSI
DA
D D
E G
RA
NA
DA
on
10/0
6/21
. Re-
use
and
dist
ribu
tion
is s
tric
tly n
ot p
erm
itted
, exc
ept f
or O
pen
Acc
ess
artic
les.

September 8, 2021 16:43 0218-348X2150238
T. Kumarasinghe et al.
(a)
(b)
Fig. 7 The sample entropy of EEG signals (a) and addednoises to the music (b) Error bars indicate standard devia-tion.
Table 4 Comparisons of the EEG Signals’ SampleEntropy.
Comparison p (Post-Hoc Cohen’sTest) d
Rest condition versus 1st music 0.0347 −0.8006Rest condition versus 2nd music 0.0812 −0.6830Rest condition versus 3rd music 0.9523 −0.12011st music versus 2nd music 0.9866 0.28791st music versus 3rd music 0.1261 0.81452nd music versus 3rd music 0.2447 0.6626
Figure 8 illustrates the sample entropy ofthe R–R time series during rest and auditorystimulation.
According to the result, the R–R time series hadthe biggest sample entropy during the rest. As canbe seen, the entropy of HRV decreased in responseto the first music. Similarly, the sample entropy ofHRV decreased when we played second and thirdmusic for subjects, which means reductions in thecomplexity of HRV. As was stated previously, sincethe heart has less reaction to the music compared to
Fig. 8 The sample entropy of the R–R time series. Errorbars indicate standard deviation.
Table 5 Comparisons of the Sample Entropy ofR–R Time Series.
Comparison p (Post-Hoc Cohen’sTest) d
Rest condition versus 1st music 0.9958 0.0665Rest condition versus 2nd music 0.9636 0.1586Rest condition versus 3rd music 0.9414 0.17881st music versus 2nd music 0.9947 0.07521st music versus 3rd music 0.9875 0.09662nd music versus 3rd music 0.9991 0.0267
the brain, therefore, we cannot see any increment inthe complexity of HRV after playing the first musicfor subjects. Comparing Fig. 8 with Figs. 7a and 7bin the case of stimulations indicates similar trendsof variations for the entropy (complexity) of HRV,EEG signals, and the music. The correlation coef-ficient (r = 0.8324) indicates a strong correlationamong the complexities of HRV and music. Further-more, the correlation coefficient (r = 0.7862) indi-cates a strong synchronization between the sampleentropies of EEG signals and HRV.
p = 0.9410 and F (3, 79) = 0.1317 indicate thatthe changes of the complexity of HRV were insignif-icant. The effect sizes in Table 5 state that amore significant alteration in the music’s complex-ity causes a more significant alteration in the com-plexity of the R–R time series. Furthermore, thep-values in this table indicate no significant differ-ence in the complexity of the HRV among variousconditions. As can be seen, making a larger alter-ation in the music’s complexity causes a more signif-icant alteration in the R–R time series’ complexity.As previously mentioned, we look for the couplingamong the changes in the complexity of EEG signalsand HRV, not the significance of their variations inresponse to different music.
2150238-8
Frac
tals
202
1.29
. Dow
nloa
ded
from
ww
w.w
orld
scie
ntif
ic.c
omby
UN
IVE
RSI
DA
D D
E G
RA
NA
DA
on
10/0
6/21
. Re-
use
and
dist
ribu
tion
is s
tric
tly n
ot p
erm
itted
, exc
ept f
or O
pen
Acc
ess
artic
les.

September 8, 2021 16:43 0218-348X2150238
Evaluation of the Correlation Between Heart and Brain Activities
Therefore, the results of the sample entropy ofEEG signals and HRV verified the results of thefractal analysis. Overall, our findings show that theheart and brain responses to auditory stimuli aresynchronized.
5. DISCUSSION
We evaluated the coupling among brain and heartactivities by assessing the complexity of their phys-iological signals. For this purpose, three pieces ofmusic with different levels of complexity were playedfor the participants. We quantified the complexityof EEG signals and R–R time series using fractaltheory. Besides, we analyzed the sample entropy ofthese signals to verify the fractal analysis results.
According to the findings, when we stimulatesubjects, EEG signals’ complexity increased. Thisincrease is related to the sudden reaction of thebrain to music.47 Besides, making a bigger decreasein the music’s complexity caused a bigger decreasein the EEG signals’ complexity. Analysis of thecomplexity of the R–R time series showed that itdecreased in response to the music. This result ispotentially due to the lower reaction of the heartthan the brain to external stimuli.48 Applying abigger decrease in the music’s complexity causeda bigger decrease in the complexity of HRV. Sta-tistical analyses also supported these results. Fur-thermore, a strong positive correlation was obtainedamong the changes of the EEG signals and HRV inresponse to stimulations.
In this study, we observed that the complexity ofEEG signals increased due to listening to the firstmusic, whereas the complexity of HRV decreased.We mentioned that this behavior is potentially dueto the reaction of the resting brain to a stimulusthat causes a bigger change in the complexity ofEEG signals. On the other hand, since the heart hasless reaction to the music compared to the brain,therefore, we cannot see any increment in the com-plexity of HRV after playing the first music for sub-jects. In fact, the increment in the EEG signals’complexity or decrement in the complexity of HRVdue to the first music is dependent on the tempo,type, and volume of the music. We can find stud-ies that found increases in the EEG signals’ com-plexity in response to music (auditory stimuli).49 Incontrast, some works stated that the EEG signals’complexity decreases in response to the auditorystimulation using music.50 It should be noted that
this behavior is not limited to EEG signals. We canfind some works that investigated the fractal dimen-sion of HRV in response to auditory stimuli. Forinstance, the reported results on decrement51 andincrement52 of the fractal dimension of HRV sig-nals in response to auditory stimulation comparedto the rest condition are worthy of being mentioned.Therefore, this behavior of variations of complexitycompared to the rest does not indicate the weak-ness of the fractal dimension and sample entropy inquantifying the complexity of signals.
Besides, the changes in the complexity of EEGsignals can be verified by comparing them to otherstudies. As an example, in Ref. 53, it was shown thatpresenting a visual stimulus increases the complex-ity of EEG signals, and by increasing the complex-ity of visual stimuli, the complexity of EEG signalsincreases. A similar trend was observed in anotherresearch54 for the application of olfactory stimuliwith increasing complexities.
Therefore, the alterations in the responses of theheart and brain and applied auditory stimuli arecorrelated. Our methodology (simultaneous appli-cation of fractal theory and sample entropy) is onestep forward compared to the works55–57 that onlyfocused on employing techniques that are depen-dent on the length of data, without considering thatthe HRVs of subjects may have different lengthseven for the same duration of data recording, andit can affect the results.
When we listen to a piece of music, ERPs cap-ture electrical responses in the cortex due to thestimulus. Then, ANS will communicate with thecardiac system. When the heart’s intrinsic nervoussystem processed the information, signals are trans-ferred to the heart’s sinoatrial node and other tis-sues in the heart. Although the exact descendingpathway responsible for the autonomic and cardio-vascular effects of auditory stimulation with musicalauditory stimulation remain to be determined, how-ever, the neural connection between the hypotha-lamic tuberomammillary nucleus (TMN) and thesuprachiasmatic nucleus (SCN) could be a partof the neural pathway. The details of the mech-anism are not certain, and further study will beneeded.
In Ref. 58, we have shown that the Hurst expo-nents of EEG signals and auditory stimuli varytogether. Due to the direct relationship59 betweenthe Hurst exponent (H) and fractal dimension oftime series, F = 2−H, the fractal dimension of EEG
2150238-9
Frac
tals
202
1.29
. Dow
nloa
ded
from
ww
w.w
orld
scie
ntif
ic.c
omby
UN
IVE
RSI
DA
D D
E G
RA
NA
DA
on
10/0
6/21
. Re-
use
and
dist
ribu
tion
is s
tric
tly n
ot p
erm
itted
, exc
ept f
or O
pen
Acc
ess
artic
les.

September 8, 2021 16:43 0218-348X2150238
T. Kumarasinghe et al.
signals and auditory stimuli vary together. Since theheart activity is controlled by the brain, the trendof the changes of the complexities of EEG signalsand auditory stimuli is reflected in the variations ofthe complexity of HRV and auditory stimuli.
In this study, we considered three music withthe same base. However, in further studies, we caninvestigate the coupling between heart and brainactivities in the case of other types of music withouta similar base. We can further evaluate this couplingin the case of other stimuli. As an example, we canpresent different olfactory stimuli with various com-plexities to subjects and then investigate how thecomplexities of EEG signals, R–R time series, andstimuli are correlated. We can also evaluate the cou-pling among other organs (e.g. skin) and the braindue to stimulation. Since the human body is con-trolled by the brain, we expect to see similar syn-chronizations.
We can conduct similar investigations on patientswith heart [e.g. coronary artery disease (CAD)60]and brain (e.g. Epilepsy61) disorders. Therefore,we can discover the heart–brain synchronizationwhen these organs have disorders that affected theiractivities. Modeling the relationship between HRVand EEG signals versus stimuli is another potentialfuture work that can help for the prediction of HRVbased on the influence of stimuli on brain activity.To do this, we can potentially benefit from math-ematical modeling (e.g. fractional diffusion equa-tions62–66) and computational analysis.67–69
This study analyzed the interaction between thebrain and heart. Besides correlation with the brain,different organs also interact.70 Therefore, we canpotentially extend our investigation and analyzethe complex structures of different biosignals (e.g.EMG, ECG signals). Overall, all these studies canhelp researchers decode the relationship amongdifferent organs’ activities versus brain activities,which significantly impact health sciences.
ACKNOWLEDGMENTS
This work was supported in part by Long-TermConceptual Development of Research Organizationat Institute of Technology and Business in CeskeBudejovice (2021), Project (2021/2204), GrantAgency of Excellence, University of Hradec Kralove,Faculty of Informatics and Management, CzechRepublic; and by the Spanish Ministry of Sciencewith the FEDER financing of Project PID2019-103880RB-I00.
REFERENCES
1. A. Bashan et al., Network physiology reveals rela-tions between network topology and physiologicalfunction, Nat. Commun. 3 (2012) 702.
2. H. Abdullah, Correlation of sleep EEG frequencybands and heart rate variability, in 31st AnnualInternational Conference of the IEEE EMBS Min-neapolis, Minnesota, USA, 2–6 September 2009, pp.5014–5017.
3. P. F. Lin et al., Correlations between the signal com-plexity of cerebral and cardiac electrical activity: Amultiscale entropy analysis, PLoS One 9(2) (2014)e87798.
4. L. Faes, G. Nollo, F. Jurysta and D. Marinazzo,Information dynamics of brain–heart physiologicalnetworks during sleep, New J. Phys. 16 (2014)105005.
5. E. Ali et al., Heart–brain interactions shapesomatosensory perception and evoked potentials,Proc. Natl. Acad. Sci. USA 117(19) (2020) 10575–10584.
6. G. Alba et al., The relationship between heart ratevariability and electroencephalography functionalconnectivity variability is associated with cognitiveflexibility, Front. Hum. Neurosci. 13 (2019) 64.
7. D.-O. Won et al., Alteration of coupling betweenbrain and heart induced by sedation with propofoland midazolam, PLoS One 14(7) (2019) e0219238.
8. T. Chalmers et al., Impact of acute stress on corticalelectrical activity and cardiac autonomic coupling,J. Integr. Neurosci. 19(2) (2020) 239–248.
9. D. G. Weissman et al., Tuning of brain-autonomiccoupling by prior threat exposure: Implicationsfor internalizing problems in Mexican-origin ado-lescents, Dev. Psychopathol. 31(3) (2019) 1127–1141.
10. M. H. Babini, V. V. Kulish and H. Namazi, Phys-iological state and learning ability of students innormal and virtual reality conditions: Complexity-based analysis, J. Med. Internet Res. 22(6) (2020)e17945.
11. H. Namazi, D. Baleanu and O. Krejcar, Age-basedanalysis of heart rate variability (HRV) for patientswith congestive heart failure, Fractals 29(3) (2021)2150135.
12. M. O. Qardi and H. Namazi, Fractal-based analy-sis of the relationship between the surface finish ofworkpiece and chip formation in milling operation,Fractals 28(6) (2020) 2050099.
13. M. Soundirarajan et al., Analysis of brain-facialmuscle connection in the static fractal visual stim-ulation, Int. J. Imaging Syst. Technol. 31(2) (2021)548–554.
14. H. Namazi, D. Baleanu, S. Omam and O. Krejcar,Analysis of the correlation between brain and skin
2150238-10
Frac
tals
202
1.29
. Dow
nloa
ded
from
ww
w.w
orld
scie
ntif
ic.c
omby
UN
IVE
RSI
DA
D D
E G
RA
NA
DA
on
10/0
6/21
. Re-
use
and
dist
ribu
tion
is s
tric
tly n
ot p
erm
itted
, exc
ept f
or O
pen
Acc
ess
artic
les.

September 8, 2021 16:43 0218-348X2150238
Evaluation of the Correlation Between Heart and Brain Activities
reactions to different types of music, Fractals 29(2)(2021) 2150124.
15. H. Namazi and N. B. Mat Dawi, Information andcomplexity-based analysis of the variations of thecoronavirus genome between different countries,Fractals 28(7) (2020) 2050134.
16. H. Namazi, O. Krejcar and A. Subasi, Complexityand information-based analysis of the variations ofthe SARS-CoV-2 genome in the United States ofAmerica (USA), Fractals 28(7) (2020) 2150023.
17. M. R. A. Ahamed, M. H. Babini and H. Namazi,Complexity-based decoding of the relation betweenhuman voice and brain activity, Technol. HealthCare 28(6) (2020) 665–674.
18. H. Namazi and V. V. Kulish, Complexity-based clas-sification of the coronavirus disease (COVID-19),Fractals 28(5) (2020) 2050114.
19. T. T. Gao et al., Detrended fluctuation analysis ofthe human EEG during listening to emotional music,J. Electron. Sci. Technol. 5 (2007) 272–277.
20. S. M. Kamal et al., Decoding of the relationshipbetween human brain activity and walking paths,Technol. Health Care 28(4) (2020) 381–390.
21. F. Zappasodi et al., Age-related changes in elec-troencephalographic signal complexity, PLoS One10(11) (2015) e0141995.
22. T. Takahashi et al., Atypical temporal-scale-specificfractal changes in Alzheimer’s disease EEG andtheir relevance to cognitive decline, Cogn. Neurodyn.13(1) (2019) 1–11.
23. U. Rajendra Acharya et al., Heart rate analysis innormal subjects of various age groups, Biomed. Eng.Online 3 (2004) 24.
24. T. H. Makikallio et al., Prediction of sudden cardiacdeath by fractal analysis of heart rate variability inelderly subjects, J. Am. Coll. Cardiol. 37(5) (2001)1395–1402.
25. M. P. Tulppo et al., Effects of pharmacologicaladrenergic and vagal modulation on fractal heartrate dynamics, Clin. Physiol. 21(5) (2001) 515–523.
26. F. Togo and Y. Yamamoto, Decreased fractal com-ponent of human heart rate variability during non-REM sleep, Am. J. Physiol. Heart Circ. Physiol.280(1) (2001) H17–H21.
27. K. T. Utriainen et al., Alterations in heart ratevariability in patients with peripheral arterial dis-ease requiring surgical revascularization have limitedassociation with postoperative major adverse car-diovascular and cerebrovascular events, PLoS One13(9) (2018) e0203519.
28. N. P. Chau et al., Fractal dimension of heart rateand blood pressure in healthy subjects and in dia-betic subjects, Blood Press. 2(2) (1993) 101–107.
29. G. D’Addio, A. Accardo, G. Corbi and F. Rengo,Fractal analysis of heart rate variability in COPDpatients, in 11th Mediterranean Conference on Med-ical and Biomedical Engineering and Computing2007. IFMBE Proceedings, eds. T. Jarm, P. Kramarand A. Zupanic, Vol. 16 (Springer, Berlin, 2007), pp.78–81.
30. J. M. Yentes et al., The appropriate use of approx-imate entropy and sample entropy with short datasets, Ann. Biomed. Eng. 41(2) (2013) 349–365.
31. M. Soundirarajan, E. Aghasian, O. Krejcar andH. Namazi, Complexity-based analysis of the cou-pling between facial muscle and brain activities,Biomed. Signal Process. 67 (2021) 102511.
32. H. Namazi, M. R. A. Ahamed, M. H. Babini andO. Krejcar, Analysis of the correlation betweenthe human voice and brain activity, Waves Ran-dom Complex Media (2021), doi:10.1080/17455030.2021.1921313.
33. H. Namazi, A. Selamat and O. Krejcar, Complexity-based analysis of the alterations in the structure ofcoronaviruses, Fractals 29(2) (2021) 2150123.
34. H. Namazi and O. Krejcar, Analysis of pregnancydevelopment by complexity and information-basedanalysis of fetal phonocardiogram (PCG) signals,Fluct. Noise Lett. 20 (2020) 2150031, doi:10.1142/S0219477521500280.
35. X. W. Wang et al., Sample entropy and surrogatedata analysis for Alzheimer’s disease, Math. Biosci.Eng. 16(6) (2019) 6892–6906.
36. L. H. Hasnaoui and A. Djebbari, Discrete wavelettransform and sample entropy-based EEG dimen-sionality reduction for electroencephalogram clas-sification, in 2019 International Conference onAdvanced Electrical Engineering (ICAEE), Algiers,Algeria, 2019, pp. 1–6, doi:10.1109/ICAEE47123.2019.9015166.
37. M. El Sayed Hussein Jomaa, A new approach tosample entropy of multi-channel signals: Applicationto EEG signals, in 2018 26th European Signal Pro-cessing Conference (EUSIPCO), Rome, 2018, pp.1945–1949, doi:10.23919/EUSIPCO.2018.8553095.
38. B. Shi et al., Nonlinear heart rate variabilitybiomarkers for gastric cancer severity: A pilot study,Sci. Rep. 9 (2019) 13833.
39. N. J. Napoli, Uncertainty in heart rate complexitymetrics caused by R-peak perturbations, Comput.Biol. Med. 103 (2018) 198–207.
40. M. Weippert et al., Sample entropy and traditionalmeasures of heart rate dynamics reveal differentmodes of cardiovascular control during low intensityexercise, Entropy 16(11) (2014) 5698–5711.
41. M. O. Qadr and H. Namazi, Decoding of the rela-tionship between complex structures of machined
2150238-11
Frac
tals
202
1.29
. Dow
nloa
ded
from
ww
w.w
orld
scie
ntif
ic.c
omby
UN
IVE
RSI
DA
D D
E G
RA
NA
DA
on
10/0
6/21
. Re-
use
and
dist
ribu
tion
is s
tric
tly n
ot p
erm
itted
, exc
ept f
or O
pen
Acc
ess
artic
les.

September 8, 2021 16:43 0218-348X2150238
T. Kumarasinghe et al.
surface and tool wear in milling operation, Fractals28(7) (2020) 2050104.
42. A. Ahamed et al., Complexity based analysis of theinfluence of machining parameters on the surfacefinish of drilled holes in drilling operation, Fractals27(6) (2019) 1950087.
43. C. L. Kiew et al., Fractal-based analysis of the rela-tion between the fractal structures of machined sur-face and tool wear in turning operation, Fractals27(6) (2019) 1950094.
44. K. Bissoonauth and H. Namazi, Complexity-baseddecoding of the effect of machining parameters onthe machined surface in milling operation, Fractals27(5) (2019) 1950076.
45. M. Soundirarajan et al., Evaluation of the correla-tion between facial muscle and brain activities inauditory stimulation, Fractals 29(1) (2021) 2150100.
46. N. Hunt, D. McGrath and N. Stergiou, The influenceof auditory-motor coupling on fractal dynamics inhuman gait, Sci. Rep. 4 (2015) 5879.
47. M. Hallett, Electrophysiologic evaluation of move-ment disorders, in Aminoff’s Electrodiagnosis inClinical Neurology, 6th edn. (Elsevier, 2012),pp. 437–453, Chap. 20.
48. S. Koelsch and L. Jancke, Music and the heart, Eur.Heart. J. 36(44) (2015) 3043–3049.
49. S. Sanyal et al., EEG study on the neural patterns ofbrain with music stimuli: An evidence of hysteresis?in International Seminar on Creating and Teach-ing Music Patterns, India, 16–18 December 2013,pp. 51–61.
50. J. Zhou et al., Pink noise: Effect on complexity syn-chronization of brain activity and sleep consolida-tion, J. Theor. Biol. 306 (2012) 68–72.
51. E. C. Martiniano et al., Musical auditory stimulusacutely influences heart rate dynamic responses tomedication in subjects with well-controlled hyper-tension, Sci. Rep. 8(1) (2018) 958.
52. A. Dey, Study the effect of music on HRV impulseusing multifractal DFA analysis, in 2014 Interna-tional Conference on Communication and SignalProcessing, Melmaruvathur, 2014, pp. 1338–1342,doi:10.1109/ICCSP.2014.6950067.
53. M. Soundirarajan et al., Decoding of the relation-ship between brain and facial muscle activities inresponse to dynamic visual stimuli, Fluct. NoiseLett. 19(4) (2020) 2050041.
54. S. Omam et al., Complexity-based decoding ofbrain-skin relation in response to olfactory stim-uli, Comput. Methods Prog. Biomed. 184 (2020)105293.
55. S. Villafaina et al., Effects of exergames on heartrate variability of women with fibromyalgia: Arandomized controlled trial, Sci. Rep. 10 (2020)5168.
56. R. S. Gomolka et al., Higuchi fractal dimension ofheart rate variability during percutaneous auricularvagus nerve stimulation in healthy and diabetic sub-jects, Front. Physiol. 9 (2018) 1162.
57. M. Rudinac, Fractal and multifractal analysis ofheart rate variability, in 2007 8th International Con-ference on Telecommunications in Modern Satellite,Cable and Broadcasting Services, Nis, Serbia, 2007,pp. 325–328, doi:10.1109/TELSKS.2007.4376003.
58. H. Namazi et al., Analysis of the influence ofmemory content of auditory stimuli on the mem-ory content of EEG signal, Oncotarget 7(35) (2016)56120–56128.
59. N. Mat Dawi, K. Kuca, O. Krejcar and H. Namazi,Complexity and memory-based comparison of thebrain activity between ADHD and healthy subjectswhile playing a serious game, Fractals 29(5) (2021)2150202.
60. S. H. Kunkes et al., Use of the ambulatory ECG todiagnose coronary artery disease, J. Electrocardiol.13(4) (1980) 341–346.
61. H. Namazi, E. Aghasian and T. Seifi Ala,Complexity-based classification of EEG signal innormal subjects and patients with epilepsy, Technol.Health Care 28(1) (2020) 57–66.
62. H. Namazi and V. V. Kulish, Fractional diffu-sion based modeling and prediction of human brainresponse to external stimuli, Comput. Math. Meth-ods Med. 2015 (2015) 148534.
63. S. Kumar, P. Pandey, J. F. Gomez-Aguilar and D.Baleanu, Double-Quasi wavelet numerical methodfor the variable-order time fractional and Rieszspace fractional reaction–diffusion equation involv-ing derivatives in Caputo–Fabrizio sense, Fractals28(8) (2020) 2040047.
64. M. H. Heydari, Z. Avazzadeh and Y. Yang, Numer-ical treatment of the space-time fractal-fractionalmodel of nonlinear advection-diffusion-reactionequation through the Bernstein polynomials, Frac-tals 28(8) (2020) 2040001.
65. N. Mohd Ali et al., Development and analysis ofnew approximation of extended cubic B-spline to thenon-linear time fractional Klein–Gordon equation,Fractals 28(8) (2020) 2040039.
66. D. Amita, K. Anoop, A. Thabet and K. Aziz, Exis-tence and stability analysis of solutions for fractionalLangevin equation with nonlocal integral and anti-periodic boundary conditions, Fractals 28(8) (2020)2040006.
67. F. Pourpanah, B. Zhang, R. Ma and Q. Hao,Non-intrusive human motion recognition using dis-tributed sparse sensors and the genetic algo-rithm based neural network, in 2018 IEEE Sen-sors (IEEE Sensors, 2018), pp. 1–4, doi:10.1109/ICSENS.2018.8589618.
2150238-12
Frac
tals
202
1.29
. Dow
nloa
ded
from
ww
w.w
orld
scie
ntif
ic.c
omby
UN
IVE
RSI
DA
D D
E G
RA
NA
DA
on
10/0
6/21
. Re-
use
and
dist
ribu
tion
is s
tric
tly n
ot p
erm
itted
, exc
ept f
or O
pen
Acc
ess
artic
les.

September 8, 2021 16:43 0218-348X2150238
Evaluation of the Correlation Between Heart and Brain Activities
68. F. Pourpanah, B. Zhang, R. Ma and Q. Hao,Anomaly detection and condition monitoring ofUAV motors and propellers, in 2018 IEEE Sen-sors (IEEE Sensors, 2018), pp. 1–4, doi:10.1109/ICSENS.2018.8589572.
69. F. Pourpanah, C. P. Lim and Q. Hao, A reinforcedfuzzy ARTMAP model for data classification, Int.J. Mach. Learn. Cybern. 10 (2019) 1643–1655.
70. R. P. Bartsch, K. K. L. Liu, A. Bashan and P.C. Ivanov, Network physiology: How organ sys-tems dynamically interact, PLoS One 10(11) (2015)e0142143.
2150238-13
Frac
tals
202
1.29
. Dow
nloa
ded
from
ww
w.w
orld
scie
ntif
ic.c
omby
UN
IVE
RSI
DA
D D
E G
RA
NA
DA
on
10/0
6/21
. Re-
use
and
dist
ribu
tion
is s
tric
tly n
ot p
erm
itted
, exc
ept f
or O
pen
Acc
ess
artic
les.