complex relationships between chromatin accessibility...
TRANSCRIPT
Complex Relationships between Chromatin AccessibilitySequence Divergence and Gene Expression in Arabidopsisthaliana
Cristina M Alexandre1 James R Urton1 Ken Jean-Baptiste1 John Huddleston12 Michael W Dorrity1
Josh T Cuperus1 Alessandra M Sullivan3 Felix Bemm4 Dino Jolic4 Andrej A Arsovski5 AgnieszkaThompson5 Jennifer L Nemhauser5 Stan Fields16 Detlef Weigel4 Kerry L Bubb1 and Christin Queitsch1
1Department of Genome Sciences University of Washington Seattle WA2Molecular and Cellular Biology Graduate Program University of Washington Seattle WA3Altius Institute for Biomedical Sciences Seattle WA4Department of Molecular Biology Max Planck Institute for Developmental Biology Tubingen Germany5Department of Biology University of Washington Seattle WA6Howard Hughes Medical Institute University of Washington Seattle WA
Corresponding author E-mail kbubbuwedu
Associate editor Stephen Wright
Abstract
Variation in regulatory DNA is thought to drive phenotypic variation evolution and disease Prior studies of regulatoryDNA and transcription factors across animal species highlighted a fundamental conundrum Transcription factor bindingdomains and cognate binding sites are conserved while regulatory DNA sequences are not It remains unclear howconserved transcription factors and dynamic regulatory sites produce conserved expression patterns across species Herewe explore regulatory DNA variation and its functional consequences within Arabidopsis thaliana using chromatinaccessibility to delineate regulatory DNA genome-wide Unlike in previous cross-species comparisons the positionalhomology of regulatory DNA is maintained among A thaliana ecotypes and less nucleotide divergence has occurred Ofthe 50000 regulatory sites in A thaliana we found that 15 varied in accessibility among ecotypes Some of theseaccessibility differences were associated with extensive previously unannotated sequence variation encompassing manydeletions and ancient hypervariable alleles Unexpectedly for the majority of such regulatory sites nearby gene expres-sion was unaffected Nevertheless regulatory sites with high levels of sequence variation and differential chromatinaccessibility were the most likely to be associated with differential gene expression Finally and most surprising we foundthat the vast majority of differentially accessible sites show no underlying sequence variation We argue that thesesurprising results highlight the necessity to consider higher-order regulatory context in evaluating regulatory variationand predicting its phenotypic consequences
Key words regulatory DNA chromatin accessibility intraspecies sequence variation
IntroductionChanges in gene regulation are thought to be importantdrivers of phenotypic variation evolution and disease Thiswas first postulated over 50 years ago when it was reasonedthat phenotypic variation among organisms ldquoare the result ofchanges in the patterns of timing and rate of activity of struc-tural genes rather than of changes in functional properties ofthe polypeptides as a result of changes in amino acidsequencerdquo (Zuckerkandl and Pauling 1965) Similar conclu-sions were drawn based on diverse evidence including thepresence of different RNAs in different cell types (Britten andDavidson 1969) the discrepancy between genome size andgene number (Ohno 1972) the discrepancy between highmutation rate and phenotypic robustness (Muller 1966Crow and Kimura 1970) and the striking similarity of humanand chimpanzee proteins (King and Wilson 1975)
Tools to examine transcriptional regulation have advanceddramatically in the decades since the importance of regula-tion was first realized It was discovered that transcribedregions of chromatin are sensitive to endonuclease cleavage(Gottesfeld et al 1975 Weintraub and Groudine 1976 Wuet al 1979 Keene et al 1981 Feng and Villeponteau 1992)that regions up-and downstream of actively transcribed genebodies were hypersensitive to endonuclease cleavage (Elgin1981) and that these hypersensitive sites demarcated cis-reg-ulatory DNA were often bound by transcription factors (TFs)rather than directly reflecting transcriptional activity (Grossand Garrard 1988) With the advent of high-throughput se-quencing endonuclease hypersensitivity and other genome-scale methods have been used to delineate regulatory DNA inhundreds of human cell types and tissues plants fungi andanimals (Sabo et al 2004 Hesselberth et al 2009 Furey 2012
Article
The Author 2017 Published by Oxford University Press on behalf of the Society for Molecular Biology and EvolutionAll rights reserved For Permissions please e-mail journalspermissionsoupcom
Mol Biol Evol doi101093molbevmsx326 Advance Access publication December 20 2017 1Downloaded from httpsacademicoupcommbeadvance-article-abstractdoi101093molbevmsx3264767847by University of Washington useron 28 February 2018
Buenrostro et al 2013 Sullivan et al 2014 Villar et al 2015Weber et al 2016)
These methods have allowed comparisons of regulatoryDNA across species on a genome-wide scale As predicted fivedecades ago regulatory DNA generally appears to be undervery weak purifying selectionmdashsimilar to that of four-foldsynonymous sites (Stern and Frankel 2013 Vierstra et al2014) However mutation of even a single base pair withina TF-binding site can suffice to disrupt regulation of its targetgene (Hattori et al 2002 Liu et al 2014 Vierstra et al 2015)Thus unlike coding regions where the signature of purifyingselection predicts gene structure with considerable successsimple conservation metrics largely fail to predict the basepair-level anatomy of regulatory regions
Cross-species analyses have revealed that positional con-servation of regulatory DNA decays with evolutionary dis-tance and that within positionally conserved regulatorysequences TF-binding sites turn over rapidly (Ludwig et al2000 Kim et al 2009 Shibata et al 2012 Vierstra et al 2014Villar et al 2015) To make progress towards a base pair-levelfunctional understanding of regulatory regions we comparedthe regulatory regions among less diverged genomes in whichmost of their positional homology is maintained and lessnucleotide divergence has occurred The Arabidopsis thalianaspecies offers an excellent set of such genomes it consists ofhundreds of ecotypes that are predominantly self-fertilizingand largely homozygous (Bomblies et al 2010) with a within-species pairwise divergence similar to the between-speciesdivergence of human and chimpanzee (1001 GenomesConsortium 2016) but with enough outcrossing among eco-types to avoid the effects of Mullerrsquos ratchet (Felsenstein1974) Linkage disequilibrium decays at a rate similar tothat of African humans (Kim et al 2007) Thus by profilingonly a small sample of A thaliana ecotypes we can capturemuch of the common within-species variation in regulatoryloci and at the same time sample many replicate alleles
Here we use DNase I-seq (and some ATAC-seq) to maphypersensitive sites (DHSs) for each of five geographically andgenetically diverse ecotypes of A thaliana We compared 1)chromatin accessibility (DHSs) as an indicator of TF-binding2) sequence variation and 3) expression levels of nearbygenes Among these ecotypes we find that 15 of the50000 DHSs were differentially accessible Surprisinglyonly a small minority of these differential DHSs were due tounderlying sequence variation putting into question howoften variation in regulatory DNA drives phenotypic varia-tion At the same time we find instances of dramaticsequence variation in regulatory regions with little or no effecton chromatin accessibility and gene expression Althoughchromatin accessibility change per se is a poor predictor ofgene expression changes in nearby genes (Gross and Garrard1988 Song et al 2011 Shu et al 2011 Wang et al 2012Sullivan et al 2015 Blatti et al 2015) combining changes inchromatin accessibility and underlying DNA sequence varia-tion improved predictions Taken together our results illus-trate the challenges inherent in understanding regulatoryvariation and its relationship to phenotypic divergenceeven in a well-studied model species
Results
Identification of Regulatory DNA across FiveDivergent EcotypesFor each of five divergent A thaliana ecotypes (fig 1A) wecreated INTACT lines in which nuclei from all cell typesexpressing the UBQ10 promoter are biotin-tagged to enablecapture with streptavidin beads (Deal and Henikoff 2010Sullivan et al 2014) Nuclei from 7-day-old whole seedlingswere isolated from each ecotype and treated as described (seeMaterials and Methods) to generate DNase I-seq data DNase Ireads of all ecotypes were aligned to the Col-0 reference ge-nome because the quality of the nonreference genome assem-blies was variable DHSs were called as described (Sullivan et al2014) (fig 1) We and others have found chromatin accessi-bility profiles to be highly reproducible (Sabo et al 2006Sullivan et al 2014 2015) Nevertheless we obtained replicatesfor two accessions (Col-0 Bur-0) using an alternative methodto assess chromatin accessibility ATAC-seq (Assay forTransposase-Accessible Chromatin using sequencing) Asexpected DHSs were highly reproducible across methods(supplementary fig S1 Supplementary Material online)
We merged DHSs from the five ecotypes to generate aunion set of 49088 DHSs (fig 1B supplementary table S1Supplementary Material online) Most union DHSs wereshared among the five ecotypes providing yet another meansof replication only 8778 DHSs were private that is called inonly one ecotype Private DHSs tended to show compara-tively low nuclease cut counts on the edge of our detectioncriteria and therefore were potentially enriched for false pos-itives (supplementary fig S2A and 2B SupplementaryMaterial online) For that reason rather than calling DHSpresence or absence across ecotypes we compared DNase Icut counts within uDHSs to identify differential DHSs amongecotypes Specifically because DNase I cut count standarddeviation (r) and mean (m) showed an approximately linearrelationship across the five ecotypes (supplementary fig S2CSupplementary Material online) we used a coefficient of var-iation (CV rm) threshold to define 7265 DHSs (15) asdifferentially accessible DHSs (differential DHSs dDHSsfig 1C see Materials and Methods supplementary table S2Supplementary Material online)
Structural Variation Contributes Substantially toDifferential DHSs among Tested EcotypesDifferential DHSs among the tested ecotypes can arise inthree ways through 1) ecotype-specific deletions of the se-quence underlying a DHS 2) ecotype-specific variation in thesequence underlying a DHS that affects TF-binding (both cis-effects) and 3) ecotype-specific variation in levels activity orDNA-binding preference of TFs (trans-effects) We started byexploring the relative contribution of ecotype-specific dele-tions to the observed differential DHSs because prior studiesestimated that at least 4 of any A thaliana ecotype ge-nome is absent in another ecotype (Clark et al 2007Plantegenet et al 2009) We reasoned that compared withcoding DNA regulatory DNA may be disproportionately af-fected because it is accessible and less constrained by
Alexandre et al doi101093molbevmsx326 MBE
2Downloaded from httpsacademicoupcommbeadvance-article-abstractdoi101093molbevmsx3264767847by University of Washington useron 28 February 2018
selection If this were the case our method of aligning reads tothe Col-0 reference genome which detects deletions in theother ecotypes but not in Col-0 should yield a set of differ-ential DHSs enriched for loci that are most accessible in Col-0
Indeed a majority (62) of the 7265 differential DHSs (nfrac14 4508) were most accessible in the reference ecotype Col-0(dDHSs-C) (fig 2A) The remaining differential DHSs (n frac142757) were most accessible in each of the other four ecotypesat approximately equal numbers (see fig 2A inset)Accessibility of differential DHSs tended to show a bimodaldistribution (supplementary fig S2D Supplementary Materialonline) and for the differential DHSs in which only one eco-type displayed considerably different cut counts (74 3775of 5131 dDHSs) the outlier ecotype was Col-0 with highestaccessibility
We obtained a de novo Bay-0 genome assembly to testwhether its use as a reference genome would yield differentialDHSs enriched for loci most accessible in Bay-0 This was thecase (fig 2B and C) To explore sequence divergence at thebase pair level we used three different alignment stringencies
aligning to both the Col-0 and Bay-0 reference genomesConsistent with the effects of sequence divergence the ref-erence genome bias was exaggerated when we required per-fect alignment between sequence read and referencegenome conversely the reference genome bias was dimin-ished when the alignment requirements were relaxed (fig 2B)The reference genome bias was not diminished with relaxedalignment to the Bay-0 genome presumably because it is notof the same quality as the Col-0 reference genome (fig 2B) Insummary our analysis demonstrates that there is no excess ofdifferential DHSs that are most accessible in Col-0 rather dueto missing Col-0 deletions by using the Col-0 genome foralignment we undercount differential DHSs that are accessi-ble in the other ecotypes (false negatives)
In the absence of comparable genome assemblies for theother ecotypes we used whole-genome shotgun (WGS) readcoverage to predict putative deletions of 300 bp or greater ineach ecotype with respect to the Col-0 genome (fig 2E seeMaterials and Methods 1001 Genomes Consortium 2016supplementary tables S3ndashS6 Supplementary Material online)to determine the fraction of differential DHSs overlappingpredicted deletions We also conducted this analysis for theBay-0 short-read data and the novel Bay-0 assembly (fig 2E)The size distribution of predicted deletions among ecotypeswas similar with some deletions extending over 40 kb Intotal of the 49088 uDHSs 1516 DHSs (3) overlappedwith a predicted deletion by at least one bp of the 7265differential DHSs 1144 DHSs (16) overlapped with a pre-dicted deletion (fig 2D) However the overlap of predictedecotype-specific deletions with ecotype-specific differentialDHSs was imperfect (fig 2E) due to imprecision of deletionandor differential DHS breakpoints We assessed the accuracyof our deletion predictions by comparing our results to twoindependent data sets the Bay-0 comparative genomic hy-bridization (CGH) array data (Plantegenet et al 2009) and thenovel Bay-0 genome assembly We found strong correspon-dence of our predicted deletions with both data sets (supple-mentary fig S4 Supplementary Material online) Moreoverdeletions called by whole genome alignment (WGA-calleddeletions see Materials and Methods) behaved like deletionscalled by read coverage for Bay-0 WGS data (fig 2E)
Having established structural variation as a substantialcontribution to differential DHSs we explored whether theydiffered in genomic or biological features from uDHSs fromwhich they are drawn When compared with uDHSs differ-ential DHSs were more likely to reside in coding regions andless likely to reside in intergenic regions This effect is largelydriven by the differential DHSs that are most accessible in Col-0 (supplementary fig S3A Supplementary Material onlinedDHSs-C) many of which reflect absence of sequence inone or more ecotype rather than differential accessibility ofsequence that is present in both Because sequence variationis implicated in generating accessibility difference we com-pared recombination rates within uDHSs differential DHSsand comparable regions outside of DHSs Using recombina-tion events imputed from the mosaic genomes of the MAGIClines (Kover et al 2009) a higher fraction of DHSs (21)overlapped with a recombination event compared with
FIG 1 Identifying regions of differential chromatin accessibilityamong five A thaliana ecotypes (A) Data and data quality for thefive ecotypes examined SPOT score a metric of data qualitydescribes fraction of cuts within hotspots (Sullivan et al 2015)Colors indicate specific ecotypes throughout manuscript (palette iscolorblind-accessible [Wong 2011] Bay-0 vermillion Bur-0 orangeCol-0 bluish green Est-1 sky blue Tsu-1 blue) (B) Schematic depic-tion of deriving uDHSs for subsequent analysis (C) Distribution of CVamong uDHSs (bold line) Distribution of CV among the subset ofuDHSs for which at least one ecotype has no cut counts (lighter line)A CV threshold of 056 (dashed line) was chosen to include all uDHSsin the latter category This approach categorized 15 of all uDHSs asdifferentially accessible (see inset diagram dDHSs in reddish-purple)See supplementary figure S2 Supplementary Material online for fur-ther details on the rationale for CV as a metric for identifying dDHSsExamples of individual uDHSs with respective chromosome coordi-nates and CVs are shown below CV distribution
Complex Relationships in A thaliana doi101093molbevmsx326 MBE
3Downloaded from httpsacademicoupcommbeadvance-article-abstractdoi101093molbevmsx3264767847by University of Washington useron 28 February 2018
same-length control regions (DHS coordinates shifted 5 and10 kb) (17 P lt 109) consistent with recombination fa-voring accessible regions in plants (Rodgers-Melnick et al2016) Focusing on recurrent recombination events 9 ofdifferential DHSs overlapped with recombination events inmultiple lines compared with only 38 of uDHSs Comparinggene annotations for genes residing either near union or dif-ferential DHSs we found that the latter were enriched forannotations related to programmed cell death (supplemen-tary fig S3B and C Supplementary Material online)
The features of differential DHSs (location elevated recom-bination rate proximity to defense- and cell death-relatedgenes and increased methylation) are consistent with priorwork on defense-related genes recombination and regula-tory sequence variation (Gan et al 2011 Choi et al 2016) and
our observation that a substantial fraction of differential DHSsis due to the absence of DHS sequence (a local deletion) inone or more ecotype
Sanger-Sequencing of Wrongly Predicted DeletionsReveals Hypervariable DHS SequencesTo directly assess the accuracy of our predictions we PCR-amplified regions corresponding to ten WGS-called deletedDHSs that reside near well-annotated genes Of these tenregions seven were indeed deleted (fig 3A supplementarytable S7 Supplementary Material online) For the remainingthree Sanger-sequencing revealed that ecotypes predicted tohave deletions carry instead a homozygous DHS allele withdramatically different sequence but of approximately equallength as the Col-0 DHS allele (fig 3B) We Sanger-sequenced
FIG 2 Structural variation contributes to profound reference bias and explains a sizable minority of differential DHSs (A) DNase I-cut counts foreach of 7265 dDHS across all five ecotypes (color-coded dots see inset) are shown dDHSs are displayed hierarchically clustered with each columnrepresenting a given DHS dDHSs in which the reference Col-0 (green) shows more cut counts than any of the other ecotypes (dDHSs-C) are mostcommon (B) The reference bias in (A) arises through use of the Col-0 reference genome for DNase I read alignment Two different referencegenomes Col-0 (green top) and Bay-0 (vermillion bottom) were compared for alignment at different stringencies Replacing the Col-0 referencegenome with the Bay-0 draft genome for read alignments resulted in a Bay-0 specific bias that is now the majority of dDHSs was most accessible inBay-0 The 1000 dDHSs with the highest CV were used for analysis Requiring perfect alignment (no mismatches) between DNase I read andreference genome enhanced this effect while relaxing alignment parameters dampened this effect in the Sanger-sequenced Col-0 genome (seeMaterials and Methods for details) (C) Schematic outlining the consequences of missing sequence in Col-0 the reference ecotype versus missingsequence in a nonCol-0 ecotype for bias in calling dDHSs In our analysis DNase I reads from each ecotype were aligned to the Col-0 referencesequence (depicted by green horizontal bar) If a Col-0 sequence corresponding to a DHS was missing in Bay-0 this DHS would appear inaccessiblein Bay-0 and called as a dDHS-C (ie most accessible in Col-0) However if a Bay-0 sequence corresponding to a DHS was missing in Col-0 the DHSwould not be included in the uDHS set and not be counted as a dDHS-NC (ie most accessible in a nonCol-0 ecotype) (D) Overlap between WGS-called deletions uDHSs and dDHSs shows that differential DHSs are enriched for ecotype-specific deletions areas are proportional to the size ofeach category (E) Size distribution of WGS sequence-called deletions in each ecotype was similar with few deletions over 20 kb Pie charts indicatethe fraction of uDHSs overlapping ecotype-specific WGS-called deletions of various minimum sizes that were characterized as differential DHSs(see adjacent key) For comparison see the fraction of uDHSs overlapping Bay-0 deletions of various minimum sizes called by WGA (whole-genome alignment) of the Bay-0 draft genome to the Col-0 reference genome (see Materials and Methods)
Alexandre et al doi101093molbevmsx326 MBE
4Downloaded from httpsacademicoupcommbeadvance-article-abstractdoi101093molbevmsx3264767847by University of Washington useron 28 February 2018
eight additional ecotypes and found that each ecotype washomozygous for one of the two previously identified allelesconsistent with a single mutation event creating the vastmajority of the nucleotide differences in each of these regions(fig 3B supplementary fig S5 Supplementary Materialonline)
We refer to DHSs with two highly disparate alleles as hy-pervariable DHSs (hypDHSs) The existence of hypDHSs sug-gested that in addition to undercounting differential DHSsmost accessible in nonCol ecotypes (due to the absence ofDHS sequences in Col-0) we may be overcounting differentialDHS most accessible in Col-0 Neither read-coverage-based
detection of deletions nor CGH data can distinguish betweentrue deletions and sequence regions that are diverged to thepoint of precluding alignment of short reads
Therefore we explored the extent of DHS hypervariabilityby Sanger-sequencing ten additional DHSs with very high CVacross the five ecotypes We found elevated sequence diversityin all ten sequence regions compared with the genome-widebackground the mean number of substitutions deletionsand insertions (SDIs) was 143 across the 150 bp DHS regionsThe immediate area surrounding these DHSs (800 bp totalincluding DHS) also showed elevated sequence diversity(supplementary table S8 Supplementary Material online)
FIG 3 Hypervariable sequence coinciding with DHSs poses a challenge for sequence alignment but does not significantly contribute to referencebias (A) PCR confirmed seven out of ten predicted deletions in at least one ecotype through decreased size or absence of diagnostic PCR productPredicted deletions are denoted as red X In some instances ecotypes carried a deletion that was not predicted (black box DHS9 in Bur-0 and Tsu-1false negatives) (B) For the three wrongly predicted deletions coinciding with DHS1 DHS3 and DHS5 Sanger-sequenced PCR-products from 12 Athaliana ecotypes revealed that ecotypes carried either a homozygous Col-like sequence allele or a homozygous nonCol-like allele with dramat-ically different sequence but approximately equal length Alignments are represented as thumbnails Col-like sequence in gray and mismatches toCol-0 in black Col-0 coordinates for these three hypervariable loci are Chr1 5673357ndash5674171 Chr1 28422395ndash28423622 and Chr215890369ndash15891184 respectively For DHS1 the base pair resolution multiple sequence alignment is shown For full base pair resolutionmultiple alignments of DHS1 DHS3 and DHS5 see supplementary figure S5AndashC Supplementary Material online (C) Scatterplot of Bur-0DNase I reads aligned to either patched or unpatched Col-0 sequence The patched Col-0 genome was generated by replacing DHS-sequenceswith locally-assembled sequence from Bur-0 WGS reads (see Materials and Methods) Dotted lines indicate 2-fold higher cut counts for respectiveDHSs with either patched or unpatched genome The majority of DHSs was not affected (orange cloud) At right an example of false positivedifferential DHS for which patching resulted in higher numbers of aligned DNase I reads such that ldquopatchedrdquo cut count approximated that of theCol-0 DHS The similarity of DHS pattern between Bur-0 Bay-0 and Tsu-1 suggests that the differential DHS in the two latter ecotypes is also a falsepositive due to sequence hypervariability
Complex Relationships in A thaliana doi101093molbevmsx326 MBE
5Downloaded from httpsacademicoupcommbeadvance-article-abstractdoi101093molbevmsx3264767847by University of Washington useron 28 February 2018
Next we aimed to recover the true sequence of all differ-ential DHSs that were most accessible in Col-0 to determineto which extent hypervariability affected our analysis Weused PHRAP (Phil Green personal communication) to per-form local de novo assemblies of the Bur-0 DHS allele for eachof the 4508 differential DHS most accessible in Col-0 using 1)a Col-0 backbone sequence with per-bp quality set to zeroand 2) all pairs of WGS reads in which at least one readmapped to that DHS region that is using one of the pairedreads to anchor the other even if the sequence differencefrom the Col-0 allele prohibited alignment (see Materials andMethods) We tested this strategy by comparing our localassemblies to the Bur-0 Sanger sequence for the ten DHSsin addition to available Bur-0 genome sequence (Gan et al2011) Comparing patched sequence to respective Sanger-sequence across the ten DHSs 83 of SDIs were corrected(120143) for six DHS sequences were completely correctedEleven of the 23 uncorrected SDIs were indels Comparing thepublished Bur-0 assembly to the respective Bur-0 Sangersequences only seven of the 143 SDIs were missed all ofwhich were substitutions clustered within a single DHS (sup-plementary table S8 Supplementary Material online)
As patching proved effective we patched the Col-0 ge-nome with the de novo derived Bur-0-like sequences main-taining genome coordinates and then re-aligned the Bur-0DNase I reads For 122 of the 4508 differential DHSs-C wealigned more than twice as many Bur-0 DNase I reads to thepatched Col-0 genome compared with the reference Col-0genome (fig 3C) However perhaps surprisingly the majorityof previously called differential DHSs-C loci remained mostaccessible in Col-0 Moreover when we recalculated CVacross all ecotypes using the newly patched genome forBur-0 only 100 DHSs out of 4508 differential DHSs-C fellbelow the differential DHSs threshold (fig 1C) with most(84100) close to the threshold (fig 1C) In summary theobserved excess of differential DHSs most accessible in Col-0 was largely due to undercounting in other ecotypes (falsenegatives) and not to poor alignment of ecotype-specificDNase I reads to the Col-0 reference genome (false positives)
Hypervariable Differential DHSs Tend to Reside NearDifferentially Expressed GenesThe DHS landscape for a given genotype is largely static withonly 5ndash10 of DHSs changing in accessibility in pairwisecomparisons of conditions (Sullivan et al 2014) or develop-ment stages (Sullivan et al in review) in spite of widespreadchanges in gene expression Static DHS presence is generallynot a good predictor of nearby gene expression for multiplereasons for example accessibility can be caused not only byactivators but also by repressors and DHS assignment tonearby genes is an oversimplification However dynamicDHSs with differential accessibility in response to abiotictreatments more frequently correlates with expressionchanges in nearby genes (Sullivan et al 2014 2015) Herewe compare chromatin accessibility and gene expression forseedlings that have been grown under standard growth con-ditions in the absence of such treatments making it possibly
less likely to observe correlations between accessibility andgene expression
Across genotypes we had to consider the additional com-plexity of ecotype-specific sequence variation underlyingDHSs Thus we explored the relationship of high sequencevariation with both DNase I accessibility and expression ofnearby genes As previously observed (Plantegenet et al2009) deleted regulatory regions often reside near deletedgenes providing a trivial reasonmdashnamely gene absencemdashfor differential gene expression unrelated to the evolutionof regulatory DNA Therefore to select for deleted DHSsnear nondeleted genes we used a set of smaller predicteddeletions generated by merging only overlapping 150 bpwindows of low WGS coverage and retaining all predicteddeletion windows not only those gt300 bp as before (sup-plementary table S9 Supplementary Material online) Ofthese smaller predicted deletions (150 bp) 308 overlappedwith a uDHS but not a gene Comparable high-quality ex-pression data were publicly available for Bur-0 and Col-0ecotypes (Gan et al 2011) hence we considered these eco-types for further analysis We applied DESeq (Anders andHuber 2010) to these data (Gan et al 2011) and identified737 protein-coding genes with differential expression be-tween Bur-0 and Col-0
We then determined for Col-0 and Bur-0 the proximity ofthe various DHS sets (Bur-0Col-0 uDHSs [uDHSs] Bur-0Col-0 differential DHSs dDHSs deleted DHSs delDHSs hypDHSs)to the nearest differentially expressed gene (supplementarytable S14 Supplementary Material online) assessing DHSsresiding upstream and downstream of transcription startsites Only a small fraction of Bur-0Col-0 uDHSs (supplemen-tary table S10 Supplementary Material online) resided neardifferentially expressed genes (fig 4A for specific examples seefig 5A top) As expected this fraction increased albeit onlymodestly when differentially accessible DHSs (supplementarytable S11 Supplementary Material online) were consideredHypDHSs (supplementary table S12 Supplementary Materialonline) were more likely than dDHSs to reside near differen-tially expressed genes regardless of whether they differed inaccessibility However hypDHSs with altered accessibility(supplementary table S13 Supplementary Material online)predicted expression changes in nearby genes almost aswell as delDHSs Taking into account DHSs residing down-stream of transcription start sites delDHSs predicted expres-sion changes for 25 of nearby genes
We used total mRNA levels in these analyses howevernascent RNA levels may have yielded a stronger relationshipbetween differential accessibility and expression We exploredthis possibility using two other metrics associated with tran-scription nuclear mRNAs which may reflect nascent RNAsmore closely and Pol II occupancy (supplementary fig S6Supplementary Material online) We stratified genes intonine quantiles (from lowest to highest 1ndash9) for totalmRNA levels nuclear mRNA and Pol II occupancy and de-termined their chromatin accessibility upstream and down-stream For all three measures accessibility was highestupstream of highly expressed (or highly occupied) genesand decreased monotonically with quantile We conclude
Alexandre et al doi101093molbevmsx326 MBE
6Downloaded from httpsacademicoupcommbeadvance-article-abstractdoi101093molbevmsx3264767847by University of Washington useron 28 February 2018
that our findings are not affected by the use of differentmeasures of gene expression
In summary neither sequence variation nor accessibilityvariation were good predictors of expression changes in
nearby genes however combining this information allowedfar better predictions than relying on either factor alone(fig 4A and B) For example for the three originalhypDHSsmdashoriginally mistaken for deletionsmdashwe foundthat for each locus allele type corresponded to expressionlevel of nearby gene for 11 ecotypes with publicly availableexpression data (Lempe et al 2005 Gan et al 2011) (fig 4B)
These three hypDHSs reside near well-annotated genesoffering the opportunity to examine whether differentialhypDHS alleles are associated with phenotypic variation inaddition to expression variation We focused on the hypDHSupstream of REV7AT1G16590 a gene associated with UV-tolerance in different organisms (Broomfield et al 2001)Arabidopsis thaliana rev7 mutants show moderately in-creased sensitivity to prolonged UV exposures (Takahashiet al 2005) REV7 is expressed at lower levels in Col-0 thanBur-0 and other ecotypes containing the nonCol-like allele(fig 4B top) however Col-0 and Bur-0 differed only subtly intheir growth response to UV exposure (supplementary fig S7Supplementary Material online)
Differential DHSs May Be Conditionally ImportantDifferential DHSs are thought to be most informative forunderstanding the regulatory dynamics underlying specificconditional responses and developmental trajectoriesHowever for a single expression data set from 11-day-oldseedlings grown in long days (LDs) (Gan et al 2011) only25 of delDHSs resided near differentially expressed genes(eg fig 5A top fig 4A) We reasoned that some of theremaining 75 of delDHSs (eg fig 5A bottom fig 4A) maymatter for expression under different conditions because ac-cessibility especially at conditional regulatory sites oftenreflects a poised state with bound but not fully activatedTFs (Gross and Garrard 1988 Zentner et al 2011 Nelsonand Wardle 2013)
We noted that genes implicated in response to varioustreatments (cold growth in the dark pathogen response)often resided near small deletions affecting one of multipleadjacent DHSs This observation is consistent with the factthat conditional genes often receive inputs from several path-ways involving multiple TFs causing several DHSs to ariseThe presence of multiple DHSs under standard conditions isconsistent with poised TFs bound to DNA Therefore wesystematically examined whether genes that are conditionallyexpressed in Col-0 tend to reside near multiple DHSs (seeMaterials and Methods) Indeed conditionally expressedgenes showed significantly more DHSs both 5 kb upstreamof their transcription start site and 15 kb downstream of theirtranscription termination site (fig 5B supplementary tablesS15ndashS18 Supplementary Material online)
To address whether some of these DHSs mattered for geneexpression under nonstandard growth conditions we se-lected differential DHSs predicted to be deleted the mostextreme form of sequence divergence and for which expres-sion of both neighboring genes was the same in Col-0 andBur-0 in standard growth conditions (Gan et al 2011) Weidentified ten such DHSs near genes with prior evidence forconditional expression in cold andor growth in the dark but
FIG 4 DHSs alleles with high sequence divergence tend to reside neargenes with different expression levels (A) Fraction of DHSs residing within5 kb of a differentially expressed gene by DHS sets in a pairwise compar-ison of Col-0 and Bur-0 (deleted DHSs frac14 del DHSs hypervariable differ-entially accessible DHSs frac14 hypd DHSs hypervariable nondifferentiallyaccessible DHSsfrac14 hypnd DHSs differentially accessible DHSsfrac14 d DHSsCol-0Bur-0 uDHSsfrac14 uCB DHSs) DHSs were subsampled to sets of 50 toallow comparisons among the examined DHSs sets which occurred atvastly different frequency (see Materials and Methods) (B) For the threepreviously-identified hypDHSs (DHS1 DHS3 and DHS5 see fig 3A and B)the DHS-allele (Col-like C-allele in green nonCol-like NC-allele in black)determined by Sanger-sequencing predicted the expression level of aneighboring gene in eleven ecotypes with publicly available expressiondata (Lempe et al 2005) with one exception (Ms-0 in DHS5 red dot) Atleft screenshots showing altered DHS accessibility at these sites (see alsofig 3B) at right gene expression (as log2(intensity ratio) Lempe et al2005) for ecotypes carrying either the DHS C-allele (green) or the DHS NC-allele (black) For DHS1 (At1G116590) we also show expression for Bur-0(orange) compared with Col-0 (green) from Gan et al (2011)
Complex Relationships in A thaliana doi101093molbevmsx326 MBE
7Downloaded from httpsacademicoupcommbeadvance-article-abstractdoi101093molbevmsx3264767847by University of Washington useron 28 February 2018
similar expression levels in Bur-0 and Col-0 under standardgrowth conditions (Gan et al 2011) (supplementary tableS19 Supplementary Material online) These ten genes showedelevated numbers of DHSs up- andor downstream (supple-mentary fig S8A Supplementary Material online) We PCR-confirmed the predicted DHSs deletions in nine instances adeletion resided in Bur-0 and in one case DHS sequence wasabsent in Col-0 (fig 5C) We then examined whether any of
these ten genes differed in expression between Bur-0 and Col-0 in response to test conditions (see Materials and Methodsfig 5C supplementary fig S8 Supplementary Material online)We found that all ten genes tested had significantly differentlevels of expression between Bur-0 and Col-0 in at least onetest condition Analysis of additional in-house qPCR biologicalreplicates however indicated that five of the ten genesshowed small but significant differences in expression
FIG 5 Altered DHS accessibility among ecotypes may have condition-dependent effects on expression of nearby genes (A Top) A DHS deletion(black box) in Bur-0 neighbors one gene with similar expression in Bur-0 (orange) and Col-0 (green expressed in FPKM) (Gan et al 2011) and onegene with vastly different expressions in Bur-0 and Col-0 (blue shading) (A Bottom) A DHS deletion in Bur-0 (denoted as above) neighbors twogenes with similar expression levels in Bur-0 and Col-0 (B) On average genes with differential expression in response to heat-shock dark-to-lighttransition brassinosteroid treatment of dark-grown seedlings and auxin treatment are flanked by significantly more DHSs than all genes (eg onaverage 3 DHSs reside 5 kb upstream of a gene) P values of t-tests comparing (1) mean number of DHSs in specified region for genes withdiffering expression at test versus control conditions to (2) mean number of DHSs for genes with similar expression at both conditions (a) (5 kbupstream 15 kb downstream) (b) (lt22e-16 36e-13) (c) (lt22e-16lt22e-16) (d) (lt22e-16lt22e-16) (e) (27e-10 16e-09 (C Left) Gel imagesconfirming DHS deletions near genes annotated as conditionally-expressed The first example represents an insertion in Bur-0 rather than adeletion (C Right) Evidence of ecotype-specific conditional expression (highlighted in blue are the largest significant differences measured witheffect size indicated in bold and P-value of difference [paired t-test] in italics) associated with a DHS deletion or insertion near AT1G50460AT2G16280 and AT5G54470 cDNA preparations of Bur-0Col-0 pairs with substantially higher levels of gene expression presumably due to somebatch effect are given as filled circles (D Top Left) DNase I screenshot for the region containing AT5G54470 in Col-0 and Bur-0 (D Top Right)Schematic alignment of the 2138-bp region upstream of AT5G54470 (Chr5 22115538ndash22117675) Boxes denote DHSs (D Bottom) Base pairalignment of a 348-bp window (Chr5 22115738ndash22116085) containing the second and most accessible DHS upstream of AT5G54470 TF bindingmotifs are underlined in blue and indels andor mismatches between Col-0 and Bur-0 (bold letters) are indicated Various combinations of thesemotifs are required for response to cold (Mikkelsen and Thomashow 2009) PhastCons scores were taken from (Zheng et al 2010 Li et al 2012)
Alexandre et al doi101093molbevmsx326 MBE
8Downloaded from httpsacademicoupcommbeadvance-article-abstractdoi101093molbevmsx3264767847by University of Washington useron 28 February 2018
between Bur-0 and Col-0 even in standard conditions (fig 5Csupplementary fig S8 Supplementary Material online) Thethree genes with significant conditional expression differencesof largest effect size were AT5G54470 AT2G16280 andAT1G50460 (fig 5C) For example AT5G54470 known tobe induced by cold (Mikkelsen and Thomashow 2009)showed a significantly greater increase in expression in cold-treated light-grown seedlings in Col-0 than in Bur-0 (fig 5Csupplementary fig S7 Supplementary Material online)Almost all cold-responsive motifs (Mikkelsen andThomashow 2009) are contained within the most accessibleDHS in the AT5G54470 regulatory region (fig 5D supplemen-tary fig S8 Supplementary Material online) Several of thesemotifs (EEL EE CBS and ABRE) reside within a region that isnot conserved across plant species in contrast motifs that donot affect cold-responsive expression (G-box and ABREHY5)reside in a more conserved region (Zheng et al 2010 Li et al2012) To explore possible sequence differences between Bur-0 and Col-0 in the extended AT5G54470 regulatory region weSanger-sequenced over 2 kb upstream of AT5G54470 whichincluded four uDHSs and the predicted insertion (fig 5Dsupplementary fig S8 Supplementary Material online)Within the most accessible DHS we found five single basepair differences between Col-0 and Bur-0 one of which dis-rupted a cold-response motif We also discovered an addi-tional 152 bp insertion in Bur-0 between the second and thirdDHSs which affects spacing of regulatory motifs as well assmaller insertions deletions and multiple single base pairchanges (fig 5D supplementary fig S8 SupplementaryMaterial online) Previous large-scale genomics efforts failedto detect these sequence differences (Gan et al 2011) Anyone of these regulatory sequence variants or combinationsthereof may cause the observed differences in conditionalexpression For detailed information on the other loci withcondition-specific effects see supplementary textSupplementary Material online
Most Differences in Accessibility Are Not Associatedwith Variation in Sequence or Epigenetic MarksWe found a surprisingly large proportion of differential DHSswith little ecotype-specific sequence variation In the newBay-0 assembly 84 and 81 of union and differentialDHSs not overlapping predicted deletions respectively carrytwo or fewer SDIs (fig 6A) The mean SDI per DHS was higherin differential DHSs than uDHSs (25 compared with 18) butthis difference was largely driven by outliers (fig 6A) For overhalf of the differential DHSs (18613363) the underlying se-quence was identical between the Col-0 reference genomeand the de novo Bay-0 assembly genome
Similarly in the published Bur-0 sequence 94 and 92 ofunion and differential DHSs not overlapping predicted dele-tions respectively carry two or fewer SDIs (fig 6A) As withthe Bay-0 genome the higher mean SDI in Bur-0 dDHSs com-pared with uDHSs (34 vs 12) was driven by high-SDI outliers(fig 6A) We re-called single nucleotide variants (SNVs) andsmall insertions and deletions (indels) with more recent soft-ware packages (ie GATK 36 [McKenna et al 2010] andfreebayes 102 (Garrison and Marth 2012) generating an
independent set of Bur-0Col-0 sequence variants (seeMaterials and Methods) Using this new set of variants 86and 83 of union and differential DHSs respectively carrytwo or fewer sequence variants similar to the numbers ob-served with the Bay-0 draft assembly genome
We further examined whether dDHSs that appear identicalin sequence between Bay-0 and Col-0 show differential acces-sibility because of undetected Bay-insertions in particulartransposon insertions Using the Bay-0 draft assembly weidentified 2026 regions totaling 12336209 bp which arenot present in the Col-0 reference sequence (1850 regionstotaling 8239790 bp without centromeres) (fig 6B seeMaterials and Methods) Approximately a quarter of thesebase pairs are homologous to transposable elements(2911130 and 1956715 bp respectively) We concludethat dDHSs without SDIs are unlikely to contain or overlapwith undetected Bay-insertions Given that this is at the up-per end of what has been reported for other A thalianagenome comparisons we are confident that the vast majorityof TE or other sequence insertions has been detected
Further we verified the sequence of eight loci encompass-ing differential DHSs predicted to contain two or fewer SDIsby Sanger-sequencing In each case the number of observedvariants matched the number of predicted variants no inser-tions were detected (supplementary table S20Supplementary Material online) Taken together our analysessuggest that the vast majority of differential DHSs indeedcarry only few SDIs
In the absence of genetic variation variation in chromatinaccessibility may arise from epigenetic marks Therefore weexamined differences in epigenetic marks among uDHSs dif-ferential DHSs with SDIs differential DHSs without SDIs andcontrol regions (shift dDHSs) We first compared the amountof 5-methylcytosine between the Col-0 and Bur-0 methyl-omes (Kawakatsu et al 2016) within each DHS category be-cause differential DNA methylation can affect TF binding(OrsquoMalley et al 2016) In both the Col-0 and Bur-0 methyl-omes differential DHSs without SDIs were far less likely tocontain methylated cytosines (meCs) than control regionshowever they were somewhat more likely to contain meCthan differential DHSs with SDIs (fig 6C a and b) The lattereffect was stronger when tallying meCs for Bur-0 which isconsistent with our observation that many Col-0Bur-0dDHSs show higher accessibility in Col-0 However 835 ofdDHSs without SDIs contained no meC in either the Bur-0 orCol-0 methylomes strongly indicating that differential meth-ylation does not explain accessibility differences for dDHSswithout SDIs
Next we compared seven chromatin states (Wang Liuet al 2015) defined by enrichment for different histonemarks for the same DHS categories to determine whetherhistone composition might be associated with differentialchromatin accessibility Chromatin states 3 and 6 representclassic transcriptionally silent heterochromatin states 1 and 5are transcriptionally active euchromatin 2 represents tran-scriptionally repressed euchromatin 4 shows no enrichmentfor any marks whereas state 0 has no marks (Wang Liu et al2015) Differential DHSs without SDIs were less likely than
Complex Relationships in A thaliana doi101093molbevmsx326 MBE
9Downloaded from httpsacademicoupcommbeadvance-article-abstractdoi101093molbevmsx3264767847by University of Washington useron 28 February 2018
dDHSs with SDIs to occupy regions without histone marks(CS0 fig 6D d) and regions without any particular histonemark enrichment (CS4 fig 6D e) They were more likely thandDHSs with SDIs to occupy regions enriched for histonemarks associated with active transcription (CS5 fig 6D f)and regions representing transcriptionally repressed euchro-matin (CS2 fig 6D g) This chromatin state is also associatedwith high topological connectivity with other genomicregions However these enrichments affected lt15 of thebase pairs underlying differential DHSs without SDIs over 40of base pairs in dDHSs without SDIs showed no histone markenrichment Thus differential histone marks explain at best aminority of chromatin accessibility differences in the absence
of genetic variation which is consistent with a considerablerole for trans factors We do not mean to imply that theobserved accessibility differences are caused by fast-evolving polymorphic TFs this interpretation is not sup-ported by sequence information for Col-0 and Bur-0 TFsRather we invoke differences in higher-order regulatory con-trol which results in differential accessibility in the absence ofgenetic variation at a particular site and in its TF For exampledifferential accessibility in the absence of genetic variationmay arise through reduced TF levels due to an upstreammutation This interpretation is supported by the fact thatdDHSs without SDIs are enriched for the chromatin state CS2which is associated with topological connectivity
FIG 6 Most differential DHSs are not explained by sequence divergence (A) Total single nucleotide SDIs per DHS between Bay-0 and Col-0 werederived from whole genome alignment of the Bay-0 draft genome sequence and Col-0 reference genome sequence (see Materials and Methods)The majority of DHSs have zero SDI Left comparison between Bay-0 and Col-0 shades of gray uDHSs shades of red differential DHSs Rightcomparison between Bur-0 and Col-0 shades of gray uDHSs shades of orange differential DHSs (B) Histogram of Bay-0 insertion sizes over theentire genome (left) and excluding the centromere (right) (C) The fraction of DHSs of different types that contain at least one meC in the Col-0genome (left) and Bur-0 genome (right) P-values for important comparisons (a and b) are displayed (D) The fraction of base pairs within DHSs ofdifferent types in chromatin states (CS0-CS6) as defined by Wang et al (2015) P-values for important comparisons (andashg) are displayed to the rightAll P-values in (C) and (D) were calculated using a proportions test (proptest)
Alexandre et al doi101093molbevmsx326 MBE
10Downloaded from httpsacademicoupcommbeadvance-article-abstractdoi101093molbevmsx3264767847by University of Washington useron 28 February 2018
DiscussionThe current challenge in annotating regulatory regions isconnecting specific base pairs with regulatory function Weand others have previously attempted to predict the functionof regulatory regions by using TF binding motif content andfootprint presence (Segal et al 2008 Sullivan et al 2014Vierstra and Stamatoyannopoulos 2016) Although suchapproaches can have reasonable success when focused on afew very well known TFs and a well-understood biologicalprocess (such as patterning of the early Drosophila embryo)these approaches do have several limitations including TF-binding site sequence specificity that differs depending oncontext (Slattery et al 2011 Jolma et al 2015) occupancythat is imperfectly gauged by most current footprinting algo-rithms particularly those that do not control for nuclease biasand the particular binding tendencies of different TFs(Vierstra and Stamatoyannopoulos 2016) and TF bindingsmotifs especially for large TF families that can be highly sim-ilar Here we examined the effect of sequence variation withinpositionally and presumably functionally homologous regu-latory sequence (DHSs) of closely related A thaliana ecotypesto gain insight into regulatory sequence evolution
As expected we found that DHSs with changes in bothsequence and accessibility across ecotypes are much morelikely to reside near genes with different expression than DHSswithout these changes It is well-established that TF-mediatedgene regulation is sequence-driven In addition to the multi-tude of genetic studies of regulatory regions (Carroll 2008Wittkopp and Kalay 2011) an elegant large-scale demonstra-tion of this principle comes from a mouse model of Downsyndrome in which the extra chromosome 21 copy is a hu-man chromosome 21 The location of TF bindingchromosome-wide was primarily determined by the cis-com-ponent (regulatory sequence) rather than the trans-compo-nent that is mouse TFs bound the human chromosome 21in much the same pattern as the homologous human TFswould in a human cell (Coller and Kruglyak 2008 Wilson et al2008)
Perhaps more surprisingly we found that gene regulationcan be remarkably robust to sequence perturbations in DHSsonly a quarter of DHSs with changes in both sequence andaccessibility resided near genes with altered expressionFurthermore the majority (hundreds) of DHSs with high se-quence variation displayed neither a change in accessibilitynor in nearby gene expression An obvious caveat however isour assumption that a given DHS represents the regulatoryregion for the closest nearby gene While certainly not a per-fect assumption there is no obvious analytical alternative forassigning DHSs to target genes (Sullivan et al 2015) more-over extensive Drosophila studies suggest that regulatoryelements most often target a neighboring gene or if the reg-ulatory element resides in an intron the host gene (Kvon et al2014) This pattern is also frequently observed for regulatoryelement-target gene pairs in other organisms (Stern andFrankel 2013 Liu et al 2014 Vierstra et al 2015) evenwhen a regulatory element resides very far away from itstarget gene in most cases there are no other genes residing
in the intervening sequence (Stam et al 2002 Clark et al 2006Guenther et al 2014 Kvon et al 2014)
Assuming correct target gene assignment for the majorityof DHSs the question remains how this regulatory robustnessis generated in light of considerable underlying sequence var-iation Careful dissections of individual regulatory regions andgenome-scale studies implicate several mechanisms for regu-latory robustness including shadow enhancers TF redun-dancy and motif redundancy among others (Payne andWagner 2015) Nevertheless the amount of largely unanno-tated sequence variation in supposedly functional genomicregions among these closely related A thaliana ecotypes wassurprising and calls for future sequencing efforts with longerreads In particular we observed hypDHSs that were pre-served in length among ecotypes but highly disparate in se-quence showing either a Col-DHS allele or a nonCol-DHSallele This observation is consistent with a single mutationevent that generated the dramatic nucleotide differences be-tween the allelic forms DHSs that coincided with hypervar-iable sequence and changed in accessibility predictedexpression changes in nearby genes almost as well as DHSsdeletions
Our assessment of the association between gene expres-sion and DHS changes in sequence and accessibility is limitedby the finite number of conditions in which expression datawere collected (ie association between gene expression andDHS changes may be condition-specific) Accessibility fre-quently reflects binding of TFs poised for activation ratherthan actively driving gene expression in a particular condition(Keene et al 1981 Sullivan et al 2014) Deletion of a poisedaccessible site should not affect expression of a neighboringgene however expression of the neighboring gene would beaffected in conditions in which the TF is driving its expressionIndeed we discovered conditional effects of deleted DHSs forseveral genes supporting the concept of poised TFsSequential cooperative binding of TFs TF oligomerizationactivating cofactors or modifications are necessary to activatepoised TFs and drive conditional gene expression (Slatteryet al 2014 Todeschini et al 2014)
Finally and perhaps most surprising we found that thevast majority of DHSs that differ in accessibility across eco-types show no underlying sequence variation at least in theavailable short-read-derived draft genomes At a first glancethis result suggests a considerable role of the trans-compo-nent (trans-acting factors that directly or indirectly regulategene expression) in diversifying gene regulation and pheno-type seemingly challenging the paradigm that short-termevolution largely acts on regulatory regions rather than cod-ing regions The prevalence of regulatory over coding evolu-tion over short evolutionary timescales is thought to arisefrom the reduced pleiotropy of regulatory changes the phe-notypic effects of which are often tissue-or condition-specificand hence less deleterious as well as the largely additiveeffects of regulatory changes that increase the efficiency ofselection (Wittkopp and Kalay 2011 Meiklejohn et al 2014)At this point the empirical evidence supporting this predic-tion is overwhelming (Carroll 2008 Wittkopp and Kalay2011)
Complex Relationships in A thaliana doi101093molbevmsx326 MBE
11Downloaded from httpsacademicoupcommbeadvance-article-abstractdoi101093molbevmsx3264767847by University of Washington useron 28 February 2018
We speculate that our finding reflects network effects aspreviously suggested (MacNeil et al 2015 Fuxman Bass et al2016) The observed changes in chromatin accessibility with-out underlying sequence variation are highly unlikely to arisethrough TF-coding changes that alter their DNA bindingRather our finding likely reflects the propagation of upstreamperturbations in the regulatory network for example activitychanges in a few upstream ldquomaster regulatorrdquo TFs may resultin lowered abundance or binding of many downstream TFsThis interpretation resonates with the empirical findings of agrowing number of studies (Beadle 1972 Doebley and Stec1991 DeCook et al 2006 Kliebenstein et al 2006 Fu et al2009 Wang et al 2010 Holloway et al 2011 Studer et al 2011Lemmon et al 2014)
In summary the anatomy of regulatory regions appears tobe fundamentally more challenging to elucidate than theanatomy of coding regions from the simple task of mappingthem to pinpointing single base pairs of functional conse-quence Our understanding of coding sequence anatomyhas advanced to the point where we can computationallypredict important domains within proteins indeed large-scale cross-species analysis of coevolution allows accuratepredictions of protein structures a prerequisite for fully un-derstanding gene function (Ovchinnikov et al 2015 Tanget al 2015 Stein et al 2015) In contrast although gene reg-ulation is sequence-driven sequence conservation in regula-tory regions is a much less reliable indicator of functionalimportance than it is for coding sequence
However chromatin accessibility is a reliable metric forpotential regulatory function of a locus and offers a meansto generate useful shortlists of putative regulatory elements(ENCODE Project Consortium 2012) Sites with different lev-els of accessibility among ecotypes and species are likelyenriched for variation that is important for phenotypeRequiring perfect correlation between chromatin accessibilityand expression of nearby genes to conclude that a locus is afunctional regulatory element would be analogous to requir-ing a mutant phenotype before concluding a gene isfunctionalmdashonly a tenth of A thaliana genes would passthis stringent definition of functionality after decades of clas-sic genetic analysis (Lloyd and Meinke 2012) Determining theanatomy of accessible regulatory regions remains an essentialalbeit challenging task of genome annotation Severalapproaches such as deep mutational scanning of specific reg-ulatory elements (Patwardhan et al 2009 Fowler et al 2010)or genome-scale enhancer and promoter screens across spe-cies (Arnold et al 2013) hold promise for solving this chal-lenge as will new technologies yet to emerge
Materials and Methods
Plant MaterialTransgenic INTACT lines harboring the UBQ10 NTF con-struct (Sullivan et al 2014) and ACT2 BirA construct (Dealand Henikoff 2010) were created for each genetic backgroundusing double Agrobacterium tumefaciens transformation TheUBQ10 promoter drives gene expression in all cell typesorgans and tissue layers investigated (Geldner et al 2009)
Transformants were selected on plates containing BASTA(15 mM) and KAN (50 mgml for all ecotypes except Ler-1which received 15 mgml) Transgenic lines are available fromABRC under the following accession numbers CS68650 (Bay-0) CS68651 (Bur-0) CS68652 (Cvi-0) CS68653 (Est-1)CS68654 (Ler-1) CS68655 (Shah) CS68656 (Tsu-1) CS68649(Col-0) Original seed stocks used to generate these transgeniclines were CS22676 (Bay-0) CS22679 (Bur-0) CS22614 (Cvi-0) CS22683 (Est-1) CS22686 (Ler-1) CS22652 (Shah)CS22693 (Tsu-1) CS28167 (Col-0)
Sample Preparation for DNase I-Seq and ATAC-SeqSeeds (01 g) were surface sterilized by treating with 70EtOH with 05 Triton for 10 min followed by 5 min in95 EtOH Seeds were dried completely on sterile filter paperand plated on 150-mm petri plates containing 50 ml 1XMSwith 08 agar covered by a sterile no 1 filter circle cut to size(Whatman GE Healthcare UK Ltd) Plates were sealed withmicropore tape double wrapped with aluminum foil andstratified for 3 days at 4C Stratified plates were unwrappedand moved to LD conditions (16 h light 22C 8 h dark 20C)in a growth chamber (Conviron CMP5090 Controlled envi-ronment ltd Winnipeg Manitoba Canada) and grown for 7days Whole seedlings were harvested at the same time of dayfor all ecotypes and nuclei were collected and DNase I treatedas in Sullivan et al 2014 Bay-0 Bur-0 Col-0 Est-1 and Tsu-1DNase I-seq samples were labeled as DS22973 DS23077DS21094 DS22974 DS22968 respectively ATAC-seq was per-formed as in Buenrostro et al 2013 except transposition ofINTACT-purified bead-bound nuclei was performed at 37 Cfor 30 min
Preparation of Ecotype DataShort read WGS data (single and paired-end [PE] reads) forBay-0 Bur-0 Est-1 Tsu-1 and Col-0 were downloaded fromthe 1001 Genomes project for A thaliana (Gan et al 2011)(http1001genomesorgindexhtml last accessed January 22018) Single-end DNase I-seq 36 bp reads were aligned to theCol-0 reference genome using bwa version 056 with defaultparameters Read alignments with mapQ of zero were filteredout ChrC and ChrM reads and centromeric regions fromClark et al (2007) (Chr1 13698788ndash15897560 Chr22450003ndash5500000 Chr3 11298763ndash14289014 Chr41800002ndash5150000 Chr5 10999996ndash13332770) were fil-tered out and the remaining reads from each sample (Bay-0 nfrac14 31756881 Bur-0 nfrac14 27556544 Col-0 nfrac14 43969877Est-1 nfrac14 30787644 Tsu-1 nfrac14 17892297) were subsampledto 175 million reads each Per-base DNase I cleavages hot-spots (John et al 2011) and DHSs (peaks) were called on thesubsampled data sets as before (Sullivan et al 2014)
Identification of Differential DHSsBay-0 Bur-0 Est-1 Tsu-1 and Col-0 DHSs were merged tocreate a ldquounionrdquo set of 49088 DHSs Per-base DNase I clea-vages within each merged DHS were calculated for each eco-type DNase I cleavages within each DHS were then summedacross all five ecotypes Variable DHSs were then identifiedbased on their CV which is the standard deviation of DHS
Alexandre et al doi101093molbevmsx326 MBE
12Downloaded from httpsacademicoupcommbeadvance-article-abstractdoi101093molbevmsx3264767847by University of Washington useron 28 February 2018
accessibility across the five ecotypes divided by the mean inDHS accessibility across the five ecotypes CV was chosen as ametric because the standard deviation of DNase I cut count isa reasonably linear function of the mean DNase I cut countfor 83 of DHSs (those with mean DNase I cut count above63) (see supplementary fig S2 Supplementary Material on-line) The CV threshold (CV frac14 056) was chosen because allDHSs which are predicted to be affected by a deletion (ieDHSs with zero per base DNase I cleavages in at least oneecotype) had a CV greater than or equal to the threshold ThisCV threshold corresponds to the top 15 percentile of DHSvariability
To identify DHSs that are differential between Bur-0 andCol-0 we first found the set of (42656) uDHSs between Bur-0and Col-0 then identified 4055 dDHSs from our above five-ecotype analysis that overlap the Bur-0Col-0 union set Wemade a histogram of the relative mean differences of DNase Icut count within each of those 4055 dDHSs between Bur-0and Col-0 Although the relative difference values rangedfrom 2 to 18 a large fraction (3283 80) of these dDHSshad a relative difference of lt03 We therefore defineddDHSs overlapping union Bur-Col-0 DHSs with a relativedifference of lt03 as differential (and higher in Col-0) be-tween Bur-0 and Col-0 (supplementary table S11Supplementary Material online) We used a similar approachto identify DHSs that are differential between Bay-0 and Col-0(44148 Bay-0Col-0 uDHSs 4046 dDHSs overlapping rangeof relative differences [2 19] 3363 [83] differential DHSsbetween Bay-0 and Col-0)
Browser tracks reflect sliding window histograms of DNaseI cut counts with bin size 150 bp and slide size 20 bp Tracksconsist of adjacent nonoverlapping bars where each bar is 20bp in width and has a height equal to the total number ofDNase I cut counts in the larger 150 bp window in which the20 bp bar is centered
Bay-0 Draft Genome AssemblyBay-0 genomic DNA was isolated from leaf tissue A PE librarywas prepared from gDNA sheared to 500 bp using an S2Focused-Ultrasonicator (Covaris Inc MA) and the TruSeqDNA PCR-Free Library Preparation Kit (Illumina Inc SanDiego CA) A mate pair library (MP) was prepared usingthe Nextera Mate Pair Library Prep Kit (Illumina Inc) follow-ing the gel-plus protocol with 8 kb inserts The PE librarywas sequenced on an Illumina MiSeq while the MP library wassequenced on an Illumina HiSeq2000 instrument The PE dataset comprised 28 million read pairs while the MP data setcomprised 43 million read pairs after sequencing Both datasets were adapter and quality trimmed using skewer (version01124 parameters -Q30 -q30 -l60) PE data was assembledwith DISCOVAR de novo (release 52488 default parameters)Contigs were scaffolded with BESST (version 220 defaultparameters) using PE and MP data as input Scaffolds werevalidation and fixed using REAPR (version 1017 defaultparameters) again using PE and MP data as input The finalassembly consisted of 59594 sequences totaling 138 Mb witha N50 of 16 Mb
Analysis of Reference BiasBoth Bay-0 and Col-0 DNase I reads were aligned to Bay-0 andCol-0 reference genomes using different alignment stringen-cies 1) perfect (maximum edit distance between read andreference of 0 maximum number of gap opens of 0) 2) de-fault settings (maximum edit distance between read and ref-erence of 004 of read length gap open penalty of 11) 3)relaxed settings (maximum edit distance between read andreference of 006 of read length gap open penalty of 15) 175M aligning reads were retained for each of these 12 align-ments Hotspots were called for each of the 12 alignments Sixsets of uDHSs were called for pairs of alignments with similaralignment settings (eg perfect) and to the same genome(eg Bay-0) For example to obtain one set of uDHSs wemerged the DHSs derived from the default-setting alignmentof Bay-0 DNase I reads to Bay-0 and the the DHSs derivedfrom the default-setting alignment of Col-0 DNase I reads toBay-0 For each of the six sets of uDHSs we then identified the1000 uDHSs in which the number of DNase I cut counts inBay-0 and Col-0 were most different using CV as our metricof distances as above Within each of these 1000 most-different uDHSs we identified whether the uDHS was mostopen in Bay-0 (orange) or Col-0 (green)
GO Term Enrichments for Genes Residing Near DHSsGO term enrichments were performed using DAVID (Huanget al 2009) Fold enrichment and FDR-corrected P-values arepresented for those categories enriched with FDR-correctedP-value of lt 005
Identification of WGS-Called Deletions gt300 bp inLength in the EcotypesDeletions were identified by calculating the mean x-coveragein all 150 bp sliding windows (overlap frac14 20 bp) for eachecotype reference using the 1001 genomes (http1001genomesorg last accessed January 2 2018) short readdata The x-coverage in each window was normalized by di-viding by the x-coverage observed for Col-0 short readsmapped back to the reference which controls for regionsof the genome that are more readily sequenced with shortreads We identified putative deletions by taking the 150 bpwindows in the bottom 1 of normalized coverage andmerged overlapping windows We then merged putativedeletions from different ecotypes that were within 1 kb ofeach other to generate the predicted deletions set used inthis analysis Using this method we determine that 19759801833441 2002154 1712785 bps are deleted in Bay-0 Bur-0Est and Tsu-1 respectively relative to the Col-0 reference
Identification of WGA-Called DeletionsWe aligned the Bay-0 draft genome to the Col-0 referencegenome using MUMmer (Kurtz et al 2004) and definedregions of the Col-0 reference genome that did not have analignment to the Bay-0 draft genome of 1 kb or more asWGA-called deletions
Complex Relationships in A thaliana doi101093molbevmsx326 MBE
13Downloaded from httpsacademicoupcommbeadvance-article-abstractdoi101093molbevmsx3264767847by University of Washington useron 28 February 2018
PHRAP-Based De Novo AssemblyFor each of the 4508 differential DHS most accessible in Col-0(dDHS-C) we identified a padded window encompassing thedDHS-C and including 200 bp extra on either side We thenextracted all reads mapping to that padded window as wellas all mates of reads mapping to these padded dDHS-C win-dows regardless of whether the mate mapped to the regionNext we extracted Col-0 sequence for these padded dDHS-Cwindows and generated a backbone fasta file with accompa-nying quality file setting the quality of each base to zero Afterconverting all the fastq files to pairs of fasta and fastaqual fileswe used PHRAP to assemble the read pairs and the backbonewith relaxed settings (gap extension penalty of 0 minscore of20 minmatch of 6) The longest contig produced is thepatched Bur-0 sequence Ten of these patched Bur-0 sequen-ces are compared with Sanger sequences and to publishedsequence (Gan et al 2011) in supplementary table S8Supplementary Material online Indicated above each Bur-0Col-0 alignment is the number of reads used in thePHRAP assembly and the number of reads used to generatethe longest contig
Proximity of Types of DHSs to Differentially ExpressedGenesWe used DESeq (Anders and Huber 2010) to the Bur-0 andCol-0 expression data presented in Gan et al (2011) (tworeplicates per ecotype) to identify 737 protein-coding geneswith differential expression between Bur-0 and Col-0 ad-justed P-value lt 002 (supplementary table S14Supplementary Material online)
For each type of DHS 100 subsamples of 50 DHSs eachwere drawn Each sample of 50 DHSs created a distribution ofdistances to the TSS of the nearest gene with differentialexpression between Col-0 and Bur-0 For each 50-DHS sub-sample the fraction of DHSs within 5 kb up- and down-stream of the nearest gene with differential expression wasrecorded The average of these fractions over the 100 50-DHSsubsamples is displayed in (fig 4A top) P-values of the dif-ference between indicated fractions were calculated using at-test comparing the means of the 100 subsample fractions
Conditionally Expressed Genes Are Near More DHSsWe aligned RNA-seq reads to the TAIR10 genome usingTopHat version 141 (Trapnell et al 2009) and used Cuffdiffversion 202 (Trapnell et al 2013) to identify 1477 10211312 and 1365 genes that were differentially expressed (P-value 005) in Col-0 in four different control versus treat-ment experiments respectively 1) dark-grown 7-day-oldseedlings compared with dark-grown seven day-old seedlingsthorn 1 day of light exposure (LD 16-h light8-h dark) 2) LD-grown 7-day-old seedlings with and without heat-shock(45C for 30 min) immediately prior to RNA preparation3) 7-day-old seedlings without and with auxin treatment(auxin-treated seedlings were sprayed with 750 ml 1 mMIAA made from 100 mM stock in 70 ethanol diluted indH2O no auxin-seedlings were mock sprayed with 750 ml00007 ethanol) 4) dark-grown seven day-old seedlingswithout and with 5 mM brassinazole (BRZ) 7 days in the
dark on plates containing 5 mM BRZ In each case totalRNA of aerial parts 7 days old LD grown seedlings of Col-0was extracted with QIAGEN RNeasy kit Two RiboMinustreatments (Invitrogen) were performed Libraries were pre-pared using the TruSeq kit v2 and submitted to Illuminasequencing (36 bp reads)
Response to Prolonged UV IrradiationCol-0 Bur-0 rev3 (CS65883) and rev7 (SALK_014571 C) seedswere germinated and grown for six days on MS Basal Saltplates under white light (16-h light8-h dark) Seven-day-oldseedlings were then transferred to soil and grown an addi-tional five or seven days under UV irradiation (Zilla 17 W full-spectrum T8 fluorescent bulb) Pools of 32-74 seedlings pergenotype were carefully removed from soil and weighed aftera total of 12- and 14-days of growth Fresh weight with andwithout UV was compared
Testing for Conditional ExpressionBur-0 and Col-0 seedlings were grown on MS Basal Salt platesfor 6 days at 22C in either constant darkness or LDs (16 hlight8 h dark) Both dark- and light-grown seedlings werethen grown an additional 24 h in 1) LD 22C 2) constantdarkness 22C 3) constant white light 4C and 4) constantdarkness 4C RNA was extracted from these 7-day-old wholeseedlings with Trizol (Invitrogen) and oligo-d(T) cDNA gen-erated from 02-05 mg total RNA with the Revert Aid FirstStrand cDNA synthesis kit (Thermo Scientific) Relative ex-pression levels were determined using qPCR (see supplemen-tary table S19 Supplementary Material online for primers)with the average between Col-0 LD 22C replicates used asbaseline AP2M (AT5G46630) was chosen as the referencegene for cDNA input control among several candidates(Wang H Wang J et al 2015) based on its overall low expres-sion level and lowest CV across ecotypes and conditions used(data not shown)
Predicted deletions near these genes were tested using theprimers listed in supplementary table S19 SupplementaryMaterial online Note that we attempted to select primersthat flanked the deletion allowing us to see a shift in bandsize This strategy succeeded for six of the ten cases In theother four cases (AT2G26990 AT5G22510 AT2G16280AT4G10340) the deletion was too large (gt25 kb) to reason-ably PCR across so primers are internal to the predicted de-letion hence no band is visible in the Bur-0 sample Seefigure 5C for gel results
Comparison on Total mRNA Nuclear mRNA and PolII Occupancy with Chromatin AccessibilityWe used three different transcription metrics whole mRNAfrom 7-day-old seedlings (GEO GSM1289364 Sullivan 2014)nuclear (INTACT) mRNA from nonhair root cells of 7-day-oldseedlings (GEO GSE19654 Deal 2010 Dev Cell) and Pol IIChIP-seq from aerial portions of 10-day-old seedlings (Liuet al 2016) to stratify the genes into nine expression quantilesfrom lowest to highest (1ndash9) We then identified the averagenumber of DNase I cuts per base pair 800 bps upstream anddownstream of genes in each quantile (see supplementary fig
Alexandre et al doi101093molbevmsx326 MBE
14Downloaded from httpsacademicoupcommbeadvance-article-abstractdoi101093molbevmsx3264767847by University of Washington useron 28 February 2018
S6 Supplementary Material online) for matching DNase Isamples (subsampled to 175 M reads (GEO GSM1289358(SE) and GSM1289359 (PE only forward reads used) for wholemRNA and Pol II 7-day-old seedling samples GEOGSM1821072 for nonhair root epidermal cells) We observea consistent trend across all three metrics genes in the high-est expression quantile are most accessible both upstreamand downstream of the gene with less expressed quantilesdecreasing monotonically One notable exception is the low-est quantile for the Pol II analysis genes with the lowest Pol IIoccupancy showed increased accessibility both up- anddownstream compared with genes with intermediate Pol IIoccupancy perhaps reflecting accessibility due to binding ofrepressors Although nuclear mRNA resulted in the cleanestseparation of quantiles by nuclease cut count the differenti-ation between peak cut count (at100 bp) and backgroundcut count (at 500 bp) was highest for whole mRNA
Calling Col-0Bay-0 SNVs and Small Indels UsingMUMmer (Version 323)The genomes of the two ecotypes were aligned chromosomeby chromosome (eg nucmer -p chr1 Bay-0pseudochromosomes_chr1fasta Col-0_chr1fsa) The deltafile generated by nucmer was then filtered using the many-to-many option (eg delta-filter -r -q chr1delta gt chr1filter)SNPs were then extracted from this filtered file (show-snps-Clr chr1filter gt chr1snps)
Calling Col-0Bur-0 SNVs and Small Indels UsingGATK and FreebayesWe called variants with GATK 36 (McKenna et al 2010) perchromosome with standard parameters (defaults plus -stand_call_conf 30) and excluded all 500 bp windows (100bp sliding) with coveragegt40 from potential calling intervalsWe called variants with freebayes 102 (Garrison and Marth2012) per chromosome with custom parameters (ndashmin-repeat-entropy 1 ndashmin-alternate-count 5 ndashstandard-filtersndashmin-coverage 3 ndashmax-coverage 100) filtered output forvariant qualitygt5 and reformatted VCF output for compat-ibility with GATK for downstream variant merging Variantsfrom both callers were additionally filtered to require mini-mum read depth of 3 and maximum depth of 99 and elim-inate calls from chloroplast and mitochondria GATK callswere additionally filtered by mean mapping quality of allreads used (MQ gt 25) an annotation that does not havean exact analog in freebayes output (see also ldquoMQM andMQMR in freebayes outputrdquo) Finally variants from bothcallers were merged into a single variant call set withGATKrsquos CombineVariants tool using the UNIQUIFY setting
Calling Bay-0 Insertion Relative to Col-0 UsingMUMmer (Version 323)As with SNP calling the genomes of the two ecotypes werefirst aligned chromosome by chromosome (eg nucmer -pchr1 Bay-0pseudochromosomes_chr1fasta Col-0_chr1fsa)The delta file generated by nucmer was then filtered usingthe many-to-many option (eg delta-filter -r -q chr1delta gtchr1filter) To call insertions the filtered alignment files were
then converted to table format (show-coords chr1filtergthr1coords) and parsed this file to identify putative Bay-0insertions as follows
We first removed all aligned segments that were eitherlt1kb long orgt100 kb away from where their expected positionassuming collinearity We then calculated the distance be-tween both adjacent Bay-0 aligned chunks and adjacentCol-0 aligned chunks and discarded regions in which theBay-0 distance was lt15 bp larger than the Col-0 chunk (ieregions where there is a similar-sized gap in the alignment forboth Col-0 and Bay-0 suggesting the presence of a hypervar-iable region rather than an insertion or deletion on one eco-type) We also discarded ldquogapsrdquo between adjacent alignmentchunks that were less than zero (ie that the adjacent collinearalignments overlapped) The remaining gaps between alignedBay-0 chunks were identified as putative Bay-0 insertions
We extracted the sequence in these putative Bay-0 inser-tions from the de novo Bay-0 assembly and blasted them to adatabase made from sequence annotated as transposon inAraport11 Regions with over 95 sequence identity to any-thing in this transposon database were flagged as homolo-gous to transposon sequence
Data AccessDNase I-seq data are available at httpwwwplantregulomeorgdatareleases last accessed January 2 2018 and at GEO(httpswwwncbinlmnihgovgeo Bay-0 GSM1289371Bur-0 GSM1289370 last accessed January 2 2018 Col-0GSM1289358 and GSM1289359 Est-1 GSM1289372 Tsu-1GSM1289373)
ATAC-seq data are available at httpswwwncbinlmnihgovsratermfrac14SRP098594
RNA-seq data are available at httpwwwplantregulomeorgpublicrna and at GEO (httpswwwncbinlmnihgovgeo dark-grown 7-day-old seedlings GSM1289365 dark-grown 7-day-old seedlings thorn 1 day of light exposureGSM1289368 LD-grown 7-day-old seedlings with 45C heat-shock for 30 min GSM1289369 LD-grown 7-day-old seedlings(without heatshock) GSM1289364 7-day-old seedlings with-out auxin treatment (sprayed with water) GSM2719422 7-day-old seedlings with auxin treatment GSM2719421 dark-grown 7-day-old seedlings with 5 mM BRZ GSM2719420)Cuffdiff results are listed in supplementary tables S15ndashS18Supplementary Material online
Supplementary MaterialSupplementary data are available at Molecular Biology andEvolution online
AcknowledgmentsThis work was supported by grants from the National ScienceFoundation (MCB1243627 to CQ and JLN andMCB1516701 to CQ) KJ-B was supported by a Big DataTraining Grant for Genomics and Neuroscience(1T32CA206089-01A1) Generation of the Bay-0 draft ge-nome was supported by DFG SPP1529 ADAPTOMICS (FBDJ DW) MWD was supported by an NSF Graduate
Complex Relationships in A thaliana doi101093molbevmsx326 MBE
15Downloaded from httpsacademicoupcommbeadvance-article-abstractdoi101093molbevmsx3264767847by University of Washington useron 28 February 2018
Research Fellowship SF is an investigator of the HowardHughes Medical Institute which supported JTC We thankthe Stamatoyannopoulos lab for generously providing se-quencing and analysis resources
Author ContributionsCMA KLB JLN and CQ conceived the project KLBCMA and CQ wrote the article AMS JLN DW andSF provided comments KJ-B JLH and KLB conducteddata analysis CMA JRU MWD JTC AMS AAA ATconducted experiments FB DJ and DW provided the Bay-0draft genome All authors read and approved the article
References1001 Genomes Consortium 2016 1135 genomes reveal the global
pattern of polymorphism in Arabidopsis thaliana Cell 166(2)481ndash491
Anders S Huber W 2010 Differential expression analysis for sequencecount data Genome Biol 11(10)R106
Arnold CD Gerlach D Stelzer C Boryn ŁM Rath M Stark A 2013Genome-wide quantitative enhancer activity maps identified bySTARR-seq Science 339(6123)1074ndash1077
Beadle George W 1972 The Mystery of Maize In Joyce Zibro editorField Museum of Natural History Bulletin p 212ndash221
Bleuroasing OE Gibon Y Gunther M Hohne M Morcuende R Osuna DThimm O Usadel B Scheible W-R Stitt M 2005 Sugars and circa-dian regulation make major contributions to the global regulation ofdiurnal gene expression in Arabidopsis Plant Cell 17(12)3257ndash3281
Blatti C Kazemian M Wolfe S Brodsky M Sinha S 2015 Integratingmotif DNA accessibility and gene expression data to build regula-tory maps in an organism Nucleic Acids Res 43(8)3998ndash4012
Bomblies K Yant L Laitinen RA Kim S-T Hollister JD Warthmann NFitz J Weigel D 2010 Local-scale patterns of genetic variability out-crossing and spatial structure in natural stands of Arabidopsis thali-ana PLoS Genet 6(3)e1000890
Britten RJ Davidson EH 1969 Gene regulation for higher cells a theoryScience 165(3891)349ndash357
Broomfield S Hryciw T Xiao W 2001 DNA postreplication repairand mutagenesis in Saccharomyces cerevisiae Mut Res 486(3)167ndash184
Buchanan-Wollaston V Page T Harrison E Breeze E Lim PO Nam HGLin J-F Wu S-H Swidzinski J Ishizaki K 2005 Comparative tran-scriptome analysis reveals significant differences in gene expressionand signalling pathways between developmental and darkstarvation-induced senescence in Arabidopsis Plant J Cell Mol Biol42(4)567ndash585
Buenrostro JD Giresi PG Zaba LC Chang HY Greenleaf WJ 2013Transposition of native chromatin for fast and sensitive epigenomicprofiling of open chromatin DNA-binding proteins and nucleosomeposition Nat Methods 10(12)1213ndash1218
Carroll SB 2008 Evo-devo and an expanding evolutionary synthesis agenetic theory of morphological evolution Cell 134(1)25ndash36
Choi K Reinhard C Serra H Ziolkowski PA Underwood CJ Zhao XHardcastle TJ Yelina NE Griffin C Jackson M et al 2016Recombination rate heterogeneity within Arabidopsis disease resis-tance genes PLoS Genet 12(7)e1006179
Clark RM Schweikert G Toomajian C Ossowski S Zeller G Shinn PWarthmann N Hu TT Fu G Hinds DA et al 2007 Common se-quence polymorphisms shaping genetic diversity in Arabidopsisthaliana Science 317(5836)338ndash342
Clark RM Wagler TN Quijada P Doebley J 2006 A Distant up-stream enhancer at the maize domestication gene tb1 has pleio-tropic effects on plant and inflorescent architecture Nat Genet38(5)594ndash597
Coller HA Kruglyak L 2008 Genetics Itrsquos the sequence stupid Science322(5900)380ndash381
Crow JF Kimura M 1970 An introduction to population genetics the-ory New York Evanston and London Harper amp Row Publishershttpwwwcabdirectorgabstracts19710105376html
Deal RB Henikoff S 2010 A simple method for gene expression andchromatin profiling of individual cell types within a tissue Dev Cell18(6)1030ndash1040
DeCook R Lall S Nettleton D Howell SH 2006 Genetic regulation ofgene expression during shoot development in Arabidopsis Genetics172(2)1155ndash1164
Doebley J Stec A 1991 Genetic analysis of the morphological differencesbetween maize and teosinte Genetics 129(1)285ndash295
Elgin SC 1981 DNAase I-hypersensitive sites of chromatin Cell 27(3 Pt2)413ndash415
ENCODE Project Consortium 2012 An integrated encyclopedia of DNAelements in the human genome Nature 489(7414)57ndash74
Felsenstein J 1974 The evolutionary advantage of recombinationGenetics 78(2)737ndash756
Feng J Villeponteau B 1992 High-resolution analysis of c-Fos chromatinaccessibility using a novel DNase I-PCR assay Biochim Biophys Acta1130(3)253ndash258
Fowler DM Araya CL Fleishman SJ Kellogg EH Stephany JJ Baker DFields S 2010 High-resolution mapping of protein sequence-function relationships Nat Methods 7(9)741ndash746
Fu J Keurentjes JJB Bouwmeester H America T Verstappen FWA WardJL Beale MH de Vos RCH Dijkstra M Scheltema RA et al 2009System-wide molecular evidence for phenotypic buffering inArabidopsis Nat Genet 41(2)166ndash167
Furey TS 2012 ChIPndashseq and beyond new and improved methodolo-gies to detect and characterize proteinndashDNA interactions Nat RevGenet 13(12)840ndash852
Fuxman Bass JI Pons C Kozlowski L Reece-Hoyes JS Shrestha S HoldorfAD Mori A Myers CL Walhout AJ 2016 A gene-centered C elegansprotein-DNA interaction network provides a framework for func-tional predictions Mol Syst Biol 12(10)884
Gan X Stegle O Behr J Steffen JG Drewe P Hildebrand KL Lyngsoe RSchultheiss SJ Osborne EJ Sreedharan VT et al 2011 Multiple ref-erence genomes and transcriptomes for Arabidopsis thalianaNature 477(7365)419ndash423
Garrison E Marth G 2012 Haplotype-based variant detection fromshort-read sequencing arXiv [q-BioGN] arXiv httparxivorgabs12073907
Geldner N Denervaud-Tendon V Hyman DL Mayer U Stierhof Y-DChory J 2009 Rapid combinatorial analysis of membrane compart-ments in intact plants with a multicolor marker set Plant J Cell MolBiol 59(1)169ndash178
Gibon Y Usadel B Blaesing OE Kamlage B Hoehne M Trethewey R StittM 2006 Integration of metabolite with transcript and enzyme ac-tivity profiling during diurnal cycles in Arabidopsis rosettes GenomeBiol 7(8)R76
Gottesfeld JM Murphy RF Bonner J 1975 Structure of transcriptionallyactive chromatin Proc Natl Acad Sci U S A 72(11)4404ndash4408
Gross DS Garrard WT 1988 Nuclease hypersensitive sites in chromatinAnnu Rev Biochem 57(1)159ndash197
Guenther CA Tasic B Luo L Bedell MA Kingsley DM 2014 A molecularbasis for classic blond hair color in Europeans Nat Genet46(7)748ndash752
Hattori T Totsuka M Hobo T Kagaya Y Yamamoto-Toyoda A 2002Experimentally determined sequence requirement of ACGT-containing abscisic acid response element Plant Cell Physiol43(1)136ndash140
Hesselberth JR Chen X Zhang Z Sabo PJ Sandstrom R Reynolds APThurman RE Neph S Kuehn MS Noble WS et al 2009 Globalmapping of protein-DNA interactions in vivo by digital genomicfootprinting Nat Methods 6(4)283ndash289
Holloway B Luck S Beatty M Rafalski J-A Li B 2011 Genome-wideexpression quantitative trait loci(eQTL) analysis in maize BMCGenomics 12(June)336
Alexandre et al doi101093molbevmsx326 MBE
16Downloaded from httpsacademicoupcommbeadvance-article-abstractdoi101093molbevmsx3264767847by University of Washington useron 28 February 2018
Huang DW Sherman BT Lempicki RA 2009 Systematic and integrativeanalysis of large gene lists using DAVID bioinformatics resources NatProtoc 4(1)44ndash57
John S Sabo PJ Thurman RE Sung M-H Biddie SC Johnson TA HagerGL Stamatoyannopoulos JA 2011 Chromatin accessibilitypre-determines glucocorticoid receptor binding patterns NatGenet 43(3)264ndash268
Jolma A Yin Y Nitta KR Dave K Popov A Taipale M Enge M Kivioja TMorgunova E Taipale J 2015 DNA-dependent formation of tran-scription factor pairs alters their binding specificity Nature527(November)384ndash388
Joubes J Raffaele S Bourdenx B Garcia C Laroche-Traineau J Moreau PDomergue F Lessire R 2008 The VLCFA elongase gene family inArabidopsis thaliana phylogenetic analysis 3D modelling and ex-pression profiling Plant Mol Biol 67(5)547ndash566
Karve A Moore BD 2009 Function of Arabidopsis hexokinase-like1 as anegative regulator of plant growth J Exp Bot 60(14)4137ndash4149
Karve A Xia X Moore BD 2012 Arabidopsis hexokinase-like1 and hexo-kinase1 form a critical node in mediating plant glucose and ethyleneresponses Plant Physiol 158(4)1965ndash1975
Kawakatsu T Huang S-SC Jupe F Sasaki E Schmitz RJ Urich MACastanon R Nery JR Barragan C He Y et al 2016 Epigenomicdiversity in a global collection of Arabidopsis thaliana accessionsCell 166(2)492ndash505
Keene MA Corces V Lowenhaupt K Elgin SC 1981 DNase I hypersen-sitive sites in Drosophila chromatin occur at the 5rsquo ends of regions oftranscription Proc Natl Acad Sci U S A 78(1)143ndash146
Kim J He X Sinha S 2009 Evolution of regulatory sequences in 12Drosophila species PLoS Genet 5(1)e1000330
Kim S Plagnol V Hu TT Toomajian C Clark RM Ossowski S Ecker JRWeigel D Nordborg M 2007 Recombination and linkage disequi-librium in Arabidopsis thaliana Nat Genet 39(9)1151ndash1155
King MC Wilson AC 1975 Evolution at two levels in humans andchimpanzees Science 188(4184)107ndash116
Kliebenstein DJ West MAL van Leeuwen H Loudet O Doerge RW StClair DA 2006 Identification of QTLs controlling gene expressionnetworks defined a priori BMC Bioinformatics 7(1)308
Kover PX Valdar W Trakalo J Scarcelli N Ehrenreich IM PuruggananMD Durrant C Mott R 2009 A multiparent advanced generationinter-cross to fine-map quantitative traits in Arabidopsis thalianaPLoS Genet 5(7)e1000551
Kurtz S Phillippy A Delcher AL Smoot M Shumway M Antonescu CSalzberg SL 2004 Versatile and open software for comparing largegenomes Genome Biol 5(2)R12
Kvon EZ Kazmar T Stampfel G Ya~nez-Cuna JO Pagani M SchernhuberK Dickson BJ Stark A 2014 Genome-scale functional characteriza-tion of drosophila developmental enhancers in vivo Nature512(7512)91ndash95
Lemmon ZH Bukowski R Sun Q Doebley JF 2014 The role of cis reg-ulatory evolution in maize domestication PLoS Genet10(11)e1004745
Lempe J Balasubramanian S Sureshkumar S Singh A Schmid M WeigelD 2005 Diversity of flowering responses in wild Arabidopsis thalianastrains PLoS Genet 1(1)109ndash118
Li F Zheng Q Vandivier LE Willmann MR Chen Y Gregory BD 2012Regulatory impact of RNA secondary structure across theArabidopsis transcriptome Plant Cell Online 24(11) AmericanSociety of Plant Biologists4346ndash4359
Liu L Adrian J Pankin A Hu J Dong X von Korff M Turck F 2014Induced and natural variation of promoter length modulates thephotoperiodic response of FLOWERING LOCUS T Nat Commun5(August)4558
Liu C Wang C Wang G Becker C Zaidem M Weigel D 2016 Genome-Wide Analysis of Chromatin Packing in Arabidopsis Thaliana atSingle-Gene Resolution Genome Res 26(8)1057ndash1068
Lloyd J Meinke D 2012 A comprehensive dataset of genes with a loss-of-function mutant phenotype in Arabidopsis Plant Physiol158(3)1115ndash1129
Ludwig MZ Bergman C Patel NH Kreitman M 2000 Evidence for sta-bilizing selection in a eukaryotic enhancer element Nature403(6769)564ndash567
MacNeil LT Pons C Arda HE Giese GE Myers CL Walhout AJM 2015Transcription factor activity mapping of a tissue-specific in vivo generegulatory network Cell Syst 1(2)152ndash162
McKenna A Hanna M Banks E Sivachenko A Cibulskis K Kernytsky AGarimella K Altshuler D Gabriel S Daly M et al 2010 The genomeanalysis toolkit a mapreduce framework for analyzing next-generation DNA sequencing data Genome Res 20(9)1297ndash1303
Meiklejohn CD Coolon JD Hartl DL Wittkopp PJ 2014 The roles of cis-and trans-regulation in the evolution of regulatory incompatibilitiesand sexually dimorphic gene expression Genome Res 24(1)84ndash95
Mikkelsen MD Thomashow MF 2009 A role for circadian eveningelements in cold-regulated gene expression in Arabidopsis Plant JCell Mol Biol 60(2)328ndash339
Muller HJ 1966 The gene material as the initiator and the organizingbasis of life Am Nat 100(915)493ndash517
Nelson AC Wardle FC 2013 Conserved non-coding elements and cisregulation actions speak louder than words Development140(7)1385ndash1395
Ohno S 1972 An argument for the genetic simplicity of man and othermammals J Hum Evol 1(6)651ndash662
OrsquoMalley RC Huang S-SC Song L Lewsey MG Bartlett A Nery JR GalliM Gallavotti A Ecker JR 2016 Cistrome and epicistrome featuresshape the regulatory DNA landscape Cell 165(5)1280ndash1292
Ovchinnikov S Kinch L Park H Liao Y Pei J Kim DE Kamisetty HGrishin NV Baker D 2015 Large-scale determination of previouslyunsolved protein structures using evolutionary information eLife4(September)e09248
Patwardhan RP Lee C Litvin O Young DL Persquoer D Shendure J 2009High-resolution analysis of DNA regulatory elements by syntheticsaturation mutagenesis Nat Biotechnol 27(12)1173ndash1175
Payne JL Wagner A 2015 Mechanisms of mutational robustness intranscriptional regulation Front Genet 6322
Plantegenet S Weber J Goldstein DR Zeller G Nussbaumer C Thomas JWeigel D Harshman K Hardtke CS 2009 Comprehensive analysis ofArabidopsis expression level polymorphisms with simple inheri-tance Mol Syst Biol 5242
Rodgers-Melnick E Vera DL Bass HW Buckler ES 2016 Open chromatinreveals the functional maize genome Proc Natl Acad Sci U S A113(22)E3177ndashE3184
Sabo PJ Hawrylycz M Wallace JC Humbert R Yu M Shafer AKawamoto J Hall R Mack J Dorschner MO et al 2004 Discoveryof functional noncoding elements by digital analysis of chromatinstructure Proc Natl Acad Sci U S A 101(48)16837ndash16842
Sabo PJ Kuehn MS Thurman R Johnson BE Johnson EM Cao H Yu MRosenzweig E Goldy J Haydock A et al 2006 Genome-scale map-ping of DNase I sensitivity in vivo using tiling DNA microarrays NatMethods 3(7)511ndash518
Segal E Raveh-Sadka T Schroeder M Unnerstall U Gaul U 2008Predicting expression patterns from regulatory sequence inDrosophila segmentation Nature 451(7178)535ndash540
Shibata Y Sheffield NC Fedrigo O Babbitt CC Wortham M Tewari AKLondon D Song L Lee B-K Iyer VR et al 2012 Extensive evolutionarychanges in regulatory element activity during human origins areassociated with altered gene expression and positive selectionPLoS Genet 8(6)e1002789
Shu W Chen H Bo X Wang S 2011 Genome-wide analysis of therelationships between DNaseI HS histone modifications and geneexpression reveals distinct modes of chromatin domains NucleicAcids Res 39(17)7428ndash7443
Sievers F Wilm A Dineen D Gibson TJ Karplus K Li W Lopez R et al2011 Fast scalable generation of high-quality protein multiple se-quence alignments using clustal omega Mol Syst Biol7(October)539
Slattery M Riley T Liu P Abe N Gomez-Alcala P Dror I Zhou T Rohs RHonig B Bussemaker HJ et al 2011 Cofactor binding evokes latent
Complex Relationships in A thaliana doi101093molbevmsx326 MBE
17Downloaded from httpsacademicoupcommbeadvance-article-abstractdoi101093molbevmsx3264767847by University of Washington useron 28 February 2018
differences in DNA binding specificity between hox proteins Cell147(6)1270ndash1282
Slattery M Zhou T Yang L Dantas Machado AC Gordan R Rohs R2014 Absence of a simple code how transcription factors read thegenome Trends Biochem Sci 39(9)381ndash399
Song L Zhang Z Grasfeder LL Boyle AP Giresi PG Lee B-K Sheffield NCGreuroaf S Huss M Keefe D et al 2011 Open chromatin defined byDNaseI and FAIRE identifies regulatory elements that shape cell-typeidentity Genome Res 21(10)1757ndash1767
Stam M Belele C Dorweiler JE Chandler VL 2002 Differential chromatinstructure within a tandem array 100 kb upstream of the maize b1locus is associated with paramutation Genes Dev 16(15)1906ndash1918
Stein RR Marks DS Sander C 2015 Inferring pairwise interactions frombiological data using maximum-entropy probability models PLoSComput Biol 11(7)e1004182
Stern DL Frankel N 2013 The structure and evolution of cis-regulatoryregions the shavenbaby story Philos Trans R Soc Lond Ser B Biol Sci368(1632)20130028
Studer A Zhao Q Ross-Ibarra J Doebley J 2011 Identification of afunctional transposon insertion in the maize domestication genetb1 Nat Genet 43(11)1160ndash1163
Sullivan AM Arsovski AA Lempe J Bubb KL Weirauch MT Sabo PJSandstrom R Thurman RE Neph S Reynolds AP et al 2014Mapping and dynamics of regulatory DNA and transcription factornetworks in A thaliana Cell Rep 8(6)2015ndash2030
Sullivan AM Bubb KL Sandstrom R Stamatoyannopoulos JA QueitschC 2015 DNase I hypersensitivity mapping genomic footprintingand transcription factor networks in plants Curr Plant Biol 3ndash440ndash47
Takahashi S Sakamoto A Sato S Kato T Tabata S Tanaka A 2005 Rolesof Arabidopsis AtREV1 and AtREV7 in translesion synthesis PlantPhysiol 138(2)870ndash881
Tang Y Huang YJ Hopf TA Sander C Marks DS Montelione GT 2015Protein structure determination by combining sparse NMR datawith evolutionary couplings Nat Methods 12(8)751ndash754
Todeschini A-L Georges A Veitia RA 2014 Transcription factors specificDNA binding and specific gene regulation Trends Genet30(6)211ndash219
Trapnell C Hendrickson DG Sauvageau M Goff L Rinn JL Pachter L2013 Differential analysis of gene regulation at transcript resolutionwith RNA-seq Nat Biotechnol 31(1)46ndash53
Trapnell C Pachter L Salzberg SL 2009 TopHat discovering splice junc-tions with RNA-Seq Bioinformatics 25(9)1105ndash1111
Vierstra J Reik A Chang K-H Stehling-Sun S Zhou Y Hinkley SJ PaschonDE Zhang L Psatha N Bendana YR et al 2015 Functional foot-printing of regulatory DNA Nat Methods 12(10)927ndash930
Vierstra J Rynes E Sandstrom R Zhang M Canfield T Hansen RSStehling-Sun S Sabo PJ Byron R Humbert R et al 2014 Mouseregulatory DNA landscapes reveal global principles of cis-regulatory evolution Science 346(6212)1007ndash1012
Vierstra J Stamatoyannopoulos JA 2016 Genomic footprinting NatMethods 13(3)213ndash221
Villar D Berthelot C Aldridge S Rayner TF Lukk M Pignatelli M Park TJDeaville R Erichsen JT Jasinska AJ et al 2015 Enhancer evolutionacross 20 mammalian species Cell 160(3)554ndash566
Wang C Liu C Roqueiro D Grimm D Schwab R Becker C Lanz CWeigel D 2015 Genome-wide analysis of local chromatin packing inArabidopsis thaliana Genome Res 25(2)246ndash256
Wang H Wang J Jiang J Chen S Guan Z Liao Y Chen F 2015 Referencegenes for normalizing transcription in diploid and tetraploidArabidopsis Sci Rep 4(October)6781
Wang J Yu H Xie W Xing Y Yu S Xu C Li X Xiao J Zhang Q 2010 Aglobal analysis of QTLs for expression variations in rice shoots at theearly seedling stage Plant J Cell Mol Biol 63(6)1063ndash1074
Wang Y-M Zhou P Wang L-Y Li Z-H Zhang Y-N Zhang Y-X 2012Correlation between DNase I hypersensitive site distribution andgene expression in HeLa S3 cells PloS One 7(8)e42414
Weber B Zicola J Oka R Stam M 2016 Plant enhancers a call fordiscovery Trends Plant Sci 21(11)974ndash987
Weintraub H Groudine M 1976 Chromosomal subunits in active geneshave an altered conformation Science 193(4256)848ndash856
Wilson MD Barbosa-Morais NL Schmidt D Conboy CM Vanes LTybulewicz VLJ Fisher EMC Tavare S Odom DT 2008 Species-specific transcription in mice carrying human chromosome 21Science 322(5900)434ndash438
Wittkopp Patricia J Kalay GIZEM 2011 Cis-regulatory elements molec-ular mechanisms and evolutionary processes underlying divergenceNat Rev Genet 13(1)59ndash69
Wong B 2011 Points of view color blindness Nat Methods 8(6)441Wu C Wong YC Elgin SC 1979 The chromatin structure of specific
genes II Disruption of chromatin structure during gene activity Cell16(4)807ndash814
Zentner GE Tesar PJ Scacheri PC 2011 Epigenetic signatures distinguishmultiple classes of enhancers with distinct cellular functionsGenome Res 21(8)1273ndash1283
Zheng Q Ryvkin P Li F Dragomir I Valladares O Yang J Cao K Wang L-S Gregory BD Copenhaver GP 2010 Genome-wide double-stranded RNA sequencing reveals the functional significance ofbase-paired RNAs in Arabidopsis PLoS Genet 6(9)e1001141
Zuckerkandl E Pauling L 1965 Evolutionary divergence and conver-gence in proteins Evolving Genes Prot 9797ndash166
Alexandre et al doi101093molbevmsx326 MBE
18Downloaded from httpsacademicoupcommbeadvance-article-abstractdoi101093molbevmsx3264767847by University of Washington useron 28 February 2018
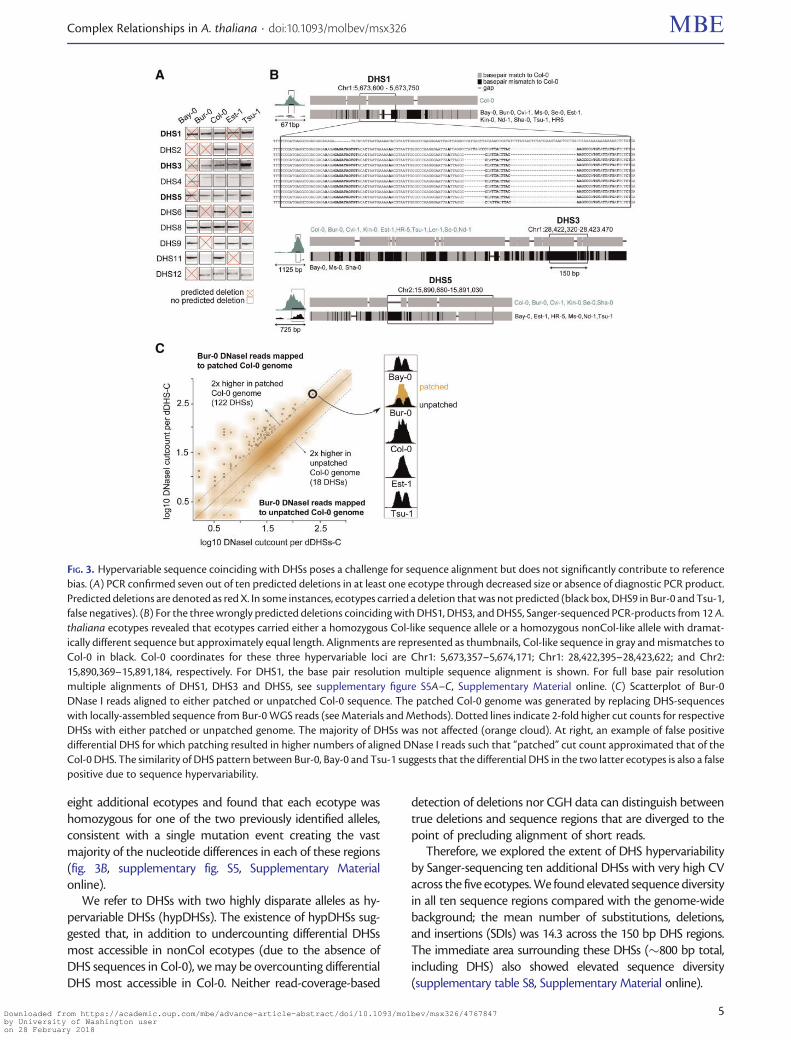
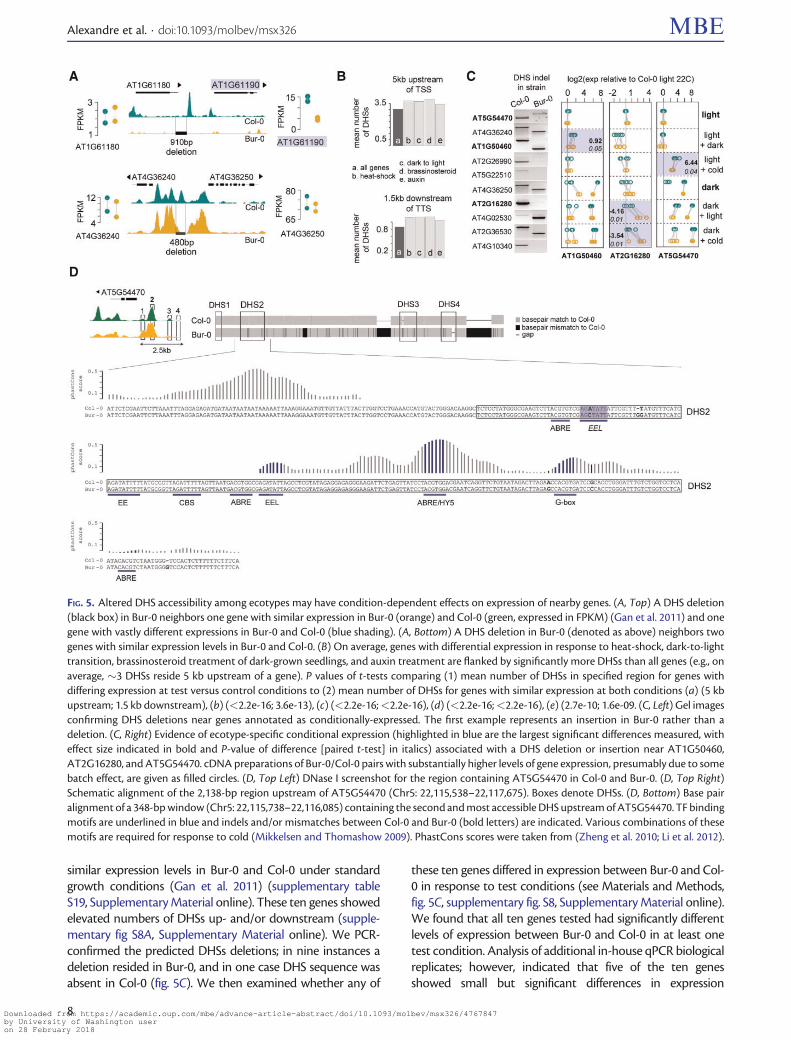