complex evolution in aphis gossypii group (hemiptera
TRANSCRIPT
RESEARCH ARTICLE
Complex evolution in Aphis gossypii group
(Hemiptera: Aphididae), evidence of primary
host shift and hybridization between
sympatric species
Yerim Lee1, Thomas Thieme2, Hyojoong KimID1*
1 Animal Systematics Laboratory, Department of Biology, Kunsan National University, Gunsan, Republic of
Korea, 2 BTL Bio-Test Labor GmbH Sagerheide, RG Phyto-Entomology, Gross Lusewitz, Germany
Abstract
Aphids provide a good model system to understand the ecological speciation concept, since
the majority of the species are host-specific, and they spend their entire lifecycle on certain
groups of host plants. Aphid species that apparently have wide host plant ranges have often
turned out to be complexes of host-specialized biotypes. Here we investigated the various
host-associated populations of the two recently diverged species, Aphis gossypii and A.
rhamnicola, having multiple primary hosts, to understand the complex evolution with host-
associated speciation. Using mitochondrial DNA marker and nine microsatellite loci, we
reconstructed the haplotype network, and analyzed the genetic structure and relationships.
Approximate Bayesian computation was also used to infer the ancestral primary host and
host-associated divergence, which resulted in Rhamnus being the most ancestral host for
A. gossypii and A. rhamnicola. As a result, Aphis gossypii and A. rhamnicola do not ran-
domly use their primary and secondary host plants; rather, certain biotypes use only some
secondary and specific primary hosts. Some biotypes are possibly in a diverging state
through specialization to specific primary hosts. Our results also indicate that a new heteroe-
cious race can commonly be derived from the heteroecious ancestor, showing strong evi-
dence of ecological specialization through a primary host shift in both A. gossypii and A.
rhamnicola. Interestingly, A. gossypii and A. rhamnicola shared COI haplotypes with each
other, thus there is a possibility of introgression by hybridization between them by cross-
sharing same primary hosts. Our results contribute to a new perspective in the study of
aphid evolution by identifying complex evolutionary trends in the gossypii sensu lato
complex.
Introduction
Phytophagous insects are a group of tremendous diversity that covers a quarter of all known
terrestrial biodiversity [1,2]. It has long been a concern to identify the evolutionary force of
PLOS ONE
PLOS ONE | https://doi.org/10.1371/journal.pone.0245604 February 4, 2021 1 / 28
a1111111111
a1111111111
a1111111111
a1111111111
a1111111111
OPEN ACCESS
Citation: Lee Y, Thieme T, Kim H (2021) Complex
evolution in Aphis gossypii group (Hemiptera:
Aphididae), evidence of primary host shift and
hybridization between sympatric species. PLoS
ONE 16(2): e0245604. https://doi.org/10.1371/
journal.pone.0245604
Editor: Owain Rhys Edwards, CSIRO, AUSTRALIA
Received: June 2, 2020
Accepted: January 5, 2021
Published: February 4, 2021
Peer Review History: PLOS recognizes the
benefits of transparency in the peer review
process; therefore, we enable the publication of
all of the content of peer review and author
responses alongside final, published articles. The
editorial history of this article is available here:
https://doi.org/10.1371/journal.pone.0245604
Copyright: © 2021 Lee et al. This is an open access
article distributed under the terms of the Creative
Commons Attribution License, which permits
unrestricted use, distribution, and reproduction in
any medium, provided the original author and
source are credited.
Data Availability Statement: All relevant data are
within the manuscript and its Supporting
Information files (input files included in ZIP file).
Funding: The Korea Environment Industry &
Technology Institute (KEITI) through Exotic

their remarkable diversity [3]. In most cases, phytophagous lineages have a much higher diver-
sity than their closely related non-phytophagous lineages [3,4]. They have an intimate relation-
ship with certain and non-random host plant groups [5]. These findings often lead to the
assumption that the host plant relationship holds the key to diversification in phytophagous
insects [5,6]. In particular, many observations of host-specific races have provided crucial evi-
dence to support these assumptions [2,7,8]. Walsh [9] first proposed an ecological speciation
scenario to explain the formation of sympatric host-associated populations (HAPs). The basic
scenario of ecological speciation is that the transition to new host plants provides opportunities
to have novel ecological niches for phytophagous insects, and contribute to different host pref-
erences and genetic isolation; and this subsequently resulted in speciation [10].
The ecological speciation concept has also been extensively applied to explain the process of
aphid speciation [11–14]. Aphids provide a good model system, since the majority of species
are host-specific, and they spend their entire lifecycles on certain groups of host plants [15,16].
Over the past decades, numerous studies have focused on the host relationship as a major fac-
tor in their speciation [15]. As one of the decisive examples, aphid species that apparently have
wide host plant ranges (i.e. polyphagous) have often turned out to be complexes of host-spe-
cialized biotypes [11,12]. It is well known that the pea aphid, Acyrthosiphon pisum (Harris),
the most well-studied aphid species, is a set of genetically well-distinguished biotypes linked
with different legume species, which can be described as an example of sympatric speciation
[11,17–19]. A similar pattern is also found in Uroleucon spp., which live on certain species or
some closely related plants within Asteraceae [20]. These groups of aphids show typical diver-
sification patterns on a narrow range of related host plants (within the same family) through a
trade-off in host use, gradual reduction of gene flow, and genetic drift [11,19]. In addition,
these examples are only possible if there is a mass of communities between closely related
plants, which are mainly reported when many species of host plants live in similar conditions,
such as asters and legumes [11,20,21].
In contrast to these classic examples, several species exhibit extreme polyphagous behavior,
which occurs on a wide variety of unrelated plant families [15,22]. As one of the most repre-
sentative polyphagous aphids, the cotton-melon aphid, Aphis gossypii Glover, is associated
with about 900 plants belonging to 116 plant families, including more than 100 important
crops worldwide [22,23]. The lifecycle of A. gossypii is as highly variable as its wide distribution
range [22,24,25]. It has long been described as permanently anholocyclic [26], which is why
studies on host change and primary hosts have rarely been conducted. First, Kring [27]
reported that this aphid can perform a holocycly in North America. Today we have to assume
that gossypii occurs in North America, East Asia, and Europe in numerous lines, some of
which have a permanent anholocyclic reproduction, while others also have a holocyclic gener-
ation cycle [28]. Those points aside, the most unusual feature of this species is that they use pri-
mary hosts belonging to various unrelated plant families (e.g. Malvaceae, Punicaceae,
Rhamnaceae, Rubiaceae and Rutaceae) [22,26]. This is particularly interesting in evolutionary
terms, and makes A. gossypii a good model for understanding the evolutionary process associ-
ated with the primary hosts of heteroecious aphids.
Approximately 10% of 5,000 aphid species exhibit the seasonal host alternation (i.e. het-
eroecy) between primary and secondary hosts, which mysteriously are comprised with a set of
phylogenetically unrelated host plants [22,29,30]. In addition, among all phytophagous insects,
the complex life cycle completed by multiple generations is known to be limited to the aphids
(Aphidoidea) [31,32]. In particular, the success of species diversity and remarkable host plant
relationship are believed to be attributed to multiple acquisition and the loss of heteroecy
[33,34]. Lifecycles of heteroecious aphids usually comprise migration from the primary host to
the secondary host [35]. For one cycle, sexual and asexual reproductions occur accompanied
PLOS ONE Complex evolution in Aphis gossypii group
PLOS ONE | https://doi.org/10.1371/journal.pone.0245604 February 4, 2021 2 / 28
Invasive Species Management Program funded
this study via a grant (2018002270005) awarded to
HK. (www.keiti.re.kr) The Basic Science Research
Program through the National Research
Foundation of Korea (NRF) funded by the Ministry
of Education funded this study via a grant
(2018R1D1A3B07044298) awarded to HK. (www.
nrf.re.kr) The funders had no role in study design,
data collection and analysis, decision to publish, or
preparation of the manuscript. BTL Bio-Test Labor
GmbH provided support via salary for TT, but did
not have any additional role in the study design,
data collection and analysis, decision to publish, or
preparation of the manuscript. (www.biotestlab.de)
The specific roles of these authors are articulated in
the ‘author contributions’ section.
Competing interests: The authors have read the
journal’s policy and declare the following
competing interests: TT is a paid employee of BTL
Bio-Test Labor GmbH (www.biotestlab.de). There
are no patents, products in development or
marketed products associated with this research to
declare. This does not alter our adherence to PLOS
ONE policies on sharing data and materials.

by several morphological changes as the generation passes [35]. Most heteroecious aphids use
a much narrower range of primary host (within the same family or genus), even if they have a
wide range of secondary hosts [36]. These patterns are even observed to extend to the closely
related aphid species. For example, eight Hyperomyzus species are known to have host alterna-
tion with the primary hosts within the genus Ribes, even though these species have wider rela-
tionships with various secondary hosts, such as Asteraceae and Scrophulariaceae [22].
There are different views about these contrasting host ranges of primary and secondary
hosts. The first view suggested that primary host specialization is in evolutionary terms more
favored, because a primary host not only provides nutrients, but also a mating place [37]. For
heteroecious aphids, a primary host is a place where sexual reproduction takes place, as well as
the overwintering eggs hatch, and the following fundatrix stage [35,38]. However, on the sec-
ondary host, only asexual reproduction occurs before the migration for overwintering [35,38].
Thus, having different primary hosts, rather than those with different secondary hosts, may
have a greater significance in reproduction. In other words, a constraint of primary host is pos-
sibly linked to the mating success of a species [15,37]. The second view hypothesized that host
alternation is only a by-product of an evolutionary process that occurs due to the phylogenetic
constraints of fundatrix to the primary host [32,33]. This is the so-called fundatrix specializa-
tion hypothesis (Fig 1), which is based on the following assumptions: i) monoecy is evolution-
arily more favored than heteroecy, ii) primary hosts are more ancestral than secondary hosts,
iii) the fundatrix is highly adaptive to the primary host, but maladaptive to the secondary host,
and iv) secondary hosts are more labile, and more recently obtained than primary hosts
[31,32,39]. Under this hypothesis, the loss of a primary host was described as escape, and spe-
cialization to a specific secondary host was believed to be the only evolutionary way [31–
33,39,40].
Having multiple primary hosts in A. gossypii [22,24] suggests the possibility of host-associ-
ated speciation. Indeed, previous population genetic studies have shown that A. gossypii is a
complex of several genetically distinct biotypes associated with some plant families (e.g.
Cucurbitaceae, Malvaceae, and Solanaceae) [12,41]. However, these studies only targeted
anholocyclic lineages of A. gossypii collected from certain crops, and only a few primary hosts
Fig 1. A hypothetical scenario of the fundatrix specialization. Concept of speciation by loss of primary host from Moran [33].
https://doi.org/10.1371/journal.pone.0245604.g001
PLOS ONE Complex evolution in Aphis gossypii group
PLOS ONE | https://doi.org/10.1371/journal.pone.0245604 February 4, 2021 3 / 28
(e.g. Hibiscus syriacus and Punica granatum) [12,41]. They live on a much broader range of
wild plants, and the primary hosts are also very diverse. Nevertheless, we know surprisingly lit-
tle about the primary host-associated genetic structure in this species. In particular, there is no
study on the genetic structure between primary and secondary HAPs of A. gossypii. Therefore,
to better understand the evolutionary trends in A. gossypii, further genetic analyses encom-
passing wild HAPs are needed.
In addition, confirming the ancestral host plant is crucial to understanding the evolutionary
process of aphids. Among several host plants used as the primary host of A. gossypii, the genus
Rhamnus (incl. Frangula) in Rhamnaceae is the most strongly presumed to be a ancestral host
of the gossypii sensu lato complex group [42,43]. There are several reasons why Rhamnus is
regarded as a ancestral host. The first reason is that most species belonging to the gossypiigroup show congruent use of primary hosts in Rhamnus [44], while the second reason is the
possibility that the gossypii complex group and Rhamnus chronologically co-evolved based on
molecular dating and fossil record [44,45]. Because of this, Rhamnus has been believed to be at
the center of the host-associated evolution in the gossypii complex group. Nevertheless, the
relationships between Rhamnus and other secondary HAPs have not yet been investigated.
This study aims to investigate the evolutionary trends of the two closely-related host-alter-
nating species, A. gossypii and A. rhamnicola, based on population genetic analyses of various
primary and secondary HAPs. Aphis gossypii shows a typical heteroecious holocyclic lifecycle
in Korea, for which various perennials and woody plants are known to be used as primary
hosts [22], even though several anholocyclic isolates have been found in the secondary hosts
[12]. Aphis rhamnicola is a recently described cryptic species of A. gossypii that shares Rham-nus spp. as primary hosts, but has a somewhat different range of secondary hosts [46]. We con-
ducted population genetic analyses of the two species in a comprehensive set of populations
from primary and secondary host plants that were mostly collected from South Korea (except
for one population from the UK). We used two molecular approaches in this study. First,
reconstructing the haplotype network based on COI barcode, we confirmed their speciation
pattern and genetic relationships of the aphid HAPs specialized on various host plants. Second,
using nine microsatellite loci, we analyzed the genetic structure to identify the relationships
between the HAPs of the two species, and to clarify the host shifting or switching process
between the primary and secondary hosts. We also inferred the most likely ancestral host for
the primary HAPs, which could be strongly suggested through the results of this study, by
using approximate Bayesian computation methods.
Materials and methods
Taxon sampling and DNA extraction
As all collections have not been carried out in restricted areas, national parks, etc. where per-
mits are required, it is clearly stated that there is no content regarding collection permits. To
examine the genetic structure, diversity and host-associated evolution between primary and
secondary HAPs, we used 578 individual aphid samples of 36 HAPs, selectively pooled from
116 different collections, within the two species, A. gossypii and A. rhamnicola, which were col-
lected from 36 different host plants—perennial, annual, and biannual; woody and herbaceous
—in 16 plant families (Table 1). For forthcoming analyses, primary hosts and secondary hosts
were defined based on the following criteria: i) The obvious primary hosts are plants that have
collected sexuparae and fundatrix morphs. In addition to the obvious primary host, we also
considered plants meeting the following two conditions as primary hosts. ii) Plants previously
recorded as primary hosts of A. gossypii with reference to Inaizumi [23,25] and Blackman and
Eastop [28] or iii) the case when the collecting time is early spring (April-May) or late autumn
PLOS ONE Complex evolution in Aphis gossypii group
PLOS ONE | https://doi.org/10.1371/journal.pone.0245604 February 4, 2021 4 / 28
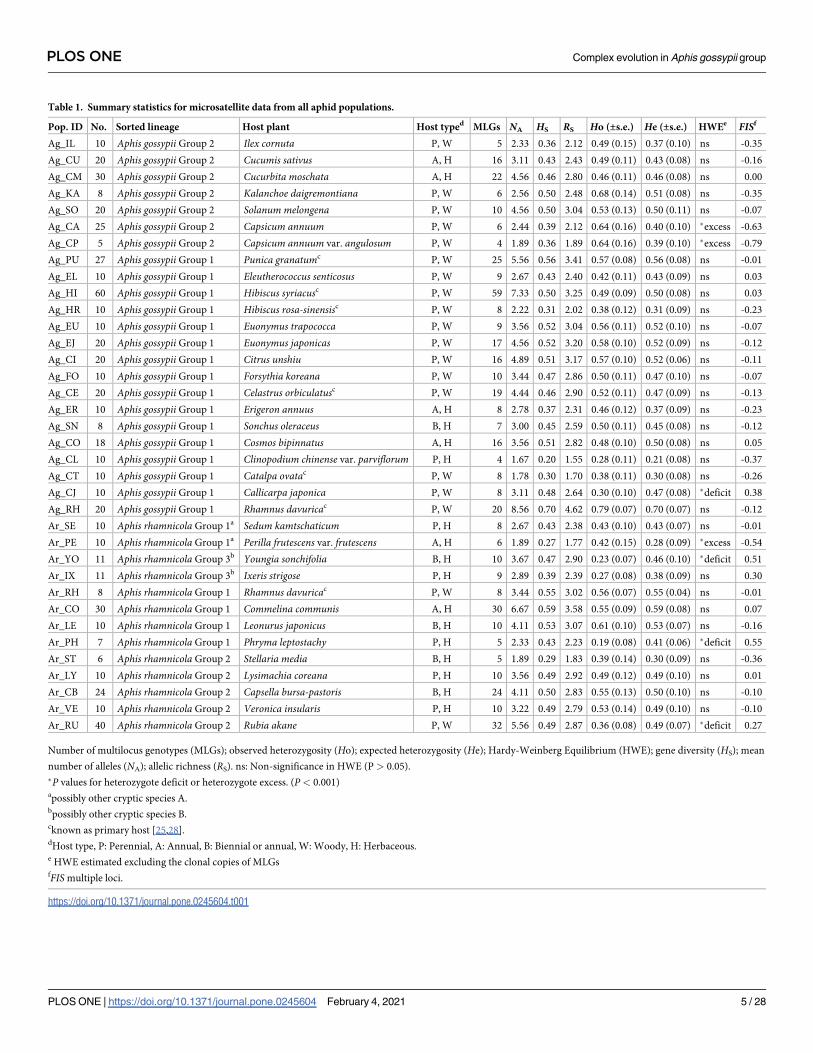
Table 1. Summary statistics for microsatellite data from all aphid populations.
Pop. ID No. Sorted lineage Host plant Host typed MLGs NA HS RS Ho (±s.e.) He (±s.e.) HWEe FISf
Ag_IL 10 Aphis gossypii Group 2 Ilex cornuta P, W 5 2.33 0.36 2.12 0.49 (0.15) 0.37 (0.10) ns -0.35
Ag_CU 20 Aphis gossypii Group 2 Cucumis sativus A, H 16 3.11 0.43 2.43 0.49 (0.11) 0.43 (0.08) ns -0.16
Ag_CM 30 Aphis gossypii Group 2 Cucurbita moschata A, H 22 4.56 0.46 2.80 0.46 (0.11) 0.46 (0.08) ns 0.00
Ag_KA 8 Aphis gossypii Group 2 Kalanchoe daigremontiana P, W 6 2.56 0.50 2.48 0.68 (0.14) 0.51 (0.08) ns -0.35
Ag_SO 20 Aphis gossypii Group 2 Solanum melongena P, W 10 4.56 0.50 3.04 0.53 (0.13) 0.50 (0.11) ns -0.07
Ag_CA 25 Aphis gossypii Group 2 Capsicum annuum P, W 6 2.44 0.39 2.12 0.64 (0.16) 0.40 (0.10) �excess -0.63
Ag_CP 5 Aphis gossypii Group 2 Capsicum annuum var. angulosum P, W 4 1.89 0.36 1.89 0.64 (0.16) 0.39 (0.10) �excess -0.79
Ag_PU 27 Aphis gossypii Group 1 Punica granatumc P, W 25 5.56 0.56 3.41 0.57 (0.08) 0.56 (0.08) ns -0.01
Ag_EL 10 Aphis gossypii Group 1 Eleutherococcus senticosus P, W 9 2.67 0.43 2.40 0.42 (0.11) 0.43 (0.09) ns 0.03
Ag_HI 60 Aphis gossypii Group 1 Hibiscus syriacusc P, W 59 7.33 0.50 3.25 0.49 (0.09) 0.50 (0.08) ns 0.03
Ag_HR 10 Aphis gossypii Group 1 Hibiscus rosa-sinensisc P, W 8 2.22 0.31 2.02 0.38 (0.12) 0.31 (0.09) ns -0.23
Ag_EU 10 Aphis gossypii Group 1 Euonymus trapococca P, W 9 3.56 0.52 3.04 0.56 (0.11) 0.52 (0.10) ns -0.07
Ag_EJ 20 Aphis gossypii Group 1 Euonymus japonicas P, W 17 4.56 0.52 3.20 0.58 (0.10) 0.52 (0.09) ns -0.12
Ag_CI 20 Aphis gossypii Group 1 Citrus unshiu P, W 16 4.89 0.51 3.17 0.57 (0.10) 0.52 (0.06) ns -0.11
Ag_FO 10 Aphis gossypii Group 1 Forsythia koreana P, W 10 3.44 0.47 2.86 0.50 (0.11) 0.47 (0.10) ns -0.07
Ag_CE 20 Aphis gossypii Group 1 Celastrus orbiculatusc P, W 19 4.44 0.46 2.90 0.52 (0.11) 0.47 (0.09) ns -0.13
Ag_ER 10 Aphis gossypii Group 1 Erigeron annuus A, H 8 2.78 0.37 2.31 0.46 (0.12) 0.37 (0.09) ns -0.23
Ag_SN 8 Aphis gossypii Group 1 Sonchus oleraceus B, H 7 3.00 0.45 2.59 0.50 (0.11) 0.45 (0.08) ns -0.12
Ag_CO 18 Aphis gossypii Group 1 Cosmos bipinnatus A, H 16 3.56 0.51 2.82 0.48 (0.10) 0.50 (0.08) ns 0.05
Ag_CL 10 Aphis gossypii Group 1 Clinopodium chinense var. parviflorum P, H 4 1.67 0.20 1.55 0.28 (0.11) 0.21 (0.08) ns -0.37
Ag_CT 10 Aphis gossypii Group 1 Catalpa ovatac P, W 8 1.78 0.30 1.70 0.38 (0.11) 0.30 (0.08) ns -0.26
Ag_CJ 10 Aphis gossypii Group 1 Callicarpa japonica P, W 8 3.11 0.48 2.64 0.30 (0.10) 0.47 (0.08) �deficit 0.38
Ag_RH 20 Aphis gossypii Group 1 Rhamnus davuricac P, W 20 8.56 0.70 4.62 0.79 (0.07) 0.70 (0.07) ns -0.12
Ar_SE 10 Aphis rhamnicola Group 1a Sedum kamtschaticum P, H 8 2.67 0.43 2.38 0.43 (0.10) 0.43 (0.07) ns -0.01
Ar_PE 10 Aphis rhamnicola Group 1a Perilla frutescens var. frutescens A, H 6 1.89 0.27 1.77 0.42 (0.15) 0.28 (0.09) �excess -0.54
Ar_YO 11 Aphis rhamnicola Group 3b Youngia sonchifolia B, H 10 3.67 0.47 2.90 0.23 (0.07) 0.46 (0.10) �deficit 0.51
Ar_IX 11 Aphis rhamnicola Group 3b Ixeris strigose P, H 9 2.89 0.39 2.39 0.27 (0.08) 0.38 (0.09) ns 0.30
Ar_RH 8 Aphis rhamnicola Group 1 Rhamnus davuricac P, W 8 3.44 0.55 3.02 0.56 (0.07) 0.55 (0.04) ns -0.01
Ar_CO 30 Aphis rhamnicola Group 1 Commelina communis A, H 30 6.67 0.59 3.58 0.55 (0.09) 0.59 (0.08) ns 0.07
Ar_LE 10 Aphis rhamnicola Group 1 Leonurus japonicus B, H 10 4.11 0.53 3.07 0.61 (0.10) 0.53 (0.07) ns -0.16
Ar_PH 7 Aphis rhamnicola Group 1 Phryma leptostachy P, H 5 2.33 0.43 2.23 0.19 (0.08) 0.41 (0.06) �deficit 0.55
Ar_ST 6 Aphis rhamnicola Group 2 Stellaria media B, H 5 1.89 0.29 1.83 0.39 (0.14) 0.30 (0.09) ns -0.36
Ar_LY 10 Aphis rhamnicola Group 2 Lysimachia coreana P, H 10 3.56 0.49 2.92 0.49 (0.12) 0.49 (0.10) ns 0.01
Ar_CB 24 Aphis rhamnicola Group 2 Capsella bursa-pastoris B, H 24 4.11 0.50 2.83 0.55 (0.13) 0.50 (0.10) ns -0.10
Ar_VE 10 Aphis rhamnicola Group 2 Veronica insularis P, H 10 3.22 0.49 2.79 0.53 (0.14) 0.49 (0.10) ns -0.10
Ar_RU 40 Aphis rhamnicola Group 2 Rubia akane P, W 32 5.56 0.49 2.87 0.36 (0.08) 0.49 (0.07) �deficit 0.27
Number of multilocus genotypes (MLGs); observed heterozygosity (Ho); expected heterozygosity (He); Hardy-Weinberg Equilibrium (HWE); gene diversity (HS); mean
number of alleles (NA); allelic richness (RS). ns: Non-significance in HWE (P > 0.05).
�P values for heterozygote deficit or heterozygote excess. (P< 0.001)apossibly other cryptic species A.bpossibly other cryptic species B.cknown as primary host [25,28].dHost type, P: Perennial, A: Annual, B: Biennial or annual, W: Woody, H: Herbaceous.e HWE estimated excluding the clonal copies of MLGsfFIS multiple loci.
https://doi.org/10.1371/journal.pone.0245604.t001
PLOS ONE Complex evolution in Aphis gossypii group
PLOS ONE | https://doi.org/10.1371/journal.pone.0245604 February 4, 2021 5 / 28

(October-November) based on the lifecycle of A. gossypii on the Korean Peninsula; However,
even if these two conditions were met, annual or biennial plants were excluded from the pri-
mary host. It was also not considered as the primary host if aphid collected in a greenhouse. As
a consequence, all remaining plants not falling under the above conditions were considered as
the secondary hosts. In our study, the host-associated population (HAP) means a collective
population pooled from several temporally and/or geographically different collections in the
same plant species (S1 Table). In A. gossypii with a large spectrum of host utilization, 25 HAPs
were collected from its various primary and secondary hosts (S1 Table). As A. rhamnicola was
recently recorded found in Rhamnus spp., sharing and co-existing with A. gossypii in Rhanm-nus as a primary host [46], nine HAPs of A. rhamnicola were also collected from its various
primary and secondary hosts (S1 Table).
These collections were acquired from South Korea, except for those of A. gossypii from
Catalpa ovata in the UK (S1 Table). To avoid the chance of sampling individuals from the
same parthenogenetic colony, each aphid was collected from a different host plant, or a differ-
ent isolated colony. All of the fresh aphid specimens used for molecular analyses were collected
and preserved in (95 or 99) % ethanol, and stored at -70˚C. Total genomic DNA was extracted
from single individuals using a DNeasy1 Blood & Tissue Kit (QIAGEN, Inc., Dusseldorf). To
preserve voucher specimens from the DNA extracted samples, we used a non-destructive
DNA extraction protocol [43]. The entire body of the aphid was left in the lysis buffer with
protease K solution at 55˚C for 24 h, and the cleared cuticle dehydrated.
Species lineage sorting
In some aphid groups, morphological identification can be ambiguous, due to the lack of con-
clusive morphological evidence. The Aphis group is one of the most typical groups with the
above problem. As a complementary way to avoid misidentification, host plant relationships,
morphologies, and molecular tools are widely used to identify aphids [43,46–48]. Because our
study aims to demonstrate intra-specific genetic relationships based on host plant associations,
species lineage sorting is significant to prevent biases of the results. The two Aphis species, A.
gossypii and A. rhamnicola, we study here are not only very similar in morphology, but also
share several host plants due to the polyphagy. Although we performed species identification
through morphology and host plant relationships as a first step and also tested DNA barcoding
for all individuals collected on their shared host plants (e.g. Capsella, Rhamnus, and Rubia), we
found that there were a lot of the haplotypes cross-shared between A. gossypii and A. rhamni-cola (see Results). Therefore, instead of identifying the species with 36 HAPs, we applied the
dominant assignment (white, green, blue, red, dark blue) of the genetic structure (K = 3, 4, 5)
by STRUCTURE as well as the PCoA results (see Results) to sort their lineags into five groups
as Aphis gossypii Group 1, A. g. Group 2, A. rhmanicola Group 1, A. r. Group 2 and A. r.Group 3 (Table 1). Accordingly, ‘Aphis gossypii’ and ‘A. rhamincola’, which are mentioned
later, are meant to include all group lineages containing the HAPs assigned by the results. S1
Table shows detailed information for lineage sorted samples used in DNA analyses.
Haplotype analysis
A 658 bp of the partial 5’ region of the cytochrome c oxidase subunit I gene (COI), namely COIDNA barcode [49], was amplified using the universal primer sets: LEP-F1 5’-ATTCAACCAATCATAAAGATAT-3’ and LEP-R1, 5’-TAAACTTCTGGATGTCCAAAAA-3’. A polymerase chain
reaction (PCR) was performed with AccuPower1 PCR Premix (Bioneer, Daejeon, Rep. of
Korea) in 20 mL reaction mixtures under the following conditions: initial denaturation at
95˚C for 5 min; followed by 35 cycles at 94˚C for 30 s, an annealing temperature of 45.2˚C for
PLOS ONE Complex evolution in Aphis gossypii group
PLOS ONE | https://doi.org/10.1371/journal.pone.0245604 February 4, 2021 6 / 28

40 s, an extension at 72˚C for 45 s, and the final extension at 72˚C for 5 min. All PCR products
were assessed using a 1.5% agarose gel electrophoresis. Successfully amplified samples were
purified using a QIAquick PCR purification kit (Qiagen, Inc.), and then immediately
sequenced using an automated sequencer (ABI Prism 3730XL DNA Analyzer) at Bionics Inc.
(Seoul, Korea). Both morphological identification, based on voucher specimens in the insect
museum in Kunsan National University with descriptions of Blackman and Eastop [22], Lee
and Kim [24], Heie [26], and molecular identification method using the COI DNA barcode
region for comparison with the previous COI DNA barcode database, were used [43,46,50].
All sequences that were obtained for DNA barcoding were initially examined and assem-
bled using CHROMAS 2.4.4 (Technelysium Pty Ltd., Tewantin, Qld, AU) and SEQMAN PRO
ver. 7.1.0 (DNA Star, Inc., Madison, Wisconsin, USA). In this step, poor-quality sequences
were discarded to avoid biases. The final dataset containing 187 sequences was aligned using
MAFFT ver. 7 [51], an online utility. Some ambiguous front and back sequences were removed
at this stage, resulting in sequences of 583 bp that were finally used for haplotype analysis. All
sequences were deposited in GenBank (accession no. MT461429-MT461602). The COI haplo-
types of A. gossypii complex were analyzed using DNASP ver. 6.12.03 [52]. A median-joining
network (MJ) was built using NETWORK ver. 5.0.1.1 [53]. The MJ result was annotated with
host plants or species, and then visually summarized in Fig 2.
Microsatellite genotyping
In this study, all 578 individuals of four species were successfully genotyped using nine micro-
satellite loci (AGL1-2, AGL1-10, AGL1-11, AGL1-15, AGL1-16, AGL1-20, AGL1-21, AGL1-
22, and AGL2-3b) previously isolated from the soybean aphid [55]. In the preliminary study,
we had already checked the cross-species amplification test of these loci on A. fabae, Hyalop-terus pruni, Rhopalosiphum padi, and Schizaphis graminum, as well as A. gossypii in the tribe
Aphidini. There were the previously developed loci from A. gossypii [56], but we used the nine
loci developed from A. glycines [55], because we noticed that the polymorphism of the latter
was higher than that of the former, which was advantageous to amplify the loci between differ-
ent species. In the aphid group, several studies showed that microsatellite loci were available
between related species within the aphid family as a utility of cross-species amplification
[57,58].
Microsatellite amplifications were performed using GeneAll1 Taq DNA Polymerase Pre-
mix (GeneAll, Seoul, Korea) in 20 μL reaction mixtures containing 0.5 μM forward labeled
with a fluorescent dye (6-FAM, HEX, or NED) & reverse primers, and 0.05 μg of DNA tem-
plate. PCR was performed using a GS482 thermo-cycler (Gene Technologies, Essex), according
to the following procedure: initial denaturation at 95˚C for 5 min, followed by 34 cycles of
95˚C for 30 s; annealing at 56˚C for 40 s; extension at 72˚C for 45 s, and a final extension at
72˚C for 5 min. PCR products were visualized by electrophoresis on a 1.5% agarose gel with a
low-range DNA ladder to check for positive amplifications. Automated fluorescent fragment
analyses were performed on the ABI PRISM 377 Genetic Analyzer (Applied Biosystems), and
allele sizes of PCR products were calibrated using the molecular size marker, ROX labeled-size
standard (GenScan™ ROX 500, Applied Biosystems). Raw data on each fluorescent DNA prod-
uct was analyzed using GeneMapper1 version 4.0 (Applied Biosystems).
Microsatellite data analysis
We used GENALEX 6.503 [59] to identify multilocus genotypes (MLGs) among populations.
The program FSTAT 2.9.3.2 [60] was used to estimate the mean number of alleles (NA), gene
diversity (HS), and allelic richness (RS). Observed (HO) and expected heterozygosity (HE)
PLOS ONE Complex evolution in Aphis gossypii group
PLOS ONE | https://doi.org/10.1371/journal.pone.0245604 February 4, 2021 7 / 28

Fig 2. (A) Haplotype network for COI DNA barcode dataset (583 bp) using NETWORK ver. 5.0.1.1 [54]. Pie chart distribution based on each HAP; (B)
Haplotype network for COI DNA barcode dataset (583 bp) using NETWORK. Pie chart distribution based on each group of five lineages in the two species.
https://doi.org/10.1371/journal.pone.0245604.g002
PLOS ONE Complex evolution in Aphis gossypii group
PLOS ONE | https://doi.org/10.1371/journal.pone.0245604 February 4, 2021 8 / 28

values among loci were estimated using GENEPOP 4.0.7 [61] among the population data
(HAPs) sets. Levels of significance for Hardy–Weinberg equilibrium (HWE) and linkage dis-
equilibrium tests were adjusted using the sequential Bonferroni correction for all tests involv-
ing multiple comparisons [62]. Deviations from HWE were tested for heterozygote deficiency
or excess. Because the clonal copies of MLGs due to the parthenogenetic life cycle of aphids
could affect and distort the estimation of HWE [63], we used a reduced data set containing
only one copy of each MLG when estimating HWE. Several assumptions of HWE still can be
violated, thereby these estimates are used only for descriptive purposes even although the
clonal MLG copies were removed from data analysis [63]. MICRO-CHECKER [64] was used
to test for null alleles [65] and identify possible scoring errors, because of the large-allele drop-
out and stuttering.
We used ARLEQUIN 3.5.1.2 [66] for calculations of pairwise genetic differentiation (FST)
values [67], in which populations were assigned by 36 HAPs of the two species. The statistical
significance of each value was assessed by computing the pairwise comparison of the observed
value in 100,000 permutations. Groupings based on three different cases, (1) gossypii vs rham-nicola, (2) perennial vs non-perennial host groups in A. gossypii, (3) perennial vs non-peren-
nial host groups in A. rhamnicola, were tested independently with analysis of molecular
variance [AMOVA; 68] in ARLEQUIN, with significance determined using the nonparametric
permutation approach described by Excoffier et al. [69].
To examine the genetic relationships between 578 individual samples of four species, prin-
cipal coordinate analysis (PCoA), also in GENALEX [59], further explored population rela-
tionships using the microsatellite loci, making no a priori assumptions about population
groupings. Codominant genotypic genetic distance was calculated to make tri-matrix of pair-
wise populations, and then each population plot was created with coordinates based on the
first two axes.
The program STRUCTURE 2.3.3 [70] was used to test for the existence of population struc-
turing among all samples, by estimating the number of distinct populations (K) present in the
set of samples, using a Bayesian clustering approach. We assessed likelihoods for models with
the number of clusters ranging K = (1 to 15). The length of the initial burn-in period was set to
100,000 iterations, followed by a run of 1,000,000 Markov chain Monte Carlo (MCMC) repeti-
tions, of which the analysis was replicated 10 times, to ensure convergence on parameters and
likelihood values. Parameter sets of ancestry, allele frequency, and advanced models remained
as defaults. Following the method of Evanno et al. [71], we calculated ΔK based on the second-
order rate of change in the log probability of data with respect to the number of population
clusters from the STRUCTURE analysis. To determine the correct value of K, both the likeli-
hood distribution being to plateau or decrease [70] and the peak value of the ΔK statistic of
Evanno et al. [71] was estimated. The single run at each K yielding the highest likelihood of the
data given the parameter values was used for plotting the distributions of individual member-
ship coefficients (Q) with the program DISTRUCT [72].
We performed assignment tests using GENECLASS 2 [73], in which populations were
assigned to 36 HAPs of the two species. For each individual of a population, the program cal-
culates the probability of belonging to any other reference population, or of being a resident of
the population where it was sampled. The sample with the highest probability of assignment
was considered the most likely source for the assigned genotype. In this study, we checked the
mean assignment rate from 391 A. gossypii or 187 A. rhamnicola individuals into each popula-
tion (source), to confirm the possible origin of each HAP. We used a Bayesian method of esti-
mating population allele frequencies [74]. Monte Carlo re-sampling computation (100,000
simulated individuals) was used to infer the significance of assignments (alpha = 0.01).
PLOS ONE Complex evolution in Aphis gossypii group
PLOS ONE | https://doi.org/10.1371/journal.pone.0245604 February 4, 2021 9 / 28
Approximate Bayesian computation analysis
To estimate the relative likelihood of the most likely ancestral HAP of A. gossypii, an approxi-
mate Bayesian computation (ABC) was performed for the microsatellite dataset as imple-
mented in DIYABC version 1.0.4 [75]. DIYABC allows the comparison of complex scenarios
involving bottlenecks, serial or independent introductions, and genetic admixture events in
introduced populations [76]. The parameters for modeling scenarios are the times of split or
admixture events, the stable effective population size, the effective number of founders in
introduced populations, the duration of the bottleneck during colonization, and the rate of
admixture [77]. The software generates a simulated data set used to estimate the posterior dis-
tribution of parameters, in order to select the most likelihood scenario [77]. DIYABC gener-
ates a simulated data set that is then used to select those most similar to the observed data set,
and the so-called selected data set (nδ), which are finally used to estimate the posterior distribu-
tion of parameters [75]. Recently, this ABC software package has been widely used, such as for
inferring the demographic history of populations and species [78,79], and testing potential
bottleneck events [80].
To infer the most likely ancestral primary host of A. gossypii, among the whole microsatel-
lite dataset, we tested three different ABC analyses using the original or partial dataset. We
hypothesized the evolutionary scenarios following our results obtained from the COI haplo-
type network and two Bayesian analyses, STRUCTURE and GENECLASS2 (see “Results”).
The previous studies have already revealed that A. rhamnicola was located in the more ances-
tral position within the phylogeny of the A. gossypii group [43,44], which population was there-
fore set to the most ancestral position on the genealogy of the two ABC tests.
In the first analysis, based on the result of STRUCTURE (K = 3), we compared eight evolu-
tionary scenarios (A1–A8) using a dataset that included 578 individuals from four population
groups, which consisted of 75 individuals from the ‘BLUE’ group (Ar_SE, Ar_PE, Ar_IX,
Ar_YO, Ar_CO, Ar_PH, Ar_RH, Ar_LE), 90 from the ‘GREEN’ group (Ar_ST, Ar_VE,
Ar_LY, Ar_CB, Ar_RU), 30 from the ‘MIXBW (BLUE+WHITE)’ group (Ag_RH, Ag_CJ), and
361 from the ‘WHITE’ group (Ag-IL, Ag_CE, Ag_EU, Ag_EJ, Ag_PU, Ag_CU, Ag_CM,
Ag_KA, Ag_EL, Ag_HI, Ag_HR, Ag_FO, Ag_CI, Ag_ER, Ag_SN, Ag_CO, Ag_SO, Ag_CA,
Ag_CP, Ag_CL, Ag_CT) (S1 Fig). Scenario A1 considered (1) GREEN originated from BLUE,
(2) MIXBW subsequently originated from GREEN, and then (3) WHITE originated from
MIXBW. Scenario A2 considered (1) WHITE originated from BLUE, (2) MIXBW subse-
quently originated from WHITE, and then (3) GREEN originated from MIXBW. Scenario A3
considered (1) BLUE originated from GREEN, (2) MIXBW subsequently originated from
BLUE, and then (3) WHITE originated from MIXBW. Scenario A4 considered (1) WHITE
originated from MIXBW, (2) BLUE subsequently originated from WHITE, and then (3)
GREEN originated from BLUE. Scenario A5 considered (1) GREEN originated from MIXBW,
(2) BLUE subsequently originated from GREEN, and then (3) WHITE originated from BLUE.
Scenario A6 considered (1) GREEN originated from WHITE, (2) MIXBW subsequently origi-
nated from GREEN, and then (3) BLUE originated from MIXBW. Scenario A7 considered (1)
BLUE originated from MIXBW, (2) GREEN subsequently originated from BLUE, and then (3)
WHITE originated from GREEN. Scenario A8 considered (1) BLUE originated from WHITE,
(2) MIXBW subsequently originated from BLUE, and then (3) GREEN originated from
MIXBW.
In the second analysis, based on the result of STRUCTURE (K = 4), we compared six evolu-
tionary scenarios (B1–B6) using a dataset that included 311 individuals from four population
groups, which consisted of 75 individuals from the ‘BLUE’ group (Ar_CO, Ar_PH, Ar_RH,
Ar_SE, Ar_PE, Ar_LE), 90 from the ‘GREEN’ group (Ar_ST, Ar_VE, Ar_LY, Ar_CB, Ar_RU),
PLOS ONE Complex evolution in Aphis gossypii group
PLOS ONE | https://doi.org/10.1371/journal.pone.0245604 February 4, 2021 10 / 28

60 from the ‘RED’ group (Ag_IL, Ag_CU, Ag_CA, Ag_CP), and 86 from the ‘WHITE’ group
(Ag_CE, Ag_FO, Ag_ER, Ag_SN, Ag_CO, Ag_CL, Ag_CT) (S2 Fig). Scenario B1 considered
(1) GREEN originated from BLUE, (2) WHITE subsequently originated from GREEN, and
then (3) RED originated from WHITE. Scenario B2 was basically similar to scenario B1, except
for (1) WHITE originated from RED. Scenario B3 considered (1) WHITE originated from
RED, (2) GREEN subsequently originated from WHITE, and then (3) BLUE originated from
GREEN. Scenario B4 considered (1) GREEN originated from BLUE, (2) WHITE formerly
originated from GREEN, and then (3) RED later originated from GREEN. Scenario B5 consid-
ered (1) GREEN originated from BLUE, (2) RED formerly originated from GREEN, and then
(3) WHITE later originated from GREEN. Scenario B6 considered (1) WHITE originated
from RED, (2) GREEN formerly originated from WHITE, and then (3) BLUE later originated
from GREEN.
In the third analysis, based on the result of STRUCTURE (K = 4), we compared six evolu-
tionary scenarios (C1–C6) using a dataset including 391 individuals from four population
groups, except for BLUE and GREEN groups in the first and second analysis, which consisted
of 30 individuals from the ‘MBW (BLUE+WHITE)’ group (Ag_RH, Ag_CJ), 207 from the
‘MRW (RED+WHITE)’ group (Ag_EU, Ag_EJ, Ag_PU, Ag_SO, Ag_CM, Ag_EL, Ag_HI,
Ag_HR, Ag_CI), 68 from the ‘RED’ group (Ag_IL, Ag_CU, Ag_KA, Ag_CA, Ag_CP), and 86
from the ‘WHITE’ group (Ag_CE, Ag_FO, Ag_ER, Ag_SN, Ag_CO, Ag_CL, Ag_CT) (S3 Fig).
Scenario C1 considered (1) MRW originated from MBW, (2) WHITE subsequently originated
from MRW, and then (3) RED originated from WHITE. Scenario C2 was basically similar to
scenario C1, except for (3) WHITE originated from RED. Scenario C3 considered (1) WHITE
originated from MBW, (2) RED subsequently originated from WHITE, and then (3) MRW
originated from RED. Scenario C4 was basically similar to scenario C3, except for (2) MRW
subsequently originated from WHITE, and then (3) RED originated from MRW. Scenario C5
considered (1) RED originated from MBW, (2) WHITE subsequently originated from RED,
and then (3) MRW originated from WHITE. Scenario C6 was basically similar to scenario C5,
except for (3) WHITE originated from MRW.
We produced 1 000 000 simulated data sets for each scenario. We used a generalized step-
wise model (GSM) as the mutational model for microsatellites, which assumes increases or
reductions by single repeat units [75]. To identify the posterior probability (PP) of these three
scenarios, the nδ = 30 000 (1%) simulated datasets closest to the pseudo-observed dataset were
selected for the logistic regression, which is similar to the nδ = 300 (0.01%) ones for the direct
approach [77]. The summary of statistics was calculated from the simulated and observed data
for each of the tested scenarios, such as the mean number of alleles per locus (A), mean genetic
diversity for each group and between group, genetic differentiation between pairwise groups
(FST), classification index, shared alleles distance (DAS), and Goldstein distance.
Results
Haplotype analysis
A total of 18 haplotypes were recognized from the 187 COI sequences of 36 host-associated
populations of the two Aphis species (Fig 2). The most common haplotype was H9, followed
by H2. Aphid samples from the three primary hosts: Hibiscus, Rhamnus, and Rubia were
spread across these two major haplotypes (Fig 2A). All the samples from the remaining pri-
mary hosts (i.e. Catalpa, Celastrua, Citrus, Euonymus, and Punica) had H9 haplotype (Fig 2A).
Unique haplotypes were mostly observed among the Rubia population (Fig 2A). Cucurbita,
Hibiscus, Punica, Rhamnus, Sedum, and Youngia associated populations also had unique hap-
lotypes. Among the secondary HAPs, samples from the Capsella were found in both H2 and
PLOS ONE Complex evolution in Aphis gossypii group
PLOS ONE | https://doi.org/10.1371/journal.pone.0245604 February 4, 2021 11 / 28

H9 haplotypes (Fig 2A). Samples from the Youngia was also observed in H1, H2, and H3 hap-
lotypes (Fig 2A). However, the populations associated with the majority of secondary hosts
only had one haplotype. H1 consisted of samples from secondary hosts, such as Ixeris, Leo-nurus, Perilla, Phryma, and Youngia. To compare COI haplotype and microsatellite genotype
results, we overlaid the five biotypes that were identified from STRUCTURE (K = 5) on the
haplotype network (Fig 2B). The result of haplotype analysis was highly discordant with the
STRUCTURE results (see below). Among the five biotypes, red, blue, and green types were
observed in both H2 and H9 haplotypes (Fig 2B). The majority of white type aphids belonged
to H9, while blue and green types were mostly found in H2 (Fig 2B). Aphids with green type
showed the most diverse haplotype diversity (Fig 2B). The haplotype H1 contained blue and
dark blue types.
Microsatellite data analysis
We successfully genotyped 578 aphid individuals of 36 HAPs of the two species using 9 micro-
satellite loci, and then found 463 non-clonal MLGs from all samples (Table 1). Generally,
genetic diversity was high throughout the HAPs collected from woody perennials, which
seemed to be regarded as the primary (overwintering) hosts. The mean number of alleles (NA)
and gene diversity (HS) in A. gossypii host populations averaged (4.17 and 0.45), respectively,
whereas A. rhamnicola populations averaged (4.98 and 0.48), respectively. Similarly, allelic
richness (RS) (RS, mean ± s.d., 2.67 ± 0.67) in the A. gossypii populations was slightly lower
than RS (2.79 ± 0.50) in those of A. rhamnicola. Surprisingly, among all HAPs, Ag_RH,
Ag_HI, and Ar_CO had relatively very high NA at (8.56, 7.33, and 6.67), respectively, of which
the RS values were also high at (4.62, 3.25, and 3.58), respectively. The expected heterozygosity
(HE) values in the A. gossypii populations ranged (0.21 to 0.70), whereas HE values in the A.
rhamnicola populations ranged (0.30 to 0.59). In HWE, there were significant deviations in
Ag_CA, Ag_CP, and Ar_PE by heterozygote excess, and in Ag_CJ, Ar_YO, Ar_PH, and
Ar_RU by heterozygote deficit. Heterozygote excess in Ag_CA, Ag_CP, and Ar_PE were likely
the result of heterosis or over-dominance related to selection preference toward heterozygous
combination or fixation of heterozygous genotypes due to parthenogenesis of aphids in sec-
ondary host, especially under anholocyclic (permanently asexual) life [81]. Similar to our
results, this phenomenon was already reported from several aphid species such as Sitobion ave-nae, Myzus persicae and Rhopalosiphum padi having permanently or temporary asexual life,
which showed the significant heterozygote excess [82–84]. Negative FIS values also showed an
increase in heterozygosity that was generally due to random mating or outbreeding, whereas
positive FIS values explained that the amount of heterozygous offspring in the population
decreased, usually due to inbreeding [85]. There was no evidence of significant linkage dis-
equilibrium or frequency of null alleles.
Genetic differentiation between host-associated populations and AMOVA. We esti-
mated pairwise genetic differentiation (FST) between 36 different HAPs of the two species
(Table 2). The averaging pairwise FST values among the HAPs of all, only A. gossypii (Ar_SE,
Ar_PE, Ar_YO, and Ar_IX) and only A. rhamnicola were 0.329, 0.209 and 0.392, respectively.
In A. gossypii, it appeared that the averaging pairwise FST values among the different HAPs
obtained from host plants within the same plant genus or family were relatively low, such as
Cucurbitaceae (Ag_CU, Ag_CM; averaging pairwise FST = 0.040), Solanaceae (Ag_SO,
Ag_CA, Ag_CP; 0.029), Euonymus (Ag_EU, Ag_EJ; 0.016), and Asteraceae (Ag_ER, Ag_SN,
Ag_CO; 0.025). Remarkably, Ag_PU (0.130), Ag_HI (0.152), Ag_FO (0.159), and Ag_RH
(0.134), considered to be the primary host, showed relatively low average FST values toward the
other A. gossypii populations. In A. rhamnicola, Ar_LY, Ar_CB, and Ar_VE were genetically
PLOS ONE Complex evolution in Aphis gossypii group
PLOS ONE | https://doi.org/10.1371/journal.pone.0245604 February 4, 2021 12 / 28

Table 2. Pairwise FST divergence between 36 HAPs of the two species, A. gossypii groups (Ag) and A. rhamnicola groups (Ar).
Ag_IL Ag_CU Ag_CM Ag_KA Ag_SO Ag_CA Ag_CP Ag_PU Ag_EL Ag_HI Ag_HR Ag_EU Ag_EJ Ag_CI Ag_FO Ag_CE Ag_ER Ag_SN Ag_CO
Ag_CU 0.230
Ag_CM 0.183 0.040
Ag_KA 0.202 0.145 0.092
Ag_SO 0.217 0.147 0.101 0.106
Ag_CA 0.339 0.223 0.206 0.199 0.066
Ag_CP 0.352 0.209 0.187 0.163 0.049 -0.030
Ag_PU 0.194 0.196 0.140 0.128 0.117 0.234 0.219
Ag_EL 0.387 0.267 0.203 0.140 0.224 0.337 0.311 0.216
Ag_HI 0.169 0.137 0.060 0.090 0.121 0.244 0.216 0.111 0.196
Ag_HR 0.350 0.293 0.255 0.291 0.329 0.453 0.486 0.202 0.384 0.223
Ag_EU 0.227 0.206 0.096 0.128 0.120 0.252 0.227 0.060 0.165 0.061 0.305
Ag_EJ 0.173 0.178 0.090 0.141 0.094 0.231 0.211 0.046 0.216 0.048 0.258 0.016
Ag_CI 0.254 0.240 0.160 0.132 0.116 0.219 0.204 0.061 0.206 0.144 0.327 0.067 0.093
Ag_FO 0.234 0.260 0.159 0.184 0.149 0.300 0.295 0.017 0.266 0.106 0.235 0.064 0.040 0.087
Ag_CE 0.299 0.295 0.194 0.169 0.215 0.332 0.312 0.134 0.114 0.152 0.283 0.090 0.124 0.119 0.137
Ag_ER 0.329 0.327 0.225 0.269 0.178 0.339 0.351 0.066 0.369 0.151 0.389 0.093 0.065 0.121 0.084 0.240
Ag_SN 0.214 0.246 0.158 0.202 0.160 0.300 0.289 0.036 0.294 0.106 0.307 0.045 0.027 0.094 0.039 0.169 0.028
Ag_CO 0.204 0.240 0.161 0.179 0.146 0.287 0.274 0.015 0.279 0.100 0.237 0.057 0.033 0.086 -0.008 0.162 0.040 0.008
Ag_CL 0.563 0.499 0.404 0.391 0.422 0.516 0.584 0.331 0.193 0.362 0.577 0.310 0.361 0.290 0.408 0.147 0.531 0.457 0.398
Ag_CT 0.432 0.353 0.279 0.311 0.271 0.346 0.386 0.191 0.371 0.257 0.435 0.214 0.209 0.176 0.254 0.241 0.297 0.232 0.232
Ag_CJ 0.234 0.255 0.205 0.225 0.201 0.308 0.301 0.119 0.342 0.170 0.312 0.176 0.127 0.213 0.136 0.264 0.213 0.126 0.115
Ag_RH 0.209 0.200 0.144 0.120 0.111 0.215 0.185 0.037 0.181 0.121 0.188 0.063 0.072 0.085 0.045 0.128 0.107 0.085 0.058
Ar_SE 0.473 0.439 0.400 0.351 0.344 0.417 0.403 0.304 0.411 0.361 0.515 0.359 0.335 0.356 0.367 0.379 0.435 0.392 0.365
Ar_PE 0.626 0.572 0.546 0.549 0.524 0.591 0.625 0.478 0.587 0.492 0.659 0.533 0.507 0.522 0.572 0.547 0.623 0.587 0.530
Ar_YO 0.469 0.411 0.411 0.397 0.421 0.479 0.468 0.374 0.466 0.387 0.496 0.412 0.395 0.428 0.448 0.457 0.491 0.435 0.415
Ar_IX 0.502 0.436 0.424 0.429 0.446 0.509 0.516 0.400 0.507 0.397 0.534 0.437 0.415 0.458 0.486 0.484 0.526 0.473 0.444
Ar_RH 0.463 0.428 0.383 0.338 0.348 0.437 0.393 0.347 0.396 0.330 0.490 0.337 0.352 0.382 0.387 0.390 0.449 0.403 0.383
Ar_CO 0.444 0.410 0.387 0.357 0.355 0.419 0.389 0.362 0.388 0.370 0.452 0.353 0.368 0.382 0.389 0.394 0.429 0.397 0.388
Ar_LE 0.474 0.437 0.413 0.368 0.411 0.491 0.443 0.376 0.398 0.348 0.509 0.363 0.369 0.410 0.430 0.394 0.481 0.427 0.410
Ar_PH 0.487 0.443 0.416 0.394 0.389 0.484 0.475 0.358 0.462 0.339 0.545 0.382 0.362 0.411 0.431 0.414 0.491 0.428 0.389
Ar_ST 0.356 0.301 0.191 0.239 0.313 0.444 0.458 0.263 0.367 0.095 0.440 0.216 0.208 0.295 0.294 0.274 0.387 0.304 0.270
Ar_LY 0.451 0.392 0.347 0.311 0.365 0.437 0.407 0.351 0.397 0.265 0.483 0.328 0.320 0.384 0.397 0.382 0.450 0.405 0.382
Ar_CB 0.406 0.361 0.321 0.282 0.355 0.425 0.395 0.344 0.366 0.239 0.436 0.318 0.315 0.363 0.377 0.355 0.432 0.389 0.367
Ar_VE 0.442 0.375 0.335 0.295 0.360 0.448 0.414 0.341 0.379 0.252 0.469 0.328 0.312 0.378 0.386 0.371 0.436 0.389 0.372
Ar_RU 0.451 0.417 0.383 0.381 0.389 0.463 0.442 0.352 0.421 0.333 0.456 0.343 0.336 0.381 0.380 0.376 0.417 0.388 0.362
Ag_CL Ag_CT Ag_CJ Ag_RH Ar_SE Ar_PE Ar_YO Ar_IX Ar_RH Ar_CO Ar_LE Ar_PH Ar_ST Ar_LY Ar_CB Ar_VE
Ag_CT 0.502
Ag_CJ 0.520 0.340
Ag_RH 0.291 0.182 0.130
Ar_SE 0.563 0.508 0.413 0.248
Ar_PE 0.720 0.667 0.561 0.399 0.549
Ar_YO 0.617 0.521 0.407 0.307 0.494 0.570
Ar_IX 0.657 0.559 0.449 0.338 0.529 0.617 0.187
Ar_RH 0.562 0.508 0.377 0.200 0.387 0.532 0.438 0.480
Ar_CO 0.492 0.456 0.381 0.209 0.383 0.440 0.418 0.447 0.089
Ar_LE 0.560 0.531 0.407 0.294 0.410 0.428 0.454 0.470 0.292 0.317
Ar_PH 0.628 0.575 0.339 0.291 0.462 0.521 0.484 0.532 0.320 0.331 0.340
Ar_ST 0.596 0.507 0.321 0.233 0.501 0.662 0.500 0.520 0.400 0.413 0.377 0.422
Ar_LY 0.573 0.495 0.403 0.267 0.418 0.570 0.455 0.463 0.295 0.327 0.253 0.384 0.245
Ar_CB 0.509 0.467 0.391 0.280 0.423 0.535 0.446 0.441 0.314 0.347 0.253 0.360 0.178 0.000
Ar_VE 0.569 0.504 0.388 0.269 0.412 0.570 0.450 0.460 0.299 0.342 0.243 0.370 0.206 0.023 0.027
Ar_RU 0.503 0.484 0.380 0.303 0.453 0.528 0.452 0.479 0.383 0.407 0.363 0.358 0.323 0.343 0.329 0.308
Values are significantly different from zero at P< 0.05 unless indicated as bold and italic.
https://doi.org/10.1371/journal.pone.0245604.t002
PLOS ONE Complex evolution in Aphis gossypii group
PLOS ONE | https://doi.org/10.1371/journal.pone.0245604 February 4, 2021 13 / 28

close (0.050) to each other, despite belonging to the same host family/genus or being locally
similar. In addition, Ar_RH was close to Ar_CO (0.089). Between A. gossypii and A. rhamni-cola populations, Ar_ST and Ag_HI showed the lowest FST value (0.095).
Two cases to confirm the genetic variance between the preordained groups were analyzed
using AMOVA implemented in ARLEQUIN [68]. In the case of the analysis grouped by case
1, percentages of the genetic variance (PV) ‘among groups’ and ‘among populations within
groups’ were 14.59% and 22.60%, respectively, which shows that there is some grouping effect
by host plants, even though the majority of genetic variation was found ‘among individuals
within populations’ as approximately 63% (Table 3). However, the genetic variance of about -1
~ 0% ‘among groups’ in the both analyses grouped by cases 2 and 3 suggests that there are no
grouped structures according to their lives in the perennial or non-perennial hosts on both A.
gossypii and A. rhamnicola (Table 3). Interestingly, PV of ‘among populations within groups’
in A. rhamnicola was about 20% higher than that in A. gossypii, which means that the HAPs of
A. rhamnicola is genetically differentiated further than those of A. gossypii (Table 3).
Genetic similarity, structure, and assignment. A plot of PCoA between 36 HAPs based
on codominant genotypic genetic distances showed that the two species, A. gossypii and A.
rhamnicola, were completely separated in each of the left, upper–right, and lower–right sides
on the plot (Fig 3). Plots of A. gossypii populations being closely aggregated along the line of
factor 1 means that they are genetically close to each other, whereas the plots of A. rhamnicolabeing relatively largely scattered show genetic isolations between them. Among all A. gossypiipopulations, Ag_HI and Ag_RH were relatively located near to the HAPs of A. rhamnicola,
Ar_ST and Ar_SE, respectively. Plots of Ar_YO and Ar_IX, which had been taxonomically
considered to A. gossypii, were closely located to each other, but distant from the majority
group of A. gossypii.The genetic structure of 36 HAPs of the two species (A. gossypii and A. rhamnicola) for 578
individuals was analyzed by STRUCTURE 2.3.3 [70]. In all STRUCTURE analyses from K = (1
to 15), the most likely number of clusters was K = 4, using the ΔK calculation according to the
method of Evanno et al. [71]. Here, we show the structure results from K = (2 to 5), in order to
observe the change of genetic structure and assignment pattern according to the K value (Fig
4). When K = 2, the (first) white cluster dominantly appeared to A. gossypii populations, except
for Ag_RH with a large green assignment, while the (second) green cluster was largely distrib-
uted among populations of A. rhamnicola. When K = 3, the (first) white cluster also was domi-
nant in A. gossypii HAPs, except for Ag_RH with large blue assignment and Ag_Hi with small
green and blue ones, the (third) blue cluster as the ‘Rhamnus group’ prevalent in Ar_SE,
Ar_PE, Ar_YO, Ar_IX, Ar_RH, Ar_CO, Ar_LE, Ar_PH and Ar_ST, and the (second) green
cluster in the rest as the ‘Rubia group’. When K = 4, the genetic structure was basically similar
Table 3. Analysis of molecular variance (AMOVA) results for microsatellite data analysis of aphids grouped by
three cases: (1) gossypii vs rhamnicola, (2) perennial vs non-perennial host groups in A. gossypii, (3) perennial vs
non-perennial host groups in A. rhamnicola.
Among groups Among populations within
groups
Within
populations
Case Va PV P Vb PV P Vc PV P1 0.50 14.59 <0.0001 0.77 22.60 <0.0001 2.14 62.81 <0.0001
2 -0.01 -0.55 <0.0001 0.48 18.54 <0.0001 2.13 82.01 0.4458
3 -2.59 -0.09 0.0001 1.47 41.55 <0.0001 2.16 61.04 0.8602
Fst: Among groups, Fsc: Among populations within groups, Fct: Within populations, V: Variance components. PV:
Percentage of variation.
https://doi.org/10.1371/journal.pone.0245604.t003
PLOS ONE Complex evolution in Aphis gossypii group
PLOS ONE | https://doi.org/10.1371/journal.pone.0245604 February 4, 2021 14 / 28

to that at K = 3, except that the (fourth) red cluster was dominant in Ag_IL, Ag_CU, Ag_CM,
Ag_KA, Ag_SO, Ag_CA, and Ag_CP, and partially appeared in Ag_EL, Ag_HI, Ag_HR,
Ag_EU, Ag_EJ, and Ag_CI. When K = 5, the genetic structure was basically similar to that at
K = 4, except that both Ar_YO and Ar_IX showed the (fifth) dark-blue cluster.
The Bayesian assignment tests using GENECLASS 2 [73] were carried out to identify the
HAP (as population) membership of 578 individuals from all the 36 HAPs. The result of the
assignment test (S2 Table) indicated the average probability with which individuals were
assigned to the corresponding reference HAP (as population). The self-assignment probability
values (SA) averaged (0.482 ± 0.106) (mean ± s.d.) in overall HAPs, (0.515 ± 0.103) in A. gossy-pii, and (0.427 ± 0.08) in A. rhamnicola. In A. gossypii, the mean assignment probability from
391 A. gossypii individuals into Ag_RH had the highest value (0.446, SA = 0.381), which was
followed by the assignment value into each reference HAP of Ag_HI (0.219, SA = 0.478) and
Ag_PU (0.214, SA = 0.458) (Fig 5). In A. rhamnicola, the mean assignment probability from
145 A. rhamnicola individuals into Ar_RU had the highest value (0.137, SA = 0.489), which
was similar to the assignment rate into each reference HAP of Ar_CB (0.131, SA = 0.463) and
Ag_LY (0.129, SA = 0.309) (Fig 6).
Inferring a ancestral primary host to test hypothetical scenarios by ABC analysis. To
propose the most likely ‘ancestral host evolution’ scenario followed by the hypothesis that
Fig 3. A plot of the principal coordinate analysis based on the first two factors for 578 individuals of the four gossypii group species. Each color corresponds
to that shown in the results of STRUCTURE when K = 3 (Fig 3); white –23 HAPs of A. gossypii; blue–Rhamnus group, 7 HAPs of A. rhamnicola; green–Rubiagroup, 6 HAPs of A. rhamnicola. First and second coordinate axes account for (26.13 and 11.90) %, respectively.
https://doi.org/10.1371/journal.pone.0245604.g003
PLOS ONE Complex evolution in Aphis gossypii group
PLOS ONE | https://doi.org/10.1371/journal.pone.0245604 February 4, 2021 15 / 28

most of the A. gossypii populations originated from two possible ancestral HAPs (e.g. Ag_RH,
Ag_HI), which had diverged from A. rhamnicola, the ABC test was conducted. We tested four
scenarios to determine which HAP is the most ancestral among all the HAPs in A. gossypii (see
“M&M”). The generated results are presented as a logistic regression using DIYABC software,
estimating the PP of each tested evolutionary scenario of the hypothesis for the selected simu-
lated data (nδ) (Cornuet et al. 2008), which ranged between (8 000 (or 6 000) and 80 000 (or 60
000)) nδ.In the result of the first analysis (S4 Fig), scenario A1 obtained the highest PP ranging
(0.664 (nδ = 8000) to 0.697 (nδ = 80 000)), with a 95% CI of (0.601–0.727) and (0.677–0.716).
Fig 4. Genetic structure of 36 HAPs of the two gossypii complex species (A. gossypii and A. rhamnicola) for 578 individuals performed by STRUCTURE 2.3.3 [70].
Results are shown for K = (2 to 5). Pop ID. (top) corresponds to Table 1, and the scientific plant name of each HAP is shown (bottom).
https://doi.org/10.1371/journal.pone.0245604.g004
Fig 5. Mean assignment rate (blue bar, values on left) from 391 Aphis gossypii individuals into each population (x column), and self-assignment rate (orange line,
values on right) of individuals of each population using GENECLASS 2 [73].
https://doi.org/10.1371/journal.pone.0245604.g005
PLOS ONE Complex evolution in Aphis gossypii group
PLOS ONE | https://doi.org/10.1371/journal.pone.0245604 February 4, 2021 16 / 28

Scenario A2 showed a PP (Table 4). As a result, scenario A1 appeared as the most robust
hypothesis with the highest PP among the four scenarios tested, which suggests that, compared
to the other remaining hosts, Rhamnus is the most ancestral host for A. gossypii and A. rhamni-cola, respectively.
In the result of the second analysis (S5 Fig), the scenario B2 was estimated more highly than
the other four scenarios (Table 4). As a result, although the direct approach estimated a slightly
higher PP for scenario B1 (0.520 and 0.480) than for B2 (0.460 and 0.448) (S5 Fig), the scenario
B2 appeared as the the highest PP in the logistic regression. It is well supported that A. rhamni-cola is the origin of A. gossypii (B1, B2), but is not conclusive whether the RED group in A. gos-sypii is diverged from the WHITE group, or vice versa.
In the result of the third analysis (S6 Fig), scenario C4 obtained the highest PP (Table 4). As
a result, although the direct approach estimated a slightly higher PP for scenario C6 (0.400 and
0.326) and C5 (0.140 and 0.234) than for C4 (0.180 and 0.198) (S6 Fig), the scenario C4
appeared as the highest PP among the four scenarios tested in the logistic regression. This sug-
gests that, within A. gossypii, the WHITE group is more ancestral than the MRW and RED
groups, and then RED is originated from MRW, which hypothesizes that Hibiscus is the sec-
ondarily primary host, and can be still a refuge for the RED group.
Fig 6. Mean assignment rate (blue bar, values on left) from 187 Aphis rhamnicola individuals into each population (x column), and self-assignment rate (orange
line, values on right) of individuals of each population using GENECLASS 2 [73].
https://doi.org/10.1371/journal.pone.0245604.g006
Table 4. Probabilities (with 95% confidence intervals in brackets) of the logistic regression for the scenarios in three different analyses inferred from DIYABC [77].
Posterior probability of each historical scenario
First analysis (Scenario A#) Second analysis (Scenario B#) Third analysis (Scenario C#)
No. nδ = 8000 nδ = 80 000 nδ = 8000 nδ = 80 000 nδ = 8000 nδ = 80 000
1 0.6640 [0.6010,0.7269] 0.6965 [0.6767,0.7162] 0.4480 [0.3899,0.5061] 0.4335 [0.4142,0.4529] 0.0029 [0.0001,0.0056] 0.0019 [0.0013,0.0024]
2 0.0072 [0.0032,0.0112] 0.0081 [0.0069,0.0094] 0.5207 [0.4624,0.5790] 0.5169 [0.4974,0.5365] 0.0008 [0.0000,0.0017] 0.0018 [0.0013,0.0024]
3 0.3131 [0.2511,0.3751] 0.2899 [0.2702,0.3095] 0.0001 [0.0000,0.0002] 0.0005 [0.0003,0.0006] 0.2510 [0.1258,0.3762] 0.2017 [0.1686,0.2349]
4 0.0009 [0.0000,0.0023] 0.0007 [0.0005,0.0009] 0.0164 [0.0065,0.0263] 0.0264 [0.0224,0.0303] 0.3609 [0.2288,0.4929] 0.4917 [0.4460,0.5375]
5 0.0000 [0.0000,0.0001] 0.0001 [0.0001,0.0001] 0.0146 [0.0056,0.0236] 0.0226 [0.0192,0.0260] 0.1011 [0.0469,0.1554] 0.0963 [0.0786,0.1139]
6 0.0124 [0.0000,0.0259] 0.0034 [0.0024,0.0044] 0.0002 [0.0000,0.0007] 0.0001 [0.0001,0.0001] 0.2834 [0.1663,0.4004] 0.2066 [0.1742,0.2389]
7 0.0005 [0.0000,0.0012] 0.0007 [0.0005,0.0009] N/A N/A N/A N/A
8 0.0020 [0.0000,0.0042] 0.0007 [0.0005,0.0008] N/A N/A N/A N/A
For each comparison, the selected scenario (bold entry in shaded cell) was the one with the highest probability value.
https://doi.org/10.1371/journal.pone.0245604.t004
PLOS ONE Complex evolution in Aphis gossypii group
PLOS ONE | https://doi.org/10.1371/journal.pone.0245604 February 4, 2021 17 / 28
Discussion
Complex evolution in Aphis gossypiiOur results identify the genetic structure between the various primary and secondary HAPs of
the two species, A. gossypii and A. rhamnicola, encompassing the most various aphid samples
from wild host plants. Our population genetic analyses reveal that A. gossypii and A. rhamni-cola are mainly split into three (red, white, blue) and the other three (dark-blue, blue, green)
biotypes, respectively, based on the STRUCTURE result (Fig 4, K = 5). The evolutionary trend
of these aphids cannot be defined in any particular direction, and they show complex and vari-
ous speciation tendencies. Here, we highlight major cases in these species.
One of the notable results is that some secondary HAPs seem to use a specific primary host
(Fig 4, K = 4). In other words, A. gossypii and A. rhamnicola do not promiscuously use their
primary and secondary host plants; instead, certain biotypes use only some secondary and spe-
cific primary hosts. For example, secondary HAPs having green biotype (e.g. Capsella, Lysima-chia, Stellaria, and Veronica) seem to use only Rubia as the primary host in our dataset. On the
other hand, Rhamanus serves as the primary host for the secondary HAPs having blue biotypes
(e.g. Commellina, Leonurus, Perilla, Phryma, and Sedum). These cases indicate that a group
that apparently uses several primary hosts is actually a complex of groups using a specific pri-
mary host.
In contrast to the previous cases, the white and red biotypes were found to share some pri-
mary and secondary hosts (Fig 4, K = 4). In particular, the white biotype has been extensively
found in the most diverse primary hosts, such as Callicarpa, Catalpa, Celastrus, Citrus, Euno-nymus, Hibiscus, and Punica. The red biotype occurs in Citrus, Eunonymus japonica, Hibiscus,Ilex, and Punica. However, some primary hosts were exclusively occupied by the white (e.g.
Catalpa and Celastrus,) or red type (e.g. Ilex), suggesting that these biotypes are possibly in a
state of diverging through specialization to specific primary hosts. Interestingly, similar to the
first case (i.e. blue and green types), the white and red types also tended to use specific second-
ary host groups, respectively. Except for a few secondary hosts (e.g. Cucurbita and Solanum),
most of them represented only one biotype. For example, Cucumis sativus and Capsicumannuum were completely occupied by the red biotype. This is similar to the tendency found in
most polyphagous aphids that the primary host is shared, but the secondary host is completely
different [32,86–89].
In the STRUCTURE results, the dark-blue biotype (Fig 4, K = 5) represents the third case.
The dark-blue biotype was represented only by two secondary hosts, Ixeris and Youngia, and
was not found in any primary host. Thus, we assume that this case seems to be an ecologically
isolated host race through the loss of a primary host. Although we did not confirm the lifecycle
of this biotype in this study, there is a reference to A. gossypii inhabiting some Asteraceae
plants in the previous study, even though those HAPs are identified to A. rhamnicola based on
our results (Figs 3 and 4). Blackman and Eastop [22] found that populations producing eggs
on the roots of Ixeris, including some Asteraceae plants in China identified as A. gossypii, may
be other closely-related species.With large genetic differences from the main group of both A.
gossypii and A. rhamnicola (Fig 4), they were possibly isolated to the secondary host directly
from the ancestral primary HAP in Rhamnus by the host alternation, supporting the possibility
of differentiation from their ancestral host race according to the loss of primary host [32].
Thus, the dark-blue biotype is likely to be an ecologically incipient species of A. rhamnicola,
which has recently been derived by secondary host isolation.
Our results show strong evidence of ecological specialization through a primary host shift
in both A. gossypii and A. rhamnicola. ABC analyses yielded the biotypes of the two species
that were formed by shifting from the shared resource, Rhamnus, to different primary hosts,
PLOS ONE Complex evolution in Aphis gossypii group
PLOS ONE | https://doi.org/10.1371/journal.pone.0245604 February 4, 2021 18 / 28

respectively (S4 and S5 Figs). In particular, the series of primary host transitions identified in
A. gossypii seem to have played an important role in the formation of their biotypes. For heter-
oecious aphids, a distinct choice of the primary host means not only utilizing different
resources, but also genetic isolation between populations. This is because at one and the same
time, the primary host is a resource, and a mating place. Accordingly, primary host selection
in aphids is closely linked to genetic structure. Interestingly, in these species, primary host
transitions occur more commonly than expected. As a traditional notion, primary hosts in
aphids have been considered to be very fixed, and to not be able to easily escape, due to a
highly adapted fundatrix morph [32,33]. In particular, the white biotype that appears in many
A. gossypii uses a wide variety of taxonomically unrelated primary hosts, which show a variable
relationship between primary and fundatrix (Fig 4). However, the results of our ABC analyses
identified that A. gossypii was firstly derived from the biotype associated with Rhamnus to a
white biotype, and then Hibiscus associated biotype was derived (S4 Fig). Thus, having multi-
ple primary hosts is possibly a transitional step to shifting to another primary host. In fact,
Hibiscus is a plant closely related to Gossypium (i.e. cotton), a representative secondary host of
A. gossypii. Unfortunately, although Gossypium associated population was not included in this
study, it can be inferred that there is a possibility that the transition of primary host through
secondary host may have occurred. However, similar to our results, Carletto et al. [12] also
suggested the possibility that Hibiscus was a shared ancestral host from which the agricultural
divergence originated. In light of its HAP being genetically shared with the other HAPs in agri-
cultural crops, such as Gossypium, cucurbits, and other secondary hosts.
Since the fundatrix specialization hypothesis [32,33] has been proposed, the complex life-
cycle of aphids has long been regarded as a by-product of aphid evolution. However, the iden-
tification of several heteroecious HAPs in A. gossypii and A. rhamnicola in our study is largely
in conflict with the expectations of this hypothesis. In our results, except for one case (i.e. the
dark-blue biotype), the HAPs appear not to be genetically isolated completely but still to be
linked together between some group of primary and secondary hosts, in contrast to the
assumption that monoecy as a dead-end [32] is evolutionarily favorable over heteroecy. Mor-
an’s hypothesis [32] predicts that the dead-end of heteroecy always leads to specialization on
the secondary host by loss of the primary host. Nevertheless, our results indicate that a new
heteroecy race can commonly be derived from the heteroecy ancestors. In other words, our
results show that lifecycle evolution is not a one-way process [32], but can be much more vari-
able than we expected. These results are similar to the recent study on the genus Brachycaudus(Aphidinae: Macrosiphini), which provided strong evidence of the evolutionary lability of a
complex lifecycle in Brachycaudus [89]. In addition, the use of several primary hosts found in
some races (i.e. red and white biotypes) negates the core assumption of the fundatrix speciali-
zation hypothesis [32,33] that the fundatrix is fully adapted to the only primary host, and is
inadequate to other hosts. Using multiple primary hosts is possibly a strategy for their migra-
tion success. Indeed, a migration failure can lead to high risk. For example, aphids using only a
single primary host, such as Rhopalosiphum padi, have only a 0.6% migration success rate [90].
Ancestral host association in A. gossypii complex
Rhamnus appears to be the most ancestral host plant for both A. gossypii and A. rhamnicola.
Several species in the gossypii complex group have intimate relationships with Rhamnus (e.g.
A. frangulae, A. glycines, A. gossypii, A. nasturtii and A. rhamnicola), which have been consid-
ered Rhamnus as an ancestral host for this aphid group [22,43]. Our ABC result is consistent
with this assumption (S4 and S5 Figs). As in the previous study, Rhamnus appears to serve as a
shared primary host for both A. gossypii and A. rhamnicola. In the GENECLASS2 analyses
PLOS ONE Complex evolution in Aphis gossypii group
PLOS ONE | https://doi.org/10.1371/journal.pone.0245604 February 4, 2021 19 / 28

(Figs 5 and 6) as well, the assignment of most of the gossypii HAPs to Rhamnus was very high,
corroborating that it was differentiated from the ancestral host, Rhamnus.Despite the differentiation of aphids into various species using the different hosts (mainly
secondary hosts), host utilization of Rhamnus still remains in several species of the gossypiigroup. The phylogenetic studies of Aphis showed that heteroecious species using Rhamnus as
the primary host were derived non-consecutively from monoecious species [44,91]. In other
words, even if a monoecious species has been derived by loss of heteroecy, it seems likely to
not be the dead-end of evolution [33], as well as a complete disconnect from the ancestral pri-
mary host. For example, A. rhamnicola and A. gossypii are heteroecious species, which use
Rhamnus as the primary host, and several monoecious species on various host plants appear to
have been derived between them [46]. Our ABC analyses confirmed that Rhamnus was lost
once when branching from blue type to green type, and was then regained in white type (S4
Fig). Surprisingly, these ABC results, similarly supported by the GenClass2 results (Figs 5 and
6), almost coincided with our haplotype network results (Fig 2).
These results conflict the fundatrix specialization hypothesis [32,33], which predicts that
once aphids leave the ancestral primary host, they cannot regain it again. Recently, the phylo-
genetic study of Brachycaudus demonstrated that even if they lost their potential ancestral
Rosaceae hosts, they can easily regain their hosts to be the primary host for heteroecy, or the
sole host for monoecy [89]. The ancestral primary host does not seem to be an absolute being
that cannot be changed due to the adaptation of the fundatrix, but seems to be a conserved
resource within a specific aphid group. In fact, such a labile of aphid lifecycle related to the use
of primary hosts may also occur within a species. Host alternation for some species is often not
obligatory but facultative, in which the migration to the secondary host can often be omitted
[15,92]. As an example, a facultative alternation lifecycle has been reported in populations of
Aphis fabae, even although the vast majoriy of them migrate routinely between primary and
secondary hosts [92]. Although there is little known about the facultative use of the primary
host in A. gossypii, it may be related to the primary host range expansion and lifecycle lability.
The evidence of hybridization between A. gossypii and A. rhamnicolaOur population genetic analyses based on microsatellite and COI gene show that there is a sig-
nificant conflict between the two results. Regardless of the primary and secondary hosts, we
found individuals that are difficult to identify in some host-associated populations. A. gossypiiand A. rhamnicola appeared to share major haplotypes, H9 and H2, respectively, of their coun-
terpart species with each other. Although the PCoA and STRUCTURE results (Figs 3 and 4)
based on the microsatellites clearly showed identification of A. gossypii, the individuals corre-
sponding to H2 (major haplotype of A. rhamnicola) were two individuals from Ag_Hi and one
from Ag_KA, whereas the individuals corresponding to H9 (major haplotype of A. gossypii)were also identified as A. rhamnicola, but six from Ar_CB, one from Ar_PH, and four from
Ar_RU. Surprisingly, the cross-sharing haplotypes (H5, H9) between these two species unex-
pectedly contained several kinds of both primary and secondary hosts.
Comparing the host races between A. gossypii and A. rhamnicola, most of them were dis-
tributed in two haplotypes (H9 and H2), and they were clearly identified as distinct species,
based on the microsatellite analysis (Fig 2). However, a number of intermediate haplotypes,
H13, H11, H12, H10, and H18, were observed among the species (Fig 2). The H1 haplotype
shared by several wild plant populations, such as Ixeris, Leonurus, Perilla, Phryma, and
Youngia, is closely related to the H9 (major haplotype of A. gossypii). However, according to
our microsatellite data, these populations appear to be closer to A. rhamnicola (Figs 3 and 4).
Similarly, collected from Rubia akane, individuals of H4, H6, H7, and H8 haplotypes
PLOS ONE Complex evolution in Aphis gossypii group
PLOS ONE | https://doi.org/10.1371/journal.pone.0245604 February 4, 2021 20 / 28

apparently have alleles of A. rhamnicola in microsatellite data; it is most unusual that they have
the haplotypes closely related to and derived from A. gossypii, rather than A. rhamnicola. In
the case of H18, it is inferred to be the similar haplotype of true A. gossypi in Curcubitaceae,
and H13 of Ar_SE, which was often cryptically recognized from A. gossypii as A. rhamnicolabased on morphology and mtDNA [42,93], was nested between the two species, A. gossypiiand A. rhamnicola. Since it was reported that populations with a sexual phase on Rubia cordifo-lia in Japan appeared to be isolated from those on other primary hosts [25], it is suspected that
most of the populations collected from Rubia in the past might actually be host races of A.
rhamnicola, but misidentified.
Hybridization can have important evolutionary consequences, including speciation in asso-
ciation with novel host plants in insects [94]. In our study, as the two species, A. gossypii and
A. rhamnicola, with distinct taxonomic and phylogenetic differences shared COI haplotypes of
counterpart species with each other, there is a possibility of introgression by hybridization
between them. These two species share overwintering (primary) host, such as Rhamnus, so
mating and reproducing contemporarily in the same leaves or branches, because there are no
physiological or ecological significant differences [43,46]; there is therefore the possibility that
hybridization occurs between them. In fact, interspecific cross mating between sexuparae of A.
glycines, A. gossypii, and A. rhamnicola in Rhamnus spp. has often been observed (unpublished
data). It is an interesting phenomenon that a hybrid zone mediated not by geography, but by a
resource, can exist. Lozier et al. [87] first detected hybridization and introgression between
plum and almond associated Hyalopterus spp. on these host plants, which surprisingly were
capable of feeding and developing on apricot from each species. For that possibility of hybrid-
ization, it was suggested that imperfections in any number of mechanisms associated with host
plant choice [95,96] could lead to strong selection against hybrids on parental host plants, but
less so on apricot [87]. Although apricot was introduced later than other host species in the
studied area, it remains a mystery why only it is able to attract all Hyalopterus groups and per-
mit hybridization, whereas the other Prunus hosts are more restrictive [87]. Based on the phy-
logenetic results of COI or Buchnera 16S for Hyalopterus spp. [87], peach or apricot could be
inferred to their ancestral host like the Rhamnus as a hybridization host utilized by the gossypiigroup. These results from the gossypii group reaffirm the hypothesis of Lozier et al. [87], which
corroborates that such hybridization in the aphid group often occurs by co-existence in the
primary host. However, further research is needed to determine whether a primary host (i.e.
hosts that can be utilized by various host races, where they co-exist and overwinter together)
are ancestral or derivational for those aphids.
Supporting information
S1 Fig. The first eight scenarios (A1–A8) for the DIYABC analyses to infer the host evolution
of the two Aphis species, using a dataset that includes 578 individuals from four population
groups, which consisted of 75 individuals from the ‘BLUE’ group (Ar_SE, Ar_PE, An_IX,
An_YO, Ar_CO, Ar_PH, Ar_RH, Ar_LE); 90 from the ‘GREEN’ group (Ar_ST, Ar_VE,
Ar_LY, Ar_CB, Ar_RU); 30 from the ‘MIXBW (BLUE+WHITE)’ group (Ag_RH, Ag_CJ); and
361 from the ‘WHITE’ group (Ag-IL, Ag_CE, Ag_EU, Ag_EJ, Ag_PU, Ag_CU, Ag_CM,
Ag_KA, Ag_EL, Ag_HI, Ag_HR, Ag_FO, Ag_CI, Ag_ER, Ag_SN, Ag_CO, Ag_SO, Ag_CA,
Ag_CP, Ag_CL, Ag_CT).
(TIF)
S2 Fig. The second six scenarios (B1–B6) for the DIYABC analyses to infer the host evolution
of the two Aphis species, using a dataset that includes 311 individuals from four population
groups, which consisted of 75 individuals from the ‘BLUE’ group (Ar_CO, Ar_PH, Ar_RH,
PLOS ONE Complex evolution in Aphis gossypii group
PLOS ONE | https://doi.org/10.1371/journal.pone.0245604 February 4, 2021 21 / 28

Ar_SE, Ar_PE, Ar_LE); 90 from the ‘GREEN’ group (Ar_ST, Ar_VE, Ar_LY, Ar_CB, Ar_RU);
60 from the ‘RED’ group (Ag_IL, Ag_CU, Ag_CA, Ag_CP); and 86 from the ‘WHITE’ group
(Ag_CE, Ag_FO, Ag_ER, Ag_SN, Ag_CO, Ag_CL, Ag_CT).
(TIF)
S3 Fig. The third six scenarios (C1–C6) for the DIYABC analyses to infer the host evolution
of Aphis gossypii, using a dataset that includes 391 individuals from four population groups
except for BLUE and GREEN groups in the first and second analysis, which consisted of 30
individuals from the ‘MBW (BLUE+WHITE)’ group (Ag_RH, Ag_CJ); 207 from the ‘MRW
(RED+WHITE)’ group (Ag_EU, Ag_EJ, Ag_PU, Ag_SO, Ag_CM, Ag_EL, Ag_HI, Ag_HR,
Ag_CI); 68 from the ‘RED’ group (Ag-IL, Ag_CU, Ag_KA, Ag_CA, Ag_CP); and 86 from the
‘WHITE’ group (Ag_CE, Ag_FO, Ag_ER, Ag_SN, Ag_CO, Ag_CL, Ag_CT).
(TIF)
S4 Fig. Plots output by DIYABC showing the PP (y-axis) of the first eight scenarios (A1–A8)
through the direct estimate (left), and the logistic regression (right) approaches, as output by
DIYABC. The x-axis corresponds to the different nδ values used in the computations. The
results have been obtained by performing the first analysis with four scenarios.
(TIF)
S5 Fig. Plots output by DIYABC showing the PP (y-axis) of the second six scenarios (B1–B6)
through the direct estimate (left), and the logistic regression (right) approaches, as output by
DIYABC. The x-axis corresponds to the different nδ values used in the computations. The
results have been obtained by performing the first analysis with four scenarios.
(TIF)
S6 Fig. Plots output by DIYABC showing the PP (y-axis) of the third six scenarios (C1–C6)
through the direct estimate (left), and the logistic regression (right) approaches, as output by
DIYABC. The x-axis corresponds to the different nδ values used in the computations. The
results have been obtained by performing the first analysis with four scenarios.
(TIF)
S1 Table. Collection data for 578 aphids analyzed in this study. † possibly A. rhamnicola or
other cryptic species †† possibly other cryptic species.
(DOCX)
S2 Table. Mean assignment rate of individuals into (rows) and from (columns) each popu-
lation using GeneClass 2 [73]. Values in bold indicate the proportions of individuals assigned
to the source population (self-assignment). Values less than 0.001 were excluded from the
table.
(DOCX)
S1 File.
(ZIP)
Author Contributions
Conceptualization: Yerim Lee, Thomas Thieme, Hyojoong Kim.
Data curation: Yerim Lee, Hyojoong Kim.
Formal analysis: Yerim Lee, Hyojoong Kim.
Funding acquisition: Hyojoong Kim.
PLOS ONE Complex evolution in Aphis gossypii group
PLOS ONE | https://doi.org/10.1371/journal.pone.0245604 February 4, 2021 22 / 28

Investigation: Thomas Thieme, Hyojoong Kim.
Methodology: Yerim Lee, Hyojoong Kim.
Project administration: Hyojoong Kim.
Resources: Yerim Lee, Thomas Thieme, Hyojoong Kim.
Software: Yerim Lee, Hyojoong Kim.
Supervision: Hyojoong Kim.
Validation: Yerim Lee, Hyojoong Kim.
Visualization: Yerim Lee, Hyojoong Kim.
Writing – original draft: Yerim Lee, Thomas Thieme, Hyojoong Kim.
Writing – review & editing: Yerim Lee, Thomas Thieme, Hyojoong Kim.
References1. Chapman R. Foraging and food choice in phytophagous insects. In: Hardege JD, editor. Chemical ecol-
ogy. Oxford: Eolss Publishers; 2009. p. 99–141.
2. Berlocher SH, Feder JL. Sympatric speciation in phytophagous insects: Moving beyond controversy?
Annual Review of Entomology. 2002; 47:773–815. ISI:000173421900025. https://doi.org/10.1146/
annurev.ento.47.091201.145312 PMID: 11729091
3. Jaenike J. Host Specialization in Phytophagous Insects. Annual Review of Ecology and Systematics.
1990; 21(1):243–73. https://doi.org/10.1146/annurev.es.21.110190.001331
4. Mitter C, Farrell B, Wiegmann B. The phylogenetic study of adaptive zones: Has phytophagy promoted
insect diversification? The American Naturalist. 1988; 132(1):107–28.
5. Futuyma DJ, Agrawal AA. Macroevolution and the biological diversity of plants and herbivores. Pro-
ceedings of the National Academy of Sciences of the United States of America. 2009; 106(43):18054–
61. https://doi.org/10.1073/pnas.0904106106 ISI:000271222500006. PMID: 19815508
6. Mitter C, Farrell B, Futuyma D. Phylogenetic studies of insect-plant interactions: Insights into the gene-
sis of diversity. Trends in Ecology and Evolution. 1991; 6:290–3. https://doi.org/10.1016/0169-5347(91)
90007-K PMID: 21232484
7. Ferrari J, Via S, Godfray HC. Population differentiation and genetic variation in performance on eight
hosts in the pea aphid complex. Evolution. 2008; 62(10):2508–24. https://doi.org/10.1111/j.1558-5646.
2008.00468.x PMID: 18647340.
8. Lopez-Vaamonde C, Rasplus JY, Weiblen GD, Cook JM. Molecular phylogenies of fig wasps: Partial
cocladogenesis of pollinators and parasites. Molecular Phylogenetics and Evolution. 2001; 21(1):55–
71. https://doi.org/10.1006/mpev.2001.0993 ISI:000171486700006. PMID: 11603937
9. Walsh BD. On phytophagic varieties and phytophagic species. Proc Entomol Soc Phila. 1864; 3:403–
30.
10. Matsubayashi KW, Ohshima I, Nosil P. Ecological speciation in phytophagous insects. Entomologia
Experimentalis et Applicata. 2010; 134(1):1–27. https://doi.org/10.1111/j.1570-7458.2009.00916.x
ISI:000272308300001.
11. Peccoud J, Ollivier A, Plantegenest M, Simon JC. A continuum of genetic divergence from sympatric
host races to species in the pea aphid complex. Proceedings of the National Academy of Sciences of
the United States of America. 2009; 106(18):7495–500. ISI:000265783600043. https://doi.org/10.1073/
pnas.0811117106 PMID: 19380742
12. Carletto J, Lombaert E, Chavigny P, Brevault T, Lapchin L, Vanlerberghe-Masutti F. Ecological speciali-
zation of the aphid Aphis gossypii Glover on cultivated host plants. Molecular Ecology. 2009; 18
(10):2198–212. https://doi.org/10.1111/j.1365-294X.2009.04190.x WOS:000265774300013. PMID:
19635073
13. Margaritopoulos JT, Malarky G, Tsitsipis JA, Blackman RL. Microsatellite DNA and behavioural studies
provide evidence of host-mediated speciation in Myzus persicae (Hemiptera: Aphididae). Biological
Journal of the Linnean Society. 2007; 91(4):687–702. https://doi.org/10.1111/j.1095-8312.2007.00828.
x WOS:000248599900011.
14. Simon JC, Carre S, Boutin M, Prunier-Leterme N, Sabater-Muñoz, Latorre A, et al. Host-based diver-
gence in populations of the pea aphid: insights from nuclear markers and the prevalence of facultative
PLOS ONE Complex evolution in Aphis gossypii group
PLOS ONE | https://doi.org/10.1371/journal.pone.0245604 February 4, 2021 23 / 28

symbionts. Proceedings of the Royal Entomological Society of London (B). 2003; 270:1703–12. https://
doi.org/10.1098/rspb.2003.2430 PMID: 12964998
15. Peccoud J, Simon JC, von Dohlen C, Coeur d’acier A, Plantegenest M, Vanlerberghe-Masutti F, et al.
Evolutionary history of aphid-plant associations and their role in aphid diversification. C R Biol. 2010;
333(6–7):474–87. https://doi.org/10.1016/j.crvi.2010.03.004 PMID: 20541159.
16. Kergoat GJ, Meseguer AS, Jousselin E. Chapter Two—Evolution of Plant–Insect Interactions: Insights
From Macroevolutionary Approaches in Plants and Herbivorous Insects. In: Sauvion N, Thiery D, Cala-
tayud P-A, editors. Advances in Botanical Research. 81: Academic Press; 2017. p. 25–53.
17. Caillaud MC, Via S. Specialized feeding behavior influences both ecological specialization and assorta-
tive mating in sympatric host races of pea aphids. The American Naturalist. 2000; 156(6):606–21.
ISI:000165870000004. https://doi.org/10.1086/316991 PMID: 29592544
18. Via S, Bouck AC, Skillman S. Reproductive isolation between divergent races of pea aphids on two
hosts. II. Selection against migrants and hybrids in the parental environments. Evolution. 2000; 54
(5):1626–37. ISI:000165471000015. https://doi.org/10.1111/j.0014-3820.2000.tb00707.x PMID:
11108590
19. Kanbe T, Akimoto SI. Allelic and genotypic diversity in long-term asexual populations of the pea aphid,
Acyrthosiphon pisum in comparison with sexual populations. Molecular Ecology. 2009; 18(5):801–16.
https://doi.org/10.1111/j.1365-294X.2008.04077.x WOS:000263521800006. PMID: 19207245
20. Moran NA, Kaplan ME, Gelsey MJ, Murphy TG, Scholes EA. Phylogenetics and evolution of the aphid
genus Uroleucon based on mitochondrial and nuclear DNA sequences. Systematic Entomology. 1999;
24(1):85–93. ISI:000078781800006.
21. Favret C, Voegtlin DJ. Speciation by host-switching in pinyon Cinara (Insecta: Hemiptera: Aphididae).
Mol Phylogenet Evol. 2004; 32(1):139–51. https://doi.org/10.1016/j.ympev.2003.12.005 PMID:
15186803.
22. Blackman RL, Eastop VF. Aphids on the World’s Plants. Available from: http://www.
aphidsonworldsplant.info. 2019;(retrieval date 08/05/2019).
23. Inaizumi M. Studies on the life-cycle and polymorphism of Aphis gossypii Glover (Homoptera, Aphidi-
dae).) Special Bulletin of the College of Agriculture, Utsunomiya University. 1980;37(1–132).
24. Lee S, Kim H. Economic Insects of Korea 28 (Insecta Koreana Suppl. 35), Aphididae: Aphidini (Hemi-
ptera: Sternorrhyncha). Suwon, Rep. of Korea: National Institue of Agricultural Science and Technol-
ogy; 2006.
25. Inaizumi M. Life cycle of Aphis gossypii Glover (Homoptera, Aphididae) with special reference to bio-
type differentiation on various host plants. Kontyu. 1981; 49:219–40.
26. Heie OE. The Aphidoidea (Hemiptera) of Fennoscandia and Denmark. III. Family Aphididae: subfamily
Pterocommatinae & tribe Aphidini of subfamily Aphidinae. Klampenborg, Denmark: Scandinavian Sci-
ence Press Ltd.; 1986.
27. Kring JB. The life cycle of the melon aphid, Aphis gossypii Glover, an example of facultative migration.
Annals of the Entomological Society of America. 1959; 52:284–6.
28. Blackman RL, Eastop VF. Aphids on the World’s Herbaceous Plants and Shrubs, Vol. 2, The Aphids.
Chichester: John Wiley & Sons Ltd.; 2006. 1025–439 p.
29. Eastop VF, Hille Ris Lambers D. Survey of the World’s Aphids: Dr. W. Junk, The Hague (The Nether-
lands); 1976.
30. Favret C. Aphid Species File. Version 1.0/4.0. Available at: http://Aphid.SpeciesFile.org. Accessed
2019 Aug 6. 2019.
31. Moran NA. Adaptation and Constraint in the Complex Life-Cycles of Animals. Annual Review of Ecology
and Systematics. 1994; 25:573–600. https://doi.org/10.1146/annurev.ecolsys.25.1.573 WOS:
A1994PU88300023.
32. Moran NA. The Evolution of Aphid Life-Cycles. Annual Review of Entomology. 1992; 37:321–48.
https://doi.org/10.1146/annurev.ento.37.1.321 WOS:A1992GY50200014.
33. Moran NA. The Evolution of Host-Plant Alternation in Aphids—Evidence for Specialization as a Dead
End. Am Nat. 1988; 132(5):681–706. https://doi.org/10.1086/284882 WOS:A1988R012000006.
34. von Dohlen CD, Rowe CA, Heie OE. A test of morphological hypotheses for tribal and subtribal relation-
ships of Aphidinae (Insecta: Hemiptera: Aphididae) using DNA sequences. Molecular Phylogenetics
and Evolution. 2006; 38(2):316–29. https://doi.org/10.1016/j.ympev.2005.04.035
WOS:000235121800003. PMID: 16368250
35. Blackman RL, Eastop VF. Aphids on the World’s Trees: An Identification and Information Guide. Wal-
lingford: CAB International; 1994. 987 p.
PLOS ONE Complex evolution in Aphis gossypii group
PLOS ONE | https://doi.org/10.1371/journal.pone.0245604 February 4, 2021 24 / 28

36. Dixon AFG. The way of life of aphids: host specificity, speciation and distribution. In: Minks AK, Harre-
wijn P, editors. Aphids their biology, natural enemies and control, Vol A. A. Amsterdam: Elsevier; 1987.
p. 197–207.
37. Ward SA. Reproduction and host selection by aphids: the importance of ‘‘rendezvous” hosts. In: Bailey
WJ, Ridshill-Smith J, editors. Reproductve Behaviour of Insects. New york: Chapman and Hall; 1991.
p. 202–26.
38. Blackman RL, Eastop VF. Aphids on the World’s Crops: An Identification and Information Guide. 2nd
ed. Chichester: John Wiley & Sons Ltd.; 2000. 466 p.
39. Hardy NB, Peterson DA, von Dohlen CD. The evolution of life cycle complexity in aphids: Ecological
optimization or historical constraint? Evolution. 2015; 69(6):1423–32. https://doi.org/10.1111/evo.
12643 PMID: 25787153
40. Moran NA. Aphid Life-Cycles—2 Evolutionary Steps. Am Nat. 1990; 136(1):135–8. https://doi.org/10.
1086/285087 WOS:A1990DY11500009.
41. Charaabi K, Carletto J, Chavigny P, Marrakchi M, Makni M, Vanlerberghe-Masutti F. Genotypic diver-
sity of the cotton-melon aphid Aphis gossypii (Glover) in Tunisia is structured by host plants. Bulletin of
Entomological Research. 2008; 98(4):333–41. https://doi.org/10.1017/S0007485307005585
WOS:000259233700002. PMID: 18257956
42. Cocuzza G, Cavalieri V, Barbagallos S. Preliminary results in the taxonomy of the cryptic group Aphis
frangulae/gossypii obtained from mitochondrial DNA sequences. Bulletin of Insectology. 2008; 61
(1):125–6.
43. Kim H, Hoelmer KA, Lee W, Kwon YD, Lee S. Molecular and morphological identification of the soybean
aphid and other Aphis species on the primary host Rhamnus davurica in Asia. Annals of the Entomolog-
ical Society of America. 2010; 103(4):532–43. https://doi.org/10.1603/An09166 ISI:000279548300008.
44. Kim H, Lee S, Jang Y. Macroevolutionary patterns in the Aphidini aphids (Hemiptera: Aphididae): diver-
sification, host association, and biogeographic origins. PLoS One. 2011; 6(9):e24749. https://doi.org/
10.1371/journal.pone.0024749 PMID: 21935453; PubMed Central PMCID: PMC3174202.
45. Richardson JE, Chatrou LW, Mols JB, Erkens RHJ, Pirie MD. Historical biogeography of two cosmopoli-
tan families of flowering plants: Annonaceae and Rhamnaceae. Philos T R Soc B. 2004; 359
(1450):1495–508. https://doi.org/10.1098/rstb.2004.1537 ISI:000224918700005. PMID: 15519968
46. Lee Y, Lee W, Lee S, Kim H. A cryptic species of Aphis gossypii (Hemiptera: Aphididae) complex
revealed by genetic divergence and different host plant association. Bulletin of Entomological Research.
2015; 105(1):40–51. Epub 11/21. https://doi.org/10.1017/S0007485314000704 PMID: 25413997
47. Carletto J, Blin A, Vanlerberghe-Masutti F. DNA-based discrimination between the sibling species
Aphis gossypii Glover and Aphis frangulae Kaltenbach. Systematic Entomology. 2009; 34(2):307–14.
ISI:000264374300008.
48. Foottit RG, Maw HEL, Havill NP, Ahern RG, Montgomery ME. DNA barcodes to identify species and
explore diversity in the Adelgidae (Insecta: Hemiptera: Aphidoidea). Molecular Ecology Resources.
2009; 9:188–95. ISI:000265227700019. https://doi.org/10.1111/j.1755-0998.2009.02644.x PMID:
21564978
49. Hebert PDN, Cywinska A, Ball SL, DeWaard JR. Biological identifications through DNA barcodes. Pro-
ceedings of the Royal Society B-Biological Sciences. 2003; 270(1512):313–21. https://doi.org/10.1098/
rspb.2002.2218 WOS:000181064200013. PMID: 12614582
50. Lee W, Kim H, Lim J, Choi HR, Kim Y, Kim YS, et al. Barcoding aphids (Hemiptera: Aphididae) of the
Korean Peninsula: updating the global data set. Mol Ecol Resour. 2011; 11(1):32–7. https://doi.org/10.
1111/j.1755-0998.2010.02877.x PMID: 21429098.
51. Katoh K, Rozewicki J, Yamada KD. MAFFT online service: multiple sequence alignment, interactive
sequence choice and visualization. Briefings in Bioinformatics. 2017; 20(4):1160–6. https://doi.org/10.
1093/bib/bbx108 PMID: 28968734
52. Rozas J, Ferrer-Mata A, Sanchez-DelBarrio JC, Guirao-Rico S, Librado P, Ramos-Onsins SE, et al.
DnaSP 6: DNA Sequence Polymorphism Analysis of Large Data Sets. Molecular Biology and Evolution.
2017; 34(12):3299–302. https://doi.org/10.1093/molbev/msx248 PMID: 29029172
53. Bandelt H-J, Forster P, Rohl A. Median-joining networks for inferring intraspecific phylogenies. Molecu-
lar biology and evolution. 1999; 16:37–48. https://doi.org/10.1093/oxfordjournals.molbev.a026036
PMID: 10331250
54. Bandelt HJ, Forster P, Rohl A. Median-joining networks for inferring intraspecific phylogenies. Molecular
Biology and Evolution. 1999; 16(1):37–48. https://doi.org/10.1093/oxfordjournals.molbev.a026036
PMID: 10331250
55. Andree K, Axtner J, Bagley MJ, Barlow EJ, Beebee TJC, Bennetzen JL, et al. Permanent Genetic
Resources added to Molecular Ecology Resources Database 1 April 2010–31 May 2010. Molecular
PLOS ONE Complex evolution in Aphis gossypii group
PLOS ONE | https://doi.org/10.1371/journal.pone.0245604 February 4, 2021 25 / 28
Ecology Resources. 2010; 10(6):1098–105. https://doi.org/10.1111/j.1755-0998.2010.02898.x
ISI:000282876300023. PMID: 21565124
56. Vanlerberghe-Masutti F, Chavigny P, Fuller SJ. Characterization of microsatellite loci in the aphid spe-
cies Aphis gossypii Glover. 1999.
57. Wilson ACC, Massonnet B, Simon JC, Prunier-Leterme N, Dolatti L, Llewellyn KS, et al. Cross-species
amplification of microsatellite loci in aphids: assessment and application. Molecular Ecology Notes.
2004; 4(1):104–9. https://doi.org/10.1046/j.1471-8286.2003.00584.x. WOS:000189159500032.
58. Michel AP, Zhang W, Jung JK, Kang ST, Mian MAR. Cross-Species Amplification and Polymorphism of
Microsatellite Loci in the Soybean Aphid, Aphis glycines. J Econ Entomol. 2009; 102(3):1389–92.
ISI:000266641700068. https://doi.org/10.1603/029.102.0368 PMID: 19610462
59. Peakall R, Smouse PE. GenAlEx 6.5: genetic analysis in Excel. Population genetic software for teach-
ing and research—an update. Bioinformatics. 2012; 28(19):2537–9. https://doi.org/10.1093/
bioinformatics/bts460 PMID: 22820204; PubMed Central PMCID: PMC3463245.
60. Goudet J. FSTAT, A Program to Estimate and Test Gene Diversities and Fixation Indices (version
2.9.3.2). Institute of Ecology, University of Lausanne, Switzerland. Available from http://www.unil.ch/
izea/softwares/fstat.html. 2002.
61. Raymond M, Rousset F. Genepop (version-1.2)—population genetics software for exact tests and ecu-
menicism. J Hered. 1995; 86(3):248–9. ISI:A1995RB30200017.
62. Rice WR. Analyzing tables of statistical tests. Evolution. 1989; 43(1):223–5. https://doi.org/10.1111/j.
1558-5646.1989.tb04220.x WOS:A1989R828900018. PMID: 28568501
63. Sunnucks P, DeBarro PJ, Lushai G, Maclean N, Hales D. Genetic structure of an aphid studied using
microsatellites: Cyclic parthenogenesis, differentiated lineages and host specialization. Molecular Ecol-
ogy. 1997; 6(11):1059–73. https://doi.org/10.1046/j.1365-294x.1997.00280.x WOS:
A1997YJ88300006. PMID: 9394464
64. Cv Oosterhout, Hutchinson WF, Wills DPM, Shipley P. micro-checker: software for identifying and cor-
recting genotyping errors in microsatellite data. Molecular Ecology Notes. 2004; 4(3):535–8.
65. Brookfield JFY. A simple new method for estimating null allele frequency from heterozygote deficiency.
Molecular Ecology. 1996; 5(3):453–5. https://doi.org/10.1111/j.1365-294x.1996.tb00336.x PMID:
8688964
66. Excoffier L, Lischer HE. Arlequin suite ver 3.5: a new series of programs to perform population genetics
analyses under Linux and Windows. Mol Ecol Resour. 2010; 10(3):564–7. https://doi.org/10.1111/j.
1755-0998.2010.02847.x PMID: 21565059.
67. Weir BS, Cockerham CC. Estimating F-statistics for the analysis of population structure. Evolution.
1984; 38(6):1358–70. https://doi.org/10.1111/j.1558-5646.1984.tb05657.x WOS:A1984TY40400017.
PMID: 28563791
68. Excoffier L, Laval G, Schneider S. Arlequin (version 3.0): An integrated software package for population
genetics data analysis. Evol Bioinform. 2005; 1:47–50. ISI:000207065900004.
69. Excoffier L, Smouse PE, Quattro JM. Analysis of molecular variance inferred from metric distances
among DNA haplotypes—application to human mitochondrial DNA restriction data. Genetics. 1992;
131(2):479–91. WOS:A1992HW75900021. PMID: 1644282
70. Pritchard JK, Stephens M, Donnelly P. Inference of population structure using multilocus genotype
data. Genetics. 2000; 155(2):945–59. WOS:000087475100039. PMID: 10835412
71. Evanno G, Regnaut S, Goudet J. Detecting the number of clusters of individuals using the software
STRUCTURE: A simulation study. Mol Ecol. 2005; 14(8):2611–20. https://doi.org/10.1111/j.1365-
294X.2005.02553.x WOS:000229961500029. PMID: 15969739
72. Rosenberg NA. distruct: a program for the graphical display of population structure. Molecular Ecology
Notes. 2004; 4(1):137–8. https://doi.org/10.1046/j.1471-8286.2003.00566.x
73. Piry S, Alapetite A, Cornuet JM, Paetkau D, Baudouin L, Estoup A. GENECLASS2: A software for
genetic assignment and first-generation migrant detection. J Hered. 2004; 95(6):536–9. https://doi.org/
10.1093/jhered/esh074 ISI:000224482500012. PMID: 15475402
74. Rannala B, Mountain JL. Detecting immigration by using multilocus genotypes. Proceedings of the
National Academy of Sciences of the United States of America. 1997; 94(17):9197–201. https://doi.org/
10.1073/pnas.94.17.9197 WOS:A1997XR76500053. PMID: 9256459
75. Cornuet JM, Santos F, Beaumont MA, Robert CP, Marin JM, Balding DJ, et al. Inferring population his-
tory with DIY ABC: a user-friendly approach to approximate Bayesian computation. Bioinformatics.
2008; 24(23):2713–9. https://doi.org/10.1093/bioinformatics/btn514 WOS:000261168600008. PMID:
18842597
PLOS ONE Complex evolution in Aphis gossypii group
PLOS ONE | https://doi.org/10.1371/journal.pone.0245604 February 4, 2021 26 / 28
76. Estoup A, Guillemaud T. Reconstructing routes of invasion using genetic data: why, how and so what?
Mol Ecol. 2010; 19(19):4113–30. https://doi.org/10.1111/j.1365-294X.2010.04773.x
WOS:000282180500005. PMID: 20723048
77. Cornuet JM, Ravigne V, Estoup A. Inference on population history and model checking using DNA
sequence and microsatellite data with the software DIYABC (v1.0). Bmc Bioinformatics. 2010; 11.
https://doi.org/10.1186/1471-2105-11-401 WOS:000281442400001. PMID: 20667077
78. Portnoy DS, Hollenbeck CM, Belcher CN, Driggers Iii WB, Frazier BS, Gelsleichter J, et al. Contempo-
rary population structure and post-glacial genetic demography in a migratory marine species, the black-
nose shark, Carcharhinus acronotus. Molecular Ecology. 2014; 23(22):5480–95. https://doi.org/10.
1111/mec.12954 PMID: 25294029
79. Cabrera AA, Palsbøll PJ. Inferring past demographic changes from contemporary genetic data: A simu-
lation-based evaluation of the ABC methods implemented in diyabc. Molecular Ecology Resources.
2017; 17(6):e94–e110. https://doi.org/10.1111/1755-0998.12696 PMID: 28654208
80. Techer MA, Clemencet J, Turpin P, Volbert N, Reynaud B, Delatte H. Genetic characterization of the
honeybee (Apis mellifera) population of Rodrigues Island, based on microsatellite and mitochondrial
DNA. Apidologie. 2015; 46(4):445–54. https://doi.org/10.1007/s13592-014-0335-9
81. Delmotte F, Sabater-Munoz B, Prunier-Leterme N, Latorre A, Sunnucks P, Rispe C, et al. Phylogenetic
evidence for hybrid origins of asexual lineages in an aphid species. Evolution. 2003; 57(6):1291–303.
https://doi.org/10.1111/j.0014-3820.2003.tb00337.x WOS:000183997400007. PMID: 12894937
82. Simon JC, Baumann S, Sunnucks P, Hebert PDN, Pierre JS, Le Gallic JF, et al. Reproductive mode
and population genetic structure of the cereal aphid Sitobion avenae studied using phenotypic and
microsatellite markers. Molecular Ecology. 1999; 8(4):531–45. https://doi.org/10.1046/j.1365-294x.
1999.00583.x WOS:000080177700003. PMID: 10327655
83. Delmotte F, Leterme N, Gauthier JP, Rispe C, Simon JC. Genetic architecture of sexual and asexual
populations of the aphid Rhopalosiphum padi based on allozyme and microsatellite markers. Molecular
Ecology. 2002; 11(4):711–23. https://doi.org/10.1046/j.1365-294x.2002.01478.x
WOS:000175250300007. PMID: 11972759
84. Wilson ACC, Sunnucks P, Blackman RL, Hales DF. Microsatellite variation in cyclically parthenogenetic
populations of Myzus persicae in south-eastern Australia. Heredity. 2002; 88(4):258–66. https://doi.org/
10.1038/sj.hdy.6800037 PMID: 11920132
85. Reichel K, Masson J-P, Malrieu F, Arnaud-Haond S, Stoeckel S. Rare sex or out of reach equilibrium?
The dynamics of FIS in partially clonal organisms. BMC Genet. 2016; 17(1):76–. https://doi.org/10.1186/
s12863-016-0388-z PMID: 27286682.
86. Guldemond JA. Host Plant Relationships and Life-Cycles of the Aphid Genus Cryptomyzus. Entomolo-
gia Experimentalis Et Applicata. 1991; 58(1):21–30. WOS:A1991EZ54000003.
87. Lozier JD, Roderick GK, Mills NJ. Genetic evidence from mitochondrial, nuclear, and endosymbiont
markers for the evolution of host plant associated species in the aphid genus Hyalopterus (Hemiptera:
Aphididae). Evolution. 2007; 61(6):1353–67. https://doi.org/10.1111/j.1558-5646.2007.00110.x
WOS:000247125100009. PMID: 17542845
88. Margaritopoulos JT, Tsitsipis JA, Goudoudaki S, Blackman RL. Life cycle variation of Myzus persicae
(Hemiptera: Aphididae) in Greece. Bulletin of Entomological Research. 2002; 92(4):309–19. Epub
2002/08/23. https://doi.org/10.1079/BER2002167 PMID: 12191439
89. Jousselin E, Genson G, Coeur d’Acier A. Evolutionary lability of a complex life cycle in the aphid genus
Brachycaudus. BMC evolutionary biology. 2010; 10(1):295. https://doi.org/10.1186/1471-2148-10-295
PMID: 20920188; PubMed Central PMCID: PMC2958166.
90. Ward SA, Leather SR, Pickup J, Harrington R. Mortality during dispersal and the cost of host-specificity
in parasites:how many aphids find hosts? Journal of Animal Ecology. 1998; 67:763–73.
91. Coeur d’Acier A, Jousselin E, Martin JF, Rasplus JY. Phylogeny of the genus Aphis Linnaeus, 1758
(Homoptera: Aphididae) inferred from mitochondrial DNA sequences. Molecular Phylogenetics and
Evolution. 2007; 42(3):598–611. https://doi.org/10.1016/j.ympev.2006.10.006
WOS:000245717300003. PMID: 17113793
92. Mackenzie A. A trade-off for host plant utilization in the black bean aphid, Aphis fabae. Evolution. 1996;
50(1):155–62. https://doi.org/10.1111/j.1558-5646.1996.tb04482.x WOS:A1996TX89100016. PMID:
28568870
93. Lagos-Kutz DM, Favret C, Giordano R, Voegtlin D. Molecular and morphological differentiation between
Aphis gossypii Glover (Hemiptera, Aphididae) and related species, with particular reference to the
North American Midwest. ZooKeys. 2014; 459:49–72.
94. Taylor SA, Larson EL. Insights from genomes into the evolutionary importance and prevalence of
hybridization in nature. Nature Ecology & Evolution. 2019; 3(2):170–7. https://doi.org/10.1038/s41559-
018-0777-y PMID: 30697003
PLOS ONE Complex evolution in Aphis gossypii group
PLOS ONE | https://doi.org/10.1371/journal.pone.0245604 February 4, 2021 27 / 28

95. Dixon AFG. Aphid Ecology–An optimization approach. Norwell: Kluwer Academic Pub; 1998.
96. Powell G, Tosh CR, Hardie J. Host plant selection by aphids: behavioral, evolutionary, and applied per-
spectives. Annu Rev Entomol. 2006; 51:309–30. https://doi.org/10.1146/annurev.ento.51.110104.
151107 PMID: 16332214.
PLOS ONE Complex evolution in Aphis gossypii group
PLOS ONE | https://doi.org/10.1371/journal.pone.0245604 February 4, 2021 28 / 28