complex coacervated microcapsules in cream for topical delivery of
TRANSCRIPT

COMPLEX COACERVATED MICROCAPSULES IN CREAM FOR TOPICAL DELIVERY OF THE
CURCUMINOIDS AND QUERCETIN
ANG LEE FUNG
UNIVERSITI SAINS MALAYSIA
2015

COMPLEX COACERVATED MICROCAPSULES IN CREAM FOR TOPICAL DELIVERY OF THE CURCUMINOIDS AND QUERCETIN
by
ANG LEE FUNG
Thesis submitted in fulfillment of the requirements for the degree of Doctor of Philosophy
December 2015
ii
ACKNOWLEDGEMENTS
Studying for this PhD degree was made possible by commitment from
individuals, organizations and institutions. It is vital that I acknowledge their
assistance, contribution and commitment.
This thesis owes its existence to the help, support, and inspiration of many
people. In the first place, I would like to express my sincere appreciation and
gratitude to my supervisor, Associate Prof. Dr. Yusrida Darwis for her unlimited
support and encouragement during the past five years of my research. She has
provided an optimum working environment at the Department of Pharmaceutical
Technology, School of Pharmaceutical Sciences, Universiti Sains Malaysia. Her
perpetual energy and enthusiasm in research had motivated all her advisees,
including me. In addition, she was always accessible and willing to help her students
with their research. As a result, research life became smooth and rewarding for me.
Her uncompromising quest for excellence significantly shapes everyone at the
department.
I wish to express my sincere appreciation and gratitude to my co-supervisor,
Associate Prof. Dr. Yvonne Tan Tze Fung for her guidance, help and patience.
I am also indebted to Dr Koh Rhun Yian, who has not only been a source of
enthusiasm and encouragement, but has also agreed, with her exceptional insights
into cell culture, to serve and enrich my knowledge in the in vitro part of my
research.

iii
All my lab buddies at the Pharmaceutical Technology Department made it a
convivial place to work. In particular, I would like to thank Ms. Nor Atiqah, Mr.
Arshad, Ms. Nor Azah, Mr. Jahanzeb, Ms. Reem, Mr. Ibrahim Ms. Madeeha and Ms.
Thiruchelvi.
Collective and individual acknowledgments are also owed to all the technical
and non-technical staff of the School of Pharmaceutical Sciences, Universiti Sains
Malaysia. Many thanks go in particular to Mr. Samsuddin, Mr. Roseli Hassan, Mr.
Basri Jaafar, Mr. Ibrahim, Ms. Salida, Mr. Amiruddin and Mr. Azrollyzam.
I have greatly appreciated the generous financial support from The Ministry of
Science and Technology Malaysia (MOSTI) who provided the National Science
Fellowship (NSF) for my study.
My deepest gratitude goes to my family for their unflagging love and support
throughout my life; this dissertation is simply impossible without them. I want to
thank my late father, Mr. Ang Ah Hua, for his care and love. I cannot ask for more
from my mother, Mrs. Teng Boay Kee, as she is simply perfect. I have no suitable
word that can fully describe her everlasting love to me. I am also grateful to my
partner, Dr. M. F. Yam who was always my support in the moments when where was
no one to answer my queries.
Ang Lee Fung

iv
TABLES OF CONTENTS
Acknowledgement ii
Table of Contents iv
List of Tables xiii
List of Figures xvii
List of Plates xxiv
List of Abbreviations xxvii
List of Appendices xxix
Abstrak xxx
Abstract xxxii
CHAPTER 1 - INTRODUCTION
1.1 Active ingredients 1
1.1.1 Curcuminoids/curcumin 1
1.1.2 Quercetin 4
1.2 Microencapsulation 6
1.2.1 Introduction of microencapsulation 6
1.2.2 Core material 9
1.2.3 Coating material 9
1.2.3 (a) Gelatin 10
1.2.3 (b) Chitosan 14
1.2.4 Crosslinking agent 16
1.2.4 (a) Formaldehyde crosslinking mechanism 17
1.2.5 Classification of microcapsules and microspheres 19
1.2.6 Coacervation microencapsulation 20
1.2.6 (a) Complex coacervation systems 20
1.2.6 (b) Complex coacervation microencapsulation process
21
1.2.7 Release mechanism of microcapsules 25
1.2.8 Advantages of microencapsulation 27
1.2.9 Application of microcapsules to end product 28
1.2.10 Microcapsule controlled drug delivery system 29
v
1.3 Topical drug delivery 29
1.3.1 Cream and emulsion 30
1.3.1 (a) Surfactant and the HLB system 31
1.3.1 (b) Characterization of cream 34
1.3.1 (c) Stability of cream 37
1.4 Wound healing 40
1.4.1 Wound and wound types 40
1.4.2 Degree of wound 41
1.4.3 Degree of burn wound 42
1.4.4 Mechanisms of wound healing 42
1.5 Statement of the problem 44
1.6 Objectives 44
CHAPTER 2 - HPLC METHOD DEVELOPMENT AND VALIDATION FOR SIMULTANEOUS DETERMINATION OF QUERCETIN AND CURCUMINOIDS
2.1 Introduction 46
2.2 Materials and methods 49
2.2.1 Materials 49
2.2.2 Methods 50
2.2.2.1 HPLC instrumentation 50
2.2.2.2 Chromatographic conditions 50
2.2.2.3 Preparation of standard and quality control solutions 50
2.2.2.4 Limit of detection, limit of quantitation and limit of linearity
51
2.2.2.5 Construction of calibration curves 51
2.2.2.6 Validation 52
2.2.2.6 (a) Specificity 52
2.2.2.6 (b) Precision and accuracy 52
2.2.2.6 (c) Robustness 53
2.2.2.7 System suitability testing 53
2.3 Results 54
2.3.1 Limit of detection, limit of quantitation and limit of linearity
54
vi
2.3.2 Calibration curve 55
2.3.3 Specificity 59
2.3.4 Precision and accuracy 60
2.3.5 Robustness 61
2.3.6 System suitability testing 68
2.4 Discussion 69
2.5 Conclusion 71
CHAPTER 3 - PREPARATION AND OPTIMIZATION OF PROCESS VARIABLES OF TYPE B GELATIN /CHITOSAN COMPLEX COACERVATION
3.1 Introduction 72
3.2 Materials and methods 73
3.2.1 Materials 73
3.2.2 Methods 74
3.2.2.1 Electrophoretic studies 74
3.2.2.2 Standard procedure for gelatin-chitosan complex coacervation
74
3.2.2.3 Observation of coacervate morphology 74
3.2.2.4 Degree of coacervation 75
3.2.2.5 Optimization of complex coacervation variables 75
3.2.2.5 (a) pH of coacervation 75
3.2.2.5 (b) Total polymer concentration and polymer mixing ratio
76
3.2.2.5 (c) Coacervation temperature 76
3.2.2.5 (d) Coacervation duration 77
3.2.2.5 (e) Incubation time 77
3.2.2.6 Coacervate droplet size 77
3.3 Results 78
3.3.1 Electrophoretic studies 78
3.3.2 pH of coacervation 79
3.3.3 Total polymer concentration and polymer mixing ratio 83
3.3.4 Coacervation temperature 91
3.3.5 Coacervation duration 92

vii
3.3.6 Incubation time 94
3.4 Discussion 96
3.5 Conclusion 102
CHAPTER 4 - PREPARATION AND CHARACTERIZATION OF THE CURCUMINOIDS AND QUERCETIN MICROCAPSULES BY GELATIN B-CHITOSAN COMPLEX COACERVATION
4.1 Introduction 104
4.2 Materials and methods 106
4.2.1 Materials 106
4.2.2 Methods 106
4.2.2.1 Solubility of curcuminoids and quercetin in various mediums
106
4.2.2.2 Quantitation of curcuminoids and quercetin content in microcapsules
107
4.2.2.3 Complex coacervation microencapsulation and optimization – Investigation of curcuminoids and quercetin solid core microencapsulation
108
4.2.2.4 Curcuminoids/quercetin liquid core microencapsulation 110
4.2.2.5 Determination of microencapsulation efficiency 111
4.2.2.6 Physical characterization of microcapsules 112
4.2.2.6 (a) Microcapsule particle size 112
4.2.2.6 (b) Microcapsule wall thickness 112
4.2.2.6 (c) Morphology observation by optical microscope 112
4.2.2.6 (d) Morphology observation by SEM 112
4.2.2.6 (e) Colorimetric evaluation 113
4.2.2.6 (f) Appearance and staining testing 113
4.2.2.6 (g) Hygroscopicity 113
4.2.2.7 Physicochemical characterization 114
4.2.2.7 (a) Differential scanning calorimetry (DSC) 114
4.2.2.7 (b) Fourier transform infrared spectroscopy 114
4.2.2.8 Light stability 115
4.2.2.9 Storage stability 115
4.2.2.10 Swelling studies 116
4.2.2.11 Permeation study by using Franz diffusion cell 117
viii
4.2.2.12 Drug release kinetics study 119
4.2.2.13 Determination of residual formaldehyde by gas chromatography
120
4.2.2.13 (a) Chemicals and reagents 120
4.2.2.13 (b) Instruments 121
4.2.2.14 Statistical analysis 121
4.3 Results 122
4.3.1 Solubility of curcuminoids and quercetin in various mediums
122
4.3.2 Quantitation of curcuminoids and quercetin content in microcapsules
122
4.3.3 Complex coacervation microencapsulation and optimization –Investigation of curcuminoids and quercetin solid core microcapsules
125
4.3.3 (a) Influence of pH changing rate on microcapsule particle size and size distribution
125
4.3.3 (b) Effect of drug concentration 127
4.3.3 (c) Effect of microencapsulation equilibrium time 128
4.3.3 (d) Effect of Tween 80 concentration 129
4.3.3 (e) Effect of formaldehyde crosslinking 130
4.3.3 (f) Effect of agitation rate 131
4.3.3 (g) Effect of manner of agitation 134
4.3.4 Curcuminoids/quercetin liquid core microencapsulation 136
4.3.5 Physical characterization of microcapsules 136
4.3.5 (a) Morphology, wall thickness and particle size 136
4.3.5 (b) Morphology observation by SEM 141
4.3.5 (c) Colorimetric evaluation 143
4.3.5 (d) Appearance and staining testing 144
4.3.5 (e) Hygroscopicity 147
4.3.6 Physicochemical characterization of microcapsules 147
4.3.6 (a) Differential scanning calorimetry (DSC) 147
4.3.6 (b) Fourier transform infrared spectroscopy 152
4.3.7 Light stability 161
4.3.8 Storage stability 163
4.3.9 Swelling studies 168
4.3.10 Permeation studies by Franz diffusion cell 169

ix
4.3.11 Drug release kinetics study 170
4.3.12 Determination of residual formaldehyde by gas chromatography
173
4.4 Discussion 174
4.5 Conclusion 185
CHAPTER 5 - FORMULATION AND CHARACTERIZATION OF MICROCAPSULE INCORPORATED CREAMS FOR TOPICAL APPLICATION
5.1 Introduction 186
5.2 Materials and methods 190
5.2.1 Materials 190
5.2.2 Methods 191
5.2.2.1 Construction of ternary phase diagram 191
5.2.2.1 (a) Fabrication of area of interest 191
5.2.2.1 (b) Fabrication of pseudo-ternary phase diagram and domain
192
5.2.2.2 Mixture design 192
5.2.2.3 Preparation of O/W creams and optimization of mixing methods
194
5.2.2.4 Cream characterization 195
5.2.2.4 (a) Organoleptic properties 195
5.2.2.4 (b) Cream type examination 195
5.2.2.4 (c) Microscopy observation 195
5.2.2.4 (d) Cream pH 196
5.2.2.4 (e) Zeta potential 196
5.2.2.4 (f) Particle size 196
5.2.2.4 (g) Rheological properties 197
5.2.2.4 (h) Texture analysis 198
5.2.2.5 Drug content 199
5.2.2.6 In vitro drug diffusion studies 199
5.2.2.7 Drug release kinetics studies 200
5.2.2.8 Stress testing 201
5.2.2.8 (a) Centrifugation test 201
5.2.2.8 (b) Freeze-thaw cycles test 201
x
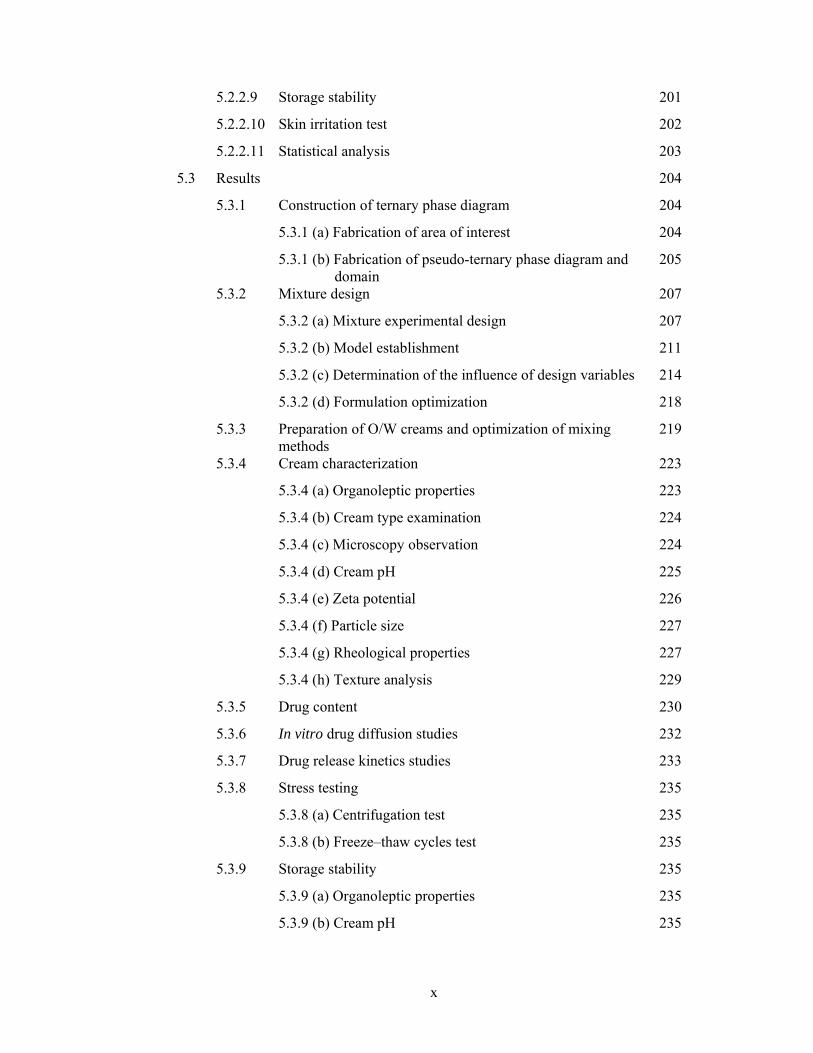
5.2.2.9 Storage stability 201
5.2.2.10 Skin irritation test 202
5.2.2.11 Statistical analysis 203
5.3 Results 204
5.3.1 Construction of ternary phase diagram 204
5.3.1 (a) Fabrication of area of interest 204
5.3.1 (b) Fabrication of pseudo-ternary phase diagram and domain
205
5.3.2 Mixture design 207
5.3.2 (a) Mixture experimental design 207
5.3.2 (b) Model establishment 211
5.3.2 (c) Determination of the influence of design variables 214
5.3.2 (d) Formulation optimization 218
5.3.3 Preparation of O/W creams and optimization of mixing methods
219
5.3.4 Cream characterization 223
5.3.4 (a) Organoleptic properties 223
5.3.4 (b) Cream type examination 224
5.3.4 (c) Microscopy observation 224
5.3.4 (d) Cream pH 225
5.3.4 (e) Zeta potential 226
5.3.4 (f) Particle size 227
5.3.4 (g) Rheological properties 227
5.3.4 (h) Texture analysis 229
5.3.5 Drug content 230
5.3.6 In vitro drug diffusion studies 232
5.3.7 Drug release kinetics studies 233
5.3.8 Stress testing 235
5.3.8 (a) Centrifugation test 235
5.3.8 (b) Freeze–thaw cycles test 235
5.3.9 Storage stability 235
5.3.9 (a) Organoleptic properties 235
5.3.9 (b) Cream pH 235

xi
5.3.9 (c) Zeta potential 237
5.3.9 (d) Particle size 238
5.3.9 (e) Rheological properties 241
5.3.9 (f) Texture analysis 242
5.3.9 (g) Drug content 243
5.3.10 Skin irritation test 248
5.4 Discussion 255
5.5 Conclusion 265
CHAPTER 6 - ANTIOXIDANT, ANTIBACTERIAL AND WOUND HEALING PROPERTIES OF CURCUMINOIDS AND QUERCETIN IN NATIVE AND MICROCAPSULE FORMS
6.1 Introduction 266
6.2 Materials and methods 268
6.2.1 Materials 268
6.2.2 Methods 269
6.2.2.1 Antioxidant activity 269
6.2.2.1 (a) Trolox equivalent antioxidant capacity (TEAC) 269
6.2.2.1 (b) Assessment of DPPH scavenging activity 270
6.2.2.2 Minimum inhibitory concentration 271
6.2.2.3 Effect of curcuminoids/quercetin and its encapsulated form on HaCaT cell
272
6.2.2.3 (a) Cell culture and treatments 272
6.2.2.3 (b) Cell cytotoxicity/viability determination by 3-(4,5-dimethylthiazol-2-yl)-2,5 diphenyltetrazolium bromide (MTT) assay
273
6.2.2.3 (c) Cell proliferation determination by 3-(4,5-dimethylthiazol-2-yl)-2,5 diphenyltetrazolium bromide (MTT) assay
273
6.2.2.3 (d) Cell migration determination by wound scratch assay
274
6.2.2.4 Effect of curcuminoids and quercetin microcapsule incorporated creams as controlled drug delivery on wound healing
274
6.2.2.4 (a) Animal models 275
6.2.2.4 (b) Burn wound 275
6.2.2.4 (c) Treatment 276
xii
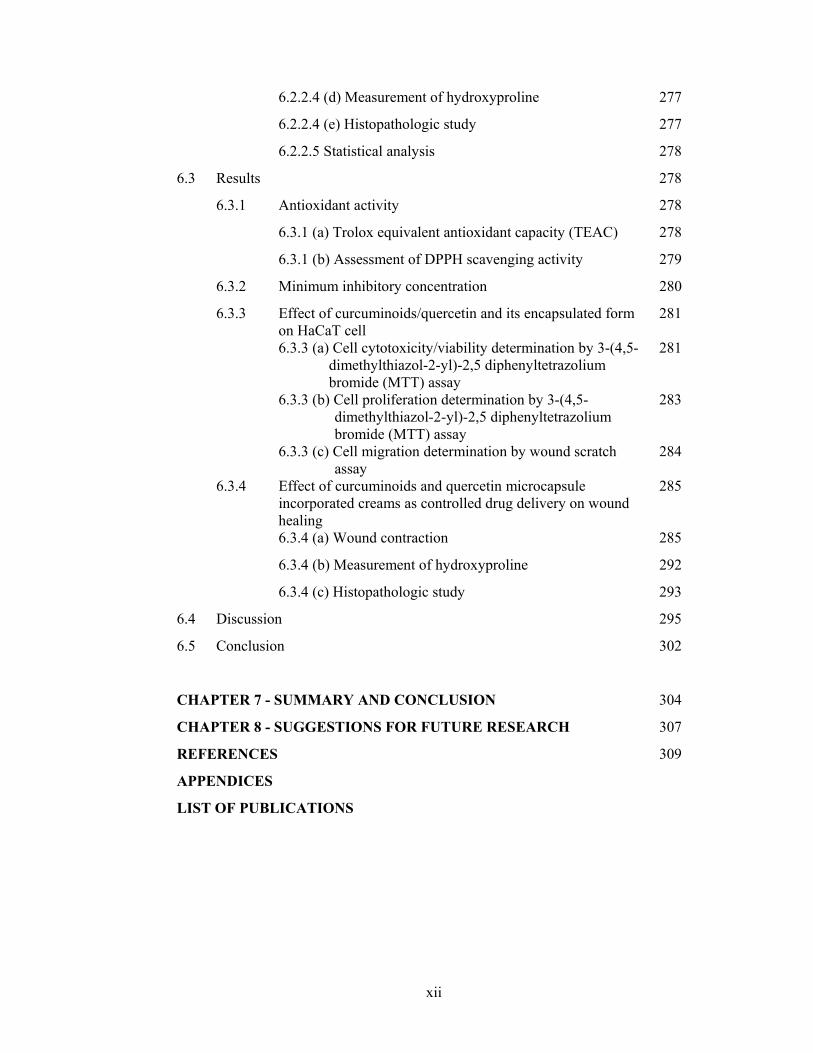
6.2.2.4 (d) Measurement of hydroxyproline 277
6.2.2.4 (e) Histopathologic study 277
6.2.2.5 Statistical analysis 278
6.3 Results 278
6.3.1 Antioxidant activity 278
6.3.1 (a) Trolox equivalent antioxidant capacity (TEAC) 278
6.3.1 (b) Assessment of DPPH scavenging activity 279
6.3.2 Minimum inhibitory concentration 280
6.3.3 Effect of curcuminoids/quercetin and its encapsulated form on HaCaT cell
281
6.3.3 (a) Cell cytotoxicity/viability determination by 3-(4,5-dimethylthiazol-2-yl)-2,5 diphenyltetrazolium bromide (MTT) assay
281
6.3.3 (b) Cell proliferation determination by 3-(4,5-dimethylthiazol-2-yl)-2,5 diphenyltetrazolium bromide (MTT) assay
283
6.3.3 (c) Cell migration determination by wound scratch assay
284
6.3.4 Effect of curcuminoids and quercetin microcapsule incorporated creams as controlled drug delivery on wound healing
285
6.3.4 (a) Wound contraction 285
6.3.4 (b) Measurement of hydroxyproline 292
6.3.4 (c) Histopathologic study 293
6.4 Discussion 295
6.5 Conclusion 302
CHAPTER 7 - SUMMARY AND CONCLUSION 304
CHAPTER 8 - SUGGESTIONS FOR FUTURE RESEARCH 307
REFERENCES 309
APPENDICES
LIST OF PUBLICATIONS

xiii
LIST OF TABLES
Page
Table 1.1 A summary of surfactant HLB ranges and their applications
32
Table 1.2 Required hydrophilic-lipophilic balance (rHLB) for some oil-phase ingredients for oil-in-water (O/W) and water-in-oil (W/O) emulsions
34
Table 2.1 LOD, LOQ, LOL and linear regression analysis parameters for quercetin (QUE) and curcuminoids (BDMC, DMC and CUR)
54
Table 2.2 Retention times and responses data for calibration standards of quercetin (QUE) and curcuminoids (BDMC, DMC and CUR)
56
Table 2.3 Precision and accuracy for intraday and interday repetitions for the quantitative detection of quercetin (QUE) and curcuminoids (BDMC, DMC and CUR)
61
Table 2.4a Robustness parameters: (a) Change in the organic composition by ± 2.0%
63
Table 2.4b Robustness parameters: (b) Change in the acetic acid concentration by ± 1.0% v/v
64
Table 2.4c Robustness parameters: (c) Change in the flow rate of ± 0.1 ml/min
65
Table 2.4d Robustness parameters: (d) Change in the column temperature of ± 5.0 °C
66
Table 2.5 System suitability parameters, calculation formula and recommendations
68
Table 2.6 System suitability testing
69
Table 3.1 Coarcervate droplet size and size distribution at different total polymer concentrations and different mixing ratios for gelatin-chitosan systems
85
Table 3.2 Effect of reaction temperature on coarcervate droplet size and size distribution of gelatin-chitosan systems at total polymer concentration of 2.55% w/w and mixing ratio of 30:1
92
Table 3.3 Effect of coacervation duration on coarcervate droplet size and size distribution of the gelatin-chitosan systems at total polymer concentration of 2.55% w/w and mixing ratio of
94

xiv
30:1
Table 3.4 Effect of incubation time on coarcervate droplet size and size distribution of gelatin-chitosan systems at total polymer concentration of 2.55% w/w and mixing ratio of 30:1
95
Table 4.1 Solubility of curcumin and quercetin in various mediums
122
Table 4.2 Effect of disruption method on solubility of curcumin from curcuminoids microcapsule
123
Table 4.3 Particle size and size distribution influenced by pH adjustment rate using sodium hydroxide
125
Table 4.4 Effect of drug loaded amount on microencapsulation efficiency
128
Table 4.5 Effect of microencapsulation equilibrium time on microencapsulation efficiency
129
Table 4.6 Effect of Tween 80 concentration on microencapsulation efficiency
130
Table 4.7 Effect of formaldehyde concentration on microencapsulation efficiency
131
Table 4.8 Effect of formaldehyde crosslinking reaction time on microencapsulation efficiency
131
Table 4.9 Effect of agitation rate on microencapsulation efficiency
132
Table 4.10 Effect of agitation rate during microencapsulation on particle size and size distribution
133
Table 4.11 Effect of manner of agitation on microencapsulation efficiency for crosslinked- and uncrosslinked microcapsules
134
Table 4.12 The summary of optimized parameters for curcuminoids and quercetin solid core microencapsulation prepared by gelatin-chitosan complex coacervation (total polymer concentration was 2.55% w/w using gelatin:chitosan ratio of 30:1)
135
Table 4.13 Entrapment efficiency, drug loading and yield for CPM, QPM, CLM and QLM at optimized conditions
136
Table 4.14 Particle size and wall thickness for CPM, QPM, CLM and QLM
138
Table 4.15 Color space values for native drugs and microcapsules 143
xv
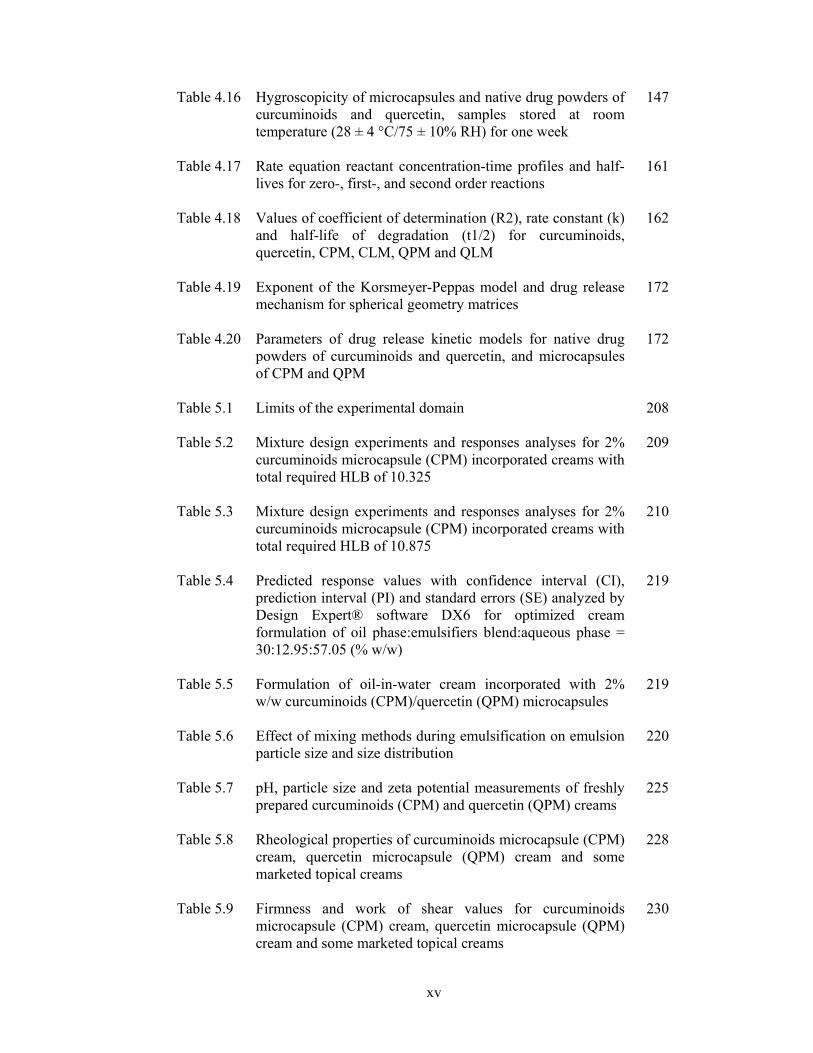
Table 4.16 Hygroscopicity of microcapsules and native drug powders of curcuminoids and quercetin, samples stored at room temperature (28 ± 4 °C/75 ± 10% RH) for one week
147
Table 4.17 Rate equation reactant concentration-time profiles and half-lives for zero-, first-, and second order reactions
161
Table 4.18 Values of coefficient of determination (R2), rate constant (k) and half-life of degradation (t1/2) for curcuminoids, quercetin, CPM, CLM, QPM and QLM
162
Table 4.19 Exponent of the Korsmeyer-Peppas model and drug release mechanism for spherical geometry matrices
172
Table 4.20 Parameters of drug release kinetic models for native drug powders of curcuminoids and quercetin, and microcapsules of CPM and QPM
172
Table 5.1 Limits of the experimental domain
208
Table 5.2 Mixture design experiments and responses analyses for 2% curcuminoids microcapsule (CPM) incorporated creams with total required HLB of 10.325
209
Table 5.3 Mixture design experiments and responses analyses for 2% curcuminoids microcapsule (CPM) incorporated creams with total required HLB of 10.875
210
Table 5.4 Predicted response values with confidence interval (CI), prediction interval (PI) and standard errors (SE) analyzed by Design Expert® software DX6 for optimized cream formulation of oil phase:emulsifiers blend:aqueous phase = 30:12.95:57.05 (% w/w)
219
Table 5.5 Formulation of oil-in-water cream incorporated with 2% w/w curcuminoids (CPM)/quercetin (QPM) microcapsules
219
Table 5.6 Effect of mixing methods during emulsification on emulsion particle size and size distribution
220
Table 5.7 pH, particle size and zeta potential measurements of freshly prepared curcuminoids (CPM) and quercetin (QPM) creams
225
Table 5.8 Rheological properties of curcuminoids microcapsule (CPM) cream, quercetin microcapsule (QPM) cream and some marketed topical creams
228
Table 5.9 Firmness and work of shear values for curcuminoids microcapsule (CPM) cream, quercetin microcapsule (QPM) cream and some marketed topical creams
230
xvi
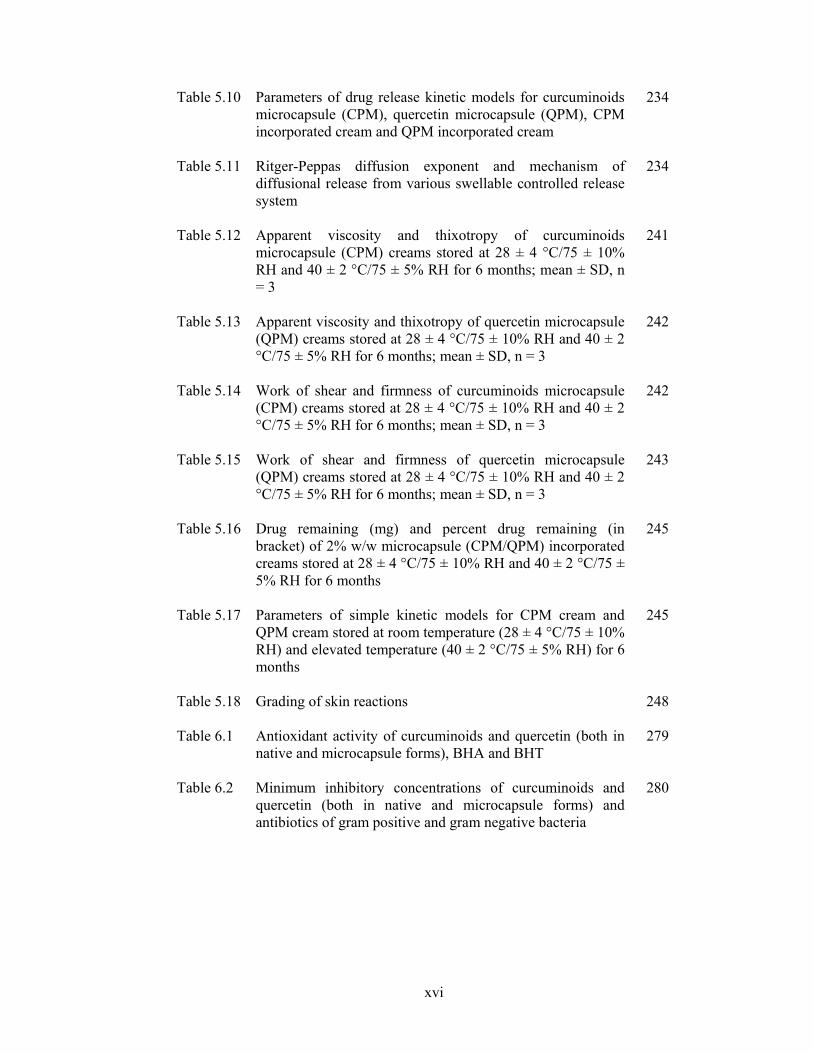
Table 5.10 Parameters of drug release kinetic models for curcuminoids microcapsule (CPM), quercetin microcapsule (QPM), CPM incorporated cream and QPM incorporated cream
234
Table 5.11 Ritger-Peppas diffusion exponent and mechanism of diffusional release from various swellable controlled release system
234
Table 5.12 Apparent viscosity and thixotropy of curcuminoids microcapsule (CPM) creams stored at 28 ± 4 °C/75 ± 10% RH and 40 ± 2 °C/75 ± 5% RH for 6 months; mean ± SD, n = 3
241
Table 5.13 Apparent viscosity and thixotropy of quercetin microcapsule (QPM) creams stored at 28 ± 4 °C/75 ± 10% RH and 40 ± 2 °C/75 ± 5% RH for 6 months; mean ± SD, n = 3
242
Table 5.14 Work of shear and firmness of curcuminoids microcapsule (CPM) creams stored at 28 ± 4 °C/75 ± 10% RH and 40 ± 2 °C/75 ± 5% RH for 6 months; mean ± SD, n = 3
242
Table 5.15 Work of shear and firmness of quercetin microcapsule (QPM) creams stored at 28 ± 4 °C/75 ± 10% RH and 40 ± 2 °C/75 ± 5% RH for 6 months; mean ± SD, n = 3
243
Table 5.16 Drug remaining (mg) and percent drug remaining (in bracket) of 2% w/w microcapsule (CPM/QPM) incorporated creams stored at 28 ± 4 °C/75 ± 10% RH and 40 ± 2 °C/75 ± 5% RH for 6 months
245
Table 5.17 Parameters of simple kinetic models for CPM cream and QPM cream stored at room temperature (28 ± 4 °C/75 ± 10% RH) and elevated temperature (40 ± 2 °C/75 ± 5% RH) for 6 months
245
Table 5.18 Grading of skin reactions
248
Table 6.1 Antioxidant activity of curcuminoids and quercetin (both in native and microcapsule forms), BHA and BHT
279
Table 6.2 Minimum inhibitory concentrations of curcuminoids and quercetin (both in native and microcapsule forms) and antibiotics of gram positive and gram negative bacteria
280

xvii
LIST OF FIGURES
Page
Figure 1.1 Chemical structures of curcumin, demethoxycurcumin and bisdemethoxycurcumin
3
Figure 1.2 Chemical structure of quercetin
5
Figure 1.3 Schematic morphologies of different types of microcapsules: (A) matrix, (B) single structure microcapsule (regular), (C) irregular single structure microcapsule, (D) multiwall microcapsule, (E) multi-core microcapsule and (F) aggregate structure microcapsule
8
Figure 1.4 Chemical structure of gelatin
13
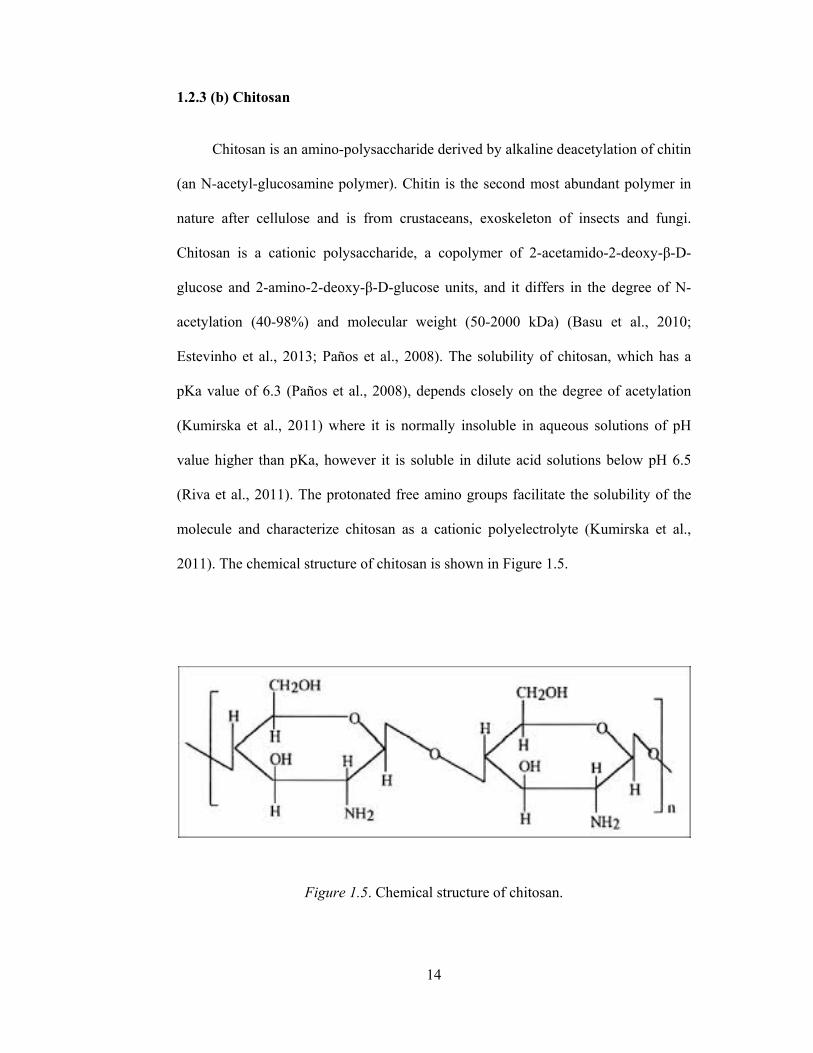
Figure 1.5 Chemical structure of chitosan
14
Figure 1.6 Formation of methylene glycol and formaldehyde polymer
17
Figure 1.7 Formaldehyde crosslinking: formation of methylene glycol and methylene bridge
18
Figure 1.8 Schematic morphologies of (a) microcapsule and (b) microsphere
19
Figure 1.9 Process of microencapsulation by complex coacervation: (a) emulsification or suspension of core ingredients in the vehicle phase (typically aqueous solution); (b) induce complex coacervation by addition of a second complexing hydrocolloid; (c) solidification of wall materials and crosslink to stabilize the microcapsules; and (d) washing and drying
23
Figure 1.10 Schematic representation of microencapsulation by coacervation: (a) dispersed liquid or solid drug particles, (b) induction of phase separation, (c) deposition of microdroplets at the surface, and (d) fusion into a membrane
24
Figure 1.11 Drug release mechanisms from microcapsules: (a) diffusion, (b) dissolution, (c) osmosis, and (d) erosion
27
Figure 1.12 Common breadown processes of emulsions
40
Figure 2.1 Chemical structures of quercetin, bisdemethoxycurcumin, demethoxycurcumin and curcumin
47
Figure 2.2 Quercetin calibration curve
57

xviii
Figure 2.3 Bisdemethoxycurcumin calibration curve
57
Figure 2.4 Demethoxycurcumin calibration curve
58
Figure 2.5 Curcumin calibration curve
58
Figure 2.6 Chromatogram of QUE, quercetin; BDMC, bisdemethoxycurcumin; DMC, demethoxycurcumin; and CUR, curcumin
59
Figure 2.7 Chromatograms of (a) methanol, (b) ethanol, (c) mobile phase, (d) citrate-phosphate buffer pH 5.4, (e) cream base and (f) gelatin-chitosan coacervate microcapsule
60
Figure 2.8 Combined chromatograms of quercetin (QUE), bisdemethoxycurcumin (BDMC), demethoxycurcumin (DMC) and curcumin (CUR) analyzed at different conditions: (a) change in the organic composition by ± 2%; (b) change in the acetic acid concentration by ± 1.0% v/v; (c) change in the flow rate of mobile phase of ± 0.1 ml/min; and (d) change in the column temperature of ± 5.0 °C
67
Figure 3.1 Zeta potential measurements as a function of pH: (a) chitosan solution (0.04% w/w), and (b) type B gelatin solution (1% w/w) with ionic strength of 0.1 M NaCl, performed at 25 °C. Mean ± SD, n = 3
79
Figure 3.2 Effect of pH on turbidity index and dry coacervate yield of gelatin-chitosan systems at total polymer concentration of 2.55% w/w and mixing ratio of 30:1. The process was carried out by constant stirring at 500 rpm for 0.5 h, at 50 °C. Mean ± SD, n = 3
81
Figure 3.3 Effect of total polymer concentration and gelatin-chitosan mixing ratio on turbidity index. Coacervations were induced at pH 5.50 with constant stirring for 0.5 h, at 50 °C. Mean ± SD, n = 3
88
Figure 3.4 Dry coacervate yields obtained from gelatin-chitosan systems at different total polymer concentrations and different mixing ratios. Coacervations were induced at pH 5.50 with constant stirring at 500 rpm for 0.5 h, at 50 °C. Mean ± SD, n = 3
90
Figure 3.5 Different coacervate volumes and dry coacervate yields obtained from gelatin-chitosan systems at ratio of 30:1, of different total polymer concentrations. Coacervations were induced at pH 5.50 with constant stirring at 500 rpm for 0.5 h, at 50 °C Mean ± SD, n = 3
90

xix
Figure 3.6 Effect of coacervation temperature on turbidity index and dry coacervate yield of gelatin-chitosan systems at total polymer concentration of 2.55% w/w and mixing ratio of 30:1. Coacervations were induced at pH 5.50 with constant stirring at 500 rpm for 0.5 h. Mean ± SD, n = 3
91
Figure 3.7 Effect of coacervation duration of the gelatin-chitosan systems at total polymer concentration of 2.55% w/w and mixing ratio of 30:1 on colloids turbidity index and dry coacervate yield. The pH and temperature of coacervation were 5.50 and 50 °C, respectively. Mean ± SD, n = 3
93
Figure 3.8 Effect of incubation time of gelatin-chitosan systems at total polymer concentration of 2.55% w/w and mixing ratio of 30:1 on turbidity index and dry coacervate yield. The coacervations were induced at pH 5.50 with constant stirring at 500 rpm for 0.5 h, at 50 °C. Mean ± SD, n = 3
95
Figure 4.1 Schematic diagram for the preparation of gelatin-chitosan coacervation microcapsules containing solid or liquid core materials
111
Figure 4.2 The static Franz cell and the experimental setup using #V3 3-Station Franz Cell Stirrer
118
Figure 4.3 HPLC chromatograms of (a) CPM, curcuminoids solid core microcapsule; (b) CLM, curcuminoids liquid core microcapsule; (c) QPM, quercetin solid core microcapsule and (d) QLM, quercetin liquid core microcapsule
124
Figure 4.4 Effect of pH changing rate on particle size distribution for curcuminoids solid core microcapsules: (a) 25 µl/10 sec and (b) 200 µl/10 sec
126
Figure 4.5 DSC thermograms of raw material powders: gelatin, chitosan, curcuminoids and quercetin
148
Figure 4.6 DSC thermograms of crosslinked CPM, uncrosslinked CPM, crosslinked CLM, blank microcapsule and physical mixtures of raw materials
151
Figure 4.7 DSC thermograms of crosslinked QPM, uncrosslinked QPM, crosslinked QLM, blank microcapsule and physical mixtures of raw materials
151
Figure 4.8 FTIR spectra of gelatin, chitosan and blank microcapsule
154
Figure 4.9 FTIR spectra of native curcuminoids and quercetin powders
155
Figure 4.10 FTIR spectra of blank microcapsule, CPM and CLM 158

xx
Figure 4.11 FTIR spectra of blank microcapsule, QPM and QLM
159
Figure 4.12 FTIR overlay spectra of CPM and CLM
160
Figure 4.13 FTIR overlay spectra of QPM and QLM
160
Figure 4.14 Zero order kinetics plots of light stability data for native curcuminoids, CPM and CLM. Data points are mean value of triplicate measurements
162
Figure 4.15 First order kinetics plots of light stability data for native curcuminoids, CPM and CLM. Data points are mean value of triplicate measurements
163
Figure 4.16 Drug retention of native curcuminoids, native quercetin, CPM, QPM, CLM and QLM stored at 28 ± 4 °C/75 ± 10% RH for 12 months. ** and *** indicate significant difference at p < 0.01 and at p < 0.001, respectively compared to control. Mean ± SD, n = 3
164
Figure 4.17 Drug retention of native curcuminoids, native quercetin, CPM, QPM, CLM and QLM stored at 40 ± 2 °C/75 ± 5% RH for 6 months. *** indicates significant difference at p < 0.001 compared to control. Mean ± SD, n = 3
165
Figure 4.18 Drug retention of native curcuminoids, native quercetin, CPM, QPM, CLM and QLM stored at 5 ± 3 °C for 6 months. ** and *** indicate significant difference at p < 0.01 and at p < 0.001, respectively compared to control. Mean ± SD, n = 3
165
Figure 4.19 Particle size of CPM, QPM, CLM and QLM stored at 28 ± 4 °C/75 ± 10% RH for 12 months. *** indicates significant difference at p < 0.001 compared to control. Mean ± SD, n = 3
166
Figure 4.20 Particle size of CPM, QPM, CLM and QLM stored at 40 ± 2 °C/75 ± 5% RH for 6 months. ** and *** indicate significant difference at p < 0.01 and at p < 0.001, respectively compared to control. Mean ± SD, n = 3
167
Figure 4.21 Particle size of CPM, QPM, CLM and QLM stored at 5 ± 3 °C for 6 months. Mean ± SD, n = 3
167
Figure 4.22 Comparison of swelling index for various microcapsules in different media at 35 ± 2 °C. Mean ± SD, n = 3
168
Figure 4.23 Release profiles of native curcuminoids, crosslinked CPM and uncrosslinked CPM
169
xxi
Figure 4.24 Release profiles of native quercetin, crosslinked QPM and uncrosslinked QPM
170
Figure 4.25 Chromatograms of formaldehyde analysis by gas chromatography: (a) internal standard solution (1-butanol), (b) standard solution containing 0.1% formaldehyde and 1-butanol, (c) crosslinked CPM and (d) crosslinked QPM
173
Figure 5.1 The set-up of TTC Spreadability fixture on the Heavy Duty Platform
199
Figure 5.2 Pseudo-ternary phase diagram of oil, water and emulsifiers blend showing oil-in-water region
205
Figure 5.3 Combination points in area of interest of ternary phase diagram and the oil-in-water cream formulations (highlighted area)
206
Figure 5.4 Construction of pseudo ternary phase diagram (L-transformation) and parallelogram (domain)
207
Figure 5.5 The normal probability plots for experimental responses: (a) apparent viscosity, (b) firmness and (c) work of shear
212
Figure 5.6 The predicted versus actual plots for experimental responses: (a) apparent viscosity, (b) firmness and (c) work of shear
213
Figure 5.7 Response trace plots of (a) apparent viscosity, (b) firmness and (c) work of shear. A: oil components = 29.97%, B: emulsifiers blend = 12.97%, C: aqueous phase = 56.91%
215
Figure 5.8 3D surface plots: (a) apparent viscosity, (b) firmness and (c) work of shear. X1: oil phase, X2: emulsifier blend and X3: aqueous phase
217
Figure 5.9 Size distribution graphs of cream bases emulsified by: (a) mechanical mixing at 2000 rpm for 15 min, (b) mechanical mixing and homogenization at 18000 rpm for 2 min and (c) mechanical mixing and homogenization at 18000 rpm for 2 min, 3 cycles
221
Figure 5.10 Zeta potential charge distribution of curcuminoids microcapsule (CPM) cream (n = 3)
226
Figure 5.11 Zeta potential charge distribution of quercetin microcapsule (QPM) cream (n = 3)
226
Figure 5.12 Rheograms of (a) curcuminoids microcapsule (CPM) cream and (b) quercetin microcapsule (QPM) cream
229
xxii
Figure 5.13 HPLC chromatograms of (a) curcuminoids microcapsule (CPM) cream and (b) quercetin microcapsule (QPM) cream
231
Figure 5.14 In vitro drug release profiles of crosslinked curcuminoids microcapsule (CPM), crosslinked quercetin microcapsule (QPM), CPM cream and QPM cream
232
Figure 5.15 pH values of CPM and QPM creams stored at 28 ± 4 °C/75 ± 10% RH and 40 ± 2 °C/75 ± 5% RH for 6 months; mean ± SD, n = 3. * represents significant difference compared to control at p < 0.05
236
Figure 5.16 Zeta potential values of CPM cream stored at 28 ± 4 °C/75 ± 10% RH and 40 ± 2 °C/75 ± 5% RH for 6 months; mean ± SD, n = 3
237
Figure 5.17 Zeta potential values of QPM cream stored at 28 ± 4 °C/75 ± 10% RH and 40 ± 2 °C/75 ± 5% RH for 6 months; mean ± SD, n = 3. * represents significant difference compared to control at p < 0.05
238
Figure 5.18 Particle size and span values of CPM cream stored at 28 ± 4 °C/75 ± 10% RH and 40 ± 2 °C/75 ± 5% RH for 6 months; mean ± SD, n = 3. * represents significant difference compared to control at p < 0.05
239
Figure 5.19 Particle size and span values of QPM cream stored at 28 ± 4 °C/75 ± 10% RH and 40 ± 2 °C/75 ± 5% RH for 6 months; mean ± SD, n = 3. * represents significant difference compared to control at p < 0.05
239
Figure 5.20 Size distribution of creams containing 2% w/w curcuminoids microcapsule (a-c) and 2% w/w quercetin microcapsule (d-f). Graphs (a) and (d) represented freshly prepared creams; graphs (b) and (e), (c) and (f) represented creams stored at 28 ± 4 °C/75 ± 10% RH and 40 ± 2 °C/75 ± 5% RH, respectively for 6 months
240
Figure 5.21 Simple order kinetic plots of drug degradation data for curcuminoids microcapsule (CPM) creams
246
Figure 5.22 Simple order kinetic plots of drug degradation data for quercetin microcapsule (QPM) creams
247
Figure 6.1 A modified stainless steel stamp (20 mm in diameter) with an electronic temperature controller
276
Figure 6.2 Effect of native curcuminoids, native quercetin, curcuminoids microcapsule (CPM) and quercetin microcapsule (QPM) at various concentrations on HaCaT
282

xxiii
cell viability. Results were expressed as mean ± SD of three independent tests. * indicates p < 0.05 compared to the untreated control
Figure 6.3 Effect of native curcuminoids, native quercetin, curcuminoids microcapsule (CPM) and quercetin microcapsule (QPM) on HaCaT cell proliferation. Each point represents the mean of three independent tests
283
Figure 6.4 Effect of native curcuminoids, native quercetin, curcuminoids microcapsule (CPM) and quercetin microcapsule (QPM) on scratch wound repair of HaCaT cells. Results were expressed as mean ± SD of three independent tests
285
Figure 6.5 Effect of cream base, Silfazine cream (positive control), CPM cream and QPM cream on wound contraction compared to normal saline negative control group (n = 6). Results were expressed as mean ± S.E.M. * and ** indicate significant difference at p < 0.05 and p < 0.01, respectively compared to normal saline treated group
286
Figure 6.6 Effect of cream base, Silfazine cream (positive control), CPM cream and QPM cream on hydroxyproline content in wound tissue compared to normal saline negative control group (n = 6). Results were expressed as mean ± S.E.M. * and ** indicate significant level at p < 0.05 and p < 0.01, respectively compared to normal saline treated group
292

xxiv
LIST OF PLATES
Page
Plate 3.1 Micrographs show the coacervation of the gelatin-chitosan system at total polymer concentration of 2.55% w/w and mixing ratio of 30:1, with different pH values: (a) pH 4.75, (b) pH 5.00, (c) pH 5.25, (d) pH 5.50, (e) pH 5.75, and (f) pH 6.00. Bar represents 20 µm
82
Plate 3.2 Coacervation and precipitation systems obtained from gelatin-chitosan colloids at 2.55% w/w of different mixing ratios induced at pH 5.50
83
Plate 3.3 Micrographs show the gelatin-chitosan systems at total polymer concentration of 2.55% w/w with different ratios: (a) 10:1, (b) 15:1, (c) 20:1, (d) 25:1, (e) 30:1, (f) 35:1, (g) 40:1, (h) 50:1, (i) 60:1, and (j) 80:1. Bar represents 20 µm
86
Plate 3.4 Micrographs show the gelatin-chitosan systems at ratio 30:1, with different total polymer concentrations: (a) 1.55, (b) 2.05, (c) 2.55, (d) 3.05, and (e) 3.55% w/w. Bar represents 20 µm
87
Plate 3.5 The physical appearance of the gelatinized gelatin-chitosan colloids at total polymer concentration of 2.55% w/w and mixing ratios from 10:1 to 80:1.
88
Plate 3.6 The physical appearance of the gelatin-chitosan systems at total polymer concentration of 2.55% w/w and mixing ratio of 30:1 equilibrated at different coacervation durations
93
Plate 4.1 Micrographs show the curcuminoids solid core microcapsules’ configuration by the effect of pH changing rate: (a) 25 µl/10 sec, (b) 50 µl/10 sec, (c) 100 µl/10 sec and (d) 200 µl/10 sec. Bars represent 10 µm
126
Plate 4.2 Micrographs show the effect of agitation rate during microencapsulation on configuration of curcuminoids solid core microcapsules: (a) 400 rpm, (b) 500 rpm, (c) 600 rpm and (d) 700 rpm. Bars represent 10 µm
133
Plate 4.3 Micrographs show the morphologies of (a) curcuminoids powder and (b) quercetin powder. Bar represents 20 µm
137
Plate 4.4 Micrographs show the configurations of microcapsules: (a) CLM, curcuminoids liquid core microcapsule; (b) QLM, quercetin liquid core microcapsule; (c) CPM, curcuminoids solid core microcapsule (d) QPM, quercetin solid core microcapsule (e) aggregate CPM, and (f) aggregate QPM. Bars represent 5 µm (a & b), 2 µm (c & d) and 1 µm (e & f),
139

xxv
respectively
Plate 4.5 Micrographs show the double layer of capsule wall in (a): CLM, curcuminoids liquid core microcapsule and (b): single layer of capsule wall in CPM, curcuminoids solid core microcapsule
140
Plate 4.6 SEMs for (a) crosslinked CPM and (b) uncrosslinked CPM
142
Plate 4.7 Pictures show the physical appearance and the staining effect of: (a) native curcuminoids powder, (b) curcuminoids solid core microcapsule powder, CPM and (c) curcuminoids liquid core microcapsule powder, CLM
145
Plate 4.8 Pictures show the physical appearance and the staining effect of: (a) native quercetin powder, (b) quercetin solid core microcapsule powder, QPM and (c) quercetin liquid core microcapsule powder, QLM
146
Plate 5.1 Micrographs show the emulsion droplet configurations produced by (a) mechanical mixing at 2000 rpm for 15 min, (b) mechanical mixing and homogenization at 18000 rpm for 2 min, and (c) mechanical mixing and homogenization at 18000 rpm for 2 min, 3 cycles. Bars represent 50 µm
222
Plate 5.2 Photos show the physical appearance of cream base, quercetin microcapsule (QPM) cream and curcuminoids microcapsule (CPM) cream
223
Plate 5.3 Methylene blue being dissolved and homogeneously diffused throughout the external phase of the O/W cream
225
Plate 5.4 Micrographs of (a) curcuminoids microcapsule (CPM) cream and (b) quercetin microcapsule (QPM) cream. Bars represent 5 µm
225
Plate 5.5 Skin irritation test of curcuminoids microcapsule (CPM) cream – evidence and grading
249
Plate 5.6 Skin irritation test of quercetin microcapsule (QPM) cream – evidence and grading
252
Plate 6.1 Photographs of macroscopic appearance of wound contraction treated with normal saline at day 1 (a), day 3 (b), day 6 (c), day 9 (d), day 12 (e), day 15 (f), day 18 (g) and day 21 (h)
287
Plate 6.2 Photographs of macroscopic appearance of wound contraction treated with cream base 0.5 g/day at day 1 (a), day 3 (b), day 6 (c), day 9 (d), day 12 (e), day 15 (f), day 18
288
xxvi
(g) and day 21 (h)
Plate 6.3 Photographs of macroscopic appearance of wound contraction treated with Silfazine cream 0.5 g/day at day 1 (a), day 3 (b), day 6 (c), day 9 (d), day 12 (e), day 15 (f), day 18 (g) and day 21 (h)
289
Plate 6.4 Photographs of macroscopic appearance of wound contraction treated with CPM cream 0.5 g/day at day 1 (a), day 3 (b), day 6 (c), day 9 (d), day 12 (e), day 15 (f), day 18 (g) and day 21 (h)
290
Plate 6.5 Photographs of macroscopic appearance of wound contraction treated with QPM cream 0.5 g/day at day 1 (a), day 3 (b), day 6 (c), day 9 (d), day 12 (e), day 15 (f), day 18 (g) and day 21 (h)
291
Plate 6.6 Hematoxylin and Eosin stained section of skin burn wound from: (a) normal saline (negative control), (b) cream base-treated, (c) Silfazine cream-treated, (d) CPM cream-treated and (e) QPM cream-treated groups; (E) Epidermis, (S) scab, (D) dermis, (EGT) early granulation tissue, (GT) granulation tissue, (star) aggregation of inflammatory cells, (R) rete ridges and (→) epithelialization
294

xxvii
LIST OF ABBREVIATIONS
%T transmittance percent Shear rate Yield stress
< Less than > More than ± Plus minus µg/ml Microgram per millimeter µl Microliter µm Micrometer ABTS 2,2’-azino-bis (3-ehylbenzothiazoline-6-sulfonate) BDMC Bisdemethoxycurcumin BHA Butylated hydroxyanisole BHT Butylated hydroxytoluene CLM Curcuminoid microcapsule (liquid core microencapsulation) cm Centimeter –COO- Carboxylate -COOH Carboxyl group CPM Curcuminoid microcapsule (solid core microencapsulation) CUR Curcumin D[4,3] Volume mean diameter DMC Demethoxycurcumin DPPH 2,2-diphenyl-1-picrylhydrazyl DSC Differential scanning calorimetry FTIR Fourier transform infrared spectroscopy HCl Hydrochloric acid HLB Hydrophilic-lipophilic balance IP Intraperitoneal injection K Release rate constant or consistency coefficient k’ Capacity factorLOD Limit of detection LOL Limit of linearity LOQ Limit of quantitation M Molar min Minute ml Milliliter ml/min Milliliter per minute mm Millimeter N Theoretical plate n Flow behavior index or release exponent Ƞ Apparent viscosity N2 Gas nitrogen NaCl Sodium chloride ng/ml Nanogram per millimeter -NH2 Amino group -NH3
+ Ammonium nm Nanometer O/W Oil-in-water

xxviii
pHc Critical pH pHϕ pH of macroscopic/global phase separation, pI Isoelectric point QC Quality control QLM Quercetin microcapsule (liquid core microencapsulation) QPM Quercetin microcapsule (solid core microencapsulation) QUE Quercetin R Resolution R2 Coefficient of determination RH Relative humidity rHLB Hydrophilic-lipophilic balance requirement RP-HPLC Reversed phase high performance liquid chromatography rpm Rotation per minute RSD Relative standard deviation S.E.M Standard error of mean S/N Signal to noise SD Standard deviation SEM Scanning electron microscope Smix Emulsifiers blend t1/2 Half-life of degradation t50% Half-life of release t90 Shelf life or time of 10% decomposition Tf Tailing factortR Retention time UV Ultraviolet v/v Volume per volume W/O Water-in-oil w/w Weight per weight μM Micro molar τ Shear stress
xxix
LIST OF APPENDICES
Appendix A1 Chromatograms of quercetin (10 µg/ml) and curcuminoids (100 µg/ml)
Appendix B1 Formulation and method of preparation of type B gelatin-chitosan mixture solution at different ratios and total polymer concentrations
Appendix C1 Preparation of citrate-phosphate buffer
Appendix C2 Preparation of citrate buffer
Appendix D1 Calculation of required hydrophile-lipophile balance (rHLB) of oil phase ingredients
Appendix D2 Calculation for relative quantities of emulsifying agents necessary to produce the physically stable emulsion
Appendix E1 The drawing of straight lines from the middle of each apex to the opposite apex and the location of 27 screening points for fabrication of ternary phase diagram
Appendix E2 Screening points and types of combination
Appendix E3 Combination points constructed in the area of interest
Appendix F1 Statistical analyses for apparent viscosity, firmness and work of shear
Appendix G1 Approval letter for use of rabbits for primary skin irritation test
Appendix G2 Approval letter for use of rats for wound healing study
xxx
MIKROKAPSUL KOASERVAT KOMPLEKS DALAM KRIM UNTUK PENGHANTARAN TOPIKAL KURKUMINOID DAN QUERCETIN
ABSTRAK
Kurkuminoid dan quercetin mempunyai aktiviti antioksidan, anti-radang dan
anti-bakteria yang bermanfaat untuk penyembuhan luka. Walau bagaimanapun, sifat
kedua-dua sebatian ini iaitu kelarutan dan bio-keperolehan yang rendah,
fotosensitiviti dan pewarnaan menjadikan sebatian-sebation tersebut kurang sesuai
untuk pemakaian topical. Oleh itu, objektif kajian ini adalah untuk membangunkan
dan mencirikan mikrokapsul kurkuminoid dan quercetin, dan seterusnya
menggabungkan sebatian-sebatian ini ke dalam krim. HPLC UV fasa terbalik
isokratik dibangunkan dan disahkan untuk menyatakan kuantiti kurkuminoid
(bisdemethoxycurcumin, demethoxycurcumin dan curcumin) dan quercetin secara
serentak. Puncak quercetin, bisdemethoxycurcumin, demethoxycurcumin dan
curcumin adalah terpisah dan simetri. Mikrokapsul telah disediakan dengan
menggunakan kaedah koaservation kompleks menggunakan chitosan dan gelatin B.
Mikrokapsul terbaik diperolehi dengan gelatin:chitosan pada nisbah 30:1 (2.55%
w/w) dan pH 5.50. Kurkuminoid dikapsulkan sama ada dalam bentuk cecair (CLM)
atau pepejal (CPM). Quercetin juga dikapsulkan sama ada dalam bentuk cecair
(QLM) atau pepejal (QPM). Ciri-ciri fizikal bagi CPM dan QPM adalah lebih baik
daripada CLM dan QLM. CPM dan QPM mempunyai saiz zarah dalam linkungan
40-44 µm, kecekapan pemerangkapan sebanyak 82% dan memuatkan ubat 16%.
Selain itu, mikrokapsul ini tidak melekit, kurang kesan pewarnaan dan stabil pada
suhu bilik (28 °C) selama 12 bulan. Aktiviti antioksidan kurkuminoid dan quercetin
adalah lebih tinggi daripada hidroksianisol dibutilkan (BHA) dan hidroksitoluena

xxxi
dibutilkan (BHT). Tiada perubahan ketara dalam aktiviti antioksidan kurkuminoid
dan quercetin selepas pengkapsulan dalam mikrokapsul. Kurkuminoid dan quercetin
kemudiannya masing-masing digabungkan ke dalam asas krim O/W. Kedua-dua
sediaan ini mempunyai ciri-ciri pseudoplastik dan tiksotropik. Kajian pelepasan in
vitro menunjukkan bahawa kurkuminoid dan quercetin dilepaskan dari mikrokapsul
yang digabungkan di dalam krim mengikuti kinetic tertib sifar. Krim-krim CPM dan
QPM stabil pada suhu bilik (28 °C) selama 6 bulan. Ujian kerengsaan kulit pada
arnab menunjukkan bahawa kedua-dua sediaan tidak merengsa. Tambahan pula,
kajian in vivo penyembuhan luka pada tikus menunjukkan bahawa krim CPM dan
krim QPM mempunyai sifat penyembuhan luka. Kesimpulannya, mikrokapsul
kurkuminoid dan quercetin yang digabungkan dalam krim telah berjaya disediakan.
CPM mempunyai ciri-ciri penyembuhan luka yang lebih baik daripada QPM.
xxxii
COMPLEX COACERVATED MICROCAPSULES IN CREAM FOR TOPICAL DELIVERY OF THE CURCUMINOIDS AND QUERCETIN
ABSTRACT
The curcuminoids and quercetin possess antioxidant, anti-inflammatory and
antibacterial activities which are beneficial for wound healing. However, poor
solubility, poor bioavailability, photosensitivity and color staining properties of these
two compounds make them not acceptable for topical administrations. Therefore, the
objectives of the present study were to develop and characterize the
curcuminoids/quercetin microcapsules and subsequently incorporate them in cream.
Isocratic reversed phase UV HPLC was developed and validated to quantify the
curcuminoids (bisdemethoxycurcumin, demethoxycurcumin and curcumin) and
quercetin simultaneously. The peaks of quercetin, bisdemethoxycurcumin,
demethoxycurcumin and curcumin were well separated and symmetrical. The
microcapsules were prepared by complex coacervation method using chitosan and
gelatin B. The best microcapsules were obtained at gelatin:chitosan ratio of 30:1
(2.55% w/w) and pH 5.50. The curcuminoids was encapsulated either in liquid
(CLM) or solid (CPM) form. The quercetin was also encapsulated either in liquid
(QLM) or solid (QPM) form. The physical characteristics of CPM and QPM were
better than CLM and QLM. The CPM and QPM had particle size in the range of 40 –
44 µm, entrapment efficiency of 82% and drug loading of 16%. Moreover, the
microcapsules had free flowing, reduce color staining effect and stable at room
temperature (28 °C) for 12 months. The antioxidant activity of the curcuminoids and
quercetin was higher than butylated hydroxyanisole (BHA) and butylated
hydroxytoluene (BHT). There was no significant change in antioxidant activity of the

xxxiii
curcuminoids and quercetin after encapsulation in microcapsules. The curcuminoids
and quercetin microcapsules were then incorporated in O/W cream base,
respectively. The preparations had pseudoplastic and thixotropic properties. In vitro
release study revealed that the curcuminoids and quercetin released from
microcapsule incorporated in cream followed zero order kinetics. The CPM and
QPM creams were stable at room temperature (28 °C) for 6 months. The skin
irritation test in rabbit revealed that both preparations were nonirritant. Furthermore,
the in vivo wound healing study in rats showed that CPM and QPM creams had
wound healing properties. In conclusion, the curcuminoids and quercetin
microcapsules incorporated in creams were successfully prepared. CPM had better
wound healing property than QPM.

1
CHAPTER 1
INTRODUCTION
1.1 Active ingredients
1.1.1 Curcuminoids/curcumin
The turmeric plant is a herb belonging to Curcuma longa L. (Zingiberaceae
family) and has been widely used for centuries as a dietary spice and coloring agent
in Indian and Chinese cuisines. The dried ground rhizome of the plant has been used
in Asian medicine since the second millennium BC. Extracts of the rhizome
including turmerin (a water-soluble peptide), essential oil (e.g., turmerones,
atlantones and zingiberene) and curcuminoids [consists of curcumin (~77%),
demethoxycurcumin (~17%), bisdemethoxycurcumin (~3%) and cyclocurcumin]
(Akbik et al., 2014; Maheshwari et al., 2006; Naksuriya et al., 2014; Prasad et al.,
2014; Sharma et al., 2005).
The three major analogues of the curcuminoids namely, curcumin,
demethoxycurcumin (DMC) and bisdemethoxycurcumin (BDMC) differ by a
methoxy substitution on the aromatic ring (Figure 1.1). Curcumin has two symmetric
o-methoxy phenols linked through the α,β-unsaturated β-diketone moiety, DMC has
an asymmetric structure with one of the phenyl rings having o-methoxy substitution,
and BDMC is similar to curcumin with its symmetric structure but is deficient in two
o-methoxy substitutions. These analogues have different potential in terms of
bioactivities (Anand et al., 2008).

2
Curcumin as the major component of curcuminoids is responsible for the
yellow color that consists of 3-6% of turmeric preparations. Curcumin was
discovered about two centuries ago by Vogel and Pelletier in the year 1815 (cited by
Prasad et al., 2014). In year 1910, the chemical structure of curcumin [i.e.,
diferulyoylmethane or 1,7-bis (4-hydroxy-3-methoxy-phenyl) hepta-1,6-diene-3,5-
dione), C21H20O6] was reported by Milobedzka et al. (1910), as cited in Prasad et al.
(2014). The first synthesis and chromatographic quantitation of curcumin were
reported in years 1913 and 1953, respectively. Curcumin is practically insoluble in
water at acidic and neutral pH but is soluble in methanol, ethanol, dimethylsulfoxide,
and acetone. It has pKa value of 8.54 (Prasad et al., 2014). Curcumin exist in two
molecular configurations that are, bis-keto and enolate. The keto form predominates
in acidic and neutral conditions and in the solid phase, where curcumin acts as a
potent donor of hydrogen atoms. The enol form consists of three ionizable protons
corresponding to the enolic group and two phenolic groups, which predominate in
alkaline conditions. However, curcumin is photosensitive and unstable in phosphate
buffer systems of pH 7.2 (Goel et al., 2008; Strimpakos & Sharma, 2008; Wang et al.,
1997).

3
Figure 1.1. Chemical structures of curcumin, demethoxycurcumin and bisdemethoxycurcumin.
The biological characteristics of curcumin derivatives (demethoxycurcumin
and bisdemethoxycurcumin) and curcumin were scientifically investigated in the
mid-twentieth century (Prasad et al., 2014). Curcumin and derivatives of curcumin
are typical flavonoid compounds, exhibit a wide range of pharmacological activities,
such as anti-cancer (Anto et al., 1996; Ruby et al., 1995; Panahi et al., 2014),
antioxidant (Jayaprakasha et al., 2006), anti-angiogenic (Gururaj et al, 2002; Kant et
al., 2015), antibacterial (Sivasothy et al., 2013), anti-inflammatory (Kant et al., 2014),
antiviral and antifungal (Anand et al., 2008). Curcumin is also a multidrug resistance
modulator (Xue et al., 2013). Additionally, the curcuminoids have been shown to
Curcumin (~77%)
Demethoxycurcumin (~17%)
Bisdemethoxycurcumin (~3%)

4
have medicinal properties against several acute and chronic diseases including type II
diabetes, rheumatoid arthritis, multiple sclerosis, Alzheimer’s disease, Parkinson’s
disease, cardiovascular diseases, allergies, atherosclerosis and certain types of cancer
(Li & Zhang, 2014; Maheshwari et al., 2006; Srivastava et al., 2011; Villaflores et al.,
2012). Curcuminoids have been explored in enhancement of wound healing,
hepatoprotection, treatment of inflammatory disease, neoplastic disease,
neurodegenerative disease, cystic fibrosis and cholesterol-lowering (Akbik et al.,
2014; Cao et al., 2015; Castangia et al., 2014; Kant et al., 2014).
In vivo studies show the safety of curcumin following acute and subchronic
administration to rats and mice. High doses of dietary curcumin show no adverse
effects in humans and animals (Sharma et al., 2005).
1.1.2 Quercetin
Quercetin is a flavonol compound belonging to a broad group of polyphenolic
flavonoids. Quercetin is present in food as quercetin glycosides which represent 60-
75% of the total dietary flavonols plus flavones intake (Perez-Vizcaino et al., 2009).
It is naturally-occurring in fruits and vegetables, such as apples, cranberries and
onions. It is also found in black tea, red wine and various fruit juices. In the United
States, the consumption of flavonol glycosides which are expressed as quercetin
equivalents are at levels of up to ~100 mg/day, the total flavonoids (including
flavanones, flavones, flavonols, anthocyanins, catechins and biflavans) intake from a
normal mixed diet is estimated as ~1g/day flavonoids (expressed as quercitrin
equivalents, where one biflavan molecule is equal to 2 molecules of quercitrin)
(Harwood et al., 2007).
5
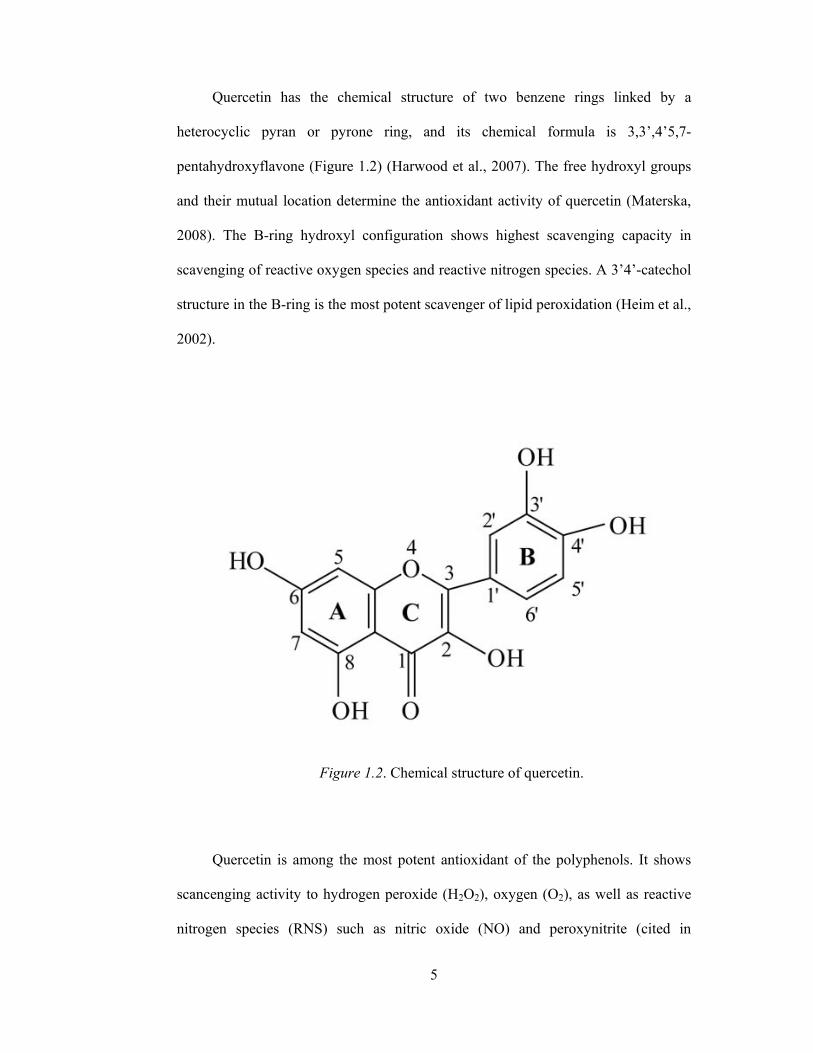
Quercetin has the chemical structure of two benzene rings linked by a
heterocyclic pyran or pyrone ring, and its chemical formula is 3,3’,4’5,7-
pentahydroxyflavone (Figure 1.2) (Harwood et al., 2007). The free hydroxyl groups
and their mutual location determine the antioxidant activity of quercetin (Materska,
2008). The B-ring hydroxyl configuration shows highest scavenging capacity in
scavenging of reactive oxygen species and reactive nitrogen species. A 3’4’-catechol
structure in the B-ring is the most potent scavenger of lipid peroxidation (Heim et al.,
2002).
Figure 1.2. Chemical structure of quercetin.
Quercetin is among the most potent antioxidant of the polyphenols. It shows
scancenging activity to hydrogen peroxide (H2O2), oxygen (O2), as well as reactive
nitrogen species (RNS) such as nitric oxide (NO) and peroxynitrite (cited in

6
Zimmerman et al., 2014). Additionally, quercetin exhibits numerous biological and
pharmacological activities, such as cardioprotective, anti-mutagenic, antioxidant,
anti-inflammatory, chelation, antilipoperoxidative, antiproliferative, anti-
carcinogenic and anti-angiogenic (Harwood et al., 2007; Russo et al., 2012).
Quercetin is therapeutically effective for hypertension (Perez-Vizcaino et al., 2009),
skin oxidative stress (Inal & Kahraman, 2000; Joshan & Singh, 2013; Kimura et al.,
2009; Manca et al., 2014), rheumatoid arthritis (Natarajan et al., 2010) and wound
healing (Gomathi et al., 2003). In cancer treatment, quercetin also reacts as a
multidrug resistance modulator and thus a potential chemosensitizer (Chen et al.,
2010). In addition, quercetin has been shown to be chemopreventive and a possible
solution for anthracycline-induced cardiotoxicity and multidrug resistance (Czepas &
Gwoździński, 2014).
Long-term oral animal toxicity studies demonstrated the safety of dietary
quercetin (Harwood et al., 2007).
1.2 Microencapsulation
1.2.1 Introduction of microencapsulation
Microencapsulation which has been developed since the 1950s is defined as a
process of surrounding or enveloping the substance of either solids, liquids, or
gaseous materials in a coating or capsule, yielding capsules ranging from sub-micron
to several millimeters in size (Fang & Bhandari, 2010). The microencapsulation
methods distinguishes the capsules in term of particle size ranges or denomination of
either nanocapsules (size range smaller than 0.2 µm), microcapsules (size range
between 0.2 and 5000 µm) or macrocapsules (size range larger than 5000 µm)
7
(Barbosa-Cánovas et al., 2005). The encapsulated substance is called core material,
active ingredient or agent, fill, payload, internal phase or nucleus. On the other hand,
the material encapsulating the core is called coating, membrane, shell, carrier or wall
material. The coating materials can be sugars, gums, proteins, polysaccharides, lipids
and synthetic polymers (Barbosa-Cánovas et al., 2005; Fang & Bhandari, 2010).
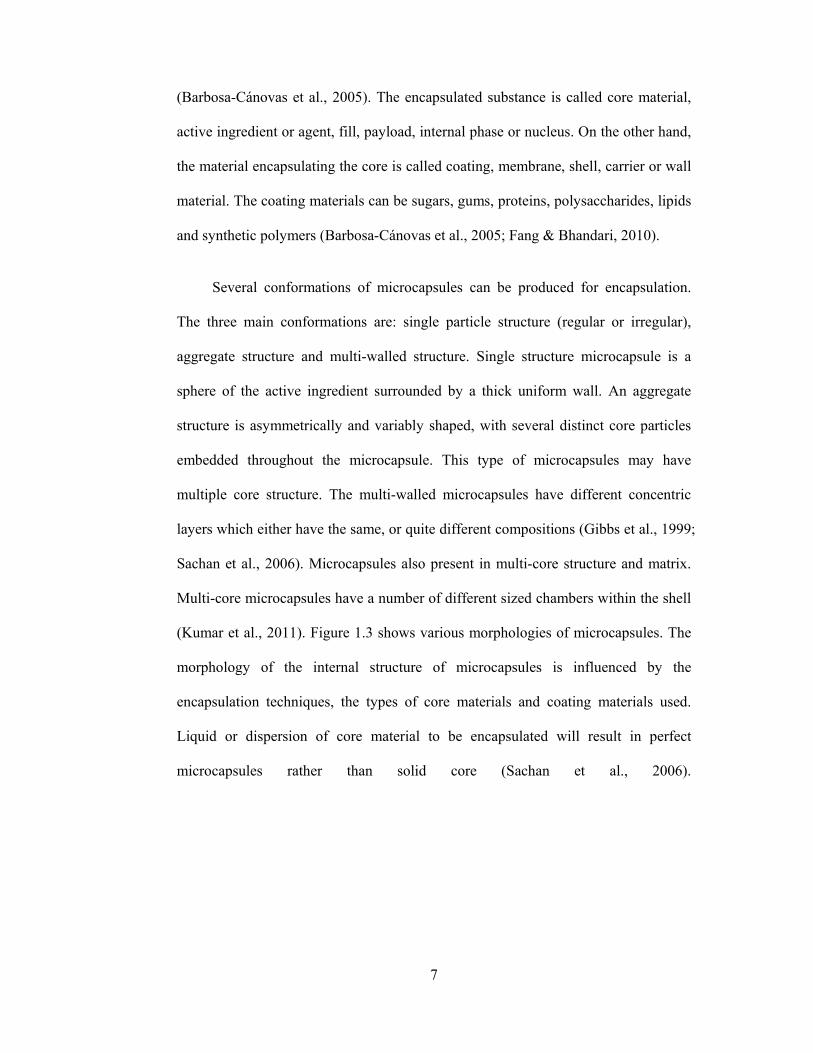
Several conformations of microcapsules can be produced for encapsulation.
The three main conformations are: single particle structure (regular or irregular),
aggregate structure and multi-walled structure. Single structure microcapsule is a
sphere of the active ingredient surrounded by a thick uniform wall. An aggregate
structure is asymmetrically and variably shaped, with several distinct core particles
embedded throughout the microcapsule. This type of microcapsules may have
multiple core structure. The multi-walled microcapsules have different concentric
layers which either have the same, or quite different compositions (Gibbs et al., 1999;
Sachan et al., 2006). Microcapsules also present in multi-core structure and matrix.
Multi-core microcapsules have a number of different sized chambers within the shell
(Kumar et al., 2011). Figure 1.3 shows various morphologies of microcapsules. The
morphology of the internal structure of microcapsules is influenced by the
encapsulation techniques, the types of core materials and coating materials used.
Liquid or dispersion of core material to be encapsulated will result in perfect
microcapsules rather than solid core (Sachan et al., 2006).
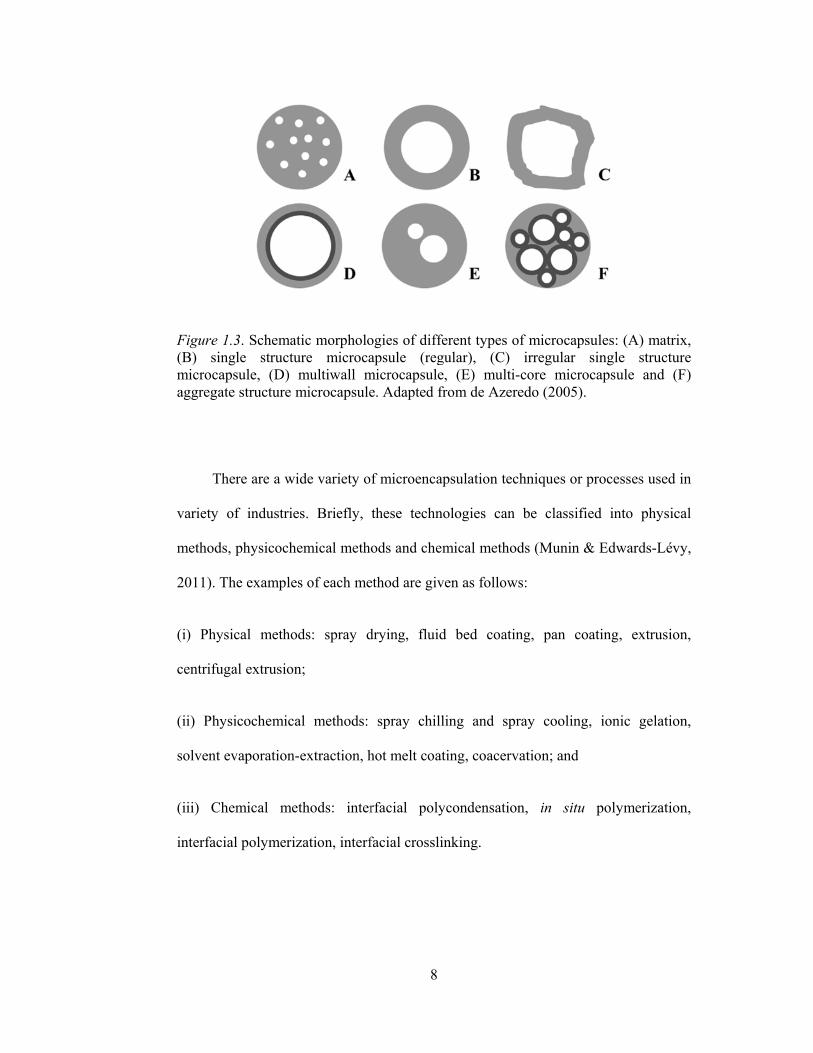
Figure 1.3(B) singlmicrocapsaggregate
Ther
variety of
methods, p
2011). Th
(i) Physic
centrifuga
(ii) Physi
solvent ev
(iii) Chem
interfacial
3. Schematile structursule, (D) mstructure m
re are a wid
f industries
physicochem
e examples
cal method
al extrusion;
icochemical
vaporation-e
mical meth
l polymeriza
ic morpholore microcamultiwall mmicrocapsule
de variety o
s. Briefly,
mical meth
of each me
ds: spray d
;
l methods:
extraction, h
hods: inter
ation, interf
8
ogies of diffapsule (reg
microcapsulee. Adapted f
f microenca
these techn
ods and che
ethod are giv
drying, flui
spray chil
hot melt coa
rfacial pol
facial crossl
ferent typesgular), (Ce, (E) mulfrom de Az
apsulation t
nologies ca
emical meth
ven as follo
id bed coa
lling and s
ating, coace
ycondensat
linking.
s of microca) irregularlti-core miczeredo (2005
techniques o
an be class
hods (Munin
ows:
ating, pan
spray cooli
ervation; and
tion, in si
apsules: (A)r single scrocapsule 5).
or processes
sified into
n & Edward
coating, ex
ing, ionic g
d
itu polyme
) matrix, structure and (F)
s used in
physical
ds-Lévy,
xtrusion,
gelation,
erization,

9
1.2.2 Core material
The core material which is the material to be coated to serve the specific
purpose can be liquid or solid in nature. The composition of core material can be
varied, such as liquids and dispersion forms for liquid core materials, while active
constituents, stabilizers, diluents, excipients and release-rate retardants or
accelerators are examples of solid core materials. The composition of core material is
selected depending on the final microcapsules properties (Bansode et al., 2010;
Sachan et al., 2006).
1.2.3 Coating material
A wide variety of coating materials are available for microencapsulation,
depending on the material to be coated and the characteristics desired in the final
microcapsules (Barbosa-Cánovas et al., 2005). Effective coating materials should
meet the properties such as film forming, strength, pliable, tasteless, stable, non-
hygroscopic, soluble in aqueous media, good rheological at high concentration and
ease of manipulation during the process of encapsulation and optical properties.
Furthermore, the selected coating material should be chemically compatible and
nonreactive with the core material during processing and storage. Additionally, it
should meet the requirement of the system such as microcapsules solubility
properties and core material release properties (Bansode et al., 2010; Barbosa-
Cánovas et al., 2005; Sachan et al., 2006). Examples of coating materials are as
follows (Bansode et al., 2010):

10
(i) Water soluble resins: gelatin, gum arabic, starch, polyvinylpyrrolidone,
carboxymethylenecellulose, hydroxyethylcellulose, methylcellulose, arabinogalactan,
polyvinyl alcohol, polyacrylic acid;
(ii) Water insoluble resins: ethylcellulose, polyethylene, polymethacrylate,
polyamide (nylon), poly (ethylenevinyl acetate), cellulose nitrate, silicones,
poly(lactide-co-glycolide);
(iii) Waxes and lipids: paraffin, carnauba, spermaceti, beeswax, stearic acid, stearyl
alcohol. Glyceryl stearates; and
(iv) Enteric resins: shellac, cellulose, acetate phthalate, zein.
1.2.3 (a) Gelatin
Gelatin is derived from the fibrous protein collagen by the process of partial
hydrolysis; collagen which is broadly found as the major component of animal skin,
bones and connective tissue (Karim & Bhat, 2009; Mukherjee & Rosolen, 2013).
Depending on the hydrolysis process which is the method by which collagen is
pretreated, two types of gelatin are available, namely, type A and type B gelatins
(Karim & Bhat, 2009; Singh et al., 2002). Type A gelatin is derived from acid
processed collagen (isoelectric point at pH 6-9), while type B gelatin is derived from
alkaline processed collagen (isoelectric point at approximately pH 5) (Karim & Bhat,
2009). The acid or base precursor results in different characteristic features of gelatin
due to different number of NH2 and COOH groups on the gelatin molecules (Siow &
Ong, 2013).
11
Collagen molecules are composed of three α-chains which consist of
continuous repetitions of Gly-X-Y amino acid sequences where X is mostly proline
and Y is mostly hydroxyproline (Eastoe & Leach, 1977), forming a triple-helix
structure. The intertwined triple-helix adopts a 3D structure that provides an ideal
geometry for inter-chain hydrogen bonds. The triple-helices are stabilized by the
inter-chain hydrogen bonds (Duconseille et al., 2015; Karim & Bhat, 2009).
Denaturation of collagen by thermal or physical and chemical means causes the
destruction of hydrogen bonds, which results in breaking of the triple-helix structure
into random coils to produce gelatin (Bigi et al., 2004; Karim & Bhat, 2009). Gelatin
contains amino acids in varying composition as reported by Eastoe (1955). The
amino acid composition of gelatin is very close to that of its parent collagen (Karim
& Bhat, 2009).
Gelatin is biodegradable, non-toxic, and easy to crosslink and to modify
chemically. It is frequently used in food, pharmaceutical, biomedical and
photographic industries. It is commonly used as the main ingredient of hard and soft
capsules, microspheres, sealants for vascular prostheses, wound dressing and
adsorbent pad for surgical use and tissue regeneration. Gelatin is soluble in aqueous
solution at temperature of about 40 °C and present in the sol state (Bigi et al., 2004).
When gelatin is cooled below 30-35 °C the random coil polypeptide chains will
undergo a conformational disorder-order transition and partly regenerate the collagen
triple-helix structure and form thermoreversible gels by associating helices in
junction zones stabilized by hydrogen bonds (Bigi et al., 2004; Strauss & Gibson,
2004). Because gelatin is soluble in aqueous solution, gelatin used as coating
material or matrix of microcapsule products must be submitted to crosslinking,
which improves both thermal and mechanical stability of the biopolymer (Bigi et al.,

12
2004). Crosslinking is important for the gelatin capsules to be insoluble at high
temperatures, to reduce swelling in water and decrease permeability across cell
membranes. Formaldehyde and glutaraldehyde are the most common agents used in
gelatin crosslinking.
Gelatin is widely used as the main ingredient of the complex coacervation in
the food and pharmaceutical industries (Comunian et al., 2013; Dong et al., 2011;
Hanes et al., 2001; Jizomoto et al, 1993; Saravanan & Rao, 2010; Shinde Y
Nagarsenker, 2011). The most important property of this protein is that gelatin is a
polyampholyte with amine (-NH2) and carboxyl (-COOH) functional groups along
with hydrophobic groups (lurea Raţă et al., 2013). Gelatin is a random coil polymer
carrying positively and negatively charged-sites in almost 1:1 ratio. Additionally, it is
associated with a small persistence length of about 2 nm (Bohidar, 2008). In solution,
gelatin can be ionized to either –COO- or - NH3+ depending on the pH of the solution.
At pH above the isoelectric point, gelatin charged negatively; whereas at pH below
the isoelectric point, gelatin charged positively. Hence, gelatin will react with
oppositely charged biomolecules in the same medium via electrostatic interaction to
form polyionic complexes (Young et al., 2005). For example, in a mixture containing
gelatin (a protein) and an anionic polysaccharide, adjustment of the pH to below the
isoelectric point (pI) or the electrical equivalence pH (IEP) of gelatin would result in
maximum electrostatic attraction where the two biopolymers are carrying oppositely
charge (Siow & Ong, 2013). For instance, complex coacervation occurred in a
mixture of gum arabic (acacia) and type A gelatin at pH 4.5 (Bhattacharyya &
Argillier, 2005; Siow & Ong, 2013), or occurred in a mixture of gum arabic (acacia)
and type B gelatin at pH 3.5 (Siow & Ong, 2013). On the other hand, a gelatin-
cationic polysaccharide system requires the adjustment of the mixture pH to above

13
the isoelectric point of gelatin for electrostatic attraction. For instance, complex
coacervation occurred in a type B gelatin-chitosan system at pH 5.25-5.5 (Remuñán-
López & Bodmeier, 1996). At pH 5.25-5.5, gelatin will be negatively charged (since
the isoelectric point of gelatin B is 4.7-5.2) and it will electrostatically interact with
positively charged chitosan to form an insoluble complex (complex coacervate). At
such pH, gelatin-chitosan complex coacervation should be limited to type B gelatin.
The isoelectric point of type A gelatin is typically 8-9, so its complex coacervation
with chitosan should be limited to pH values above this (Thies, 2007). However,
chitosan is precipitated at solution of pH higher than 6 since the pKa of chitosan is
about pH 6.3 (Paños et al., 2008). Figure 1.4 shows the chemical structure of gelatin.
Figure 1.4. Chemical structure of gelatin.
14
1.2.3 (b) Chitosan
Chitosan is an amino-polysaccharide derived by alkaline deacetylation of chitin
(an N-acetyl-glucosamine polymer). Chitin is the second most abundant polymer in
nature after cellulose and is from crustaceans, exoskeleton of insects and fungi.
Chitosan is a cationic polysaccharide, a copolymer of 2-acetamido-2-deoxy-β-D-
glucose and 2-amino-2-deoxy-β-D-glucose units, and it differs in the degree of N-
acetylation (40-98%) and molecular weight (50-2000 kDa) (Basu et al., 2010;
Estevinho et al., 2013; Paños et al., 2008). The solubility of chitosan, which has a
pKa value of 6.3 (Paños et al., 2008), depends closely on the degree of acetylation
(Kumirska et al., 2011) where it is normally insoluble in aqueous solutions of pH
value higher than pKa, however it is soluble in dilute acid solutions below pH 6.5
(Riva et al., 2011). The protonated free amino groups facilitate the solubility of the
molecule and characterize chitosan as a cationic polyelectrolyte (Kumirska et al.,
2011). The chemical structure of chitosan is shown in Figure 1.5.
Figure 1.5. Chemical structure of chitosan.
15
Chitosan has been widely used in food, cosmetic and pharmaceutical industries
as a carrier for drug delivery because it possesses excellent properties, such as non-
toxicity, biodegradability, biocompatibility and absorption properties (Paños et al.,
2008). Additionally, a large number of amine groups provide availability of chitosan
interacting with other substances (Jaya et al., 2010). Since the 90’s, chitosan
microspheres have been used as controlled drug delivery systems for conventional
drugs, protein drugs and bioactive compounds. Chitosan is particularly useful as
coating material in microencapsulation for controlled release of bioactive compounds.
Chitosan can establish covalent or ionic bonds with the crosslinking agents, for
example, glutaraldehyde which form Schiff bases with amino groups building three
dimensional network, thus increases the internal surface area for absorption and the
encapsulated active substance stays retained, and consequently as controlled release
carrier (Estevinho et al., 2013; Jaya et al., 2010). On the other hand, chitosan and its
derivatives in microencapsulation of peptides and proteins have proven to enhance
their permeation, since they have affinity for enzymes that usually degrade the
peptide (e.g., insulin). Hence, the bioavailability of peptide drugs is increased due to
permeation enhancement by chitosan, its enzyme inhibition and mucoadhesive
properties (Paños et al., 2008).
Chitosan is a good coating material candidate for different microencapsulation
techniques because its cationic properties in acidic conditions make it able to
electrostatically interact with negatively charged molecules or polymers (Riva et al.,
2011). Chitosan can form nanoparticles by ionic gelation with polyphosphates and
with nucleic (Riva et al., 2011). In addition, chitosan is used for simple coacervation
together with incompatible material, such as sodium sulphate. Simple coacervation is
a simple and mild method, however, results in low encapsulation efficiency (Paños et

16
al., 2008). Chitosan is also used for complex coacervation with type B gelatin since
one behaves cationic and the other behaves anionic in solutions at pH value above
the isoelectric point of gelatin. Besides, complex coacervation between chitosan and
the negatively charged lipid, lecithin has produced nanoparticles. Sodium alginate-
chitosan systems have been widely studied. The release of albumin
microencapsulated in this system is influenced by the molecular weight of chitosan
used (Paños et al., 2008).
1.2.4 Crosslinking agent
Crosslinking is a process of hardening of microcapsules which can improve
microcapsule stability via formation of covalent bonds between molecule chains to
form a three-dimensional network of connected molecules. The crosslinking agents
can be chemical or enzymatic, and usually are molecules with at least two reactive
functional groups that allow the formation of bridges between polymeric chains by
covalent bonds (Estevinho et al., 2013). Covalent crosslinking of microcapsules
allows drug release by diffusion due to absorption of water and/or bioactive
compounds instead of dissolution (Estevinho et al., 2013). Aldehydes such as
glutaraldehyde, formaldehyde and glyceraldehye are the most commonly used
chemical crosslinkers in microencapsulation of polymers which contain amino
groups (Hernández-Muñoz et al., 2004b). However, due to the possible toxicity of
chemical crosslinkers, enzymatic crosslinkers such as transgutaminase is usually
applied in microencapsulation of food ingredients (De Jong & Koppelman, 2002;
Dong et al., 2008).
a
b
1.2.4 (a) F
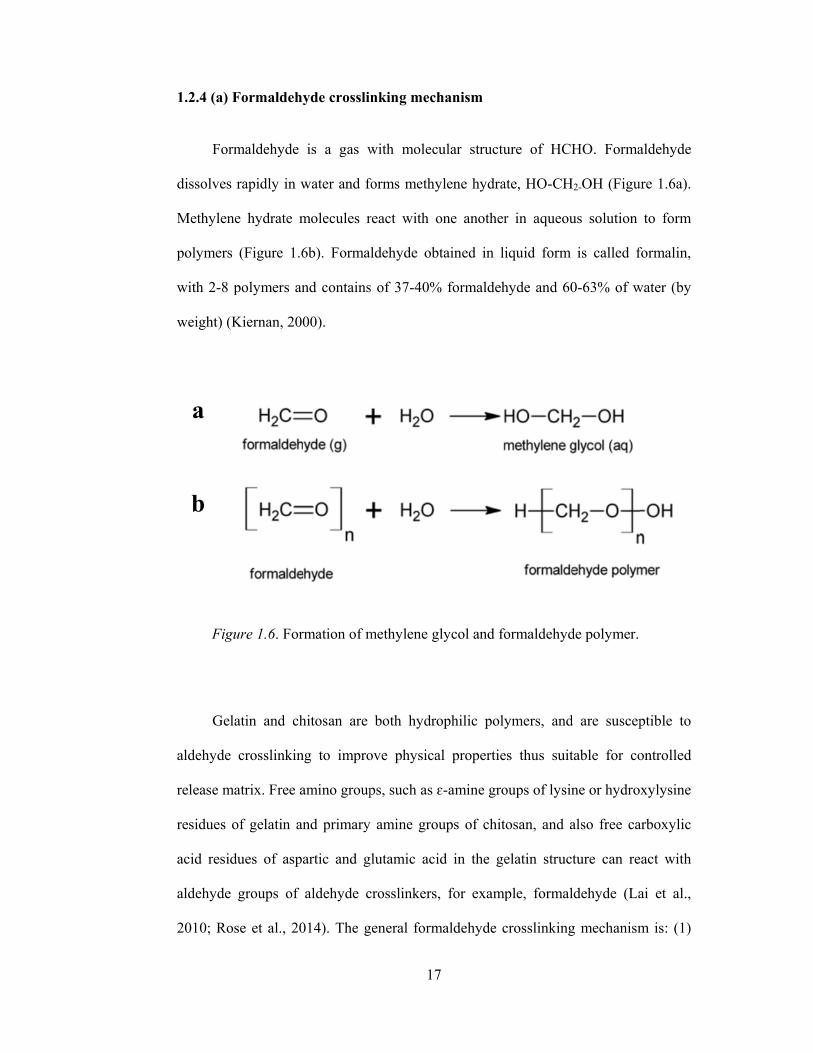
Form
dissolves
Methylene
polymers
with 2-8 p
weight) (K
Figu
Gela
aldehyde
release ma
residues o
acid resid
aldehyde
2010; Ros
Formaldehy
maldehyde
rapidly in w
e hydrate m
(Figure 1.6
polymers an
Kiernan, 200
ure 1.6. For
atin and ch
crosslinkin
atrix. Free a
of gelatin an
dues of aspa
groups of
se et al., 20
yde crosslin
is a gas w
water and fo
molecules r
6b). Formal
nd contains
00).
rmation of m
hitosan are
ng to impro
amino group
nd primary
artic and g
aldehyde c
014). The g
17
nking mech
with molec
forms methy
react with o
ldehyde ob
s of 37-40%
methylene g
both hydro
ove physica
ps, such as ɛ
amine gro
lutamic aci
crosslinkers
general form
7
hanism
ular structu
ylene hydra
one another
btained in li
% formaldeh
glycol and fo
ophilic poly
al propertie
ɛ-amine gro
ups of chit
id in the ge
, for examp
maldehyde c
ure of HCH
ate, HO-CH
r in aqueou
iquid form
hyde and 60
ormaldehyd
ymers, and
es thus suit
oups of lysin
osan, and a
elatin struct
ple, formal
crosslinking
HO. Forma
H2-OH (Figu
us solution
is called f
0-63% of w
de polymer.
d are suscep
table for co
ne or hydro
also free ca
ture can re
ldehyde (La
g mechanism
aldehyde
ure 1.6a).
to form
formalin,
water (by
ptible to
ontrolled
xylysine
arboxylic
eact with
ai et al.,
m is: (1)

18
Aldehyde group of formaldehyde reacts with amine group of matrix leading to
dehydration of the methylol intermediate to yield an active Schiff base. This is a fast
process. (2) Following the polymerization of formaldehyde, the Schiff base reacts
with another amine group to form cross-link –CH2- (methylene bridge) (Wu et al.,
2011). The formation of methylene bridges proceeds much more slowly compared to
the first step. In collagen crosslinking with formaldehyde, the crosslink most often
occurs between the nitrogen atom at the end of the side-chain of lysine and the
nitrogen atom of a peptide linkage (Figure 1.7) (Kiernan, 2000). Such number of
crosslinks increases with time and can lead to an intermolecular and intramolecular
crosslinking network (Kiernan, 2000). In addition, collagenous samples such as
gelatin may form inter- and intramolecular crosslinks with cyclic structure within
collagen fibers (Bigi et al., 2004).
Figure 1.7. Formaldehyde crosslinking: formation of methylene glycol and methylene bridge. Adapted from Kiernan (2000).

19
Inner cavity
Core
Drug Drug
Matrix
(a) (b)
Capsule shell
1.2.5 Classification of microcapsules and microspheres
Microparticles can be classified according to their structure, namely,
microcapsules and microspheres. Microcapsules consist of a polymeric shell
(envelope or wall) and an encapsulated active product (core material) located within
the shell. Thus, the core and the wall are well-defined in microcapsule systems.
Microspheres are in strict sense, spherical empty particles because the drug substance
is either homogeneously dissolved or dispersed in a polymeric matrix, thus no well-
defined wall exists (Kumar et al., 2011; Kvitnitsky et al., 2005). In addition, for large
size particles, microbeads, beads, spheres and spherical particles are also terms used
alternatively for microcapsules and microspheres (Kvitnitsky et al., 2005). Figure 1.8
shows the morphologies of microcapsule and microspheres. Microspheres are
essentially spherical in shape, whereas microcapsules may be spherical or irregular in
shape.
Figure 1.8. Schematic morphologies of (a) microcapsule and (b) microsphere. Adapted from Lembo and Cavalli (2010).
20
1.2.6 Coacervation microencapsulation
Coacervation encapsulation is a physiochemical process, and is classified as
simple or complex. Simple coacervation systems only contain one colloidal solute
(e.g., only gelatin), while in complex coacervation systems contain more than one
solute (e.g., gelatin and gum acacia) (Barbosa-Cánovas et al., 2005). In general, this
technology consists of three steps which are carried out under continuous agitation,
that include: (1) formation of three immiscible chemical phases, (2) deposition of
coating, and (3) rigidization of the coating. Briefly, the coacervation
microencapsulation process is initiated by either changing the pH or temperature of
the colloidal system, or adding a non-solvent or another complete chemical (e.g.,
sodium sulfate) to the colloidal system which contains the active ingredient (core
material). Consequently, a two-phase system is created that consist of the colloid-rich
phase (appearing as an amorphous cloud) and the colloid-poor phase/aqueous phase.
Deposition of the newly formed coacervate phase around the active ingredient (core
material) suspended or emulsified in the same reaction media forms small and still
unstable microcapsules. Rigidization of the capsule wall can be done by crosslinking
with chemical crosslinker (e.g., glutaraldehdye) or enzymatic crosslinker (e.g.,
transglutaminase), or by adjusting temperature or pH of the colloid system. The final
steps of the process include collecting, washing and drying (Barbosa-Cánovas et al.,
2005; Gouin, 2004; Sachan et al., 2006). This is a high payload microencapsulation
technique, up to 99% with achievable yield (Gouin, 2004).
1.2.6 (a) Complex coacervation systems
Complex coacervation was first introduced by Bungenberg de Jong (1929) in
their investigation for the system of gelatin-gum arabic. The name complex

21
coacervation is to distinguish from simple coacervation where the complex
coacervation process involves the interaction of two oppositely charged
polyelectrolytes as opposed to the simple coacervation that is based on single
biopolymer. Complex coacervation is a liquid-liquid phase separation phenomenon
that occurs as a consequence of electrostatic interaction between the two oppositely
charged polyelectrolytes in a solution (Milanović et al., 2014). The neutralization of
the opposite net charges of polyelectrolytes in the mixed solution separates the
solution into a highly concentrated coacervate phase in the form of microdroplets and
a dilute bulk phase (Bungenberg de Jong, 1949; Strauss & Gibson, 2004).
Complex coacervation may result in a mixture of oppositely charged
polyelectrolytes (PE-PE) and polyelectrolytes with oppositely charged colloids
(colloid-PE), such as micelles, proteins or dendrimers in aqueous media (Kizilay et
al., 2011). Gelatin A-gelatin B and gelatin B-chitosan systems are examples of PE-
PE and colloid-PE coacervations, respectively. Figure 1.9 illustrates the process of
microencapsulation by complex coacervation.
1.2.6 (b) Complex coacervation microencapsulation process
The deposition of the coacervate onto the core droplets to form the
microcapsule shell and maintain the integrity of shell and size depend on several
processing parameters. These parameters include polymer type, molecular weight,
charge density, concentration of polymers and their ratio, pH and temperature of the
system, and cooling rate. Among these factors, pH of the coacervation system and
polymers mixing ratio are the most studied factors in complex coacervation
microencapsulation (Koh & Tucker, 2011; Liu et al., 2009; Shinde & Nagarsenker,
2009; Wang et al., 2014; Xiao et al., 2011). This is because improper mixing ratio of

22
oppositely charged polyelectrolyte can cause precipitation due to imbalance of
charge density.
During the coacervation process, the temperature is above the melting point of
colloid polymer (i.e., gelatin) under constant stirring, thus coacervate formed is
initially a liquid. This allows the coacervate to engulf the dispersed core material
droplets or particles, thereby coating them with a thin film of liquid coacervate.
Thereafter, cooling of the coacervates below its gel temperature will settle the gel
structure of the coacervate (Thies, 2007). For example, when gelatin gel is cooled
below melt temperature results the random coil polypeptide chains link up to form
collagen-like triple helices for part of their length (Strauss & Gibson, 2004). This
transforms the thin liquid film that surrounds the small droplets of core material into
a thin gel coating. The changes of temperature not only change the coacervate from
liquid form to gel form, but also change the viscosity and rheology of the coacervate,
thereby producing a major impact on the success of a complex coacervation
encapsulation process (Thies, 2007). Crosslinking of microcapsules has improved its
stability against mechanical force and modified drug release (Alvim & Grosso, 2010).
Figure 1.10 illustrates the formation of microcapsules by coacervation.

23
Figure 1.9. Process of microencapsulation by complex coacervation: (a) emulsification or suspension of core ingredients in the vehicle phase (typically aqueous solution); (b) induce complex coacervation by addition of a second complexing hydrocolloid; (c) solidification of wall materials and crosslink to stabilize the microcapsules; and (d) washing and drying.
Core ingredients
Aqueous solution, e.g., chitosan
50 °C (a)
5-10 °C
Temperature cools down for coagulation of coating materials. Follows by addition of crosslinking agent, i.e., formaldehyde or glutaraldehyde
(c)
Isolated microcapsules
Washing and drying of the microcapsules
(d)
(b)
Addition of second hydrocolloid solution, i.e., type B gelatin, and adjust pH to induce coacervation
50 °C

(a)
(c)
Figure 1.dispersed deposition
Drug
10. Schemaliquid or
n of microdr
g particles
atic represesolid drug
roplets at th
24
(
(
entation of g particles, he surface, a
4
(b)
(d)
microencap(b) induct
and (d) fusio
Polyme
psulation btion of phon into a me
er particles
y coacervaase separatembrane.
ation: (a) tion, (c)