complete solutions for the industrial hemp market: flower
TRANSCRIPT

Analytical and Testing Instruments for Hemp & Hemp-Based Products
Complete Solutions for the Industrial Hemp Market: Flower, Stalk, Seed, Leaves & Root
• Animal Bedding
• Compost
• Mulch
LEAVES
• CBD Oil
• Cosmetics
• Food
FLOWERS
FOOD
• Animal Feed
• Beer
• Essential Fatty Acid
Food Supplements
• Protein Powder
• Seed Hearts
• Seed Oil
PERSONALCARE
• Balms
• Cosmetics
• Lotions
• Shampoos
• Soaps
INDUSTRIALPRODUCTS
• Coatings
• Fuel
• Lubricants
• Oil Paints
• Printing Inks
• Solvents
• Varnishes
SEEDS
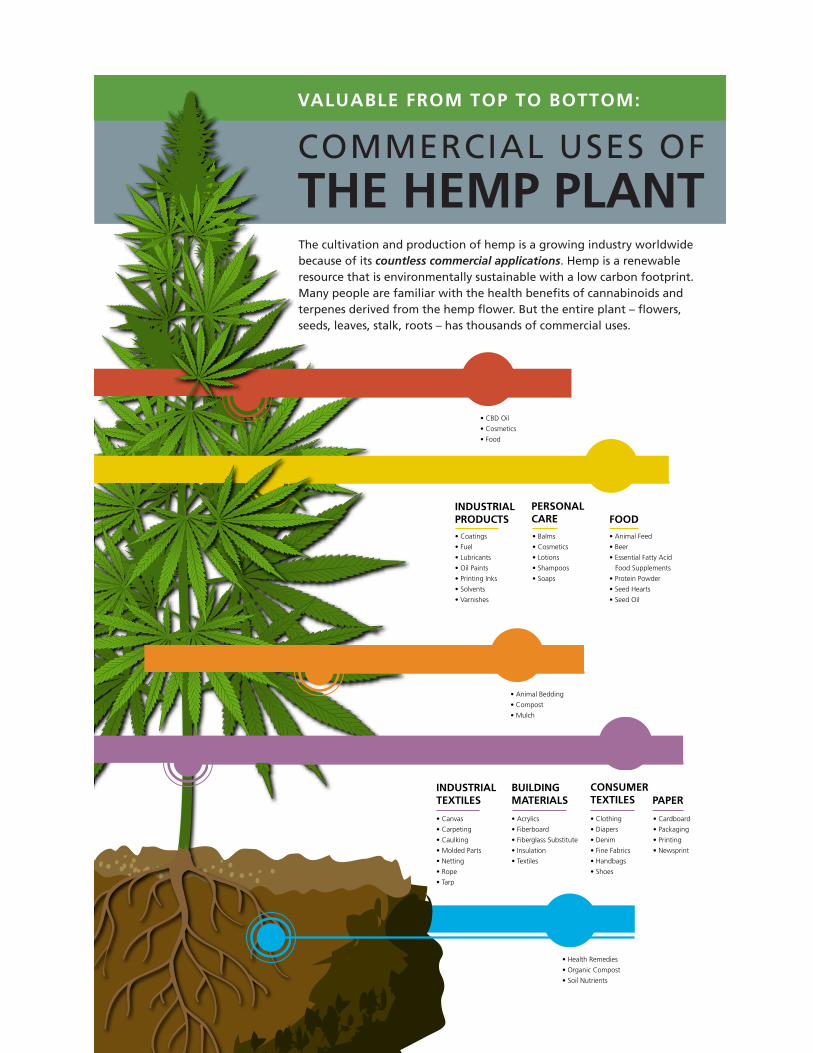
The cultivation and production of hemp is a growing industry worldwide because of its countless commercial applications. Hemp is a renewable resource that is environmentally sustainable with a low carbon footprint. Many people are familiar with the health benefits of cannabinoids and terpenes derived from the hemp flower. But the entire plant – flowers, seeds, leaves, stalk, roots – has thousands of commercial uses.
CONSUMERTEXTILES
• Clothing
• Diapers
• Denim
• Fine Fabrics
• Handbags
• Shoes
PAPER
• Cardboard
• Packaging
• Printing
• Newsprint
INDUSTRIALTEXTILES
• Canvas
• Carpeting
• Caulking
• Molded Parts
• Netting
• Rope
• Tarp
BUILDINGMATERIALS
• Acrylics
• Fiberboard
• Fiberglass Substitute
• Insulation
• Textiles
STALK
• Health Remedies
• Organic Compost
• Soil Nutrients
ROOTS
VALUABLE FROM TOP TO BOTTOM:
COMMERCIAL USES OFTHE HEMP PLANT

3Analytical & Testing Solutions for Industrial Hemp
Instruments and Equipment for the Testing and Analysis of Hemp & Hemp-Based ProductsHemp in the United States and worldwide is a hot topic because of its green nature, sustainability, and zero or low carbon footprint. While it appears most of the hemp world has been flower-centric on the health benefits of cannabinoids and terpenes, this is only the tip of the iceberg with respect to applications. The entire plant, including flower, seed, stalk, leaves and root, has 50,000 different uses.1
According to Canada Hemp Food Ltd.,1 the seeds may be used for industrial products, foods, and body care items. The stalk can be used for consumer textiles, industrial textiles, paper and building material. The leaves can be used for animal bedding, mulch, and composting. The roots can be used for organic composting, nutrients, and a remedy for other health conditions. For complete information on analysis of the hemp flower for cannabinoids, terpenes and contaminants, see Shimadzu’s “Hemp Testing Laboratory Solutions” brochure, which can be downloaded from www.GrowYourLab.com, as well as many other related applications.
This communication will present a limited number of the potential 50,000 different uses. However, Shimadzu is the only worldwide company able to provide analytical instruments, physical testing machines, and X-ray equipment for complete profiling of the hemp plant from development to the final product.
1Canada Hemp Foods Ltd., https://canadahempfoods.com/

4 www.GrowYourLab.com
Table of Contents
Flower: QA/QC Testing • Page 5
Stalk: Textiles • Page 6
Stalk: Geotextiles & Construction • Page 9
Stalk: Natural Fiber Composites • Page 10
Stalk: Paper Products • Page 12
Stalk: Energy • Page 13
Seed: Energy • Page 14
Seed: Foods • Page 15
Leaves: Food & Compost • Page 18
Roots: Nutrients & Contaminants • Page 19
Environmental Monitoring • Page 21
By Application
HPLC/UHPLC • Pages 5, 13
Physical (Tensile) Testing • Pages 6, 9, 10, 12
UV-Vis-NIR Spectroscopy • Page 7, 21
Infrared Spectroscopy • Page 8
X-Ray Diffraction • Page 8
Thermal Analysis • Page 11
Industrial X-Ray Computed Tomography • Page 11
Particle Size • Page 12
Balances • Page 12
GC • Pages 13, 14, 16, 18, 28
LC-MS • Pages 17, 23
MALDI-TOF MS / Protein Sequencing • Page 17
AA • Pages 18, 26
GC-MS • Pages 19, 27
EDXRF • Page 20
IC • Page 22
TOC • Page 25
ICP-OES/ICP-MS • Page 26
By Instrument/Technique
On different pages of this brochure, we have added links to brochures on related topics, including QA/QC testing and analysis of hemp, CFRPs, food development, and greenhouse gases. We encourage you to download these brochures to learn more about our full range of instruments and how we can address your application requirements.

5Analytical & Testing Solutions for Industrial Hemp
Flower: QA/QC TestingHemp growers benefit tremendously from testing. Whether meeting state requirements or certifying a product, laboratory testing reduces your risk and ensures delivery of a quality product. And, as medicinal and recreational hemp markets continue to grow, analytical testing will ensure that consumers are receiving accurately labeled products that are free from contamination.
Shimadzu is ready to assist you as you grow your laboratory, providing platforms for the following analyses:
► Potency Testing ► Terpene Profiling► Pesticide Analysis► Mycotoxins Analysis► Residual Solvents
► Heavy Metals► Moisture Content► Particle Size Testing► Research
Potency testing is the starting point for most labs as the Hemp Farming Act of 2018 removes the plant Cannabis Sativa L. from the controlled substances act if it contains no more than 0.3% THC on a dry weight basis. Therefore, it is important to accurately distinguish hemp from cannabis using a quantitative analysis of the material. Shimadzu offers numerous options to test potency, including the HPLC-based Hemp Analyzer. A comprehensive package integrating instrument hardware, software, consumables, and analytical workflow, the Hemp Analyzer is ready to use after one day of installation and testing, and requires no time-consuming method development on the part of the analyst.
Shown to the right is an example of a separation of CBD, Δ9-THC, THCV, and 8 other commonly requested cannabinoids in under 10 minutes.
In addition to instruments, Shimadzu offers optional FDA 21 CFR Part 11 compliance software required for labs. LabSolutions DB/CS provides comprehensive features, controls and functionality that assure data integrity in your hemp laboratory. The broad nature of these controls allows a compliant data management environment to be quickly and easily established whether working with a small number of instruments within a single laboratory or with multiple instruments across a large number of laboratories.
2.0 3.0 4.0 5.0 6.0 7.0 min
0
10
20
30
40
50
60
mV
CBD
V
THC
VC
BDC
BG
CBD
A
CBG
A
CBN
∆9-
THC
CBC TH
CA
∆8-
THC
Download our brochure to learn more about our platforms for QA/QC testing, peak harvesting analysis and hemp research.

6 www.GrowYourLab.com
The hemp stalk consists of an outer layer called the bast fiber and an inner layer of woody pith. The outer layer is used for textiles while the inner layer is used for fuel, building materials, and animal bedding.
Examples of hemp textiles include woven and knit fabrics, non-woven fiber mats, yarns, and rope. Fabrics can be made of 100% hemp or blended with other fibers such as cotton, flax, or silk. For example, clothing material could be produced from a blend of 30% cotton and 70% hemp fiber. A blended product may be made softer or more durable. There are many advantages of hemp over cotton. Cotton only grows in moderate climates and requires more water and pesticides. One acre of hemp can produce as much fiber as up to three acres of cotton. Hemp is also a stronger fiber and more mildew resistant.
Hemp fabrics can be used for T-shirts, dresses, hoodies, underwear, socks, other forms of apparel, as well as household textiles such as blankets, duvets, towels, tablecloths, and upholstery. Hemp fibers are fine enough to make fabrics with a thread count of 250-300, which is considered percale, a closely woven fine fabric used for sheets. An early harvest will produce a softer fabric. The fabric is very breathable, has high-moisture-wicking abilities, and low heat-retention abilities. The fabrics have a low possibility of pilling where short or broken fibers group together because of abrasion and become tangled in a tiny knot or ball, known as a pill.
Stalk: Textiles
The physical properties of textiles are an interdependent result of fiber type, yarn spinning method, and fabric construction. A universal test machine, such as the Shimadzu EZ-X, measures force and displacement while deforming a sample. They can be configured with many different types of grips and accessories to evaluate the myriad properties of textile products that determine their feel and function, such as fabric stretchability, tear resistance, burst strength, seam strength, and fiber elongation.
Tensile Testing
Stretchability of FabricsHemp fabrics are considered to have medium stretchability or give. Any of these parameters may be changed by blending with other fibers. Shimadzu’s full line of universal tensile testing machines is capable of testing many conventional tests of fabrics or other materials, such as strechability, strength, and tear resistance.
Generally, tensile testing of fabrics occurs in two directions: the warp (length) and the weft (width), also referred to as the woof or fill. Shown is an example of tensile testing of a sheet.

7Analytical & Testing Solutions for Industrial Hemp
Transmittance Spectra of Fabrics with UV-3600iBlack & Red: Designed for Natural IlluminationBlue: Designed for Thermal Insulation
UV-Vis-NIR Spectroscopy
Analysis of Natural Illumination and Thermal InsulationA variety of functional materials, such as fabrics, are being developed for their thermal insulation properties as well as to provide natural lighting. It can be presumed that increasing transmittance and lowering reflectance produce illuminating properties, while lowering transmittance and increasing reflectance produce thermal insulation properties. Shown are transmission and reflectance spectra of fabrics utilizing Shimadzu’s UV-3600i Plus with the ISR-1503 integration sphere.
Analysis of Dye ColorsTextile color is an important consideration when selecting and purchasing a product. Shimadzu’s full line of UV-Vis-NIR spectrophotometers are useful for analysis of dye colors through final product. Shimadzu’s compact UV-2600i (Double-Beam, Single Monochromator) and UV-2700i (Double-Beam, Double Monochromator) are universal, research-grade spectrophotometers that can be used in a wide range of fields for material characterization (solid/liquid), with the capability of measuring very high absorbing samples and expandability to 1400 nm.
Reflectance Spectra of Fabrics with UV-3600iBlack & Red: Designed for Natural IlluminationBlue: Designed for Thermal Insulation
Stalk: Textiles

8 www.GrowYourLab.com
Stalk: TextilesFTIR and Infrared Microscope
Determination of Pectin Removal LevelDifferentiation of Textile FibersFTIR spectroscopy may be used to determine the pectin removal level during the purification process by monitoring the functional groups in the transmission mode using the Shimadzu IRTracer-100 FTIR spectrometer (pictured in image on the left). Using the attenuated total reflectance (ATR) accessory for ATR-FTIR the instrument is capable of differentiate textile fibers by their chemical composition, commonly classified by their origin as natural (e.g. hemp, cotton, linen, silk, wool), regenerated (e.g. viscose hemp, cellulose acetate) and synthetic (e.g. polyester, polyacrylic, polyamide).
The AIM-9000 microscope (pictured in image on the right) used in conjunction with FTIR helps identify visible and chemical contaminants, breaks in the fiber, and blends of fibers.
Chemical Structure of Pectin
X-Ray Diffraction (XRD)
Determination of CrystallinityDuring the different stages of chemi-mechanical treatment of the fibers, powder X-ray diffraction (XRD) in transmission mode can be used to determine the crystallinity throughout the process. The goal of the treatment process is to remove amorphous aggregates and increase the crystallinity. Elimination of amorphous compounds, with the increase of crystallinity index, is attributed to the ordered close packing of macromolecules of cellulose in the fibers and strengthening of the hemp fibers.
Characteristics Measurement Methods InstrumentMorphology AFM SPM-9700HT
Width, height and length AFM SPM-9700HT
Optical transmittance UV-Vis spectrophotometry UV-2600, UV-1900
Surface functional types FT-IR IRTracer-100, IRSpirit
Thermal stability TGA TGA-50
Constituent sugar content HPLC Nexera Series
Acid-soluble metal content ICP, ICP-MS ICPE-9820, ICPMS-2030
Crystal structure X-ray diffraction XRD-7000
The following table lists characteristics of individualized cellulose nanofibril samples that are required to be measured or identified, measurement methods, and instruments used.
Download our “Application Notebook: Solutions for Cellulose Nanofiber” or request a printed version using code C10G-E076.

9Analytical & Testing Solutions for Industrial Hemp
Geotextiles
Geotextiles are soil reinforcements used in environmental engineering and construction projects to prevent erosion, aid in drainage, separate structural layers, and improve vegetation establishment. Due to their long fiber length and strength, hemp fibers can be used in geotextiles in the form of fabric, fiber mats, and nets. In contrast to synthetic plastic geotextiles, hemp is renewably sourced and biodegradable, so it does not contaminate the environment at the end of its useful life. Shimadzu’s AGS-X Series Universal Electromechanical Test Frames are ideal for testing the strength of geotextiles.
Stalk: Geotextiles & Construction
Worker laying geotextile in preparation for new building used for separation and reinforcement
Construction Materials
Hemp hurd and fibers have found use in several construction materials, including concrete, insulation, and particle board. When hemp hurds are incorporated to lime-based cement, they create a renewably sourced, lightweight, and insulating building material that can replace concrete and synthetic insulation in some applications. Hemp stalk materials are also possible replacements for wood chips in fiberboard and particleboard materials. Typical tests for construction materials include compression and bending tests, and evaluation of changes in physical properties due to environmental exposure. Shimadzu’s UH-X hydraulic test frames can achieve the forces required for testing high-strength construction materials, and the software includes the concrete test control software standard.
Compression testing of explosion proof cement
Compression testing of non-explosion proof cement
Shimadzu’s UH-X hydraulic test frames compression for concrete as well as hempcrete
Shimadzu’s AGS-X Series Universal Electromechanical Test Frames for geotextiles testing
Shimadzu’s HyperVision HVP-X2 high-speed video camera enables recording at up to 10 million frames/second for visual compression and tensile monitoring.
Watch a video of cement exploding at 10,000 frames/second:https://www.youtube.com/watch?v=PlZY6vyP0b8
Download our brochure for concrete, also useful for hempcrete, or request a printed copy using code C221-E012.

10 www.GrowYourLab.com
Tensile Testing
Natural fiber composites combine plant fibers, such as hemp, with a polymer matrix to create materials with improved rigidity and strength and decreased weight. Composites made with natural fibers have potential advantages over glass and carbon fiber reinforcements in many applications due to the right balance of weight, cost, and performance in addition to generally having a much lower energy of production.
They are already widely used in the automotive industry for interior panels such as doors and trunk liners and are expected to be incorporated into more components as their properties are improved. Bending and shear testing are important because composite strength can vary depending on the direction that force is applied. Natural fiber composites may also be more sensitive to humidity and temperature, so performing physical testing in thermal chambers is necessary.
Stalk: Natural Fiber Composites
00
10
20
30
40
50
60
70
80
90
100
110
120
2 4 6 8 10
Displacement (mm)
Stre
ss (
N/m
m2)
12 14 16 18
The image above shows the results of a 3-point bending test performed on a composite material to determine flexural modulus.
The AGX-V universal test frame offers the highest precision and control for accurate evaluation of composite mechanical properties. Specialized shear jigs are available to test the force required to separate the fibers and layers within the composites. Bending tests, performed on either a 3 or 4-point bend fixture, measure the rigidity of a material and induce both tensile and compressive forces to determine the force that causes a material to rupture. For high-force testing of cement, high-capacity hydraulic test frames are available.
3-point bending on a Shimadzu Universal Testing Machine

11Analytical & Testing Solutions for Industrial Hemp
Stalk: Natural Fiber CompositesThermal Analysis
A variety of thermal properties of composite resins and industrial chemicals can be determined using Shimadzu thermal analysis instruments (TGA, DSC, TMA, and DTG) and Capillary Flow Technology (CFT), such as glass transition temperature, degradation or melting temperature, purity analysis, and curing behavior.
Shown below is a DSC measurement of a hardening reaction of an epoxy resin at various points of heat treatment. As the reaction progresses, the glass transition temperature increases and the enthalpy of reaction decreases.
Industrial X-Ray Computed Tomography (CT)
Industrial X-Ray CT systems provide detailed visualization of the internal structure and features of an object. Scanning composites can identify fiber position and alignment, calculate volume fraction of different components, and identify the size and distribution of pores. Powerful color processing software enables observation and statistical calculations of different internal regions. CT scanning is also a useful tool for identifying cracks, voids, and disconnections for failure analysis.
This CT scan of the fracture area of a fiber composite illustrates areas of delamination and cracking.
Download our brochure for more solutions to fiber reinforced plastics using additional instruments and applications or request a printed copy using code C10G-E037A.

12 www.GrowYourLab.com
Hemp paper from the stalk can be used for printing, newsprint, packaging, cardboard, and other paper products. Paper products can be made of the long bast fiber or the hurd (or pulp). The different parts of the stalk may have different applications. The fiber bast paper has been reported to be thin, tough, brittle, and rough while the hurd has been reported to be thicker, easier to make, not as strong, with more daily applications. Depending on the source of information, dried hemp has been reported to have between 50-85% cellulose, the main ingredient in paper, while trees are in the 30-50% range. Therefore, the other 50-70% of chemical compounds from trees are required to be removed. Relatedly, hemp has lower concentrations of lignin, which must be removed during the process of making paper products. The lignin concentrations are 5-24% and 20-35% for hemp and trees, respectively. Hemp paper can be bleached with hydrogen peroxide instead of toxic chlorine or dioxin chemicals used with paper from trees.
Hemp reaches maturity in 3-4 months while trees require 20-80 years and has four times more fiber than a forest using the same land mass. Thus, hemp paper can be produced at a much faster rate. It also has been reported that hemp paper products can be recycled eight times, while tree products can only be recycled less than half the number of times.
Stalk: Paper Products
While on-line sensors may be available to measure some production parameters, lab scale method development may require laboratory instruments. Some parameters measured are weight, moisture profile, ash content, color, brightness, smoothness, gloss, coat weight, formation, porosity, fiber orientation, surface properties, tear strength, and opacity. For example, Shimadzu’s EZ-X could be used for determination of breaking strength, breaking length, tearing strength on the long and short side, elongation, fold resistance and more. Shimadzu offers analytical, top loading and moisture balances for weight and moisture profiles.
In the paper industry, coatings, fibers, fillers, sizing agents and other items affect a paper’s properties, such as brightness, color, gloss, and opacity. Shimadzu’s SALD-2300 particle size analyzer is ideal for this application with a measurement range of 17 nanometers to 2500 microns. Shimadzu EZ-X Universal Tester tearing paper
100
80
60
40
20
00.01 0.05 0.1 0.5 1 5 10 50 100 500 1000 5000
SALD-2300 Particle Size Analyzer
Example of particle size distribution (um)
Shimadzu MOC63 Moisture Balance. Download the brochure or request a printed copy using code C054-E067B.
General Balance Brochure. Download the brochure or request a printed copy using code C054-E032T.

13Analytical & Testing Solutions for Industrial Hemp
Stalk: EnergyThe 2007 federal legislation that encouraged production of biodiesel in the United States has also increased production of ethanol in an effort to offset dependence on fossil fuels and reduce carbon dioxide emissions. The cellulosic material in hemp can be converted into sugars and fermented into ethanol to be used as a supplement in gasoline, much as has been done with corn and soybean biomass.
High Performance Liquid Chromatography (HPLC)
Careful attention must be paid to the fermentation process to guarantee its efficiency and the purity of the final ethanol product. High performance liquid chromatography (HPLC) is an ideal method for monitoring the conversion of sugars to alcohol during fermentation. The Shimadzu Bioethanol Analyzer is a turnkey analyzer, well suited to plug-and-play operation for this application.
0.0 2.5 5.0 7.5 10.0 min0
50
100
150
200
250
300
350
400mV
12 3
4
5
6
7
8
34 hr
HPLC chromatogram showing conversion of sugars to ethanol during fermentation 34 hours after the process began. Peaks are 1) DP4+ (oligosaccharides with ≥4 degrees of polymerization), 2) DP3 (oligosaccharides with 3 degrees of polymerization), 3) Maltose, 4) Glucose, 5) Lactic acid, 6) Glycerol, 7) Acetic acid, 8) Ethanol
GC-FID chromatogram methanol and ethanol content in a fuel ethanol denatured with gasoline by ASTM method D5501.
Gas Chromatography (GC)
After fermentation is complete, the produced ethanol must be denatured to ensure that it is not taxed nor used for human consumption. Following test methods such as ASTM D5501, which specifies GC-FID, allows for the determination of the ethanol content in ethanol denatured with methanol or gasoline.

14 www.GrowYourLab.com
Seed: EnergyWith the passage of federal legislation in 2007, production of biofuels, such as biodiesel and ethanol, in the United States has increased in an effort to further energy independence and combat carbon dioxide emissions. Much like soybeans, the oil within hemp seeds can be extracted and converted into biodiesel through a process called transesterification. Because hemp can be cultivated on less fertile land with less human intervention, it is thought that hemp-based biodiesel may offset the demand for soybean-based biodiesel.
Any biodiesel and biodiesel blend must meet stringent regulations to ensure that it functions safely and efficiently as a fuel, such as those laid out in ASTM D6751 for B100, or 100% biodiesel, and D7467 for B6-B20, or 6-20%, biodiesel blended with conventional petrodiesel.
Various properties of the biodiesel, including glyceride content, metals content, and assessment for residual methanol used during fuel production, must be met. These factors relate to the combustion and lubricating properties of the biodiesel as well as the stability of the fuel itself once produced. Such regulation guarantees that biodiesel and biodiesel blends are safe and effective to use in properly equipped vehicles.
Trio
lein
min 03 02 01 0
Gly
cerin
IS
No.
1
Mon
oole
in
IS N
o.2
Dio
lein
GC-FID analysis of biodiesel for total glycerides according to ASTM D6584
0.0
0.5
1.0
1.5
2.0
2.5
3.0
3.5
4.0
0.0 2.5 5.0 min
Met
hano
l
2-Pr
opan
oluV (x 100,000)
HS-GC-FID chromatogram for residual methanol in biodiesel according to EN 14110
Download our brochure to learn about more analyticalsolutions for the renewable fuels industry.

15Analytical & Testing Solutions for Industrial Hemp
Seed: FoodsHemp seeds are an excellent source of nutrition and, thus, are very beneficial to humanhealth. They are high in fiber, protein, vitamins, and the “good fats”, like Omega-3 and Omega-6 fatty acids.
Hemp seeds contain all nine essential amino acids, and important vitamins (A, B, C, and E) and minerals (Ca, Mg, K, P). As a bonus, there are no known food allergens in hemp seeds.
According to the USDA National Nutrient Database, a two-tablespoon serving of hemp seeds weighing 20 g contains 6.3 g protein, 9.8 g fat, and 1.7 g carbohydrates (incl. 0.8 g fiber).
The US FDA has classified hemp seeds as GRAS (Generally Recognized As Safe), indicating that hemp seeds are safe in foods and won’t require further approval. This FDA approval clears the way for hemp seeds and hemp seed oil to become part of mainstream cuisine.
Currently, there are no official methods for hemp seed and hemp seed oil as food. Methods released on hemp analysis are primarily focused on cannabinoids (mostly CBD and THC).
For nutritional analysis of hemp seeds and hemp seed oil, methods from other, similar seeds and oils can be used, e.g., soy, chia, and castor. Shimadzu’s Advanced Food Solutions provide the analytical tools to identify and quantify the nutritional characteristics of hemp seeds.
Download our brochure for our guide to instrumental analysis in Food Development or request a printed version using code C10G-E060.
Download our brochure to learn more about the full portfolio of food testing instruments from Shimadzu or request a printed version using code C10G-E052.
As hemp seeds find their way into our kitchen more frequently, more methods for hemp seeds analysis will be developed. And Shimadzu, with decades of experience serving the food sciences industry, can provide all the advanced and innovative analytical tools needed to fully characterize this superfood.

16 www.GrowYourLab.com
Gas Chromatography
Analysis of Fatty Acids Analysis using Gas Chromatography (GC) is a suitable measurement technique, as GC has a high separation capability. In this technique, the fatty acids are first derivatized by methyl esterification to produce fatty acid methyl esters (FAME) with sufficient volatility. However, localization of the double bond position in unsaturated FAMEs is difficult, even when using mass spectrometry.
To overcome this difficulty, a new analysis technique was developed: Solvent Mediated Chemical Ionization (SMCI). It is a soft ionization method using an organic solvent. The new Shimadzu SMCI unit makes it possible to introduce acetonitrile, which is necessary in this double bond localization technique, into the analytical instrument.
Seed: Foods

17Analytical & Testing Solutions for Industrial Hemp
Liquid Chromatography / Mass Spectrometry
Analysis of VitaminsThough many AOAC Official Methods for vitamins employ microbiological assays or LC with fluorescence detection, use of LC-MS/MS techniques in this field is rising because they offer advantages over these other methods, including specificity, speed, ability to detect impurities, and broad applicability. The Shimadzu LCMS-8040 with the Nexera UHPLC provides excellent instrumentation for fat-soluble vitamin analysis.
Seed: Foods
MALDI-TOF MS / Protein Sequencing
Protein AnalysisTraditional Edman sequencing avoids mass dependency and the use of databases by analyzing each amino acid from the N-terminus one at a time in sequence. Unfortunately, Edman has its own limitations in providing high sequence coverage. Mass spectrometry has become an indispensable tool for researchers looking to sequence peptides. Although effective in many cases, sequencing by In Source Decay (ISD) faces a few challenges, e.g., its ability to provide reliable sequence information including isobaric amino acids, database dependency, and low molecular weight interferences.
Combining the powerful capabilities of MALDI-TOF MS (MALDI-8020) and Edman sequencing (PPSQTM-50A Gradient System) provides a more accurate and complete N-terminal sequence of peptides.
0.00 0.25 0.50 0.75 1.00 1.25 1.50 1.75 2.00 2.25 2.50 2.75 3.00 3.25 3.50 3.75 4.00 4.25 4.50 4.75 5.00 5.25 min
0
50000
100000
150000
200000
250000
300000
350000
400000
450000
Vit
amin
E A
ceta
te
Vit
amin
K1
Vit
amin
D3 V
itam
in A
Pal
mit
ate
bet
a-C
aro
ten
e

18 www.GrowYourLab.com
Concentrated at the top of the hemp plant are the leaves, which can be used for food, animal bedding, mulch, and compost. Hemp leaves are edible and can be used in raw leafy vegetables in salads because they are rich in digestible proteins. In fact, the hemp leaf has been reported to have five times more protein then lettuce. The leaves are rich in omega-3 and omega-6 fatty acids, as described in the “Seed: Food” section of this brochure.
In addition, the leaves are rich in polyphenols, acting as powerful antioxidants. Our bodies get these micronutrients through some plant-based foods. There are health properties for fighting against cardiovascular disease, diabetes, and digestive issues. Antioxidants have been referred to as “free-radical scavengers” and protect against cancer and other diseases. Polyphenol extracts have been measured in many foods by various instruments, including UV, FTIR, LC, LC-MS(/MS) and GC-MS(/MS). See the “Seed: Food” section of this brochure.
Leaves: Food and Compost
The leaves, which contain levels of iron and magnesium comparable to kale, can also be pressed to make juices. The elements can be measured by Atomic Absorption (AA), Inductively Coupled Plasma (ICP), ICP with a mass spectrometer (ICP-MS), and EDXRF, a technique described in the “Roots” Nutrients…” section of this brochure.
Hemp leaves are also used in meat dishes for refreshing flavor and replacing parsley and mint. Hemp leaves can be thought of as a superfood, just as the hemp seed. The leaves contain trace or no cannabinoids. If the leaves contain cannabinoids, they would be in the acidic form as Cannabidiolic acid (CBDA) and Δ9-Tetrahydrocannabinolic acid (THCA); the latter form would not induce the so-called “high” like THC. The leaves also contain beneficial terpenes as described in the “Flower: QA/QC Testing” section of this brochure.
The Shimadzu Atomic Absorption AA-7000 with ASC-7000 autosampler is used for measuring elemental nutrients.
Hemp leaves can be made into mulch and compost. Compost helps plant growth when added to soil because of organic material. The EPA has reported that 28% of what is thrown away could be composted. Recycling the hemp leaves helps prevent methane and other greenhouse gases from being produced in landfills. In summary, compost enriches soil, suppresses plant disease, reduces pesticides, produces beneficial bacteria and fungi, and reduces greenhouse gases, thus lowering carbon footprint.
Download our brochure to learn more about our system for analysis of greenhouse gases or request a printed
version using code C184-E041.

19Analytical & Testing Solutions for Industrial Hemp
Gas Chromatography / Mass Spectrometry
Determination of TriterpenesHemp roots can be used for organic composting, nutrients, and as remedies for health conditions. The hemp root contains little to no cannabinoids and no THC, which produces the so-called “high”. Cannabis Therapy* reported that the oldest Chinese Herbal Atlas describes hemp root as being used as a painkiller and to help stop bleeding during difficult births. Ancient Romans used the root for cramps, joint pain, and arthritis. Hemp root tea has been reported to relax muscles, assist with digestion, and remove elemental contaminants. The hemp root has been reported to have anticancer properties because of the triterpenoid chemicals: friedelin and epifriedelanol.
The determination of triterpenes is performed by Gas Chromatography-Mass Spectrometry (GC-MS). To the right is Shimadzu’s GCMS-QP2020 NX with AOC-6000 Plus autosampler for liquid injection, headspace sampling, and solid phase micro extraction (SPME).
Roots: Nutrients & Contaminants

20 www.GrowYourLab.com
Roots: Nutrients & ContaminantsEnergy Dispersive X-Ray Fluorescence Spectrometry (EDXRF)
Quantitative (%) Analysis of Nutrients & Heavy MetalsThe health of the hemp plant is determined by environmental conditions such as soil, water, and air, as well as additives for plant health and growth. There are twenty essential macronutrients and micronutrients for the plant to grow properly. In the “Flower: QA/QC Testing” section of this brochure, the flower is tested for contaminants such as arsenic (As), cadmium (Cd), lead (Pb), mercury (Hg), other heavy metals and nutrients by Inductively Coupled Plasma-Mass Spectrometry (ICP-MS) because hemp plants are bio-accumulators. The soil, roots and plant’s health and growth products can also be tested by ICP-MS, but there is a time-consuming sample preparation step requiring dissolving the sample by acid-assisted microwave oven digestion.
Matrix Liquids Powder Soils
Sample ID A B C D E F G HAg <DL 0.142 <DL <DL <DL <DL <DL <DL
Al <DL <DL <DL <DL <DL 9.855 9.948 17.372
As <DL <DL <DL <DL <DL <DL <DL <DL
Ba <DL <DL <DL <DL <DL <DL <DL <DL
Br <DL <DL 0.179 0.390 <DL <DL <DL <DL
Ca 36.438 44.795 16.059 10.563 6.057 11.677 12.665 5.815
Cr <DL <DL <DL <DL <DL 0.045 0.041 0.118
Cu 0.214 0.176 0.284 0.478 0.045 0.055 0.065 0.082
Fe 1.828 1.656 1.255 0.674 5.964 8.371 9.370 14.327
Hf <DL <DL <DL <DL <DL <DL <DL <DL
Ir <DL <DL <DL <DL <DL <DL <DL <DL
K 27.591 31.681 68.730 66.311 5.864 6.215 7.000 4.480
Mn 0.425 0.504 <DL <DL 0.268 0.471 0.538 0.279
Mo 0.036 0.022 <DL <DL <DL <DL <DL <DL
Ni <DL <DL <DL <DL <DL <DL <DL 0.032
P 21.212 10.568 8.597 15.113 <DL 0.147 0.348 <DL
Pb <DL <DL <DL <DL 0.049 <DL <DL 0.038
Pd <DL <DL <DL <DL <DL <DL <DL 0.071
Rb <DL <DL <DL <DL 0.029 0.018 0.021 <DL
S 10.007 9.910 4.540 6.269 1.570 1.975 <DL 0.223
Si 1.535 <DL <DL <DL 72.626 60.126 56.838 54.725
Sr 0.460 0.331 <DL 0.196 0.045 0.091 0.970 0.080
Ti <DL <DL <DL <DL <DL 0.893 0.878 1.488
V <DL <DL <DL <DL 0.024 0.030 0.037 0.072
Zn 0.254 0.018 <DL <DL 0.024 0.070 0.091 0.759
Zr <DL <DL <DL <DL <DL 0.016 0.035 0.037
Y <DL <DL <DL <DL 0.006 <DL <DL <DL
With Shimadzu’s Energy Dispersive X-Ray Fluorescence Spectrometer (EDX-7000), there is little or no sample preparation with analysis complete in a few minutes. Once the EDX-7000 has been programmed, it may be operated by a layperson.
Shown in the table are the quantitative testing results of eight samples of plant additives in the liquid and powder forms as well as soil for 27 elements, including nutrients and contaminants by EDXRF. The <DL is for data below the instrument detection limits. There are noticeable differences between the elements and concentrations for similar matrices.

21Analytical & Testing Solutions for Industrial Hemp
Cultivation and Harvest
Growing hemp requires the same routine on-farm activities as the cultivation and harvest of other crops. These activities could result in the contamination of surface water, groundwater and soils1. Regulations for pollution control from agricultural activities present high geographical variability; however, nutrient runoff and pesticide leaching are of major concern.
Nutrient Analysis Nitrogen and phosphorus are essential nutrients for plant growth and farmers apply them to soil in the form of chemical fertilizers and manure. However, nitrogen and phosphorus are not fully utilized by growing plants and excess nutrients are washed from soil into waterways and leached into groundwater over time2. High levels of nutrients can cause eutrophication as well as harmful algal blooms in bodies of water. Due to these negative impacts on aquatic ecosystems, nutrients need to be monitored and properly managed.
Shimadzu offers two solutions for environmental nutrient monitoring in water samples. Nitrate, nitrite and o-phosphate can be analyzed with UV-Vis in accordance with Standard Methods Part 4000 (for the analysis of inorganic non-metallic constituents). Ion Chromatography can be used for the analysis of anions included in the United States Environmental Protection Agency (EPA) methods 300 and 300.1.
UV-1280 Spectrophotomer with Water Analysis PackageThe UV-1280 is a versatile and low-maintenance single-beam spectrophotometer – ideal for routine environmental and food quality testing. The Water Analysis Package offers easy-to-use and convenient built-in methods for the analysis of 39 analytes in the ppm range, including nitrate, nitrite and o-phosphate. This makes the UV-1280 an ideal solution for quick detection of nutrients and other water quality parameters.
Environmental Monitoring
Name Name
ClO Chlorine (Free) NO2 Nitrite
CN Cyanide (Free) NO3 (1) Nitrate (NO2=0)
CNT Total Cyanide NO3 (2) Nitrate (NO2≦0.05mg/L)
COD COD NO3 (3) Nitrate (NO2≦5mg/L)
Color Color NO2-N Nitrite Nitrogen
Cr6+ Hexavalent Chromium NO3-N (1) Nitrate Nitrogen(NO2-N=0)
Cr6+-50 Hexavalent Chromium-50mm NO3-N (2) Nitrate N(NO2-N≦0.015mg/L)
Cr6+(D) Hexavalent Chromium (Low) NO3-N (3) Nitrate N(NO2-N≦1.5mg/L)
Cr6+(WAK) Hexavalent Chromium (WAK) Pb Lead
CrT Total Chromium Phenol Phenol
Cu Copper PO4 Phosphate
F Fluoride (Free) PO4(D) Phosphate (Enzyme)
Fe Iron PO4-P Phosphate Phosphorus
Fe (D) Iron (Low) PO4-P(D) Phosphate P(Enzyme)
FOR Formaldehyde S Sulfde
H2O2 Hydrogen Peroxide TH Total Hardness
Mn Manganese Turbid (FTU) Turbidity (Formazin)
NH4 Ammonium Turbid (PS) Turbidity (Polystyrene)
NH4-N Ammonium Nitrogen Zn (D) Zinc (Low)
Ni Nickel
Parameters Included in the Water Analysis Package
[1] https://extension.psu.edu/industrial-hemp-production[2] https://www.epa.gov/nutrientpollution/sources-and-solutions-agriculture

22 www.GrowYourLab.com
Environmental MonitoringNutrient Analysis
Prominence Ion ChromatographThe Prominence Ion Chromatograph (IC) system was created for performance. In addition to increased benchtop efficiency with a compact design, the system is built for high performance and ruggedness. A double layer of thermal regulation for the conductivity detector offers stable and sensitive detection (in the low ppb range) of the anions included in EPA Methods 300 and 300.1 (method detection limits shown in table below). When coupled with a high-quality ion exchange column, the Prominence IC shows the hallmarks of accurate and repeatable quantitation of low concentrations: narrow, symmetrical peaks and narrow water dip.
AnionsCalibration Range
(ppm)Linearity
(r2)MDL Standard
(ppb)Calculated MDL
(ppb)
Fluoride (F-) 0.005-50 0.100 5 1.26
Chlorite (CIO2-) 0.005-5 0.100 5 1.82
Bromate (BrO3-) 0.005-5 0.100 5 3.36
Chloride (CI-) 0.05-25 0.999 5 12.56
Nitrite (NO2-) 0.01-20 0.100 10 1.44
Bromide (Br-) 0.005-20 0.999 5 2.98
Chlorate (CIO3-) 0.005-20 0.999 5 2.39
Nitrate (NO3-) 0.005-25 0.100 5 2.51
Phosphate (PO43-) 0.025-25 0.100 25 4.05
Sulfate (SO42-) 0.025-25 0.100 5 4.74
Method Detection Limits from anions in EPA 300.1
Chromatogram of Anions Included in EPA Method 300.1

23Analytical & Testing Solutions for Industrial Hemp
Pesticide Analysis in WaterExcess pesticides meet the same fate as excess nutrients when they are not fully utilized in hemp or soil. Potential metabolites of the pesticides can also have the same fate as their respective parent compounds. As of 2019, the EPA has approved the use of 10 pesticides for hemp1 and various states are developing specific regulations for industrial hemp farming.
Environmental Monitoring
Liquid Chromatography Mass Spectrometry (LC-MS)LCMS-based methods for pesticide analysis in different matrices, including water, are available. Shimadzu’s portfolio of LCMS instruments is the best solution for meeting the evolving needs for pesticide monitoring. Shimadzu’s Ultra Fast Mass Spectrometry™ allows for rapid polarity switching (5 msec), fast Multiple Reaction Monitoring (MRM) to enable the acquisition of sufficient data points across each peak, and the creation of robust methods with more than 600 pesticides in a single run. The LCMS Method Package for Residual Pesticides (Version 3), created with our LCMS-8060, contains 6,557 MRM transitions for 836 pesticides, as well as software that automates optimization and streamlines data processing.
0.0 1.0 2.0 3.0 4.0 5.0 6.0 7.0 8.0 9.0 10.0 min0
0.25
0.50
0.75
1.00
1.25
1.50
1.75
2.00 ×10⁶
MRM Chromatograms of 646 Pesticides in a Spiked Mint Extract at 0.01 mg/kg (up to 3 MRMs per compound and 5 msec polarity switching time
[1] https://www.epa.gov/pesticide-registration/pesticide-products-registered-use-hemp

24 www.GrowYourLab.com
Environmental MonitoringManufacturing of Hemp-Based Products: Focus on the Stalk
Hemp stalks have been extensively used in the manufacturing of textiles, geotextiles, construction materials, paper, and is currently being investigated for use as a bioplastic. Reduced environmental impact and other beneficial properties of these materials make them a desirable manufacturing alternative to large carbon footprint products. However, waste generated during the manufacturing process still needs to be monitored to ensure compliance with environmental regulations.
Effluent guidelines that are established by the EPA under the Clean Water Act are national standards for industrial wastewater discharges to surface waters and publicly owned treatment works (municipal sewage treatment plants or water resource recovery facilities)1. Additional regulations for controlling the concentration of contaminants in industrial effluents can be developed by local authorities. Under these guidelines and regulations, specific classes of contaminants must be monitored regularly: biochemical oxygen demand (BOD5), total suspended solids, metals, pesticides, polychlorinated biphenyls (PCBs), dioxins, polycyclic aromatic hydrocarbons (PAHs), and other volatile and semi-volatile organic compounds.
Emissions of toxic pollutants from industrial sources are also regulated under the Clean Air Act. These pollutants include mercury, PCBs, benzene and volatile organic compounds (VOCs)2.
Shimadzu offers a complete portfolio of solutions-based platforms that allows monitoring of all regulated contaminants with the potential for expansion to include contaminants in future regulations3.
[1] https://www.epa.gov/eg/industrial-effluent-guidelines[2] https://www.epa.gov/regulatory-information-topic/regulatory-information-topic-air[3] https://www.ssi.shimadzu.com/sites/ssi.shimadzu.com/files/Industry/Literature/C10G-E063.pdf

25Analytical & Testing Solutions for Industrial Hemp
Organic Matter Content in Wastewater Effluents
Total Organic Carbon AnalyzersTotal Organic Carbon (TOC) analysis can be used as an accurate measurement of the organic carbon content of wastewater samples. TOC analysis is easier to automate than BOD5 analysis and the TOC will generate results in hours instead of days. Shimadzu is the industry leader in combustion TOC analyzers and offers benchtop (TOC-L) and online versions (TOC-4110 and TOC 4200) to suit a variety of applications. Our TOC instruments are built around an industry-first and time-proven 680 °C furnace for efficient oxidation of carbon within the sample. Optional add-ons for the TOC include the analysis of Total Nitrogen (TN) and analysis of solid samples.
While our benchtop TOC is a workhorse for generating accurate, precise results, even with complex matrices such as industrial waste and compost in the laboratory, our online TOC offers the additional capability of analyzing up to six different water streams from your manufacturing process.
Environmental Monitoring
Download our application note: TOC Monitoring Upstream of Paper Mill WastewaterTreatment Facility Using Online TOC Analyzer.
Download our whitepaper: Introducing a New ASTM Method for the Determination of Total Nitrogen, and TKN by Calculation, in WaterSamples
Download our application note: Measurement of Total Carbon in Soil and Compost by TOC Solid Sample Measurement System

26 www.GrowYourLab.com
Environmental MonitoringMetals Analysis in Wastewater EffluentsToxic metals (zinc, chromium…) need to be monitored in industrial wastewater effluents generated during manufacturing processes such as pulp and paper processing or textile processing. Shimadzu offers a suite of instruments for elemental analysis of these sample types according to EPA methods 200.7, 200.8 and 200.9. Based on your needs in terms of target analytes, sensitivity and resources, Shimadzu has a solution for you.
- Atomic Absorption (AA) – AA 7000 series: Affordable, robust solution for multi-element analysis, with either a flame or graphite furnace. - Inductively Coupled Plasma Optical Emission Spectrometry (ICP-OES) – ICP-9800 Series: Industry’s lowest argon consumption at 11 liters per minute during analysis using a mini torch. - Inductively Coupled Plasma Mass Spectrometry (ICP-MS) – ICPMS 2030: Enables the highest sensitivity, together with the lowest argon consumption.
EPA 200.7(ICP-OES)
EPA 200.8(ICP-MS)
EPA 200.9(AA)
Aluminum • • •
Antimony • • •
Arsenic • • •
Barium • •
Beryllium • • •
Boron •
Cadmium • • •
Calcium •
Cerium •
Chromium • • •
Cobalt • • •
Copper • • •
Iron • •
Lead • • •
Lithium •
Magnesium •
Manganese • • •
EPA 200.7(ICP-OES)
EPA 200.8(ICP-MS)
EPA 200.9(AA)
Mercury • •
Molybdenum • •
Nickel • • •
Phosphorus •
Potassium •
Selenium • • •
Silica •
Silver • • •
Sodium •
Strontium •
Thallium • • •
Thorium •
Tin • •
Titanium •
Uranium •
Vanadium • •
Zinc • •
Metals included in EPA methods 200.7, 200.8 and 200.9 with recommended instrument

27Analytical & Testing Solutions for Industrial Hemp
Environmental MonitoringVolatiles and Semi-Volatiles Analysis in Wastewater EffluentsAnalysis of volatile (VOCs) and semi-volatile compounds (SVOCs) in wastewater and other environmental samples by gas chromatography mass spectrometry (GCMS) is central to environmental testing regulations. Shimadzu offers a comprehensive method package for the analysis of VOCs according to EPA Method(s) 524, 624 and 8260. The package includes method conditions and documentation to demonstrate system performance according to Quality Assurance parameters outlined in EPA Method(s) 524, 624 and 8260.
To create the package, our instrument was challenged by analyzing over 800 standards and environmental samples! The robust operation of the GCMS-QP2020 NX results in this instrument being one of the best availabletechnologies for analysis of VOCs according to EPA methods.
Stability of internal standards from method EPA 624/8260
With the use of a twin line, it is possible to run VOCs and SVOCs in the same GCMS test run without needing downtime for a column change.
Shimadzu also offers GCMS Triple Quad instruments for the analysis of PCBs, dioxins and other organic compounds. Whether it is the GCMS TQ-8040 NX or the GCMS TQ-8050 NX, the smart technologies incorporated into these instruments will boost your workflows and help with staying ahead of future monitoring requirements.

28 www.GrowYourLab.com
Environmental MonitoringSystem GC for Greenhouse and Other GasesShimadzu’s System Gas Chromatograph (GC) program designs, constructs, and tests applicated gas chromatographs (GCs) for testing and analysis based on common industry standards from ASTM and EPA. Shimadzu is the sole supplier of our System GC products and our world class service and applications engineers provide support on the entire system from hardware to application.
Shimadzu’s System GC for greenhouse gas analysis enables easy, qualitative and quantitative analysis of three major greenhouse gases: methane, carbon dioxide, and nitrous oxide. Turnkey systems are currently available with ECD and MTN/FID detector integration for analysis of these gases. An optional TCD provides detection of fixed gases.
Disposal of Hemp-Based ProductsThere are multiple options for disposing non-hazardous hemp waste in addition to hemp-based products, such as paper, textiles, and bioplastics, at the end of life cycle. Commonly used approaches include landfill disposal, incineration, and recycling. Similar to manufacturing process regulations, there are existing regulations for controlling toxic contaminants into the environment, either in leachates, air emissions from incineration, or during the recycling process.
Bioplastics made of hemp are lightweight, versatile, durable, and biodegradable. Because of their properties, they are a promising alternative to conventional plastics manufactured from oil products. Hemp-based bioplastics are expected to degrade in the environment at much faster rate than conventional plastics. Before degradation is complete, there is a risk that microplastics can enter various environmental compartments, especially if products are not properly disposed.
Shimadzu provides a complete workflow for the assessment of microplastics in the environment, whether the parameter of interest is quantity, size, composition, or content of trace components and adsorbed contaminants.
Analysis target
Nondestructive Destructive Nondestructive
Contaminants and adsorbates
Direct analysis Analysis of extracted solvent
Destructive
Microplastics
Component analysis Count and size measurements
LCMS、GCMSParticle image analysis system
FTIR, Infrared microscope, EDX Py-GCMS、Thermal analyzer EDX, FTIR Py-GCMS
Instrumentation recommended for the analysis of microplastics

29Analytical & Testing Solutions for Industrial Hemp
Environmental MonitoringInstruments for Environmental AnalysisShimadzu is the only worldwide company able to provide analytical instruments, physical testing machines, and x-ray equipment for complete profiling of the hemp plant, from development to the final product. Moreover, Shimadzu also offers the appropriate solutions for monitoring the environmental impact throughout hemp’s production life cycle.
Applicable
AA/ICP/ICPMS
GC, GC-MS(/MS)
HPLC/UHPLC
SFE/SFC
IC
LC-MS(/MS)/Q-TOF
UV-Vis
FTIR
MALDI-TOF MS
Protein Sequencing
DSC/TGA/TMA/DTG
Particle Size
X-Ray CT
TOC/Online TOC
XRD
EDXRF
Universal Testing
Flow Testing
Compression Testing
Fatigue Testing
Impact Testing
High-Speed Video Camera
SPM
fNIRS
Balances
Software Compliance

Analytical &
Testing Solutions for Industrial Hem
p
For Research Use Only. Not intended for diagnostic procedures.
These statements have not been evaluated by the Food and Drug Administration. We makes no claims meant to diagnose, treat, or cure any disease or medical condition. Please consult your doctor before starting ANY medical treatment or before using any medical product during pregnancy or if you have a serious medical condition.
Company names, product/service names and logos used in this publication are trademarks and trade names of Shimadzu Corporation or its affiliates, whether or not they are used with trademark symbol “TM” or “®”.Third-party trademarks and trade names may be used in this publication to refer to either the entities or their products/services. Shimadzu disclaims any proprietary interest in trademarks and trade names other than its own.
The contents of this publication are provided to you “as is” without warranty of any kind, and are subject to change without notice. Shimadzu does not assume any responsibility or liability for any damage, whether direct or indirect, relating to the use of this publication.
Shimadzu Corporationwww.shimadzu.com/an/
Shimadzu Scientific Instruments7102 Riverwood Drive, Columbia, Maryland 21046, U.S.A.Phone: 800-477-1227/410-381-1227, Fax: 410-381-1222
www.ssi.shimadzu.com
www.GrowYourLab.com
September 2020
▶
Industrial HempHemp Flower
QA/QC TestingFood Test Nanofiber CFRPs
AA/ICP/ICPMS
GC, GC-MS(/MS)
HPLC/UHPLC
SFE/SFC
IC
LC-MS(/MS)/Q-TOF
UV-Vis
FTIR
MALDI-TOF MS
Protein Sequencing
DSC/TGA/TMA/DTG
Particle Size
X-Ray CT
XRD
EDXRF
Universal Testing
Flow Testing
Compression Testing
Fatigue Testing
Impact Testing
High-Speed Video Camera
SPM
fNIRS
Balances
Software Compliance
List of Analytical and Testing Instruments for Industrial Hemp and Associated Markets