complete questionnaire including survey results
TRANSCRIPT

Complete Questionnaire Including Survey Results

Private Label Manufacturers Association © Copyright 2014 2
o explore the thoughts and attitudes of “Millennial” consumers, PLMA commissioned Surveylab
at the end of 2013 to conduct a comprehensive, online study of more than 1,500 Millennials
nationwide who identified themselves as the primary grocery shopper for their household.
Surveylab is a global leader in customized online survey solutions for all types of research across a range
of industries for clients in North America, Europe and Asia, and has conducted major research projects
for PLMA in the past.
The study was aimed at determining what moves this generation of Americans; how they shop for food
and beverages, personal care items, household cleaning products, and over the counter medications; what
influences their choices and how retailers can start now making themselves and the store brand products
they sell more appealing to this key generation.
It involved 1,559 consumers, ages 18 to 33, from across the country. More than three fourths identified
themselves as the primary grocery shopper in their household and the rest share that task with another
adult in the household. The survey was evenly split between 806 women and 753 men. Results were also
tabulated into two age groups, 18 to 25 and 26 to 33. A demographic profile of all respondents is at the
end of this report.
What follows are the tabulated results for each of the more than sixty questions in PLMA’s Consumer
Research Study, “The Millennials Are Coming.” Many questions consist of multiple parts.
If you have questions or comments about PLMA’s Consumer Research Study, “The Millennials Are
Coming,” please contact Tom Prendergast, Research Director, at (212) 972-3131, or email
T

Private Label Manufacturers Association © Copyright 2014 3
1. Please tell us how important the following goals are to you today.
a. Continuing my education Group A Group B
Answer Total (18-25) (26-33)
Not at All Important 3.90% 3.30% 4.50%
Somewhat Unimportant 6.70% 4.20% 9.20%
Neither Important Nor Unimportant 19.80% 16.50% 23.20%
Somewhat Important 33.40% 30.30% 36.50%
Very Important 36.20% 45.60% 26.60%
Total 1551 778 773
b. Protecting the environment Group A Group B
Answer Total (18-25) (26-33)
Not at All Important 2.50% 3.30% 1.70%
Somewhat Unimportant 6.80% 6.90% 6.70%
Neither Important Nor Unimportant 23.50% 26.70% 20.20%
Somewhat Important 43.30% 40.40% 46.40%
Very Important 23.90% 22.70% 25.00%
Total 1555 783 772
c. Owning my own home Group A Group B
Answer Total (18-25) (26-33)
Not at All Important 2.20% 2.70% 1.80%
Somewhat Unimportant 3.40% 4.60% 2.20%
Neither Important Nor Unimportant 12.50% 15.70% 9.20%
Somewhat Important 28.30% 29.00% 27.60%
Very Important 53.60% 48.00% 59.20%
Total 1557 782 775
d. Acquiring wealth Group A Group B
Answer Total (18-25) (26-33)
Not at All Important 2.70% 3.00% 2.40%
Somewhat Unimportant 5.90% 5.90% 5.80%
Neither Important Nor Unimportant 22.30% 21.70% 22.90%
Somewhat Important 42.30% 40.40% 44.10%
Very Important 26.90% 29.00% 24.70%
Total 1555 779 776

Private Label Manufacturers Association © Copyright 2014 4
e. Raising a family Group A Group B
Answer Total (18-25) (26-33)
Not at All Important 5.70% 7.70% 3.60%
Somewhat Unimportant 6.40% 8.00% 4.80%
Neither Important Nor Unimportant 12.70% 15.70% 9.70%
Somewhat Important 21.40% 22.20% 20.50%
Very Important 53.90% 46.50% 61.40%
Total 1553 779 774
f. Involvement in my community Group A Group B
Answer Total (18-25) (26-33)
Not at All Important 3.50% 4.50% 2.50%
Somewhat Unimportant 9.50% 10.40% 8.70%
Neither Important Nor Unimportant 27.80% 29.00% 26.60%
Somewhat Important 41.70% 37.60% 45.80%
Very Important 17.50% 18.50% 16.50%
Total 1550 779 771
g. Sports Group A Group B
Answer Total (18-25) (26-33)
Not at All Important 17.60% 21.10% 14.10%
Somewhat Unimportant 15.60% 16.60% 14.50%
Neither Important Nor Unimportant 25.90% 24.50% 27.40%
Somewhat Important 26.10% 22.50% 29.70%
Very Important 14.80% 15.20% 14.30%
Total 1555 781 774
h. Enjoying life Group A Group B
Answer Total (18-25) (26-33)
Not at All Important 0.80% 0.90% 0.80%
Somewhat Unimportant 0.70% 1.00% 0.40%
Neither Important Nor Unimportant 2.90% 4.40% 1.40%
Somewhat Important 20.30% 18.50% 22.20%
Very Important 75.20% 75.20% 75.20%
Total 1548 779 769

Private Label Manufacturers Association © Copyright 2014 5
i. Traveling widely Group A Group B
Answer Total (18-25) (26-33)
Not at All Important 4.60% 5.30% 3.90%
Somewhat Unimportant 10.70% 10.90% 10.50%
Neither Important Nor Unimportant 24.90% 25.70% 24.10%
Somewhat Important 34.40% 32.60% 36.30%
Very Important 25.40% 25.50% 25.30%
Total 1549 777 772
j. Settling down Group A Group B
Answer Total (18-25) (26-33)
Not at All Important 3.10% 3.60% 2.60%
Somewhat Unimportant 6.40% 7.80% 5.00%
Neither Important Nor Unimportant 17.80% 19.10% 16.50%
Somewhat Important 33.00% 32.00% 34.00%
Very Important 39.70% 37.50% 41.90%
Total 1548 774 774
k. If you have another goal that is important to you, what is it?
This open-ended question resulted in 442 individual responses
2. How often do you do your regular grocery shopping? Group A Group B
Answer Total (18-25) (26-33)
More than once a week 24.00% 18.70% 29.30%
Weekly 52.90% 52.20% 53.70%
Every two weeks 17.30% 20.80% 13.70%
About once a month 4.80% 7.00% 2.60%
Less than once a month 0.10% 0.30% 0.00%
It varies 0.90% 1.00% 0.80%
Total 1557 782 775
3. How many different stores do you visit to do your regular grocery
shopping?
Group A Group B
Answer Total (18-25) (26-33)
1 18.30% 19.70% 16.80%
2 51.80% 52.90% 50.70%
3 21.10% 19.40% 22.90%
4 or more 8.80% 7.90% 9.60%
Total 1557 782 775

Private Label Manufacturers Association © Copyright 2014 6
4. In what type of store(s) do you do your regular grocery shopping?
Group A Group B
Answer Total (18-25) (26-33)
Supermarket e.g. Kroger, Safeway 79.30% 77.10% 81.40%
Drug store e.g. Walgreens, CVS 21.00% 21.50% 20.50%
Discounter e.g. Wal-Mart, Target 66.20% 63.80% 68.70%
Dollar store e.g. Dollar General, Family Dollar 20.80% 22.30% 19.30%
No frills store e.g. Aldi, Save-A-Lot 13.60% 13.00% 14.20%
Club store e.g. Costco, Sam's Club 28.60% 26.50% 30.80%
Specialty food store e.g. Whole Foods, Trader Joe's 22.80% 21.60% 24.00%
Farmers market 12.80% 11.50% 14.00%
A co-operative 2.90% 2.70% 3.10%
Convenience store, e.g. Seven-11 7.90% 7.50% 8.20%
Small neighborhood grocery store 13.80% 15.90% 11.70%
Online store, e.g. Amazon 6.70% 5.90% 7.50%
Total 1558 782 776
5. On average, how much time do you spend inside the store when
you do your regular grocery shopping?
Group A Group B
Answer Total (18-25) (26-33)
Less than 30 minutes 10.00% 9.20% 10.90%
Less than 1 hour 37.70% 34.20% 41.30%
About 1 hour 40.10% 43.00% 37.10%
More than 1 hour 12.20% 13.60% 10.70%
Total 1555 781 774
6. On an average visit, approximately how much do you spend when
you do your regular grocery shopping?
Group A Group B
Answer Total (18-25) (26-33)
Less than $25 3.10% 3.60% 2.60%
$25 - $50 15.80% 16.60% 14.90%
$50 - $75 25.20% 26.80% 23.70%
$75 - $100 28.80% 29.40% 28.10%
More than $100 27.10% 23.60% 30.70%
Total 1557 781 776

Private Label Manufacturers Association © Copyright 2014 7
7. How do you usually pay for the groceries you buy?
Group A Group B
Answer Total (18-25) (26-33)
Cash 24.70% 31.40% 18.00%
Credit card 29.50% 23.90% 35.20%
Checks 0.60% 0.60% 0.50%
Debit card 37.30% 35.00% 39.60%
EBT card 7.60% 8.70% 6.40%
Mobile payment app 0.00% 0.00% 0.00%
Other 0.30% 0.40% 0.30%
Total 1557 781 776
8. What 3 sources of information would you say most influence your
choice of buying a specific product?
Group A Group B
Answer Total (18-25) (26-33)
My prior purchase experience with the product 54.70% 51.90% 57.50%
Recommendation from family or friend 41.30% 39.30% 43.30%
Smart phone app 9.10% 10.90% 7.30%
Coupons in the mail 46.30% 44.40% 48.20%
Online article or advertising 13.40% 14.10% 12.60%
My household shopping list 51.30% 50.40% 52.20%
Print or TV advertising 18.70% 20.20% 17.30%
Promotional flyers 19.30% 16.90% 21.80%
Recommendation on social media 9.80% 10.50% 9.10%
Other 2.10% 2.80% 1.30%
None of the above 3.00% 3.50% 2.60%
Total 1558 782 776
9. Do you belong to a supermarket, drug store or other store's
frequent shopper club or loyalty card program?
Group A Group B
Answer Total (18-25) (26-33)
Yes 69.10% 64.40% 73.80%
No 24.60% 28.30% 20.90%
N/A - my store(s) does/do not offer 6.30% - -
Total 1547 775 772

Private Label Manufacturers Association © Copyright 2014 8
10. Are you more or less likely to shop at a store with a frequent
shopper club or loyalty card program?
Group A Group B
Answer Total (18-25) (26-33)
More likely 46.40% 45.20% 47.60%
No difference 51.90% 53.00% 50.70%
Less likely 1.70% 1.80% 1.70%
Total 1550 777 773
11. If a particular national brand that you want to buy is not available in
the store when you are shopping, what do you usually do?
Group A Group B
Answer Total (18-25) (26-33)
Buy a different national brand instead 34.60% 35.40% 33.80%
Buy the store brand instead 40.50% 40.40% 40.60%
Go to another store to look for the national brand 13.10% 12.90% 13.40%
Seek assistance from store staff 3.50% 3.30% 3.70%
Search online for availability elsewhere 1.90% 2.30% 1.40%
Delay purchase to next shopping visit 4.70% 4.20% 5.20%
Other (please specify) 1.60% 1.40% 1.80%
Total 1552 777 775
12. As a consumer, how positive or negative do you feel towards the
following types of grocery producers and retailers?
a. National brand manufacturers
Group A Group B
Answer Total (18-25) (26-33)
0 - Very Negative 0.90% 1.00% 0.80%
1 1.70% 2.70% 0.60%
2 9.60% 11.50% 7.70%
3 35.80% 35.50% 36.10%
4 32.40% 29.60% 35.20%
5 - Very Positive 19.60% 19.70% 19.50%
Total 1556 781 775

Private Label Manufacturers Association © Copyright 2014 9
b. Large retail chains
Group A Group B
Answer Total (18-25) (26-33)
0 - Very Negative 0.60% 0.90% 0.40%
1 3.30% 4.20% 2.30%
2 10.60% 11.00% 10.10%
3 33.30% 33.50% 33.10%
4 35.00% 32.20% 37.90%
5 - Very Positive 17.20% 18.20% 16.20%
Total 1551 780 771
c. Local stores and shops Group A Group B
Answer Total (18-25) (26-33)
0 - Very Negative 0.00% 0.00% 0.00%
1 0.90% 1.40% 0.40%
2 4.50% 5.30% 3.80%
3 25.80% 25.40% 26.30%
4 39.40% 38.30% 40.50%
5 - Very Positive 29.40% 29.70% 29.10%
Total 1552 779 773
d. Online retailers Group A Group B
Answer Total (18-25) (26-33)
0 - Very Negative 2.00% 2.40% 1.60%
1 6.10% 7.50% 4.70%
2 14.30% 16.20% 12.40%
3 31.90% 33.40% 30.30%
4 29.00% 25.10% 33.10%
5 - Very Positive 16.70% 15.40% 17.90%
Total 1543 778 765
13. How important are the following factors when visiting the store for
your regular grocery shopping?
a. This store has the lowest prices every day
Group A Group B
Answer Total (18-25) (26-33)
Not at All Important 0.50% 0.60% 0.30%
Somewhat Unimportant 2.40% 2.80% 1.90%
Neither Important Nor Unimportant 11.80% 13.40% 10.20%
Somewhat Important 39.00% 37.60% 40.40%
Very Important 46.30% 45.50% 47.20%
Total 1553 781 772

Private Label Manufacturers Association © Copyright 2014 10
b. This store has products that offer the best value
Group A Group B
Answer Total (18-25) (26-33)
Not at All Important 0.60% 0.80% 0.40%
Somewhat Unimportant 1.90% 2.40% 1.30%
Neither Important Nor Unimportant 9.40% 12.10% 6.70%
Somewhat Important 41.50% 40.00% 42.90%
Very Important 46.70% 44.70% 48.70%
Total 1551 777 774
c. This store has the best selection of products
Group A Group B
Answer Total (18-25) (26-33)
Not at All Important 0.60% 0.80% 0.40%
Somewhat Unimportant 1.60% 2.30% 0.90%
Neither Important Nor Unimportant 11.00% 12.30% 9.60%
Somewhat Important 43.50% 42.00% 44.90%
Very Important 43.30% 42.50% 44.20%
Total 1548 778 770
d. This store is a convenient place to shop
Group A Group B
Answer Total (18-25) (26-33)
Not at All Important 0.50% 0.60% 0.30%
Somewhat Unimportant 1.40% 1.80% 1.00%
Neither Important Nor Unimportant 10.30% 12.20% 8.40%
Somewhat Important 44.00% 42.20% 45.80%
Very Important 43.80% 43.10% 44.50%
Total 1550 779 771
e. This store has a good selection of store brand products
Group A Group B
Answer Total (18-25) (26-33)
Not at All Important 1.70% 2.10% 1.30%
Somewhat Unimportant 4.10% 4.40% 3.80%
Neither Important Nor Unimportant 20.10% 20.90% 19.30%
Somewhat Important 43.00% 41.20% 44.80%
Very Important 31.20% 31.50% 30.80%
Total 1552 780 772

Private Label Manufacturers Association © Copyright 2014 11
f. This store has products that are affordable
Group A Group B
Answer Total (18-25) (26-33)
Not at All Important 0.30% 0.30% 0.40%
Somewhat Unimportant 2.00% 2.60% 1.40%
Neither Important Nor Unimportant 8.00% 9.60% 6.30%
Somewhat Important 33.70% 32.40% 35.00%
Very Important 56.00% 55.20% 56.90%
Total 1553 781 772
g. This store has the latest technology to enhance my
shopping experience Group A Group B
Answer Total (18-25) (26-33)
Not at All Important 6.10% 7.20% 5.00%
Somewhat Unimportant 15.10% 15.00% 15.20%
Neither Important Nor Unimportant 35.20% 34.10% 36.30%
Somewhat Important 27.70% 28.20% 27.30%
Very Important 15.80% 15.50% 16.10%
Total 1554 780 774
h. This store is a fun place to shop
Group A Group B
Answer Total (18-25) (26-33)
Not at All Important 3.20% 3.60% 2.90%
Somewhat Unimportant 8.20% 8.90% 7.60%
Neither Important Nor Unimportant 32.90% 32.70% 33.00%
Somewhat Important 35.50% 34.00% 36.90%
Very Important 20.20% 20.70% 19.60%
Total 1542 776 766
i. This store has new products for me to try
Group A Group B
Answer Total (18-25) (26-33)
Not at All Important 2.00% 2.70% 1.30%
Somewhat Unimportant 6.90% 6.20% 7.60%
Neither Important Nor Unimportant 28.90% 30.30% 27.60%
Somewhat Important 42.90% 43.40% 42.50%
Very Important 19.20% 17.50% 21.00%
Total 1551 779 772

Private Label Manufacturers Association © Copyright 2014 12
j. This store represents the values of my generation
Group A Group B
Answer Total (18-25) (26-33)
Not at All Important 5.20% 6.40% 4.00%
Somewhat Unimportant 8.60% 7.80% 9.30%
Neither Important Nor Unimportant 36.50% 35.90% 37.00%
Somewhat Important 32.20% 32.90% 31.50%
Very Important 17.50% 16.90% 18.10%
Total 1551 779 772
k. This store is the most popular store in my community
Group A Group B
Answer Total (18-25) (26-33)
Not at All Important 13.10% 13.40% 12.80%
Somewhat Unimportant 19.00% 18.10% 19.80%
Neither Important Nor Unimportant 36.60% 36.20% 36.90%
Somewhat Important 20.00% 20.40% 19.60%
Very Important 11.40% 11.80% 10.90%
Total 1550 778 772
l. This store is well-known to me Group A Group B
Answer Total (18-25) (26-33)
Not at All Important 1.00% 1.20% 0.80%
Somewhat Unimportant 3.60% 4.40% 2.70%
Neither Important Nor Unimportant 18.90% 19.60% 18.10%
Somewhat Important 49.50% 47.70% 51.20%
Very Important 27.20% 27.20% 27.20%
Total 1549 780 769
m. This store offers frequent sales and discounts
Group A Group B
Answer Total (18-25) (26-33)
Not at All Important 0.70% 0.80% 0.60%
Somewhat Unimportant 1.20% 1.70% 0.80%
Neither Important Nor Unimportant 12.10% 13.80% 10.40%
Somewhat Important 41.60% 39.90% 43.30%
Very Important 44.40% 43.80% 44.90%
Total 1553 781 772

Private Label Manufacturers Association © Copyright 2014 13
14. How important are the following factors when choosing to buy a
grocery product that you have never purchased before?
a. Recommendation from family or friend
Group A Group B
Answer Total (18-25) (26-33)
Not at All Important 2.10% 2.10% 2.10%
Somewhat Unimportant 3.20% 3.60% 2.70%
Neither Important Nor Unimportant 18.20% 20.60% 15.70%
Somewhat Important 44.90% 42.60% 47.30%
Very Important 31.70% 31.20% 32.20%
Total 1551 780 771
b. Endorsement/recommendation on social media (e.g. Facebook,
Twitter, etc.) Group A Group B
Answer Total (18-25) (26-33)
Not at All Important 14.10% 13.50% 14.80%
Somewhat Unimportant 17.60% 17.20% 18.00%
Neither Important Nor Unimportant 34.70% 35.00% 34.40%
Somewhat Important 24.40% 25.30% 23.50%
Very Important 9.20% 9.00% 9.30%
Total 1550 779 771
c. Endorsement of a celebrity Group A Group B
Answer Total (18-25) (26-33)
Not at All Important 35.10% 33.90% 36.30%
Somewhat Unimportant 19.10% 18.20% 20.00%
Neither Important Nor Unimportant 25.70% 27.00% 24.40%
Somewhat Important 13.00% 13.00% 12.90%
Very Important 7.10% 7.90% 6.40%
Total 1544 775 769
d. Review of the product online (on an independent website) Group A Group B
Answer Total (18-25) (26-33)
Not at All Important 5.70% 6.50% 4.90%
Somewhat Unimportant 9.10% 8.50% 9.70%
Neither Important Nor Unimportant 32.10% 31.30% 33.00%
Somewhat Important 37.40% 37.40% 37.40%
Very Important 15.60% 16.30% 14.90%
Total 1550 780 770

Private Label Manufacturers Association © Copyright 2014 14
e. Review of the product online (on the store's website) Group A Group B
Answer Total (18-25) (26-33)
Not at All Important 6.80% 8.00% 5.70%
Somewhat Unimportant 11.10% 11.60% 10.60%
Neither Important Nor Unimportant 33.80% 33.20% 34.50%
Somewhat Important 33.70% 32.30% 35.10%
Very Important 14.50% 15.00% 14.00%
Total 1549 778 771
f. Newspaper or magazine advertisement or article Group A Group B
Answer Total (18-25) (26-33)
Not at All Important 9.80% 10.30% 9.40%
Somewhat Unimportant 12.40% 11.20% 13.70%
Neither Important Nor Unimportant 35.90% 36.30% 35.60%
Somewhat Important 31.10% 30.60% 31.60%
Very Important 10.70% 11.70% 9.70%
Total 1555 780 775
g. Online advertising Group A Group B
Answer Total (18-25) (26-33)
Not at All Important 9.70% 9.50% 9.90%
Somewhat Unimportant 13.70% 13.20% 14.30%
Neither Important Nor Unimportant 39.30% 40.40% 38.20%
Somewhat Important 26.50% 25.50% 27.40%
Very Important 10.80% 11.40% 10.30%
Total 1550 780 770
h. Coupon Group A Group B
Answer Total (18-25) (26-33)
Not at All Important 2.10% 2.20% 2.10%
Somewhat Unimportant 3.50% 4.10% 2.90%
Neither Important Nor Unimportant 17.00% 18.50% 15.60%
Somewhat Important 44.20% 43.40% 45.00%
Very Important 33.20% 31.80% 34.50%
Total 1550 779 771

Private Label Manufacturers Association © Copyright 2014 15
i. In-store advertising, free samples or product demonstrations Group A Group B
Answer Total (18-25) (26-33)
Not at All Important 2.60% 2.40% 2.70%
Somewhat Unimportant 5.20% 5.30% 5.20%
Neither Important Nor Unimportant 22.70% 23.60% 21.70%
Somewhat Important 46.50% 45.10% 47.80%
Very Important 23.10% 23.60% 22.60%
Total 1550 779 771
j. Emailed notice of a sale or discount Group A Group B
Answer Total (18-25) (26-33)
Not at All Important 6.30% 7.60% 4.90%
Somewhat Unimportant 8.30% 8.70% 7.90%
Neither Important Nor Unimportant 28.30% 28.90% 27.70%
Somewhat Important 39.20% 36.60% 41.80%
Very Important 17.90% 18.10% 17.70%
Total 1548 778 770
15. How often do you eat meals at home?
Group A Group B
Answer Total (18-25) (26-33)
Less than once a week 1.50% 1.20% 1.90%
1-2 times per week 5.80% 6.50% 5.00%
3-4 times per week 25.80% 30.30% 21.30%
5 or more times per week 66.30% 61.30% 71.40%
I rarely or never eat meals at home 0.60% 0.80% 0.40%
Total 1555 780 775
16. Compared to one year ago, are you ...
Group A Group B
Answer Total (18-25) (26-33)
Eating out less 47.60% 47.00% 48.30%
Eating out more 17.50% 22.20% 12.60%
Eating out the same 34.90% 30.70% 39.10%
Total 1553 778 775

Private Label Manufacturers Association © Copyright 2014 16
17. How often do you follow instructions or look at the ingredients on
the label of the following types of products?
a. Fresh produce Group A Group B
Answer Total (18-25) (26-33)
Never 13.70% 12.40% 15.10%
Rarely 14.70% 15.40% 14.00%
Sometimes 24.30% 26.80% 21.80%
Frequently 24.50% 23.20% 25.80%
Always 22.80% 22.30% 23.20%
Total 1547 777 770
b. Fresh meat Group A Group B
Answer Total (18-25) (26-33)
Never 8.50% 8.90% 8.10%
Rarely 11.90% 10.80% 13.00%
Sometimes 24.40% 25.70% 23.00%
Frequently 28.20% 28.00% 28.30%
Always 27.10% 26.60% 27.50%
Total 1552 778 774
c. Packaged food items Group A Group B
Answer Total (18-25) (26-33)
Never 3.00% 3.50% 2.50%
Rarely 7.00% 7.50% 6.50%
Sometimes 26.60% 27.20% 25.90%
Frequently 37.80% 35.70% 39.90%
Always 25.70% 26.20% 25.30%
Total 1548 776 772
d. Frozen food items Group A Group B
Answer Total (18-25) (26-33)
Never 2.90% 3.50% 2.30%
Rarely 8.40% 8.80% 7.90%
Sometimes 24.40% 24.60% 24.20%
Frequently 35.50% 32.20% 38.90%
Always 28.80% 30.90% 26.60%
Total 1553 780 773

Private Label Manufacturers Association © Copyright 2014 17
e. Refrigerated items Group A Group B
Answer Total (18-25) (26-33)
Never 2.90% 3.90% 1.90%
Rarely 7.40% 6.80% 8.10%
Sometimes 25.90% 26.80% 25.10%
Frequently 37.70% 35.80% 39.60%
Always 26.10% 26.80% 25.30%
Total 1547 777 770
f. Beverages Group A Group B
Answer Total (18-25) (26-33)
Never 6.50% 6.60% 6.50%
Rarely 14.30% 13.60% 14.90%
Sometimes 28.10% 29.30% 26.90%
Frequently 29.90% 28.30% 31.50%
Always 21.20% 22.20% 20.20%
Total 1550 778 772
g. Over the counter medications Group A Group B
Answer Total (18-25) (26-33)
Never 4.10% 4.70% 3.50%
Rarely 9.10% 9.90% 8.30%
Sometimes 23.30% 24.00% 22.50%
Frequently 29.10% 27.20% 31.10%
Always 34.40% 34.10% 34.60%
Total 1551 779 772
h. Personal care items Group A Group B
Answer Total (18-25) (26-33)
Never 6.00% 6.40% 5.60%
Rarely 12.60% 12.50% 12.80%
Sometimes 31.60% 28.80% 34.40%
Frequently 29.80% 30.10% 29.50%
Always 20.00% 22.20% 17.70%
Total 1551 778 773
Private Label Manufacturers Association © Copyright 2014 18
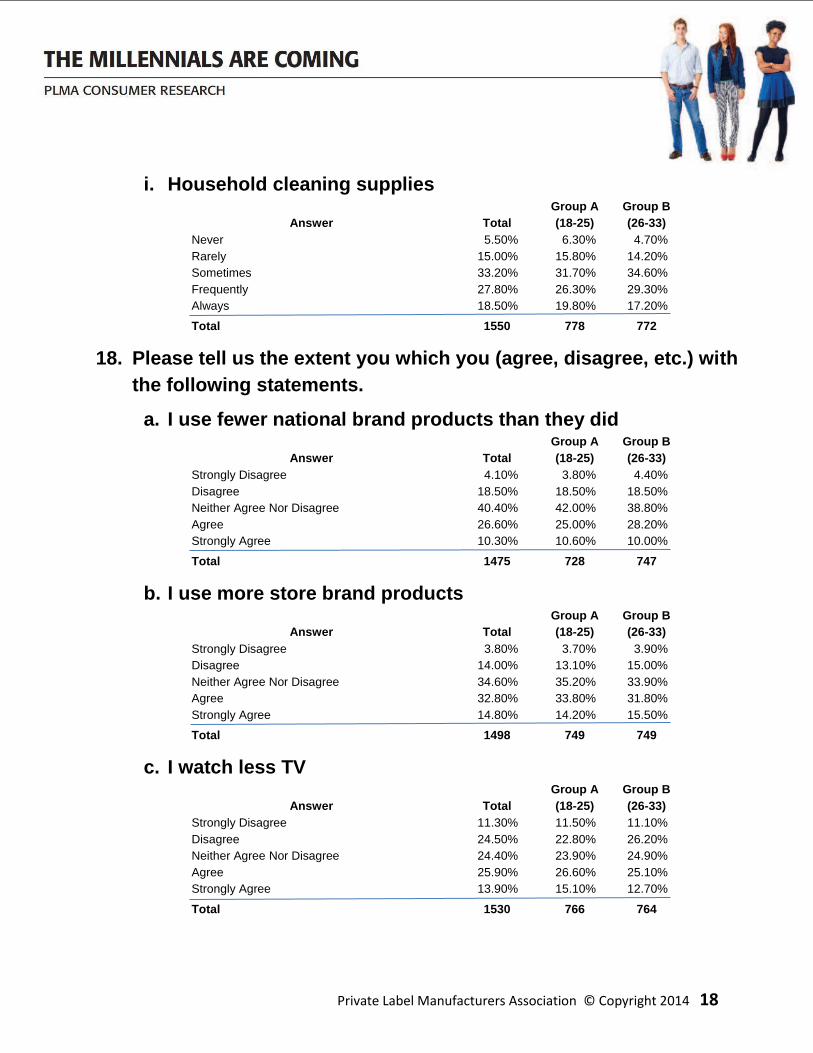
i. Household cleaning supplies Group A Group B
Answer Total (18-25) (26-33)
Never 5.50% 6.30% 4.70%
Rarely 15.00% 15.80% 14.20%
Sometimes 33.20% 31.70% 34.60%
Frequently 27.80% 26.30% 29.30%
Always 18.50% 19.80% 17.20%
Total 1550 778 772
18. Please tell us the extent you which you (agree, disagree, etc.) with
the following statements.
a. I use fewer national brand products than they did Group A Group B
Answer Total (18-25) (26-33)
Strongly Disagree 4.10% 3.80% 4.40%
Disagree 18.50% 18.50% 18.50%
Neither Agree Nor Disagree 40.40% 42.00% 38.80%
Agree 26.60% 25.00% 28.20%
Strongly Agree 10.30% 10.60% 10.00%
Total 1475 728 747
b. I use more store brand products Group A Group B
Answer Total (18-25) (26-33)
Strongly Disagree 3.80% 3.70% 3.90%
Disagree 14.00% 13.10% 15.00%
Neither Agree Nor Disagree 34.60% 35.20% 33.90%
Agree 32.80% 33.80% 31.80%
Strongly Agree 14.80% 14.20% 15.50%
Total 1498 749 749
c. I watch less TV Group A Group B
Answer Total (18-25) (26-33)
Strongly Disagree 11.30% 11.50% 11.10%
Disagree 24.50% 22.80% 26.20%
Neither Agree Nor Disagree 24.40% 23.90% 24.90%
Agree 25.90% 26.60% 25.10%
Strongly Agree 13.90% 15.10% 12.70%
Total 1530 766 764

Private Label Manufacturers Association © Copyright 2014 19
d. I earn less at the same age Group A Group B
Answer Total (18-25) (26-33)
Strongly Disagree 8.10% 6.30% 9.90%
Disagree 18.80% 15.40% 22.00%
Neither Agree Nor Disagree 30.60% 36.00% 25.30%
Agree 26.40% 26.40% 26.40%
Strongly Agree 16.10% 15.90% 16.40%
Total 1530 766 764
e. I eat out less often Group A Group B
Answer Total (18-25) (26-33)
Strongly Disagree 6.20% 5.60% 6.80%
Disagree 22.20% 22.40% 21.90%
Neither Agree Nor Disagree 26.00% 26.80% 25.20%
Agree 27.70% 28.00% 27.50%
Strongly Agree 17.90% 17.20% 18.50%
Total 1523 762 761
f. I eat healthier food products Group A Group B
Answer Total (18-25) (26-33)
Strongly Disagree 2.50% 2.90% 2.10%
Disagree 11.50% 12.30% 10.80%
Neither Agree Nor Disagree 26.60% 27.30% 26.00%
Agree 37.50% 37.20% 37.90%
Strongly Agree 21.80% 20.30% 23.20%
Total 1524 758 766
g. I use more organic products Group A Group B
Answer Total (18-25) (26-33)
Strongly Disagree 8.40% 8.30% 8.50%
Disagree 14.40% 15.40% 13.50%
Neither Agree Nor Disagree 28.00% 29.90% 26.10%
Agree 32.30% 31.80% 32.80%
Strongly Agree 16.80% 14.60% 19.00%
Total 1517 755 762

Private Label Manufacturers Association © Copyright 2014 20
h. I shop for groceries in a wider variety of stores Group A Group B
Answer Total (18-25) (26-33)
Strongly Disagree 3.80% 4.60% 2.90%
Disagree 13.70% 14.10% 13.30%
Neither Agree Nor Disagree 26.30% 27.90% 24.70%
Agree 37.00% 36.40% 37.60%
Strongly Agree 19.30% 17.00% 21.60%
Total 1520 759 761
19. As a customer, how loyal to the following retailers and brands do
you consider yourself to be?
a. Leading national brands of groceries e.g. Coke, Advil, Tide,
Tostitos Group A Group B
Answer Total (18-25) (26-33)
Not At All Loyal 12.20% 12.80% 11.50%
Somewhat Loyal 51.30% 49.80% 52.70%
Very Loyal 33.50% 33.70% 33.30%
Don't Know/No Opinion 3.10% 3.70% 2.50%
Total 1553 781 772
b. Supermarkets e.g. Safeway, Kroger, Whole Foods Group A Group B
Answer Total (18-25) (26-33)
Not At All Loyal 15.20% 16.20% 14.20%
Somewhat Loyal 53.20% 50.90% 55.60%
Very Loyal 28.20% 28.80% 27.70%
Don't Know/No Opinion 3.40% 4.10% 2.60%
Total 1552 782 770
c. Drug stores e.g. Walgreens, CVS, Rite Aid Group A Group B
Answer Total (18-25) (26-33)
Not At All Loyal 24.30% 23.70% 24.90%
Somewhat Loyal 46.10% 43.80% 48.50%
Very Loyal 25.80% 28.10% 23.50%
Don't Know/No Opinion 3.80% 4.40% 3.10%
Total 1546 779 767

Private Label Manufacturers Association © Copyright 2014 21
d. Discount stores e.g. Wal-Mart, Costco, Target Group A Group B
Answer Total (18-25) (26-33)
Not At All Loyal 15.20% 13.90% 16.60%
Somewhat Loyal 43.50% 42.90% 44.20%
Very Loyal 38.40% 39.10% 37.70%
Don't Know/No Opinion 2.80% 4.10% 1.60%
Total 1548 778 770
e. Well-known electronic and sports brands e.g. Apple, Nike Group A Group B
Answer Total (18-25) (26-33)
Not At All Loyal 19.90% 20.50% 19.30%
Somewhat Loyal 44.90% 42.60% 47.30%
Very Loyal 31.50% 33.10% 30.00%
Don't Know/No Opinion 3.60% 3.80% 3.40%
Total 1551 780 771
f. Social network sites e.g. Facebook, Twitter Group A Group B
Answer Total (18-25) (26-33)
Not At All Loyal 21.20% 20.20% 22.20%
Somewhat Loyal 40.50% 40.20% 40.90%
Very Loyal 34.70% 35.90% 33.40%
Don't Know/No Opinion 3.60% 3.70% 3.50%
Total 1554 782 772
g. Online stores e.g. Amazon Group A Group B
Answer Total (18-25) (26-33)
Not At All Loyal 10.40% 11.10% 9.60%
Somewhat Loyal 41.60% 42.50% 40.80%
Very Loyal 45.10% 43.00% 47.30%
Don't Know/No Opinion 2.80% 3.30% 2.30%
Total 1549 781 768

Private Label Manufacturers Association © Copyright 2014 22
20. When it comes to choosing a particular grocery product how
important are the following factors?
a. Price Group A Group B
Answer Total (18-25) (26-33)
Not at All Important 0.50% 0.40% 0.50%
Somewhat Unimportant 1.20% 1.70% 0.80%
Neither Important Nor Unimportant 9.70% 11.00% 8.30%
Somewhat Important 31.20% 28.80% 33.80%
Very Important 57.40% 58.20% 56.60%
Total 1549 779 770
b. Natural or organic ingredients Group A Group B
Answer Total (18-25) (26-33)
Not at All Important 6.70% 7.30% 6.10%
Somewhat Unimportant 9.70% 9.00% 10.40%
Neither Important Nor Unimportant 29.50% 30.50% 28.50%
Somewhat Important 34.50% 33.20% 35.90%
Very Important 19.60% 20.10% 19.00%
Total 1549 781 768
c. Availability of store brand version of the product Group A Group B
Answer Total (18-25) (26-33)
Not at All Important 4.10% 3.80% 4.40%
Somewhat Unimportant 7.70% 8.20% 7.20%
Neither Important Nor Unimportant 32.20% 31.70% 32.80%
Somewhat Important 38.90% 37.40% 40.30%
Very Important 17.10% 18.80% 15.20%
Total 1554 780 774
d. Coupons Group A Group B
Answer Total (18-25) (26-33)
Not at All Important 2.10% 1.70% 2.60%
Somewhat Unimportant 4.40% 4.90% 3.90%
Neither Important Nor Unimportant 19.40% 23.00% 15.60%
Somewhat Important 43.70% 41.40% 46.10%
Very Important 30.40% 29.10% 31.80%
Total 1549 781 768

Private Label Manufacturers Association © Copyright 2014 23
e. Product information from online or smart phone app Group A Group B
Answer Total (18-25) (26-33)
Not at All Important 12.80% 11.40% 14.20%
Somewhat Unimportant 14.60% 16.30% 12.90%
Neither Important Nor Unimportant 36.00% 36.60% 35.30%
Somewhat Important 26.70% 25.50% 27.90%
Very Important 9.90% 10.10% 9.70%
Total 1549 779 770
f. Shopper loyalty card discounts at checkout Group A Group B
Answer Total (18-25) (26-33)
Not at All Important 4.80% 4.90% 4.70%
Somewhat Unimportant 6.90% 8.20% 5.70%
Neither Important Nor Unimportant 27.10% 28.60% 25.50%
Somewhat Important 40.20% 37.90% 42.60%
Very Important 21.00% 20.50% 21.60%
Total 1556 782 774
g. Signs or displays in the store Group A Group B
Answer Total (18-25) (26-33)
Not at All Important 6.60% 5.30% 7.90%
Somewhat Unimportant 11.60% 10.70% 12.50%
Neither Important Nor Unimportant 35.60% 38.00% 33.20%
Somewhat Important 34.50% 33.40% 35.50%
Very Important 11.70% 12.60% 10.90%
Total 1552 778 774
h. Package design Group A Group B
Answer Total (18-25) (26-33)
Not at All Important 9.30% 9.00% 9.60%
Somewhat Unimportant 14.40% 13.00% 15.80%
Neither Important Nor Unimportant 37.80% 39.20% 36.50%
Somewhat Important 29.30% 28.20% 30.30%
Very Important 9.20% 10.70% 7.80%
Total 1551 779 772

Private Label Manufacturers Association © Copyright 2014 24
i. Product sampling and in store demonstrations Group A Group B
Answer Total (18-25) (26-33)
Not at All Important 5.50% 4.60% 6.50%
Somewhat Unimportant 10.10% 9.90% 10.30%
Neither Important Nor Unimportant 31.00% 30.90% 31.00%
Somewhat Important 39.20% 38.70% 39.70%
Very Important 14.20% 15.90% 12.40%
Total 1553 780 773
j. A recommendation from friends on social media (e.g.
Facebook, Twitter, etc.) Group A Group B
Answer Total (18-25) (26-33)
Not at All Important 10.90% 9.80% 11.90%
Somewhat Unimportant 13.80% 16.20% 11.20%
Neither Important Nor Unimportant 32.60% 31.30% 33.90%
Somewhat Important 31.70% 31.20% 32.30%
Very Important 11.10% 11.40% 10.70%
Total 1551 779 772
21. Are you aware of store brand products? Group A Group B
Answer Total (18-25) (26-33)
Yes 95.70% 94.80% 96.60%
No 2.80% 3.70% 1.80%
Not sure 1.50% 1.50% 1.50%
Total 1557 781 776
22. Have you ever bought a store brand product? Group A Group B
Answer Total (18-25) (26-33)
Yes 95.30% 94.20% 96.50%
No 2.90% 3.90% 2.00%
Not sure 1.70% 1.90% 1.60%
Total 543 774 769

Private Label Manufacturers Association © Copyright 2014 25
23. When you shop for groceries, how often, if at all, do you buy a store
brand product? Group A Group B
Answer Total (18-25) (26-33)
Frequently 35.80% 34.80% 36.90%
Occasionally 52.90% 52.40% 53.40%
Rarely 9.90% 10.60% 9.10%
Never 1.40% 2.20% 0.50%
Total 1537 771 766
24. When you shop for health and beauty products, such as over the
counter medications, vitamins, and personal care items, how often,
if at all, do you buy store brand products? Group A Group B
Answer Total (18-25) (26-33)
Frequently 21.10% 19.90% 22.30%
Occasionally 49.70% 48.70% 50.80%
Rarely 23.30% 23.50% 23.00%
Never 5.90% 8.00% 3.90%
Total 1552 779 773
25. What are the main reasons why you purchase the store brand
product as opposed to a national brand? Group A Group B
Answer Total (18-25) (26-33)
Taste 15.10% 15.90% 14.40%
Quality 28.30% 29.30% 27.30%
Value for the money 70.70% 69.60% 71.80%
Attractiveness of the packaging 4.40% 3.80% 5.00%
Freshness of the products 10.40% 11.00% 9.80%
Variety of package sizes available 13.60% 15.10% 12.10%
Sales and coupons 43.10% 44.40% 41.80%
Advertising and promotion 8.50% 7.70% 9.40%
Trust and confidence in the retailer 24.00% 23.80% 24.20%
None of the above 3.80% 4.70% 2.80%
Total 1558 782 776

Private Label Manufacturers Association © Copyright 2014 26
26. To what extent do you agree or disagree with the following
statements.
a. The store brands that I buy are just as good, if not better than,
national brands Group A Group B
Answer Total (18-25) (26-33)
Strongly Disagree 1.50% 1.70% 1.30%
Disagree 7.10% 7.00% 7.30%
Neither Agree Nor Disagree 27.80% 30.00% 25.60%
Agree 45.00% 41.20% 48.80%
Strongly Agree 17.40% 18.60% 16.20%
Don't Know 1.20% 1.50% 0.80%
Total 1553 781 772
b. Store brands perform as well as national brands Group A Group B
Answer Total (18-25) (26-33)
Strongly Disagree 1.70% 1.80% 1.70%
Disagree 7.40% 7.80% 6.90%
Neither Agree Nor Disagree 27.00% 28.10% 25.90%
Agree 44.60% 40.40% 48.80%
Strongly Agree 17.80% 19.30% 16.30%
Don't Know 1.50% 2.60% 0.40%
Total 1547 779 768
c. The store which I use for my household's main grocery
shopping has better store brand products than other chains Group A Group B
Answer Total (18-25) (26-33)
Strongly Disagree 0.90% 0.80% 1.00%
Disagree 6.20% 7.00% 5.40%
Neither Agree Nor Disagree 33.10% 33.80% 32.40%
Agree 40.50% 40.70% 40.30%
Strongly Agree 17.30% 15.40% 19.20%
Don't Know 2.00% 2.30% 1.70%
Total 1553 781 772

Private Label Manufacturers Association © Copyright 2014 27
d. The packaging of store brand products is as good as that for
national brands Group A Group B
Answer Total (18-25) (26-33)
Strongly Disagree 4.00% 4.00% 4.00%
Disagree 15.40% 13.50% 17.20%
Neither Agree Nor Disagree 28.90% 29.70% 28.00%
Agree 35.80% 36.90% 34.60%
Strongly Agree 14.80% 13.90% 15.60%
Don't Know 1.20% 1.90% 0.50%
Total 1549 775 774
e. The taste of store brand products is as good as that of national
brands Group A Group B
Answer Total (18-25) (26-33)
Strongly Disagree 1.80% 1.80% 1.80%
Disagree 8.30% 7.80% 8.70%
Neither Agree Nor Disagree 28.90% 30.40% 27.40%
Agree 43.60% 43.00% 44.20%
Strongly Agree 16.50% 15.70% 17.40%
Don't Know 0.90% 1.30% 0.50%
Total 1549 779 770
f. Stores should offer a wider variety of store brand products than
they do now Group A Group B
Answer Total (18-25) (26-33)
Strongly Disagree 1.20% 1.00% 1.30%
Disagree 5.90% 6.10% 5.70%
Neither Agree Nor Disagree 33.20% 33.50% 32.90%
Agree 40.90% 40.50% 41.40%
Strongly Agree 17.50% 17.00% 17.90%
Don't Know 1.30% 1.80% 0.80%
Total 1556 781 775

Private Label Manufacturers Association © Copyright 2014 28
g. The promotion of store brand products is as good as that for
national brands Group A Group B
Answer Total (18-25) (26-33)
Strongly Disagree 4.80% 6.40% 3.10%
Disagree 18.80% 17.20% 20.30%
Neither Agree Nor Disagree 27.70% 28.50% 26.90%
Agree 34.30% 32.30% 36.40%
Strongly Agree 13.40% 14.10% 12.70%
Don't Know 1.00% 1.40% 0.60%
Total 1552 779 773
27. In 2014, which of the following factors are likely to encourage you
to buy more store brand products? Group A Group B
Answer Total (18-25) (26-33)
My overall satisfaction with store brands in the past 44.70% 45.30% 44.10%
More variety of store brands 38.00% 38.50% 37.60%
Better quality of store brands 52.60% 52.90% 52.40%
New and innovative store brand products 30.80% 29.50% 32.10%
More advertising and promotion of store brands 20.30% 20.10% 20.60%
Better packaging of store brands 19.80% 21.80% 17.70%
Greater variety of store brand package sizes 29.90% 29.40% 30.40%
More trial packs of store brands 25.30% 22.80% 27.70%
More store brand organic products 25.90% 25.30% 26.50%
More ready meals that I can heat and serve at home 17.20% 17.90% 16.40%
Total 1548 775 773
28. Have you ever purchased any of the following online? Group A Group B
Answer Total (18-25) (26-33)
Books, DVDs or Music 80.90% 76.60% 85.10%
Clothing or shoes 81.20% 78.30% 84.20%
Groceries 25.10% 21.10% 29.10%
Health and beauty products 53.90% 48.70% 59.10%
Travel services 41.00% 28.80% 53.20%
None of the above 3.80% 5.30% 2.30%
Total 1546 774 772

Private Label Manufacturers Association © Copyright 2014 29
29. Before entering the store, have you ever used the Internet to get
more information, look up recipes, or check or compare the price of
a grocery item? Group A Group B
Answer Total (18-25) (26-33)
Often 26.50% 25.50% 27.60%
Sometimes 51.10% 50.40% 51.80%
Rarely 14.80% 14.70% 14.90%
Never 7.60% 9.40% 5.80%
Total 1539 774 765
30. While shopping inside the store, have you ever used a mobile
phone or similar device to get more information, look up recipes, or
check or compare the price of an item? Group A Group B
Answer Total (18-25) (26-33)
Often 17.50% 19.00% 16.00%
Sometimes 41.00% 39.00% 43.10%
Rarely 21.50% 21.30% 21.70%
Never 20.00% 20.80% 19.10%
Total 1553 780 773
31. Have you ever used a smart phone for the following? Group A Group B
Answer Total (18-25) (26-33)
Conduct banking transactions 42.20% 37.30% 47.10%
Get information, compare price on a grocery product 34.90% 33.90% 35.90%
Scan bar codes for product information 36.30% 35.90% 36.80%
Use GPS services in travel 53.70% 50.70% 56.70%
Download digital coupons 46.50% 42.40% 50.60%
Compare prices on products 47.30% 44.30% 50.40%
Load airline boarding passes 17.30% 16.00% 18.70%
Make parking payments 10.40% 9.70% 11.20%
Scan a QR code for product information 35.30% 33.00% 37.50%
None of the above 10.00% 12.30% 7.70%
Total 1390 700 690
I do not own a smart phone 10.60% 10.30% 11.00%
Total 165 80 85

Private Label Manufacturers Association © Copyright 2014 30
32. Do you use any of the following social networking websites? Group A Group B
Answer Total (18-25) (26-33)
Facebook 89.70% 88.90% 90.40%
Twitter 46.10% 45.90% 46.30%
Pinterest 30.80% 26.70% 35.00%
Other (e.g. Instagram, LinkedIn etc.) 26.20% 29.30% 23.10%
I do not use any social networking websites 5.00% 4.90% 5.20%
Total 1547 776 771
33. How often do you use Facebook, Twitter or other social sites? Group A Group B
Answer Total (18-25) (26-33)
Several times a day 49.10% 46.90% 51.40%
Daily 36.00% 36.90% 35.10%
Weekly 11.90% 13.20% 10.70%
Monthly 1.00% 1.10% 0.80%
Less than monthly 1.70% 1.60% 1.80%
Never 0.30% 0.30% 0.30%
Total 1465 735 730
34. Are you aware of advertising that appears on Facebook, Twitter or
other social sites? Group A Group B
Answer Total (18-25) (26-33)
Yes 82.80% 80.30% 85.20%
No 17.20% 19.70% 14.80%
Total 1538 773 765
35. Do you consider these ads to be: Group A Group B
Answer Total (18-25) (26-33)
Not At All Helpful 15.70% 15.80% 15.70%
Not Very Helpful 30.10% 27.50% 32.50%
Somewhat Helpful 36.40% 39.80% 33.10%
Very Helpful 11.80% 11.10% 12.50%
No Opinion 6.00% 5.70% 6.20%
Total 1286 628 658

Private Label Manufacturers Association © Copyright 2014 31
36. Over the next five years, do you expect to purchase more or fewer
of the following online?
a. Books, DVDs or Music
Group A Group B
Answer Total (18-25) (26-33)
More 33.10% 31.70% 34.40%
Same 52.50% 51.50% 53.50%
Fewer 9.70% 9.60% 9.80%
I do not expect to purchase 4.80% 7.20% 2.30%
Total 1546 779 767
b. Clothing or shoes
Group A Group B
Answer Total (18-25) (26-33)
More 37.20% 37.60% 36.70%
Same 52.00% 49.80% 54.30%
Fewer 6.40% 7.20% 5.60%
I do not expect to purchase 4.40% 5.40% 3.40%
Total 1545 779 766
c. Groceries
Group A Group B
Answer Total (18-25) (26-33)
More 18.80% 16.60% 20.90%
Same 43.90% 42.30% 45.50%
Fewer 6.90% 8.10% 5.60%
I do not expect to purchase 30.50% 32.90% 28.00%
Total 1540 775 765
d. Health and beauty products
Group A Group B
Answer Total (18-25) (26-33)
More 23.80% 22.70% 24.90%
Same 55.80% 53.40% 58.20%
Fewer 7.20% 7.60% 6.90%
I do not expect to purchase 13.20% 16.40% 10.00%
Total 1546 776 770

Private Label Manufacturers Association © Copyright 2014 32
e. Travel services
Group A Group B
Answer Total (18-25) (26-33)
More 23.60% 21.30% 25.90%
Same 48.40% 44.60% 52.30%
Fewer 8.90% 9.50% 8.20%
I do not expect to purchase 19.10% 24.60% 13.50%
Total 1544 776 768
37. How do you feel about your own future? Group A Group B
Answer Total (18-25) (26-33)
Very Pessimistic 2.30% 2.80% 1.70%
Pessimistic 7.80% 8.60% 7.00%
Neutral 22.30% 22.20% 22.40%
Optimistic 45.60% 43.40% 47.90%
Very Optimistic 22.00% 22.90% 21.10%
Total 1545 776 769
38. Do you feel your generation is different from previous generations? Group A Group B
Answer Total (18-25) (26-33)
Yes 78.20% 78.60% 77.80%
No 11.90% 11.50% 12.30%
Not sure 9.90% 9.90% 9.90%
Total 1552 781 771
39. Do you feel your generation is financially better or less well off than
previous generations? Group A Group B
Answer Total (18-25) (26-33)
Better off 17.20% 15.50% 18.90%
About the same 28.10% 28.40% 27.70%
Less well off 49.40% 49.90% 48.80%
Not Sure 5.40% 6.10% 4.70%
Total 1554 781 773

Private Label Manufacturers Association © Copyright 2014 33
40. Do you believe your life is better or worse than your parents' lives? Group A Group B
Answer Total (18-25) (26-33)
Better 38.60% 39.90% 37.30%
The same 32.90% 33.10% 32.70%
Worse 19.90% 17.70% 22.10%
Not Sure 8.60% 9.40% 7.90%
Total 1554 781 773
41. Looking into the future, to what extent do you agree or disagree
with the following statements?
a. People will shop online more for groceries Group A Group B
Answer Total (18-25) (26-33)
Strongly Disagree 2.90% 3.00% 2.90%
Disagree 9.50% 11.50% 7.60%
Neither Agree Nor Disagree 25.50% 27.90% 23.10%
Agree 45.70% 42.60% 48.90%
Strongly Agree 16.30% 15.10% 17.50%
Total 1540 775 765
b. Cars will be powered by alternative fuels, such as electric,
solar, etc. Group A Group B
Answer Total (18-25) (26-33)
Strongly Disagree 1.10% 1.40% 0.80%
Disagree 4.40% 4.50% 4.30%
Neither Agree Nor Disagree 21.80% 24.60% 18.90%
Agree 51.60% 47.70% 55.50%
Strongly Agree 21.20% 21.90% 20.50%
Total 1549 778 771
c. The environment will be cleaner Group A Group B
Answer Total (18-25) (26-33)
Strongly Disagree 9.80% 10.20% 9.30%
Disagree 27.40% 26.20% 28.70%
Neither Agree Nor Disagree 32.80% 32.60% 33.10%
Agree 22.40% 23.20% 21.60%
Strongly Agree 7.60% 7.80% 7.40%
Total 557 783 774

Private Label Manufacturers Association © Copyright 2014 34
d. Life expectancies of Americans will extend beyond 100 years Group A Group B
Answer Total (18-25) (26-33)
Strongly Disagree 8.40% 10.10% 6.70%
Disagree 22.70% 21.50% 23.80%
Neither Agree Nor Disagree 31.20% 32.90% 29.50%
Agree 27.20% 25.00% 29.50%
Strongly Agree 10.50% 10.50% 10.40%
Total 1557 781 776
e. All wars will have been eliminated Group A Group B
Answer Total (18-25) (26-33)
Strongly Disagree 37.60% 36.50% 38.60%
Disagree 26.70% 26.00% 27.40%
Neither Agree Nor Disagree 18.40% 20.40% 16.40%
Agree 11.60% 11.30% 12.00%
Strongly Agree 5.70% 5.80% 5.60%
Total 1554 780 774
f. Many of today’s well-known national brands will no longer be
around Group A Group B
Answer Total (18-25) (26-33)
Strongly Disagree 6.60% 6.40% 6.90%
Disagree 27.10% 26.10% 28.10%
Neither Agree Nor Disagree 35.60% 37.30% 33.90%
Agree 23.10% 22.40% 23.70%
Strongly Agree 7.60% 7.80% 7.40%
Total 1553 781 772
g. Supermarkets, food stores, drug stores and discount stores will
look nothing like they do now Group A Group B
Answer Total (18-25) (26-33)
Strongly Disagree 2.10% 2.30% 1.90%
Disagree 15.20% 16.00% 14.30%
Neither Agree Nor Disagree 40.30% 39.40% 41.20%
Agree 32.50% 31.70% 33.40%
Strongly Agree 9.90% 10.60% 9.20%
Total 1555 780 775

Private Label Manufacturers Association © Copyright 2014 35
h. Obesity will still be a public health issue Group A Group B
Answer Total (18-25) (26-33)
Strongly Disagree 0.80% 0.60% 1.00%
Disagree 2.90% 3.60% 2.20%
Neither Agree Nor Disagree 17.50% 19.80% 15.20%
Agree 49.50% 47.60% 51.50%
Strongly Agree 29.20% 28.40% 30.10%
Total 1554 779 775
i. Life on other planets will have been discovered Group A Group B
Answer Total (18-25) (26-33)
Strongly Disagree 8.40% 7.80% 9.00%
Disagree 14.80% 14.20% 15.50%
Neither Agree Nor Disagree 34.70% 35.20% 34.30%
Agree 30.60% 31.50% 29.80%
Strongly Agree 11.40% 11.40% 11.40%
Total 1557 782 775
j. Scientists will have cured cancer Group A Group B
Answer Total (18-25) (26-33)
Strongly Disagree 6.10% 5.40% 6.70%
Disagree 16.40% 16.80% 15.90%
Neither Agree Nor Disagree 36.00% 36.30% 35.60%
Agree 30.70% 30.90% 30.40%
Strongly Agree 10.90% 10.50% 11.30%
Total 1551 779 772

Private Label Manufacturers Association © Copyright 2014 36
SURVEY DEMOGRAPHICS
A. Are you ...?
Group A Group B Answer Total (18-25) (26-33)
Male 48.30% 47.00% 49.60%
Female 51.70% 53.00% 50.40%
Total 1559 783 776
B. In what year were you born?
Group A Group B Answer Total (18-25) (26-33)
1980 1.40% 2.80%
1981 7.80% 15.60%
1982 6.90% 13.90%
1983 6.70% 13.50%
1984 6.70% 13.40%
1985 6.90% 13.80%
1986 7.10% 14.30%
1987 6.30% 12.60%
1988 2.10% 4.10%
1989 8.40% 16.70%
1990 10.90% 21.70%
1991 8.10% 16.10%
1992 7.00% 13.90%
1993 5.20% 10.30%
1994 4.60% 9.10%
1995 4.00% 8.00%
Total 1559 783 776
C. What is your current employment status?
Group A Group B Answer Total (18-25) (26-33)
I have a full time job 43.90% 28.10% 59.90%
I have a part time job 20.50% 28.40% 12.50%
I have more than one job 2.10% 2.30% 1.90%
I am unemployed 18.10% 15.70% 20.50%
I am a full time student 20.10% 36.30% 3.90%
I am a part time student 4.30% 5.60% 3.00%
I am looking for a job 10.50% 14.20% 6.70%
Total 1559 783 776

Private Label Manufacturers Association © Copyright 2014 37
D. How many people live in your household (including children)? Group A Group B
Answer Total (18-25) (26-33)
1 14.60% 16.70% 12.40%
2 23.20% 21.50% 24.90%
3 24.60% 24.00% 25.10%
4 23.50% 23.40% 23.60%
5 9.30% 9.60% 9.00%
6 or more 4.90% 4.90% 5.00%
Total 1559 783 776
E. How much of your household's grocery shopping do you do? Group A Group B
Answer Total (18-25) (26-33)
I am the primary grocery shopper in my household 77.10% 68.60% 85.70%
I share primary grocery shopping with another adult 22.90% 31.40% 14.30%
I am not involved in the household grocery shopping 0.00% 0.00% 0.00%
Total 1559 783 776
F. In all, how many different full time jobs have you held since age 18? Group A Group B
Answer Total (18-25) (26-33)
0 18.10% 31.70% 4.40%
1 20.80% 26.30% 15.20%
2 24.60% 24.80% 24.40%
3 19.10% 12.70% 25.50%
4 9.20% 3.10% 15.30%
5 3.50% 0.40% 6.60%
6 or more 4.80% 0.90% 8.70%
Total 1521 763 758
G. What is the longest period of time you have held the same full time job since age 18? Group A Group B
Answer Total (18-25) (26-33)
Less than 1 year 13.00% 23.70% 5.20%
Between 1 and 3 years 40.10% 59.60% 25.80%
More than 3 years 46.90% 16.60% 69.00%
Total 1521 763 758

Private Label Manufacturers Association © Copyright 2014 38
H. At this stage in your life, do you believe you know in what field your career is likely to be? Group A Group B
Answer Total (18-25) (26-33)
Yes 65.50% 63.80% 67.20%
No 16.00% 16.70% 15.20%
Not sure 18.60% 19.50% 17.60%
Total 1547 778 769
I. Have you ever started your own business? Group A Group B
Answer Total (18-25) (26-33)
Yes 13.80% 10.90% 16.70%
No 44.10% 44.80% 43.30%
No, but I would like to 36.00% 37.30% 34.80%
No, I have no interest 6.20% 7.00% 5.30%
Total 1555 781 774
J. Day to day, what is your main method of transportation? Group A Group B
Answer Total (18-25) (26-33)
I drive my own car 78.40% 70.00% 86.90%
I rent or share a car 4.30% 6.30% 2.30%
I participate in a car pool 1.30% 1.90% 0.80%
I take a taxi or car service 0.50% 0.60% 0.40%
I use public transportation 7.20% 10.30% 4.10%
I use a bicycle 1.40% 2.00% 0.80%
I walk 4.70% 6.00% 3.40%
Other 2.10% 2.80% 1.40%
Total 559 783 776
K. What level of formal education have you achieved? Group A Group B
Answer Total (18-25) (26-33)
Some High School 2.70% 3.80% 1.50%
High School graduate 18.60% 23.20% 14.10%
Some college 35.80% 44.80% 26.70%
College Graduate 27.70% 19.30% 36.10%
Some graduate work 4.30% 4.10% 4.50%
Graduate degree 10.50% 4.10% 17.00%
Prefer not to say 0.30% 0.60% 0.00%
Total 1556 781 775

Private Label Manufacturers Association © Copyright 2014 39
L. If you have outstanding education loans, what is the approximate amount you currently owe? Group A Group B
Answer Total (18-25) (26-33)
Less than $25,000 26.70% 29.90% 23.50%
$25,000 - $50,000 26.90% 26.20% 27.60%
More than $50,000 14.20% 9.90% 18.60%
I have no outstanding education loans 29.20% 29.70% 28.70%
Prefer not to say 3.00% 4.20% 1.70%
Total 1554 778 776
M. With whom do you now live? Group A Group B
Answer Total (18-25) (26-33)
I live alone 15.20% 16.60% 13.80%
With my spouse 35.90% 18.30% 53.70%
With a significant other 11.90% 12.50% 11.20%
At home with my parents or a parent 23.50% 35.70% 11.20%
With adult friends or other family 9.30% 12.70% 5.90%
I am in the military 0.20% 0.40% 0.00%
Other 3.00% 2.80% 3.20%
Total 1555 781 774
N. How many children do you (or your partner) have?
Group A Group B Answer Total (18-25) (26-33)
0 59.60% 73.80% 45.30%
1 18.80% 14.70% 22.80%
2 12.80% 6.10% 19.50%
3 5.20% 2.70% 7.70%
4 1.70% 0.50% 3.00%
5 or more 0.80% 0.50% 1.00%
Prefer not to say 1.20% 1.70% 0.80%
Total 1552 781 771
O. Growing up, would you say you were primarily raised by:
Group A Group B Answer Total (18-25) (26-33)
2 parents 73.50% 70.00% 77.10%
A single parent 21.60% 24.90% 18.30%
Other immediate family members 2.60% 2.80% 2.30%
Others outside your immediate family 0.40% 0.10% 0.60%
Prefer not to say 1.90% 2.20% 1.70%
Total 1556 780 776

Private Label Manufacturers Association © Copyright 2014 40
P. Growing up, how many languages were spoken in your home?
Group A Group B Answer Total (18-25) (26-33)
1 74.30% 70.40% 78.30%
2 22.30% 26.50% 18.10%
3 or more 3.00% 2.60% 3.40%
Prefer not to say 0.40% 0.50% 0.30%
Total 1545 776 769
Q. Were either of your parents immigrants to the U.S.?
Group A Group B Answer Total (18-25) (26-33)
Yes 18.70% 23.40% 14.00%
No 79.50% 74.40% 84.60%
Prefer not to say 1.80% 2.20% 1.40%
Total 1556 782 774
R. Do you hold a U.S. passport?
Group A Group B Answer Total (18-25) (26-33)
Yes 52.70% 52.30% 53.10%
No 44.70% 44.30% 45.10%
Prefer not to say 2.60% 3.40% 1.80%
Total 1550 776 774
S. What is your primary source for world, national and local
news?
Group A Group B Answer Total (18-25) (26-33)
Computer 57.90% 56.10% 59.70%
Tablet 3.80% 4.20% 3.40%
Smart phone 13.50% 15.70% 11.20%
Printed newspaper 0.80% 0.90% 0.80%
TV 21.80% 20.20% 23.40%
Radio 0.70% 0.50% 0.90%
Other 0.40% 0.50% 0.30%
None of above 1.10% 1.80% 0.40%
Total 1557 782 775

Private Label Manufacturers Association © Copyright 2014 41
T. How often do you read a printed newspaper?
Group A Group B Answer Total (18-25) (26-33)
Daily 10.10% 8.10% 12.20%
A few times per week 14.90% 14.60% 15.10%
Weekly 17.60% 16.00% 19.10%
Less than weekly 17.10% 17.50% 16.60%
Less than monthly 38.20% 40.30% 36.00%
Prefer not to say 2.30% 3.50% 1.00%
Total 1554 781 773
U. Approximately, what is the total annual income of your entire
household??
Group A Group B Answer Total (18-25) (26-33)
Less than $25,000 18.50% 25.10% 11.90%
$25,000 - $49,999 33.80% 33.00% 34.50%
$50,000 - $99,999 33.40% 27.70% 39.20%
$100,000 or more 9.50% 7.40% 11.60%
Prefer not to say 4.80% 6.80% 2.80%
Total 1558 782 776

Publication Credits
Editor Dane Twining
Executive Summary Joe Azzinaro
Production Director Alisa Svider
Art Director Fernando Mendez
Graphic Design Amy Chow
Research Director Tom Prendergast
PLMA gratefully acknowledges the cooperation of Surveylab Limited, Wimbledon, London, United Kingdom in development and execution of the survey and processing of survey results.
PRIVATE LABEL MANUFACTURERS ASSOCIATION 630 Third Avenue, New York, NY 10017 Telephone (212) 972-3131 • Fax (212) 983-1382 • www.plma.com © Copyright 2014