complete july 9, 2014 wsj_nbc 4 ny_marist poll new york state release and tables
DESCRIPTION
PollTRANSCRIPT
Marist College Institute for Public Opinion Poughkeepsie, NY 12601 Phone 845.575.5050 Fax 845.575.5111 www.maristpoll.marist.edu
POLL MUST BE SOURCED: The Wall Street Journal/NBC 4 New York/Marist Poll*
Cuomo Outdistancing Largely
Unknown GOP Challenger Astorino *** Complete Tables for Poll Appended ***
For Immediate Release: Wednesday, July 9, 2014
Contact: Lee M. Miringoff Barbara L. Carvalho Marist College, 845.575.5050
This Wall Street Journal/NBC 4 New York/Marist Poll reports: New York State Governor Andrew Cuomo has a sizable lead over his Republican challenger, Westchester County Executive Rob Astorino in this Wall Street Journal/NBC 4 NY/Marist Poll. Cuomo is advantaged by strong support from his Democratic base, in addition, to leading among independents and even attracting a notable proportion of Republicans. Despite voters’ lingering concerns about the economy, Astorino has had difficulty getting traction. A majority of voters do not have an opinion of him, and those who do, divide. Governor Cuomo even outperforms his challenger among voters who see the state as still needing major changes or who see taxes or economic development as the top state priority. “The combination of Cuomo’s standing and voters’ lack of familiarity with Astorino has resulted in a lopsided contest for governor in this Democratic state,” says Dr. Lee M. Miringoff, Director of The Marist College Institute for Public Opinion. “Getting well known requires a lot of resources which will be more than matched by the governor’s war chest.” Poll Points
• 59% of registered voters statewide, including those who are undecided yet leaning toward a candidate, support Governor Cuomo in his re-election bid compared with 24% for Republican Rob Astorino. Six percent back Howie Hawkins, the Green Party candidate. In March, Cuomo led Astorino by 40 points, 65% to 25%. The Green Party candidate was not included in the previous poll.
• Although Astorino tops Cuomo by two to one among Republicans, Cuomo still garners the support of 30% of the GOP. In contrast, Astorino attracts only 4% of Democrats.
*All references to the survey must be sourced as “The Wall Street Journal/NBC 4 New York/Marist Poll.”
• Cuomo even leads Astorino, 50% to 31%, among voters who believe New York State needs major changes or is broken and beyond repair. The governor also bests Astorino among those who cite taxes or economic development as the state’s top priority.
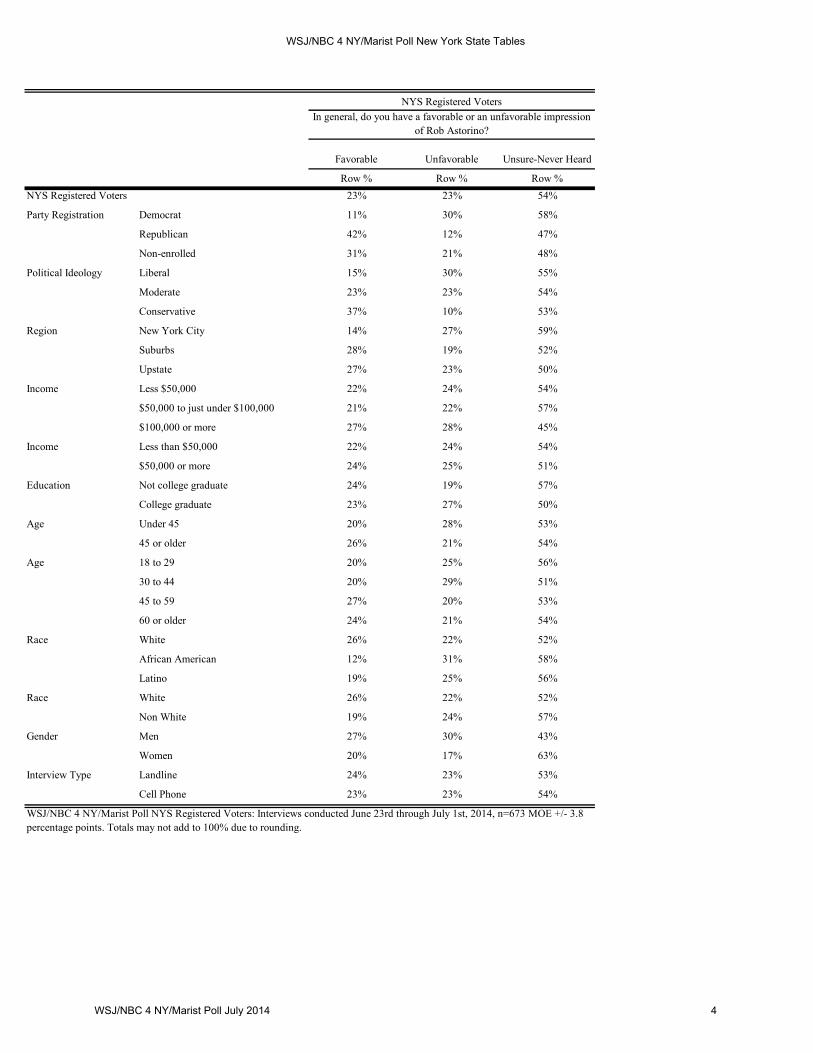
• 58% of registered voters have a positive view of the governor, a slight decline since March when 63% shared this view. But, Astorino is still not well known statewide. A majority of voters, 54%, do not offer an opinion of him. 23% rate him positively, and 23% view him negatively.
• Green Party candidate Howie Hawkins and Democratic primary challenger Zephyr Teachout are not known by most voters.
Voters’ Impressions of the Governor Account for Wide Lead
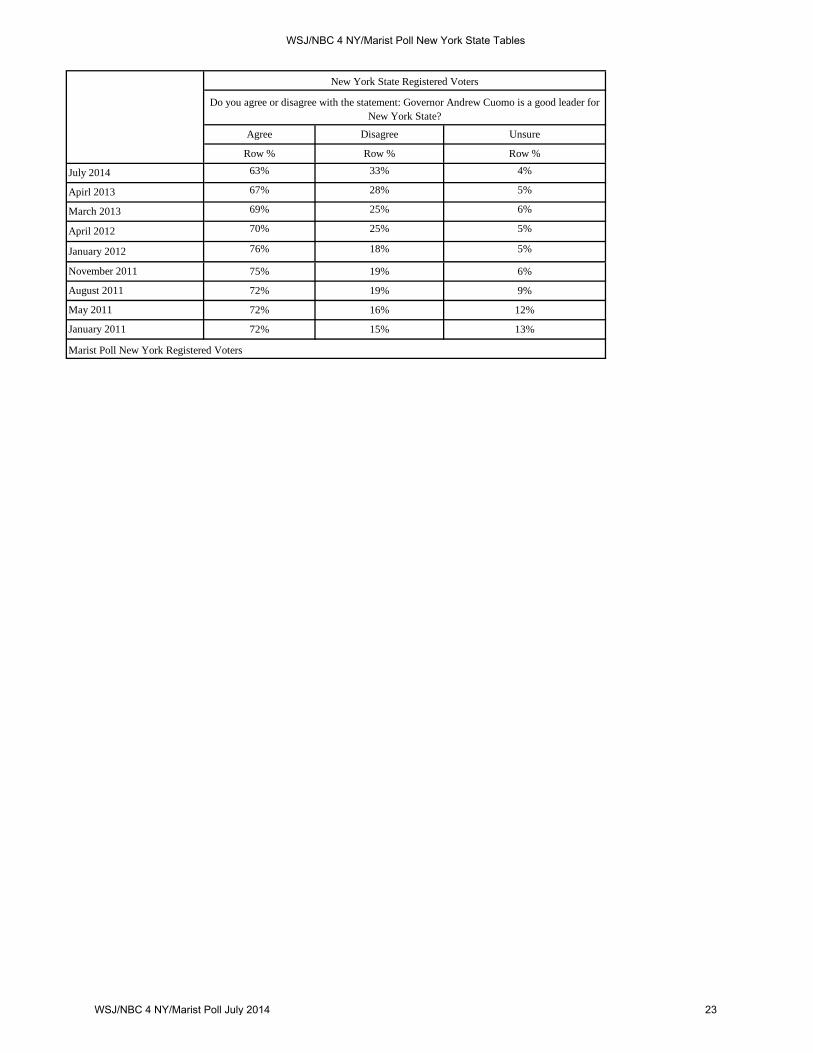
• 63%, overall, say Cuomo is a good leader for NYS, and 60% believe he cares about the average person.
• 55% are confident the Governor is changing the way things work in Albany for the better. 68% of Democrats, 46% of independents, and 45% of Republicans have this view.
• Still, 57% of voters think the state is in need of major changes, and 7% believe it is broken and beyond repair. When Cuomo first took office in January 2011, 73% of voters believed major changes in state government were essential, and 10% thought the state was beyond fixing.
• 45% see Cuomo as a moderate, 34% view him as a liberal, and 12% describe him as conservative. Close to half, 46%, are unsure about Astorino’s political ideology.
• Cuomo’s job approval rating has improved six points – climbing from 42% in March to 48% now. This is in stark contrast to the 26% approval rating of the NYS Senate and the 25% positive score for the NYS Assembly.
Economy Still Top Challenge
• Voters point to a number of economic issues when asked about their top priority for the state. Jobs, economic development, and taxes are three of the top four issues cited. Education ranks second, overall.
• Voters divide about whether the state is on track. 47% believe it is on the right path, while 46% disagree. This is comparable to results seen in March.
• 60% still believe the state remains in a recession although this is down from 65% four months ago. Impressions about the economy have improved slightly in New York City and its suburbs, but there has been little change Upstate.
• A sign that voters may be more optimistic about the state’s economic future is that 56% believe the worst of the economic slump has passed. A majority of voters in all three regions of the state share this view.
*All references to the survey must be sourced as “The Wall Street Journal/NBC 4 New York/Marist Poll.”
How the Survey was Conducted
Nature of the Sample: WSJ/NBC 4 NY/Marist Poll of 833 New York State Adults
This survey of 833 New York State adults was conducted June 23rd through July 1st, 2014 by The
Marist Poll sponsored in partnership with The Wall Street Journal and NBC 4 New York. Adults 18
years of age and older residing in the state of New York were interviewed by telephone using live
interviewers. Landline telephone numbers were randomly selected based upon a list of telephone
exchanges from throughout the state from ASDE Survey Sampler, Inc. The exchanges were selected to
ensure that each region was represented in proportion to its population. To increase coverage, this
landline sample was supplemented by respondents reached through random dialing of cell phone
numbers from Survey Sampling International. The samples were then combined and balanced to reflect
the 2010 Census results for age, gender, income, race, and region. Respondents in the household
were selected by asking for the youngest male. Results for adults are statistically significant within ±3.4
percentage points. There are 673 registered voters. The results for this subset are statistically
significant within ±3.8 percentage points. The error margin increases for cross-tabulations.

NYS Adults NYS Registered Voters
Col % Col %
100%
81% 100%
Democrat n/a 47%
Republican n/a 24%
Non-enrolled n/a 27%
Other n/a 2%
Liberal n/a 33%
Moderate n/a 41%
Conservative n/a 26%
New York City 42% 30%
Suburbs 21% 24%
Upstate 37% 46%
Less $50,000 46% 42%
$50,000 to just under $100,000 29% 31%
$100,000 or more 25% 27%
Less than $50,000 46% 42%
$50,000 or more 54% 58%
Not college graduate 55% 52%
College graduate 45% 48%
Under 45 47% 40%
45 or older 53% 60%
18 to 29 22% 15%
30 to 44 25% 24%
45 to 59 24% 27%
60 or older 29% 34%
White 61% 68%
African American 13% 10%
Latino 16% 16%
Other 9% 6%
White 61% 68%
Non White 39% 32%
Men 48% 47%
Women 52% 53%
Landline 66% 71%
Cell Phone 34% 29%
Nature of the Sample - NYS Adults
WSJ/NBC 4 NY/Marist Poll NYS Adults: Interviews conducted June 23rd through July 1st, 2014, n=833 MOE +/- 3.4 percentage points. NYS Registered Voters: n=673 MOE +/- 3.8 percentage points. Totals may not add to 100% due to rounding.
Gender
Interview Type
Education
Age
Age
Race
Race
Party Registration
Political Ideology
Region
Income
Income
NYS Adults
Registered Voters

Andrew Cuomo, the Democrat
Rob Astorino, the Republican
Howie Hawkins, the Green party candidate Other Undecided
Row % Row % Row % Row % Row %59% 24% 6% 1% 11%
Democrat 81% 4% 5% 0% 9%
Republican 30% 60% 1% 0% 9%
Non-enrolled 48% 25% 14% 1% 12%
Liberal 73% 8% 13% 0% 6%
Moderate 62% 26% 3% 1% 9%
Conservative 40% 45% 1% 0% 13%
No changes-Minor changes 75% 13% 4% 0% 8%
Major changes-Broken and beyond repair
50% 31% 9% 1% 10%
Jobs 55% 30% 5% 1% 9%
Education 68% 11% 9% 0% 13%
Economic development 47% 36% 6% 1% 11%
Taxes 50% 42% 1% 0% 6%
New York City 80% 7% 5% 0% 8%
Suburbs 55% 29% 6% 1% 9%
Upstate 47% 32% 8% 1% 13%
Less $50,000 61% 19% 6% 0% 13%
$50,000 to just under $100,000 58% 26% 7% 1% 9%
$100,000 or more 60% 23% 7% 1% 9%
Less than $50,000 61% 19% 6% 0% 13%
$50,000 or more 59% 24% 7% 1% 9%
Not college graduate 59% 24% 5% 0% 12%
College graduate 58% 25% 7% 0% 9%
Under 45 59% 19% 9% 0% 13%
45 or older 59% 27% 4% 1% 9%
18 to 29 66% 11% 10% 0% 13%
30 to 44 55% 23% 9% 0% 13%
45 to 59 56% 28% 6% 1% 9%
60 or older 61% 26% 3% 1% 9%
White 51% 30% 8% 1% 10%
African American 82% 5% 3% 0% 10%
Latino 72% 14% 1% 0% 14%
White 51% 30% 8% 1% 10%
Non White 75% 10% 4% 0% 12%
Men 56% 28% 9% 1% 7%
Women 61% 20% 5% 0% 14%
Landline 58% 26% 5% 1% 10%
Cell Phone 61% 19% 9% 0% 11%
Political Ideology
Region
Income
Income
Education
NYS Registered Voters
Tossup for NYS governor including those who are undecided, yet leaning toward a candidate
NYS Registered Voters
Party Registration
State Government
Top priority for NYS
Interview Type
WSJ/NBC 4 NY/Marist Poll NYS Registered Voters: Interviews conducted June 23rd through July 1st, 2014, n=673 MOE +/- 3.8 percentage points. Totals may not add to 100% due to rounding.
Age
Age
Race
Race
Gender
WSJ/NBC 4 NY/Marist Poll New York State Tables
WSJ/NBC 4 NY/Marist Poll July 2014 1

Favorable Unfavorable Unsure-Never Heard
Row % Row % Row %58% 32% 10%
Democrat 72% 19% 10%
Republican 41% 52% 7%
Non-enrolled 50% 37% 13%
Liberal 68% 24% 8%
Moderate 62% 29% 9%
Conservative 45% 44% 11%
New York City 68% 19% 14%
Suburbs 60% 32% 8%
Upstate 51% 41% 8%
Less $50,000 61% 28% 10%
$50,000 to just under $100,000 57% 32% 11%
$100,000 or more 56% 35% 9%
Less than $50,000 61% 28% 10%
$50,000 or more 57% 34% 10%
Not college graduate 59% 30% 11%
College graduate 57% 34% 8%
Under 45 57% 30% 13%
45 or older 58% 34% 8%
18 to 29 66% 22% 12%
30 to 44 52% 35% 13%
45 to 59 56% 36% 9%
60 or older 60% 32% 8%
White 53% 37% 10%
African American 70% 20% 10%
Latino 66% 24% 10%
White 53% 37% 10%
Non White 68% 20% 11%
Men 55% 36% 9%
Women 61% 29% 11%
Landline 57% 33% 10%
Cell Phone 61% 29% 10%
NYS Registered Voters
In general, do you have a favorable or an unfavorable impression of Andrew Cuomo?
Income
Education
Age
Age
Race
NYS Registered Voters
Party Registration
Political Ideology
Region
Income
Race
Gender
Interview Type
WSJ/NBC 4 NY/Marist Poll NYS Registered Voters: Interviews conducted June 23rd through July 1st, 2014, n=673 MOE +/- 3.8 percentage points. Totals may not add to 100% due to rounding.
WSJ/NBC 4 NY/Marist Poll New York State Tables
WSJ/NBC 4 NY/Marist Poll July 2014 2

Favorable Unfavorable Unsure-Never Heard
Row % Row % Row %
July 2014 58% 32% 10%
March 2014 63% 33% 4%
November 2013 66% 28% 6%
April 2013 65% 27% 8%
March 2013 66% 25% 9%
April 2012 69% 21% 10%
January 2012 76% 16% 8%
November 2011 70% 19% 11%
August 2011 67% 23% 9%
May 2011 72% 16% 12%
January 2011 71% 17% 12%
Marist Poll New York Registered Voters
New York State Registered Voters
In general, do you have a favorable or an unfavorable impression of Andrew Cuomo?
WSJ/NBC 4 NY/Marist Poll New York State Tables
WSJ/NBC 4 NY/Marist Poll July 2014 3
Favorable Unfavorable Unsure-Never Heard
Row % Row % Row %23% 23% 54%
Democrat 11% 30% 58%
Republican 42% 12% 47%
Non-enrolled 31% 21% 48%
Liberal 15% 30% 55%
Moderate 23% 23% 54%
Conservative 37% 10% 53%
New York City 14% 27% 59%
Suburbs 28% 19% 52%
Upstate 27% 23% 50%
Less $50,000 22% 24% 54%
$50,000 to just under $100,000 21% 22% 57%
$100,000 or more 27% 28% 45%
Less than $50,000 22% 24% 54%
$50,000 or more 24% 25% 51%
Not college graduate 24% 19% 57%
College graduate 23% 27% 50%
Under 45 20% 28% 53%
45 or older 26% 21% 54%
18 to 29 20% 25% 56%
30 to 44 20% 29% 51%
45 to 59 27% 20% 53%
60 or older 24% 21% 54%
White 26% 22% 52%
African American 12% 31% 58%
Latino 19% 25% 56%
White 26% 22% 52%
Non White 19% 24% 57%
Men 27% 30% 43%
Women 20% 17% 63%
Landline 24% 23% 53%
Cell Phone 23% 23% 54%
NYS Registered Voters
Party Registration
Political Ideology
Region
Income
NYS Registered VotersIn general, do you have a favorable or an unfavorable impression
of Rob Astorino?
Race
Gender
Interview Type
WSJ/NBC 4 NY/Marist Poll NYS Registered Voters: Interviews conducted June 23rd through July 1st, 2014, n=673 MOE +/- 3.8 percentage points. Totals may not add to 100% due to rounding.
Income
Education
Age
Age
Race
WSJ/NBC 4 NY/Marist Poll New York State Tables
WSJ/NBC 4 NY/Marist Poll July 2014 4

Favorable Unfavorable Unsure-Never Heard
Row % Row % Row %12% 17% 70%
Democrat 11% 19% 69%
Republican 11% 17% 72%
Non-enrolled 17% 16% 67%
Liberal 21% 14% 65%
Moderate 11% 22% 67%
Conservative 5% 16% 79%
New York City 12% 21% 67%
Suburbs 10% 14% 76%
Upstate 14% 16% 70%
Less $50,000 14% 19% 67%
$50,000 to just under $100,000 13% 18% 70%
$100,000 or more 12% 18% 70%
Less than $50,000 14% 19% 67%
$50,000 or more 12% 18% 70%
Not college graduate 12% 18% 70%
College graduate 13% 16% 71%
Under 45 20% 23% 58%
45 or older 8% 14% 78%
18 to 29 23% 17% 61%
30 to 44 17% 27% 56%
45 to 59 7% 15% 77%
60 or older 8% 13% 78%
White 13% 13% 74%
African American 8% 27% 65%
Latino 12% 31% 57%
White 13% 13% 74%
Non White 12% 27% 61%
Men 14% 23% 63%
Women 11% 12% 77%
Landline 11% 16% 73%
Cell Phone 16% 21% 63%
NYS Registered VotersIn general, do you have a favorable or an unfavorable impression
of Howie Hawkins?
Income
Education
Age
Age
Race
NYS Registered Voters
Party Registration
Political Ideology
Region
Income
Race
Gender
Interview Type
WSJ/NBC 4 NY/Marist Poll NYS Registered Voters: Interviews conducted June 23rd through July 1st, 2014, n=673 MOE +/- 3.8 percentage points. Totals may not add to 100% due to rounding.
WSJ/NBC 4 NY/Marist Poll New York State Tables
WSJ/NBC 4 NY/Marist Poll July 2014 5

Favorable Unfavorable Unsure-Never Heard
Row % Row % Row %6% 13% 81%
Democrat 6% 18% 76%
Republican 4% 12% 84%
Non-enrolled 7% 6% 87%
Liberal 7% 8% 85%
Moderate 8% 17% 75%
Conservative 4% 12% 84%
New York City 8% 19% 73%
Suburbs 5% 7% 88%
Upstate 6% 11% 83%
Less $50,000 9% 15% 76%
$50,000 to just under $100,000 4% 11% 84%
$100,000 or more 6% 13% 81%
Less than $50,000 9% 15% 76%
$50,000 or more 5% 12% 83%
Not college graduate 7% 14% 79%
College graduate 6% 11% 83%
Under 45 9% 18% 72%
45 or older 5% 9% 86%
18 to 29 7% 18% 75%
30 to 44 11% 19% 71%
45 to 59 6% 11% 83%
60 or older 3% 8% 88%
White 6% 9% 85%
African American 3% 23% 74%
Latino 8% 24% 69%
White 6% 9% 85%
Non White 7% 22% 71%
Men 8% 16% 75%
Women 4% 9% 87%
Landline 5% 11% 84%
Cell Phone 9% 16% 75%
NYS Registered Voters
Party Registration
Political Ideology
Region
Income
NYS Registered VotersIn general, do you have a favorable or an unfavorable impression
of Zephyr Teachout?
Race
Gender
Interview Type
WSJ/NBC 4 NY/Marist Poll NYS Registered Voters: Interviews conducted June 23rd through July 1st, 2014, n=673 MOE +/- 3.8 percentage points. Totals may not add to 100% due to rounding.
Income
Education
Age
Age
Race
WSJ/NBC 4 NY/Marist Poll New York State Tables
WSJ/NBC 4 NY/Marist Poll July 2014 6

Liberal Moderate Conservative Unsure
Row % Row % Row % Row %34% 45% 12% 9%
Democrat 30% 48% 14% 9%
Republican 43% 40% 11% 6%
Non-enrolled 34% 49% 9% 9%
Liberal 32% 47% 17% 5%
Moderate 31% 60% 5% 4%
Conservative 47% 27% 17% 9%
New York City 28% 47% 15% 10%
Suburbs 34% 51% 6% 9%
Upstate 38% 42% 13% 8%
Less $50,000 35% 38% 15% 12%
$50,000 to just under $100,000 37% 45% 11% 8%
$100,000 or more 28% 58% 11% 3%
Less than $50,000 35% 38% 15% 12%
$50,000 or more 33% 51% 11% 6%
Not college graduate 33% 38% 16% 13%
College graduate 36% 54% 7% 3%
Under 45 30% 46% 14% 11%
45 or older 37% 44% 11% 8%
18 to 29 33% 40% 15% 12%
30 to 44 28% 49% 13% 10%
45 to 59 43% 39% 10% 8%
60 or older 33% 48% 11% 8%
White 35% 47% 9% 9%
African American 40% 33% 17% 9%
Latino 28% 45% 21% 6%
White 35% 47% 9% 9%
Non White 32% 41% 19% 8%
Men 38% 45% 10% 7%
Women 30% 45% 14% 11%
Landline 35% 46% 11% 8%
Cell Phone 33% 43% 14% 11%
NYS Registered Voters
Politically speaking, do you think Governor Andrew Cuomo is a:
Income
Education
Age
Age
Race
NYS Registered Voters
Party Registration
Political Ideology
Region
Income
Race
Gender
Interview Type
WSJ/NBC 4 NY/Marist Poll NYS Registered Voters: Interviews conducted June 23rd through July 1st, 2014, n=673 MOE +/- 3.8 percentage points. Totals may not add to 100% due to rounding.
WSJ/NBC 4 NY/Marist Poll New York State Tables
WSJ/NBC 4 NY/Marist Poll July 2014 7

Liberal Moderate Conservative Unsure
Row % Row % Row % Row %34% 45% 12% 9%
36% 46% 12% 6%
35% 45% 11% 9%
34% 38% 13% 15%
35% 37% 14% 13%
21% 57% 14% 9%
27% 53% 13% 8%
19% 52% 17% 12%
26% 55% 12% 8%
March 2013
Marist Poll New York Registered Voters
May 2011
NYS Registered Voters
Politically speaking, do you think Governor Andrew Cuomo is a:
January 2011
November 2011
July 2014
January 2012
April 2013
November 2013
March 2014
WSJ/NBC 4 NY/Marist Poll New York State Tables
WSJ/NBC 4 NY/Marist Poll July 2014 8

Liberal Moderate Conservative Unsure
Row % Row % Row % Row %6% 21% 27% 46%
Democrat 9% 15% 26% 50%
Republican 4% 31% 29% 37%
Non-enrolled 5% 23% 29% 43%
Liberal 9% 16% 33% 43%
Moderate 4% 20% 28% 48%
Conservative 8% 29% 22% 41%
New York City 7% 13% 26% 54%
Suburbs 4% 20% 35% 41%
Upstate 7% 26% 24% 43%
Less $50,000 11% 20% 22% 47%
$50,000 to just under $100,000 3% 18% 28% 51%
$100,000 or more 4% 26% 36% 34%
Less than $50,000 11% 20% 22% 47%
$50,000 or more 3% 21% 32% 43%
Not college graduate 8% 22% 21% 49%
College graduate 4% 20% 35% 41%
Under 45 8% 25% 23% 44%
45 or older 5% 18% 29% 48%
18 to 29 1% 26% 23% 49%
30 to 44 11% 24% 24% 41%
45 to 59 5% 18% 34% 43%
60 or older 5% 17% 26% 52%
White 5% 23% 29% 43%
African American 7% 19% 24% 50%
Latino 12% 14% 23% 50%
White 5% 23% 29% 43%
Non White 10% 16% 24% 51%
Men 4% 22% 38% 36%
Women 8% 20% 17% 55%
Landline 5% 23% 27% 46%
Cell Phone 9% 16% 28% 46%
NYS Registered Voters
Party Registration
Political Ideology
Region
Income
NYS Registered Voters
Politically speaking, do you think Rob Astorino is a:
Race
Gender
Interview Type
WSJ/NBC 4 NY/Marist Poll NYS Registered Voters: Interviews conducted June 23rd through July 1st, 2014, n=673 MOE +/- 3.8 percentage points. Totals may not add to 100% due to rounding.
Income
Education
Age
Age
Race
WSJ/NBC 4 NY/Marist Poll New York State Tables
WSJ/NBC 4 NY/Marist Poll July 2014 9

Excellent Good Fair Poor Unsure-Never Heard
Row % Row % Row % Row % Row %9% 39% 33% 17% 2%
Democrat 13% 44% 33% 9% 2%
Republican 7% 30% 34% 30% 0%
Non-enrolled 5% 37% 37% 18% 3%
Liberal 10% 46% 29% 13% 1%
Moderate 10% 40% 36% 14% 0%
Conservative 5% 32% 34% 25% 3%
New York City 12% 42% 37% 6% 2%
Suburbs 10% 44% 28% 15% 2%
Upstate 7% 34% 33% 25% 1%
Yes 7% 35% 35% 21% 2%
No 12% 45% 30% 13% 0%
Less $50,000 8% 41% 38% 11% 2%
$50,000 to just under $100,000 6% 40% 27% 24% 3%
$100,000 or more 11% 39% 35% 15% 0%
Less than $50,000 8% 41% 38% 11% 2%
$50,000 or more 8% 40% 31% 20% 2%
Not college graduate 8% 39% 32% 18% 2%
College graduate 10% 40% 33% 17% 0%
Under 45 6% 35% 38% 17% 3%
45 or older 11% 42% 29% 18% 1%
18 to 29 4% 44% 47% 2% 4%
30 to 44 7% 30% 33% 27% 3%
45 to 59 8% 42% 32% 18% 1%
60 or older 13% 42% 27% 17% 0%
White 8% 38% 33% 20% 1%
African American 9% 40% 42% 7% 2%
Latino 10% 42% 27% 17% 4%
White 8% 38% 33% 20% 1%
Non White 10% 41% 34% 11% 3%
Men 9% 33% 36% 20% 2%
Women 9% 44% 31% 15% 1%
Landline 11% 35% 35% 18% 1%
Cell Phone 5% 47% 29% 16% 3%
NYS Registered VotersWould you rate the job New York State Governor Andrew Cuomo is doing in office as excellent, good, fair, or
poor?
Income
Income
Education
Age
Age
NYS Registered Voters
Party Registration
Political Ideology
Region
NYS in Recession
Race
Race
Gender
Interview Type
WSJ/NBC 4 NY/Marist Poll NYS Registered Voters: Interviews conducted June 23rd through July 1st, 2014, n=673 MOE +/- 3.8 percentage points. Totals may not add to 100% due to rounding.
WSJ/NBC 4 NY/Marist Poll New York State Tables
WSJ/NBC 4 NY/Marist Poll July 2014 10

DateExcellent/
Good Fair/Poor Excellent Good Fair Poor Unsure
July 2014 48% 50% 9% 39% 33% 17% 2%
March 2014 42% 56% 7% 35% 38% 18% 3%
November 2013 52% 44% 8% 44% 31% 13% 3%
April 2013 54% 41% 12% 42% 27% 14% 5%
March 2013 56% 40% 12% 44% 27% 13% 5%
October 2012 59% 37% 15% 44% 30% 7% 3%
April 2012 58% 38% 14% 44% 29% 9% 5%
January 2012 58% 36% 12% 46% 29% 7% 7%
November 2011 55% 39% 9% 46% 32% 7% 6%
August 2011 56% 34% 12% 44% 24% 10% 10%
May 2011 54% 37% 10% 44% 31% 6% 9%
January 2011 48% 33% 9% 39% 28% 5% 19%
Marist Poll New York Registered Voters
New York State Registered Voters
Would you rate the job Governor Andrew Cuomo is doing in office as excellent, good, fair, or poor?
WSJ/NBC 4 NY/Marist Poll New York State Tables
WSJ/NBC 4 NY/Marist Poll July 2014 11

Excellent Good Fair Poor Unsure-Never Heard
Row % Row % Row % Row % Row %2% 24% 44% 25% 5%
Democrat 3% 28% 45% 19% 5%
Republican 2% 22% 45% 29% 3%
Non-enrolled 0% 22% 39% 33% 5%
Liberal 2% 29% 43% 21% 4%
Moderate 2% 19% 49% 27% 2%
Conservative 2% 28% 41% 23% 7%
New York City 3% 29% 44% 19% 6%
Suburbs 1% 26% 43% 20% 10%
Upstate 2% 20% 44% 33% 2%
Less $50,000 3% 28% 44% 21% 4%
$50,000 to just under $100,000 1% 25% 43% 26% 6%
$100,000 or more 2% 19% 47% 29% 3%
Less than $50,000 3% 28% 44% 21% 4%
$50,000 or more 1% 22% 45% 27% 5%
Not college graduate 3% 27% 43% 23% 4%
College graduate 1% 22% 44% 28% 5%
Under 45 1% 24% 44% 23% 8%
45 or older 2% 25% 44% 26% 3%
18 to 29 0% 29% 50% 15% 6%
30 to 44 2% 21% 40% 28% 9%
45 to 59 2% 23% 47% 24% 3%
60 or older 3% 26% 41% 27% 3%
White 1% 22% 43% 30% 4%
African American 4% 28% 45% 15% 7%
Latino 2% 27% 47% 15% 9%
White 1% 22% 43% 30% 4%
Non White 4% 28% 44% 17% 8%
Men 2% 21% 41% 30% 5%
Women 2% 27% 46% 21% 5%
Landline 2% 21% 46% 27% 4%
Cell Phone 3% 31% 39% 20% 7%
NYS Registered Voters
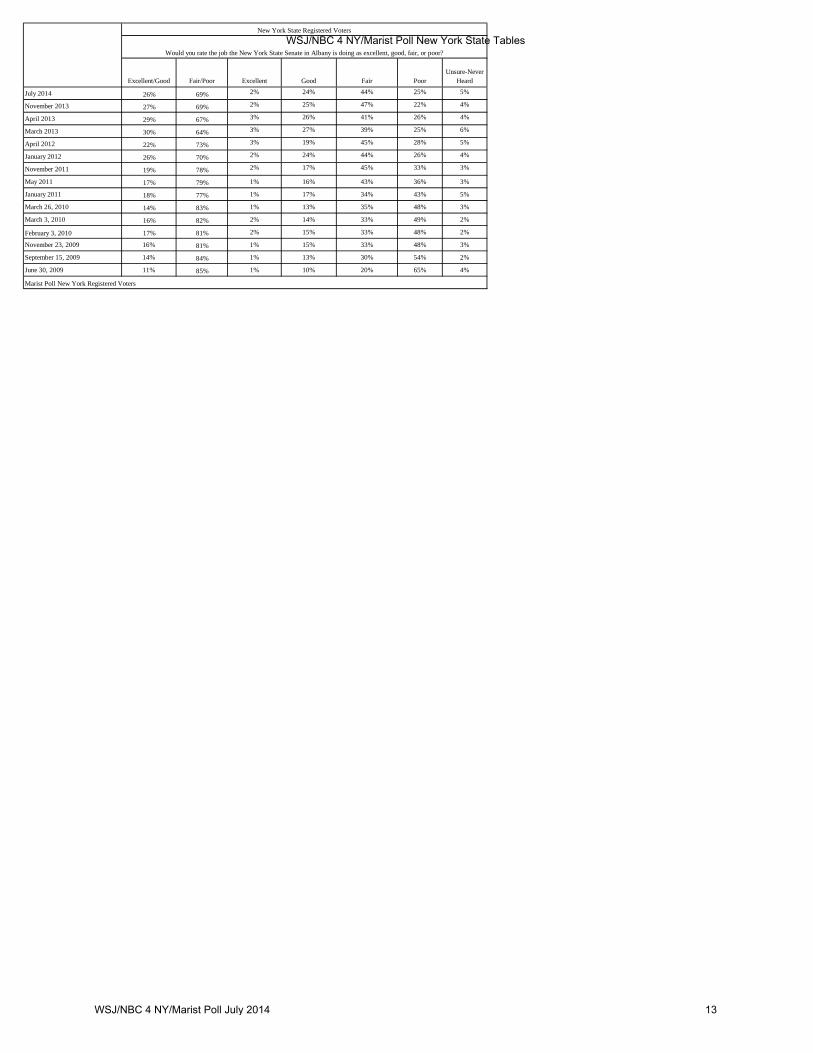
Would you rate the job the New York State Senate in Albany is doing as excellent, good, fair, or poor?
NYS Registered Voters
Party Registration
Age
Age
Race
Race
Gender
Political Ideology
Region
Income
Income
Education
Interview Type
WSJ/NBC 4 NY/Marist Poll NYS Registered Voters: Interviews conducted June 23rd through July 1st, 2014, n=673 MOE +/- 3.8 percentage points. Totals may not add to 100% due to rounding.
WSJ/NBC 4 NY/Marist Poll New York State Tables
WSJ/NBC 4 NY/Marist Poll July 2014 12
Excellent/Good Fair/Poor Excellent Good Fair PoorUnsure-Never
Heard
July 2014 26% 69% 2% 24% 44% 25% 5%
November 2013 27% 69% 2% 25% 47% 22% 4%
April 2013 29% 67% 3% 26% 41% 26% 4%
March 2013 30% 64% 3% 27% 39% 25% 6%
April 2012 22% 73% 3% 19% 45% 28% 5%
January 2012 26% 70% 2% 24% 44% 26% 4%
November 2011 19% 78% 2% 17% 45% 33% 3%
May 2011 17% 79% 1% 16% 43% 36% 3%
January 2011 18% 77% 1% 17% 34% 43% 5%
March 26, 2010 14% 83% 1% 13% 35% 48% 3%
March 3, 2010 16% 82% 2% 14% 33% 49% 2%
February 3, 2010 17% 81% 2% 15% 33% 48% 2%
November 23, 2009 16% 81% 1% 15% 33% 48% 3%
September 15, 2009 14% 84% 1% 13% 30% 54% 2%
June 30, 2009 11% 85% 1% 10% 20% 65% 4%
Would you rate the job the New York State Senate in Albany is doing as excellent, good, fair, or poor?
New York State Registered Voters
Marist Poll New York Registered Voters
WSJ/NBC 4 NY/Marist Poll New York State Tables
WSJ/NBC 4 NY/Marist Poll July 2014 13
Excellent Good Fair Poor Unsure-Never Heard
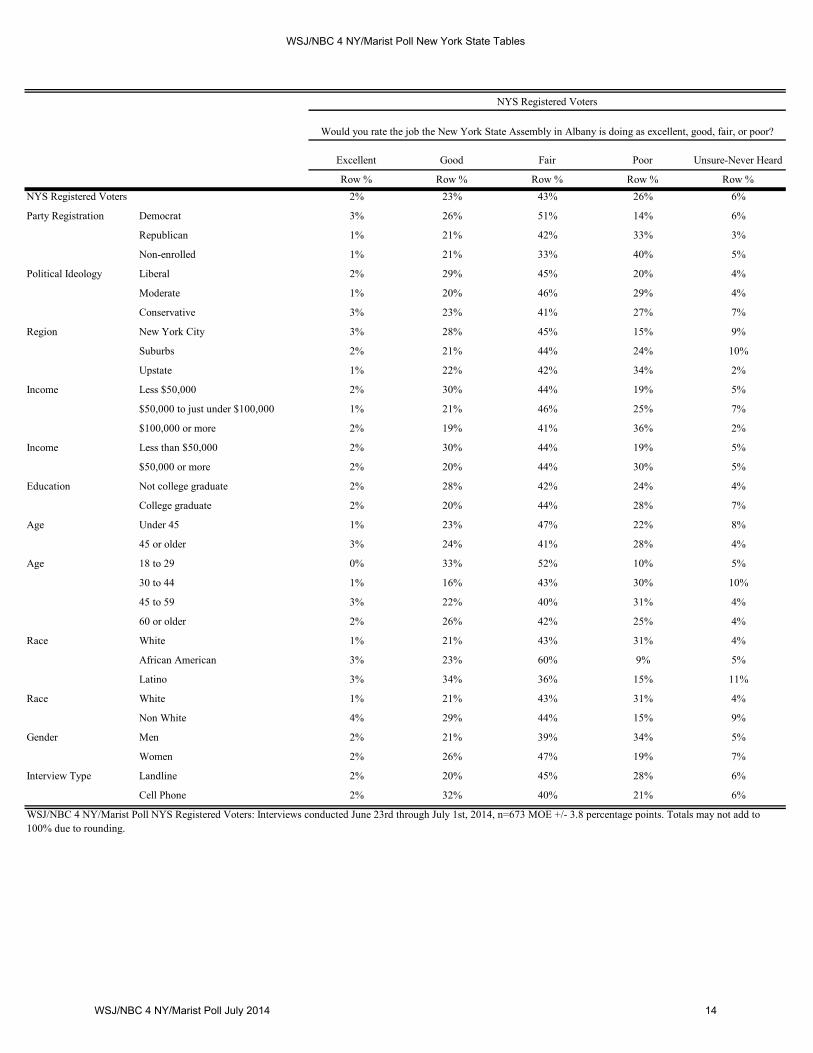
Row % Row % Row % Row % Row %2% 23% 43% 26% 6%
Democrat 3% 26% 51% 14% 6%
Republican 1% 21% 42% 33% 3%
Non-enrolled 1% 21% 33% 40% 5%
Liberal 2% 29% 45% 20% 4%
Moderate 1% 20% 46% 29% 4%
Conservative 3% 23% 41% 27% 7%
New York City 3% 28% 45% 15% 9%
Suburbs 2% 21% 44% 24% 10%
Upstate 1% 22% 42% 34% 2%
Less $50,000 2% 30% 44% 19% 5%
$50,000 to just under $100,000 1% 21% 46% 25% 7%
$100,000 or more 2% 19% 41% 36% 2%
Less than $50,000 2% 30% 44% 19% 5%
$50,000 or more 2% 20% 44% 30% 5%
Not college graduate 2% 28% 42% 24% 4%
College graduate 2% 20% 44% 28% 7%
Under 45 1% 23% 47% 22% 8%
45 or older 3% 24% 41% 28% 4%
18 to 29 0% 33% 52% 10% 5%
30 to 44 1% 16% 43% 30% 10%
45 to 59 3% 22% 40% 31% 4%
60 or older 2% 26% 42% 25% 4%
White 1% 21% 43% 31% 4%
African American 3% 23% 60% 9% 5%
Latino 3% 34% 36% 15% 11%
White 1% 21% 43% 31% 4%
Non White 4% 29% 44% 15% 9%
Men 2% 21% 39% 34% 5%
Women 2% 26% 47% 19% 7%
Landline 2% 20% 45% 28% 6%
Cell Phone 2% 32% 40% 21% 6%
NYS Registered Voters
Party Registration
Political Ideology
Region
Income
NYS Registered Voters
Would you rate the job the New York State Assembly in Albany is doing as excellent, good, fair, or poor?
Race
Gender
Interview Type
WSJ/NBC 4 NY/Marist Poll NYS Registered Voters: Interviews conducted June 23rd through July 1st, 2014, n=673 MOE +/- 3.8 percentage points. Totals may not add to 100% due to rounding.
Income
Education
Age
Age
Race
WSJ/NBC 4 NY/Marist Poll New York State Tables
WSJ/NBC 4 NY/Marist Poll July 2014 14
Excellent/Good Fair/Poor Excellent Good Fair PoorUnsure-Never
Heard
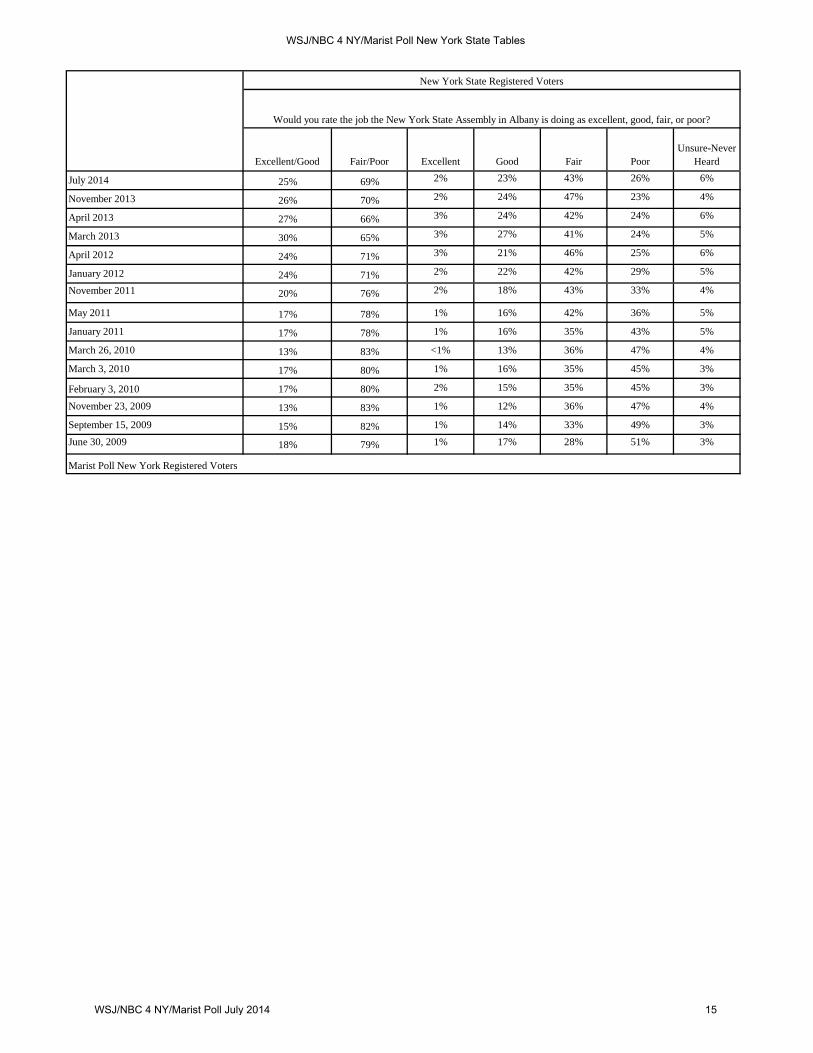
July 2014 25% 69% 2% 23% 43% 26% 6%
November 2013 26% 70% 2% 24% 47% 23% 4%
April 2013 27% 66% 3% 24% 42% 24% 6%
March 2013 30% 65% 3% 27% 41% 24% 5%
April 2012 24% 71% 3% 21% 46% 25% 6%
January 2012 24% 71% 2% 22% 42% 29% 5%
November 2011 20% 76% 2% 18% 43% 33% 4%
May 2011 17% 78% 1% 16% 42% 36% 5%
January 2011 17% 78% 1% 16% 35% 43% 5%
March 26, 2010 13% 83% <1% 13% 36% 47% 4%
March 3, 2010 17% 80% 1% 16% 35% 45% 3%
February 3, 2010 17% 80% 2% 15% 35% 45% 3%
November 23, 2009 13% 83% 1% 12% 36% 47% 4%
September 15, 2009 15% 82% 1% 14% 33% 49% 3%
June 30, 2009 18% 79% 1% 17% 28% 51% 3%
Would you rate the job the New York State Assembly in Albany is doing as excellent, good, fair, or poor?
New York State Registered Voters
Marist Poll New York Registered Voters
WSJ/NBC 4 NY/Marist Poll New York State Tables
WSJ/NBC 4 NY/Marist Poll July 2014 15

Right direction Wrong direction Unsure
Row % Row % Row %47% 46% 6%
Democrat 58% 34% 8%
Republican 33% 65% 2%
Non-enrolled 46% 50% 4%
Liberal 60% 32% 8%
Moderate 49% 48% 4%
Conservative 33% 61% 5%
New York City 62% 32% 7%
Suburbs 51% 42% 6%
Upstate 36% 58% 6%
Less $50,000 47% 48% 6%
$50,000 to just under $100,000 47% 48% 5%
$100,000 or more 50% 45% 5%
Less than $50,000 47% 48% 6%
$50,000 or more 48% 47% 5%
Not college graduate 43% 51% 6%
College graduate 51% 43% 6%
Under 45 48% 49% 3%
45 or older 48% 45% 7%
18 to 29 58% 39% 3%
30 to 44 41% 56% 3%
45 to 59 45% 50% 5%
60 or older 49% 41% 9%
White 45% 49% 6%
African American 61% 34% 5%
Latino 46% 51% 2%
White 45% 49% 6%
Non White 52% 43% 5%
Men 49% 46% 5%
Women 46% 47% 7%
Landline 47% 46% 7%
Cell Phone 49% 47% 4%
NYS Registered VotersIn general, thinking about the way things are going in New York State, do you feel things are going in the right direction or that
things are going in the wrong direction?
Income
Education
Age
Age
Race
NYS Registered Voters
Party Registration
Political Ideology
Region
Income
Race
Gender
Interview Type
WSJ/NBC 4 NY/Marist Poll NYS Registered Voters: Interviews conducted June 23rd through July 1st, 2014, n=673 MOE +/- 3.8 percentage points. Totals may not add to 100% due to rounding.
WSJ/NBC 4 NY/Marist Poll New York State Tables
WSJ/NBC 4 NY/Marist Poll July 2014 16

Right direction Wrong direction Unsure
July 2014 47% 46% 6%
March 2014 50% 47% 3%
November 2013 50% 45% 5%
April 2013 53% 41% 6%
March 2013 51% 44% 4%
October 2012 56% 39% 6%
April 2012 51% 43% 6%
January 2012 52% 40% 8%
November 2011 43% 49% 7%
August 2011 46% 45% 9%
May 2011 41% 54% 6%
January 2011 42% 52% 6%
October 30, 2010 18% 78% 4%
October 22, 2010 21% 74% 5%
September 30, 2010 16% 79% 5%
September 24, 2010 24% 73% 3%
May 7, 2010 22% 72% 6%
March 26, 2010 16% 78% 6%
March 2, 2010 18% 76% 6%
February 3, 2010 21% 74% 5%
November 23, 2009 20% 75% 5%
September 16, 2009 22% 74% 4%
June 30, 2009 21% 74% 5%
May 4, 2009 27% 67% 6%
March 3, 2009 27% 65% 8%
October 2008 35% 57% 8%
April 2008 33% 59% 8%
March 2007 49% 43% 8%
October 2006 35% 56% 9%
July 2006 40% 52% 8%
May 2006 34% 61% 5%
January 2006 39% 54% 7%
September 2005 43% 50% 7%
April 2005 29% 65% 6%
October 2004 40% 54% 6%
September 2004 40% 54% 6%
April 2004 43% 51% 6%
January 2004 42% 46% 12%
September 2003 39% 54% 7%
April 2003 40% 53% 7%
December 2002 39% 52% 9%
October 30, 2002 51% 40% 9%
October 1, 2002 55% 37% 8%
September 2002 56% 38% 6%
May 2002 65% 28% 7%
April 2002 66% 28% 6%
December 2001 65% 25% 10%
April 2001 58% 33% 9%
In general, thinking about the way things are going in New York State, do you feel things are going in the right direction or that things are going in the wrong direction?
New York State Registered Voters
Marist Poll New York Registered Voters
WSJ/NBC 4 NY/Marist Poll New York State Tables
WSJ/NBC 4 NY/Marist Poll July 2014 17
Yes No Unsure
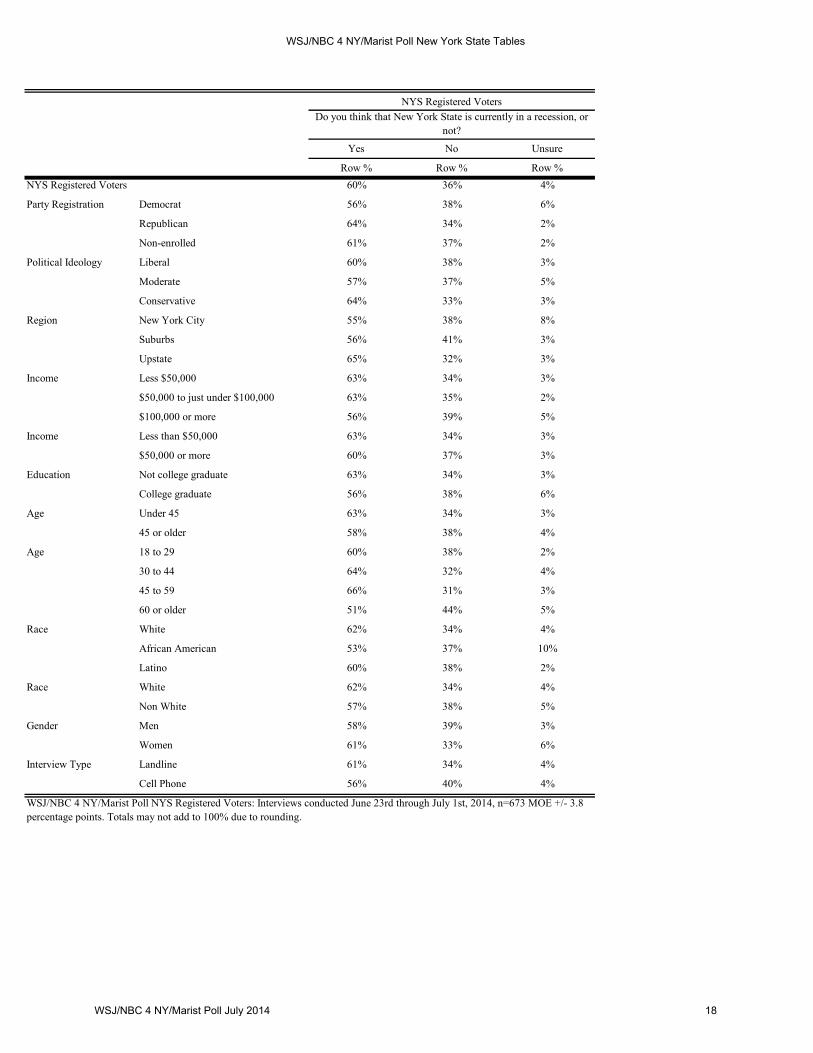
Row % Row % Row %60% 36% 4%
Democrat 56% 38% 6%
Republican 64% 34% 2%
Non-enrolled 61% 37% 2%
Liberal 60% 38% 3%
Moderate 57% 37% 5%
Conservative 64% 33% 3%
New York City 55% 38% 8%
Suburbs 56% 41% 3%
Upstate 65% 32% 3%
Less $50,000 63% 34% 3%
$50,000 to just under $100,000 63% 35% 2%
$100,000 or more 56% 39% 5%
Less than $50,000 63% 34% 3%
$50,000 or more 60% 37% 3%
Not college graduate 63% 34% 3%
College graduate 56% 38% 6%
Under 45 63% 34% 3%
45 or older 58% 38% 4%
18 to 29 60% 38% 2%
30 to 44 64% 32% 4%
45 to 59 66% 31% 3%
60 or older 51% 44% 5%
White 62% 34% 4%
African American 53% 37% 10%
Latino 60% 38% 2%
White 62% 34% 4%
Non White 57% 38% 5%
Men 58% 39% 3%
Women 61% 33% 6%
Landline 61% 34% 4%
Cell Phone 56% 40% 4%
NYS Registered Voters
Party Registration
Political Ideology
Region
Income
NYS Registered VotersDo you think that New York State is currently in a recession, or
not?
Race
Gender
Interview Type
WSJ/NBC 4 NY/Marist Poll NYS Registered Voters: Interviews conducted June 23rd through July 1st, 2014, n=673 MOE +/- 3.8 percentage points. Totals may not add to 100% due to rounding.
Income
Education
Age
Age
Race
WSJ/NBC 4 NY/Marist Poll New York State Tables
WSJ/NBC 4 NY/Marist Poll July 2014 18

Date Yes No Unsure
July 2014 60% 36% 4%
March 2014 65% 34% 1%
April 2013 58% 39% 3%
March 2013 61% 35% 4%
April 2012 67% 30% 3%
January 2012 72% 26% 3%
November 2011 78% 20% 2%
November 2009 86% 12% 2%
September 2009 90% 9% 1%
October 2008 79% 19% 2%
April 2008 73% 24% 3%
January 2006 47% 46% 7%
September 2005 49% 44% 7%
April 2005 55% 37% 8%
October 2004 62% 33% 5%
September 2004 58% 37% 5%
April 2004 62% 34% 4%
January 2004 56% 33% 11%
September 2003 64% 31% 5%
April 2003 74% 22% 4%
December 2002 71% 26% 3%
October 2002 71% 26% 3%
September 2002 71% 25% 4%
May 2002 62% 33% 5%
April 2002 68% 28% 4%
December 2001 76% 19% 5%
September 1998 23% 71% 6%
February 1998 28% 65% 7%
October 1997 36% 58% 6%
March 1997 42% 51% 7%
November 1996 48% 45% 7%
March 1996 56% 37% 7%
September 1995 56% 34% 10%
October 1994 67% 27% 6%
September 1994 63% 28% 9%
March 1991 84% 13% 3%
NYS Registered Voters
Do you think that New York State is currently in a recession, or not?
Marist Poll New York Registered Voters
WSJ/NBC 4 NY/Marist Poll New York State Tables
WSJ/NBC 4 NY/Marist Poll July 2014 19
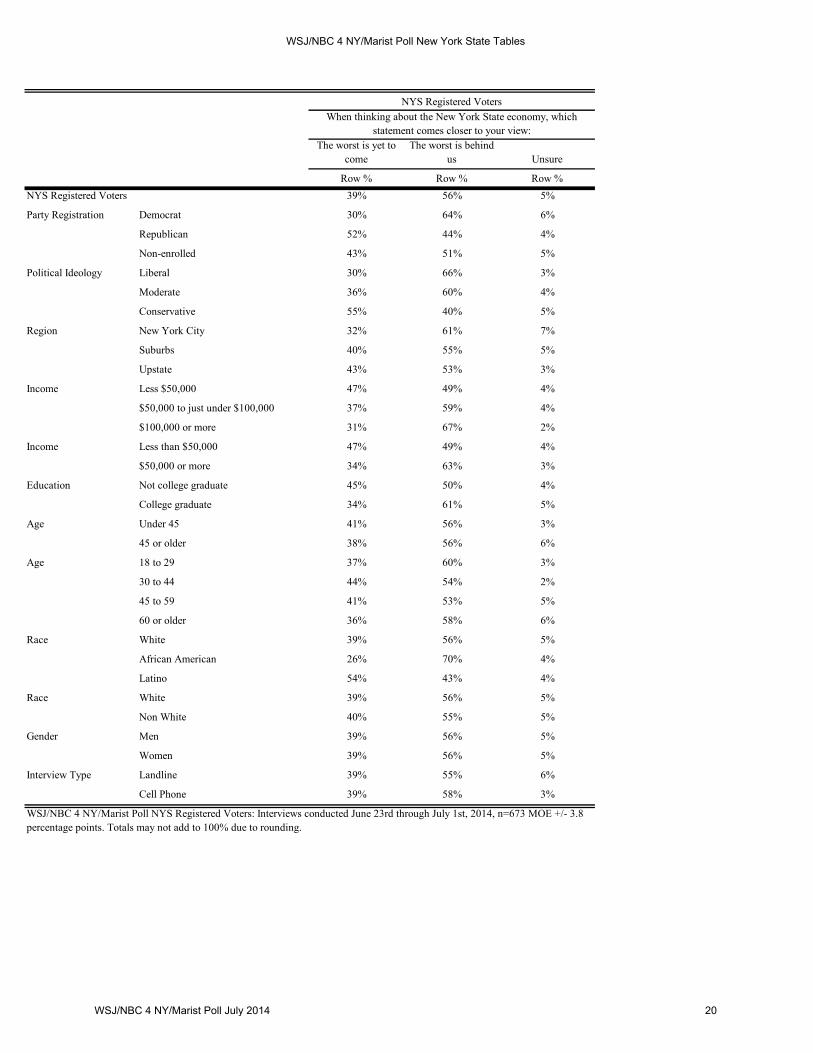
The worst is yet to come
The worst is behind us Unsure
Row % Row % Row %39% 56% 5%
Democrat 30% 64% 6%
Republican 52% 44% 4%
Non-enrolled 43% 51% 5%
Liberal 30% 66% 3%
Moderate 36% 60% 4%
Conservative 55% 40% 5%
New York City 32% 61% 7%
Suburbs 40% 55% 5%
Upstate 43% 53% 3%
Less $50,000 47% 49% 4%
$50,000 to just under $100,000 37% 59% 4%
$100,000 or more 31% 67% 2%
Less than $50,000 47% 49% 4%
$50,000 or more 34% 63% 3%
Not college graduate 45% 50% 4%
College graduate 34% 61% 5%
Under 45 41% 56% 3%
45 or older 38% 56% 6%
18 to 29 37% 60% 3%
30 to 44 44% 54% 2%
45 to 59 41% 53% 5%
60 or older 36% 58% 6%
White 39% 56% 5%
African American 26% 70% 4%
Latino 54% 43% 4%
White 39% 56% 5%
Non White 40% 55% 5%
Men 39% 56% 5%
Women 39% 56% 5%
Landline 39% 55% 6%
Cell Phone 39% 58% 3%
NYS Registered VotersWhen thinking about the New York State economy, which
statement comes closer to your view:
Income
Education
Age
Age
Race
NYS Registered Voters
Party Registration
Political Ideology
Region
Income
Race
Gender
Interview Type
WSJ/NBC 4 NY/Marist Poll NYS Registered Voters: Interviews conducted June 23rd through July 1st, 2014, n=673 MOE +/- 3.8 percentage points. Totals may not add to 100% due to rounding.
WSJ/NBC 4 NY/Marist Poll New York State Tables
WSJ/NBC 4 NY/Marist Poll July 2014 20
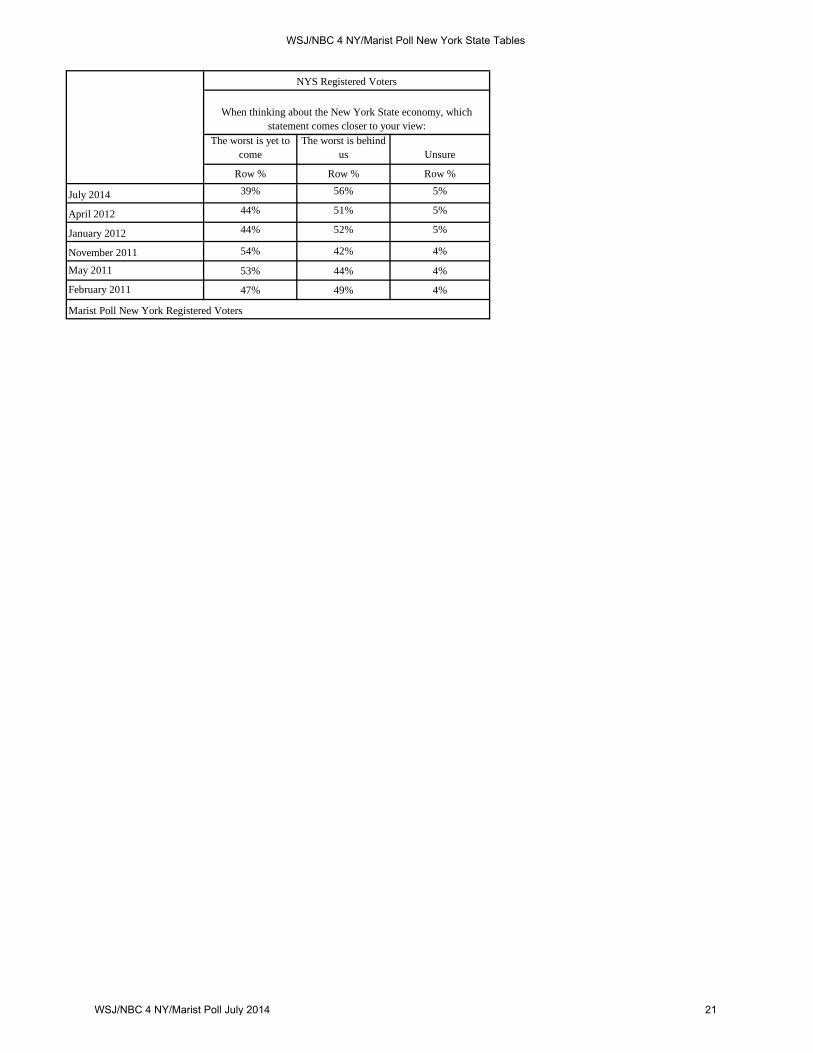
The worst is yet to come
The worst is behind us Unsure
Row % Row % Row %39% 56% 5%
44% 51% 5%
44% 52% 5%
54% 42% 4%
53% 44% 4%
47% 49% 4%
Marist Poll New York Registered Voters
NYS Registered Voters
When thinking about the New York State economy, which statement comes closer to your view:
February 2011
May 2011
July 2014
November 2011
January 2012
April 2012
WSJ/NBC 4 NY/Marist Poll New York State Tables
WSJ/NBC 4 NY/Marist Poll July 2014 21

Agree Disagree Unsure
Row % Row % Row %63% 33% 4%
Democrat 77% 18% 5%
Republican 44% 53% 2%
Non-enrolled 58% 40% 2%
Liberal 75% 22% 3%
Moderate 67% 30% 3%
Conservative 47% 50% 4%
New York City 75% 18% 7%
Suburbs 66% 30% 3%
Upstate 54% 44% 2%
Less $50,000 66% 28% 6%
$50,000 to just under $100,000 59% 38% 3%
$100,000 or more 63% 34% 3%
Less than $50,000 66% 28% 6%
$50,000 or more 61% 36% 3%
Not college graduate 63% 34% 3%
College graduate 65% 32% 4%
Under 45 62% 32% 5%
45 or older 64% 34% 3%
18 to 29 73% 23% 4%
30 to 44 56% 38% 6%
45 to 59 61% 36% 3%
60 or older 66% 31% 3%
White 58% 39% 3%
African American 76% 21% 3%
Latino 71% 22% 8%
White 58% 39% 3%
Non White 75% 19% 6%
Men 59% 38% 3%
Women 67% 28% 4%
Landline 62% 34% 3%
Cell Phone 66% 30% 5%
NYS Registered Voters
Party Registration
Political Ideology
Region
Income
NYS Registered VotersDo you agree or disagree with the statement: Governor Andrew
Cuomo is a good leader for New York State?
Race
Gender
Interview Type
WSJ/NBC 4 NY/Marist Poll NYS Registered Voters: Interviews conducted June 23rd through July 1st, 2014, n=673 MOE +/- 3.8 percentage points. Totals may not add to 100% due to rounding.
Income
Education
Age
Age
Race
WSJ/NBC 4 NY/Marist Poll New York State Tables
WSJ/NBC 4 NY/Marist Poll July 2014 22
Agree Disagree Unsure
Row % Row % Row %63% 33% 4%
67% 28% 5%
69% 25% 6%
70% 25% 5%
76% 18% 5%
75% 19% 6%
72% 19% 9%
72% 16% 12%
72% 15% 13%
March 2013
Marist Poll New York Registered Voters
New York State Registered Voters
Do you agree or disagree with the statement: Governor Andrew Cuomo is a good leader for New York State?
January 2011
August 2011
May 2011
July 2014
November 2011
January 2012
April 2012
Apirl 2013
WSJ/NBC 4 NY/Marist Poll New York State Tables
WSJ/NBC 4 NY/Marist Poll July 2014 23

Agree Disagree Unsure
Row % Row % Row %60% 37% 4%
Democrat 72% 25% 3%
Republican 48% 50% 1%
Non-enrolled 52% 44% 4%
Liberal 71% 28% 2%
Moderate 63% 35% 2%
Conservative 44% 51% 5%
New York City 70% 25% 4%
Suburbs 67% 29% 4%
Upstate 49% 48% 3%
Less $50,000 62% 35% 3%
$50,000 to just under $100,000 56% 39% 5%
$100,000 or more 62% 37% 1%
Less than $50,000 62% 35% 3%
$50,000 or more 59% 38% 3%
Not college graduate 58% 39% 3%
College graduate 62% 35% 4%
Under 45 56% 40% 4%
45 or older 63% 34% 3%
18 to 29 65% 29% 6%
30 to 44 50% 47% 3%
45 to 59 59% 38% 3%
60 or older 66% 31% 3%
White 57% 40% 3%
African American 73% 24% 3%
Latino 60% 33% 7%
White 57% 40% 3%
Non White 66% 29% 5%
Men 56% 41% 3%
Women 64% 33% 4%
Landline 61% 37% 3%
Cell Phone 58% 36% 6%
NYS Registered VotersDo you agree or disagree with the statement: Governor Andrew
Cuomo cares about the average person?
Income
Education
Age
Age
Race
NYS Registered Voters
Party Registration
Political Ideology
Region
Income
Race
Gender
Interview Type
WSJ/NBC 4 NY/Marist Poll NYS Registered Voters: Interviews conducted June 23rd through July 1st, 2014, n=673 MOE +/- 3.8 percentage points. Totals may not add to 100% due to rounding.
WSJ/NBC 4 NY/Marist Poll New York State Tables
WSJ/NBC 4 NY/Marist Poll July 2014 24

Agree Disagree Unsure
Row % Row % Row %55% 39% 6%
Democrat 68% 26% 6%
Republican 45% 52% 3%
Non-enrolled 46% 48% 6%
Liberal 62% 32% 5%
Moderate 59% 38% 4%
Conservative 47% 47% 6%
New York City 67% 25% 7%
Suburbs 55% 38% 8%
Upstate 48% 48% 4%
Less $50,000 62% 33% 5%
$50,000 to just under $100,000 48% 44% 9%
$100,000 or more 53% 45% 2%
Less than $50,000 62% 33% 5%
$50,000 or more 50% 44% 6%
Not college graduate 56% 38% 5%
College graduate 55% 40% 5%
Under 45 54% 41% 6%
45 or older 56% 38% 6%
18 to 29 63% 31% 5%
30 to 44 48% 46% 6%
45 to 59 52% 44% 4%
60 or older 59% 34% 7%
White 49% 45% 6%
African American 67% 27% 6%
Latino 69% 26% 4%
White 49% 45% 6%
Non White 70% 26% 5%
Men 50% 46% 4%
Women 60% 33% 7%
Landline 54% 40% 6%
Cell Phone 57% 37% 5%
NYS Registered Voters
Party Registration
Political Ideology
Region
Income
NYS Registered Voters
Do you agree or disagree with the statement: Governor Andrew Cuomo is changing the way things work in Albany for the better?
Race
Gender
Interview Type
WSJ/NBC 4 NY/Marist Poll NYS Registered Voters: Interviews conducted June 23rd through July 1st, 2014, n=673 MOE +/- 3.8 percentage points. Totals may not add to 100% due to rounding.
Income
Education
Age
Age
Race
WSJ/NBC 4 NY/Marist Poll New York State Tables
WSJ/NBC 4 NY/Marist Poll July 2014 25

Agree Disagree Unsure
Row % Row % Row %55% 39% 6%
56% 40% 3%
61% 35% 4%
58% 33% 9%
61% 32% 7%
61% 30% 9%
68% 26% 7%
63% 28% 8%
60% 25% 14%
62% 27% 11%
58% 23% 19%
March 2013
Marist Poll New York Registered Voters
New York State Registered Voters
Do you agree or disagree with the statement: Governor Andrew Cuomo is changing the way things work in Albany for the better?
January 2011
July 2014
May 2011
August 2011
November 2011
January 2012
April 2012
April 2013
November 2013
March 2014
WSJ/NBC 4 NY/Marist Poll New York State Tables
WSJ/NBC 4 NY/Marist Poll July 2014 26
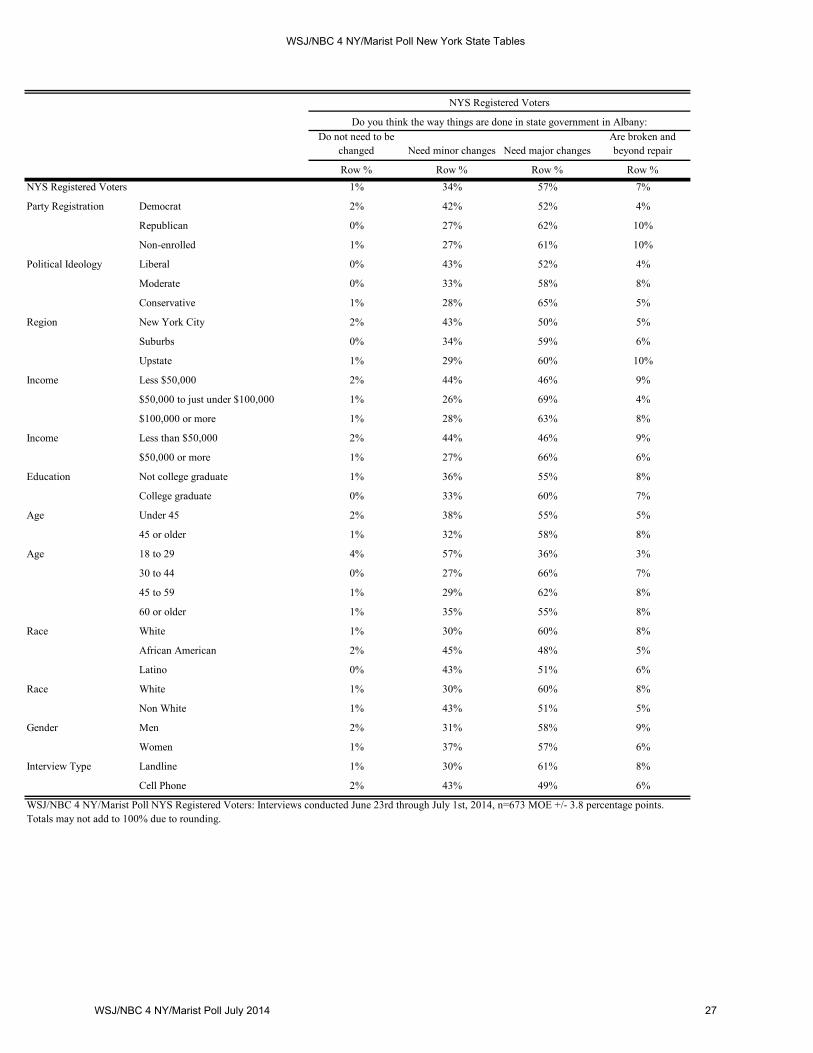
Do not need to be changed Need minor changes Need major changes
Are broken and beyond repair
Row % Row % Row % Row %1% 34% 57% 7%
Democrat 2% 42% 52% 4%
Republican 0% 27% 62% 10%
Non-enrolled 1% 27% 61% 10%
Liberal 0% 43% 52% 4%
Moderate 0% 33% 58% 8%
Conservative 1% 28% 65% 5%
New York City 2% 43% 50% 5%
Suburbs 0% 34% 59% 6%
Upstate 1% 29% 60% 10%
Less $50,000 2% 44% 46% 9%
$50,000 to just under $100,000 1% 26% 69% 4%
$100,000 or more 1% 28% 63% 8%
Less than $50,000 2% 44% 46% 9%
$50,000 or more 1% 27% 66% 6%
Not college graduate 1% 36% 55% 8%
College graduate 0% 33% 60% 7%
Under 45 2% 38% 55% 5%
45 or older 1% 32% 58% 8%
18 to 29 4% 57% 36% 3%
30 to 44 0% 27% 66% 7%
45 to 59 1% 29% 62% 8%
60 or older 1% 35% 55% 8%
White 1% 30% 60% 8%
African American 2% 45% 48% 5%
Latino 0% 43% 51% 6%
White 1% 30% 60% 8%
Non White 1% 43% 51% 5%
Men 2% 31% 58% 9%
Women 1% 37% 57% 6%
Landline 1% 30% 61% 8%
Cell Phone 2% 43% 49% 6%
NYS Registered Voters
Party Registration
Political Ideology
Region
NYS Registered Voters
Do you think the way things are done in state government in Albany:
Race
Race
Gender
Interview Type
WSJ/NBC 4 NY/Marist Poll NYS Registered Voters: Interviews conducted June 23rd through July 1st, 2014, n=673 MOE +/- 3.8 percentage points. Totals may not add to 100% due to rounding.
Income
Income
Education
Age
Age
WSJ/NBC 4 NY/Marist Poll New York State Tables
WSJ/NBC 4 NY/Marist Poll July 2014 27
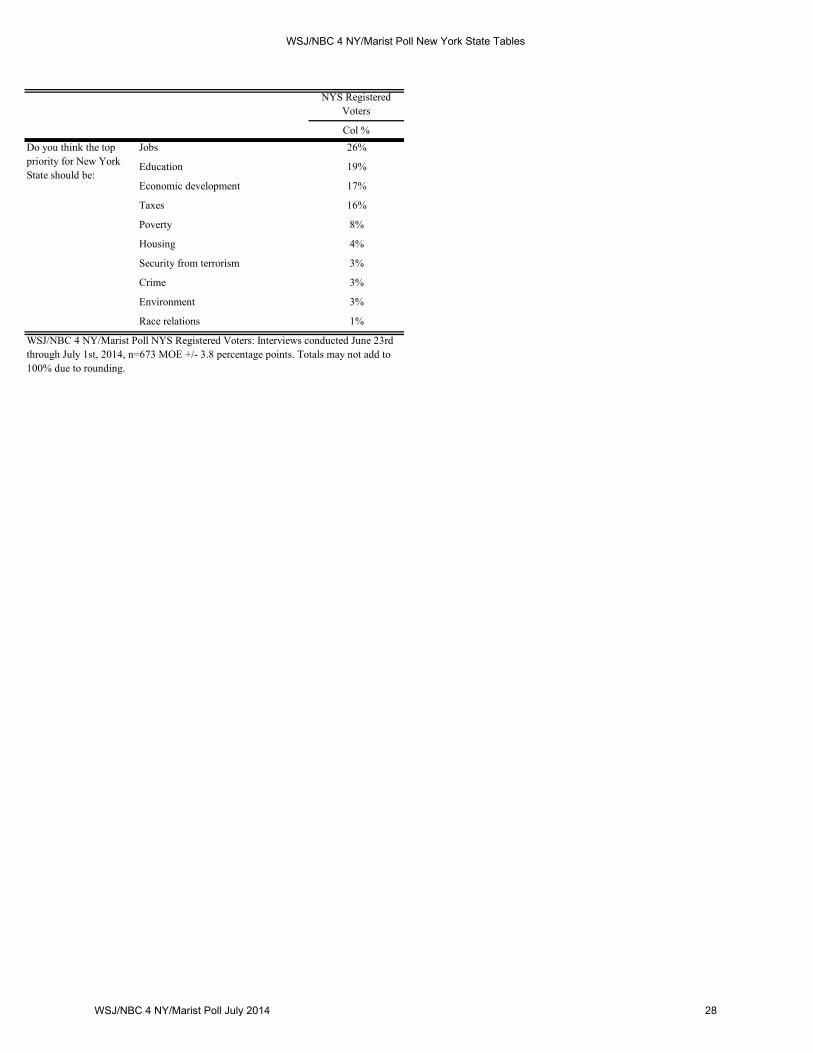
NYS Registered Voters
Col %Jobs 26%
Education 19%
Economic development 17%
Taxes 16%
Poverty 8%
Housing 4%
Security from terrorism 3%
Crime 3%
Environment 3%
Race relations 1%
Do you think the top priority for New York State should be:
WSJ/NBC 4 NY/Marist Poll NYS Registered Voters: Interviews conducted June 23rd through July 1st, 2014, n=673 MOE +/- 3.8 percentage points. Totals may not add to 100% due to rounding.
WSJ/NBC 4 NY/Marist Poll New York State Tables
WSJ/NBC 4 NY/Marist Poll July 2014 28

Jobs EducationEconomic
development Taxes Other
Row % Row % Row % Row % Row %26% 19% 17% 16% 21%
Democrat 26% 23% 13% 8% 30%
Republican 29% 14% 20% 29% 9%
Non-enrolled 22% 19% 21% 19% 20%
Liberal 21% 25% 13% 8% 34%
Moderate 28% 19% 21% 19% 13%
Conservative 27% 14% 16% 25% 18%
New York City 26% 19% 17% 4% 35%
Suburbs 22% 17% 18% 18% 25%
Upstate 28% 21% 17% 23% 11%
Less $50,000 30% 19% 13% 13% 25%
$50,000 to just under $100,000 29% 18% 18% 17% 19%
$100,000 or more 18% 23% 23% 17% 19%
Less than $50,000 30% 19% 13% 13% 25%
$50,000 or more 23% 20% 20% 17% 19%
Not college graduate 30% 15% 14% 17% 24%
College graduate 22% 23% 20% 16% 19%
Under 45 24% 25% 16% 12% 23%
45 or older 28% 16% 18% 18% 20%
18 to 29 30% 28% 11% 6% 25%
30 to 44 20% 23% 19% 16% 22%
45 to 59 24% 17% 21% 16% 22%
60 or older 31% 16% 15% 19% 18%
White 27% 16% 18% 19% 20%
African American 31% 29% 9% 4% 26%
Latino 22% 28% 19% 12% 19%
White 27% 16% 18% 19% 20%
Non White 24% 29% 14% 9% 24%
Men 27% 15% 23% 16% 20%
Women 25% 23% 12% 17% 23%
Landline 26% 19% 17% 16% 22%
Cell Phone 26% 21% 15% 17% 20%
NYS Registered Voters
Party Registration
Political Ideology
Region
NYS Registered Voters
Do you think the top priority for New York State should be:
Race
Race
Gender
Interview Type
WSJ/NBC 4 NY/Marist Poll NYS Registered Voters: Interviews conducted June 23rd through July 1st, 2014, n=673 MOE +/- 3.8 percentage points. Totals may not add to 100% due to rounding.
Income
Income
Education
Age
Age
WSJ/NBC 4 NY/Marist Poll New York State Tables
WSJ/NBC 4 NY/Marist Poll July 2014 29