compilation part notice
TRANSCRIPT
. Defense Technical Information Center
Compilation Part Notice
This paper is a part of the following report:
Ti•tle: Technology Showcase: Integrated Monitorn_ DiansisadLa~~r•~vnin
Proceedings of a Joint Conference, Mobile, Alabama, April 22-26, 1996.
* To order the complete compilation report, use: AD-A325 558
The component part is provided here to allow users access to individually authored sectionsof proceedings, annals, symposia, etc. However, the component should be considered withinthe context of the overall compilation report and not as a stand-alone technical report.
Distribution Statement A:This document has been approved for publicrelease and sale, its distribution is unlimited.
19971126 038 I TICInformaton For The Defense Comnmunitly
" | - N P !

THE DEVELOPMENT OF A COST BENEFIT ANALYSIS METHODFOR MONITORING THE CONDITION OF BATCH
PROCESS PLANT MACHINERY
B.S. RajanGlaxoWellcome Operations, Ulverston
.Cumbria, U.K.
Brian J. RoylanceDepartment of Mechanical Engineering
University of Wales, Swansea, U.K.
Abstract: Whereas it is self-evident that large potential cost benefits exist for high capital cost -high consequential loss plant, the scope for achieving realistic cost benefits for lower value, batchprocess equipment is less obvious and. is also difficult to quantify. The results presented in thispaper represents an attempt to determine a suitable basis for establishing cost benefits for plantmachinery typified by that utilised for the manufacture of pharmaceutical products. In thispreliminary investigation, a mathematical model has been devised for pump operation throughoutthe whole plant. It is based on actual data obtained over a five year period in which amaintenance cost prediction is established and the advisability of utilising condition - basedmaintenance strategy is decided.
Key Words: Cost Benefit Analysis; Maintenance; Mathematical Model; Pumps;
Introduct:'n: Maintenance of running machinery has been a need as long as machinery hasexisted. Lom the onset of the Irdustrial Revolution until the end of the Second Wufld Warmachinery was ,paired as it broke down. There were no philosophical consideiations of anyother type of maintenance practice. It was implicit in the running and maintenance of MarineMachinery [1] published in 1965 that this was the philosophy to be followed. However, sincethen there have been a numerous studies of maintenance practice [2] and a recognition that costscould be as much as 80% of machine capital costs per annum. Hence it is worth analysingwhether other philosophies are most cost effective. The current maintenance costs for Britishindustry is estimated to be £20 billion and therefore the scope of prospective saving can bespectacular.
Initially the move away from breakdown maintenance was driven by a recognition thatbreakdowns had considerable consequential costs if a continuous manufacturing process wasinterrupted without warning. It was also realised that manning for the peaks in maintenanceactivity was a very inefficient use of manpower and hence the next philosophy to be advocatedwas that of preventive maintenance. In this philosophy, machinery was serviced at regular

intervals and all worn parts replaced. (This could be considered as one form of conditionmonitoring where by a full intrusive examination was carried out). The time intervals used forthis maintenance activity were decided empiricaily as detailed records were not available in mostareas. In many cases they were done to suit either the resources available or at convenient timeintervals (e.g. 26 weeks, 1 year etc.).
In the late 60's and early 70's, in the defence industry, especially in operational units, wheremachine availabilit was the overriding concern, a philosophy of using the reliability data thatwas available to establish preventive maintenance intervals was suggested. As the data onmachine availability and repair times were available in most combat and continuous runningsituations for key machinery, MTBF (Mean Time Between Failure) and MTTR (Mean Time ToRepair) times were determinable. Thus, statistical analyses could be carried out and confidencelimits for machine availability theoretically established. Various elegant mathematical models areavailable for establishing ideal preventive maintenance intervals [3,4]. However, data to establishthis is still not available for most mainstream industry. (The nuclear industry is a particularexcepti- i since they have to prove the reliability of plart; the National Centre . c SystemsReliability was established to collate this data).
As more industries collate real data relating to their plant and their running conditions, databecomes available which can allow mathematical models to be constructed for general plant. Themain problem with this approach is deciding the confidence limit at which normal industry cansustain preventive maintenance costs. Further, when one deals with very general largepopulations of machines, the levels of maintenance to guarantee machine availability to a highconfidence limit becomes very expensive. It is also recognised that if thereare components whichfail in a truly random manner (e.g. rolling element bearings) the system has only limitedusefulness. Nevertheless, Reliability Centred Maintenance (RCM) is now an accepted strategyand there are a number of plants actively employing this approach [5].
From the early 70's, instruments have been used for field testing and measurement of variousparameters which give an ins~ght into machinery cond-tion. The first (and still the most widelyused) parameter is vibration. This has been used for many years in machinery diagnostics as atrouble shooting method. The technical expertise needed to carry out this function was initiallyvery high and so it was the preserve of a few specialists. However, it was son,. -ealisc, thatoverall vibration levels could be easily measured and used as a trending tool to make judgementson machine condition. On a wider front, Michael Neale and Associates were commissioned bythe Department of Industry in 1970 to produce a Guide to Condition Monitoring which for thefirst time also considered the economics of condition monitoring and its place in the maintenanceregime [2].
It is quite evident that cost benefits are very high in the case of high capital value plant (seeAppendix 1 - A case study). It is not so evident in the case of lower value plant at what levelcondition monitoring regimes should be pitched. The present study is an attempt to investigatethis situation and establish a cost benefit analysis method which could be used in such cases.
4--

It is now accepted that vibration analysis is not the only technique available. For particularclasses of machinery (e.g. rail locomotives, earth moving equipment etc,) a more suitable methodwould be to monitor the oil condition. Oil condition monitoring, and maintenance systems basedon it are now common in many industries. Other methods include acoustic emission, stress wavelevel, temperature measurement; all of which give insight into machinery condition. Thus, thepresent generation of strategies includes Condition Based Maintenance (CBM). A subset of thisphilosophy is where CBM is supplemented by low level intrusive inspection (using modemoptical equipment or other devices) so that reliability can be guaranteed for a particular length oftime. This is specially useful in applications such as Aircraft or Nuclear Plant where theconsequences of failure are particularly high.
In summary the main approaches to maintenance now available are:
1. Breakdown Maintenance2. Time-based, planned preventive maintenance3. Reliability-centred maintenance4. Condition-based maintenance
Cost Effectiveness of Maintenance Regimes: The comparative life cycle costs of the fourmaintenance philosophies has not been fully investigated. A start was made by Jardine [3] wholooked at different types of machine characteristics in order to arrive at replacement, inspectionand overhaul decisions. Implicit in his methodology was an assumption that maintenance was tobe part of operating costs but these would vary in a simple manner with time. Hence, asoperating costs varied, a replacement decision would become the correct option and this could bemathematically calculated. A number of different possibilities were considered where operatingcosts decreased with age, increased with age, had to function within a finite (bounded) timehorizon, and where the unit was a stand-by machine with all the above possibilities. Using thesetypes of model, he also attempted to develop equations for inspection decisions (intrusive andhence, essentially a "planned maintenance" approach). These models are theoretically defensiblebut the type of data required to support the equations is generally unavailable. Further, theproblem of components with random failure modes is not addressed.
Moubray [5j A•isputes what a failure is and concludes that this could be perceived very diferentlyby people with differing viewpoints. An example quoted is that of a:ýaydrauli, system where asmall leak is seen as failure by the Safety Officer, a mucl, I• ger leak as failure by the engineer andonly the complete stoppage of the system as failure by the production staff. Therefore, costsbecome dependent on the "failure" being investigated.
The authors consider that failure should be judged against performance standards and costssimilarly calculated against these standards. However, it is important to take into accountconsequential costs, which are usually the largest item in a breakdown maintenance regime.
Carter [4] employed a similar approach to calculate whole life cycle costs using a statisticalapproach in which he defines a failure in terms of a machine failing to perform (the "production"definition).
3
The current investigation is aimed at establishing a cost benefit analysis method based onevidence obtained from actual maintenance data.
Background to Data Collection: The data used to evaluate the system is acquired from thepharmaceutical industry and is characterised by some unique features:
1. The product is small in volume terms but is of very high value
2. A large number of the production stages are batch process and hence there is machinery whichis idle time between batches.
S3_,,,*the :-1ality requirements of I1e product are extremely tight, all r achinery used has to workw:,hin very stringent operational parameters as this is one way of ensuring consistent quality ofthe product.
Methodology: The system proposed for the cost benefit analysis is based on a standardspreadsheet package so that it can be easily transferable. It is also based on actual cost data forboth direct and consequential costs.
It was recognised at the outset that there would be differences between various classes ofmachines and hence all machines on-site were divided into groups by machine class. The singlegroup with the largest number of machine trains was "pumps".
Other classifications include fans, compressors, gearboxes, generators and dryers.
Classification: The pump population was divided up according to type and power rating asshown in Table I.
Of the c.6500 machine trairt, on-site c.3000 are "pumps". Approximately 400 machine trains ofall types are subjected to high level vibration monitoring (once a month veillance with fullFourier analysis of the results and complete diagnostics being generated by an artificialintelligence system) using portable data collection systems. Four hundred pumps are subject tolow level vibration monitoring (using only overall vibration levels to establish trends). Inaddition, forty machines are subjected to monthly oil condition monitoring and analysis, and 40machines to checks using ultrasonic stethoscope and semi-intrusive examinations (using opticalequipment such as introscopes and endoscopes) conducted, as requested, by maintenanceengineers.
1. Costs for these services were assessed using three main criteria to ascertain the total costs
2. Capital cost of equipment used using discounted cash flow with a 10 year amortisation period
3. Labour costs. These were assessed at two separate rates. The low level vibration monitoringprogramme was undertaken by craftsmen who had served a recognised apprenticeship, whilst
I_/

all other services were provided by technicians who, additionally, had a three year, in-house,training programme in inspection.
4. Software and equipment maintenance costs. For the low level vibration monitoring carried outthere were no maintenance costs since the purchase of the equipment. However, a nominalsum has been taken (equivalent to 5% of purchase price per annum) to allow for any futurecosts.
Solartron [6], in their model, also consider some cost benefits associated with:1. Operational safety effects on plant and environment2. Personnel safety risk3. Operational issues excluding safety, e.g. severity of machine duty4. Technical uses
The pharmaceutical industry is highly regulated as there are many fire and bio-`- zards associatedwith it. Ience, on analysis, condition monitoring does not change their safety effect on either theplant or the environment. Therefore, this factor was not considered in the current r, odel. Thesame situation applies in the case of personnel safety risks.
Operational issues, including severity of duty were found to reveal its effects on the consequentialcosts of failure and this is included in the analysis of consequential costs. Other technical issuesthat were considered by Solartron related to selection of in-line monitoring vs. hard wiredsurveillance methods vs. hand held data collection methods. Since the plant being consideredhere is primarily a batch production plant with very few machines on continuous duty, only hand-held data collection equipment was considered for this case study.
The need for a mathematical model to assess the cost benefits becomes apparent when the factthat the savings could be small when low capital value equipment is considered. But ifsufficiently large numbers of such machines are taken into account, then the situation could alter.To determine the point at -ihich each regime of condition monitoring becomes cost-effectiverequires a mathematical model so that the situation can be analysed.
Mathematical Model: To be able to predict costs, the rn )del proposed is in two Parts:
1. Costs of damage to the machine itself2. Consequent costs to the process (or product)
All costs have been converted into current costs by compounding their book costs on the date ofacquisition, or of repair, by using the published RPI figures within the spreadsheet.
Costs of damage to the machine: A number of models have been proposed [4] but in every casethe cost of repair has been treated as one of the "knowns". To be able to take the conditionmonitoring "decision" it was felt that an ability to predic this cost was essential and hence theproposed model uses the capital cost (which is known in every case) and a factor Kd which is
.- 5
derived from analysis of the model. A similar index Kq will be used to predict consequential costs
where appropriate.
A simple model is proposed:
Cd = Ci*Ip*lc*lpr*Kdwhere, Cd = Direct costs of machine breakdown
Ci = Initial cost of machine corrected to present day valuelp = Power IndexIc = Criticality Indexlpr = Process Index
and Kd = Direct costs factor
The Power Index is a method by which the relationship of power to costs was brought into theanalysis in a non-dimensional form. A number of alternatives were tried but offered no significantadvantages over a simple relationship on a scale of I to 10. As the powers of the pumps in thestudy varied from fractional kilowattage to c.250 kW the relationship shown below was used.
Power (kW) 3 8 15 30 50 80 110 150 200Ip 2 3 4 5 6 7 8 9 10
The Criticality Index is a measure of how critical the machine is to the process of which it is apart. This index is again a number on a scale of 1 to 10 which was determined by studying theprocess and evaluating the criticality of the machine. If, for instance, a machine was one of aseries in which a stand-by machine could be put directly into service without interrupting theprocess, the criticality index was automatically set at 1. On the other hand, if machine failure hadthe result of immediately stopping the entire process, then it had a criticality rating of 10 (e.g., thefailure of a motor or gearbox on the stirrer drive of a reactor vessel would immediately halt thereaction and w3uld hve a criticality index of 10). If the machine failure w~s such that theprocess could be maintained but only at reduced throughput then I = (Through putavailable/thiroughput possible) x 10.
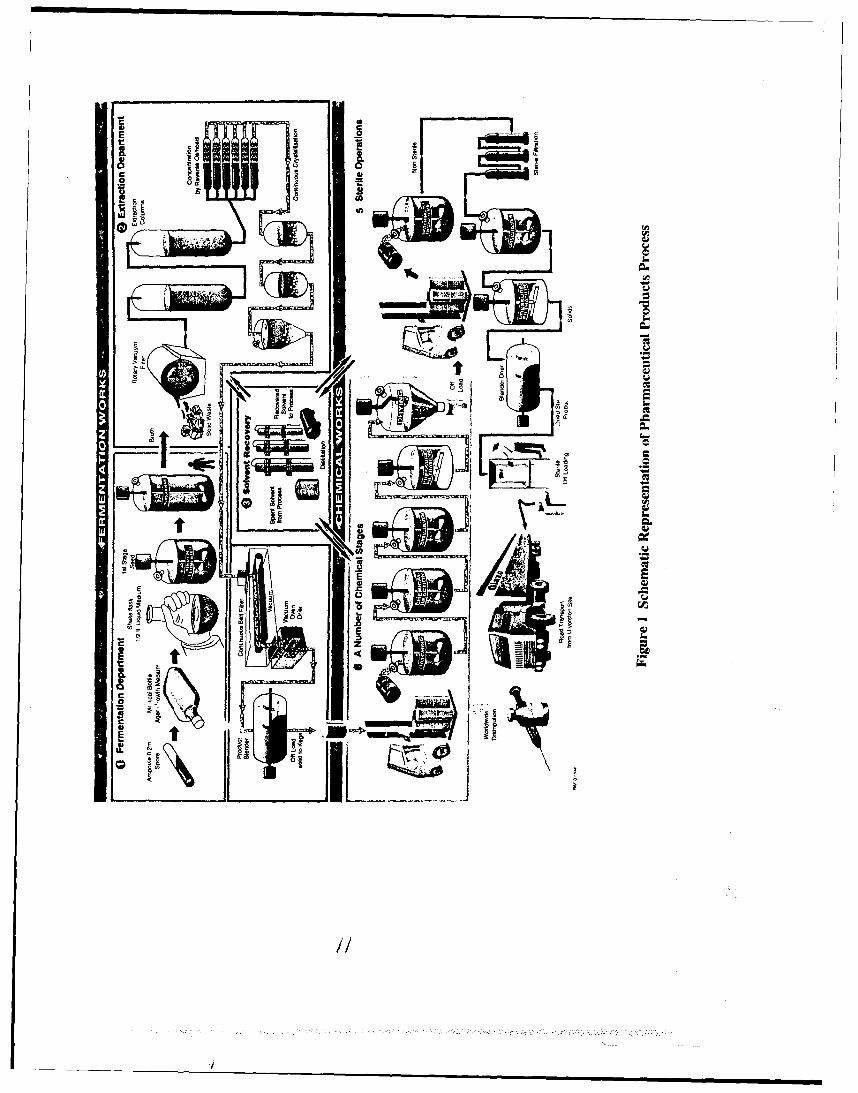
The Process Index was evaluated on the basis of how much of value had been added to theproduct at that point in the overall process. This index is again a number on a scale of 1 to 10.Hence, all machines at the stage where the raw material is fermented would have a process indexof 1, while all machines in the finishing suites would have a process index of 10. Figure 1 showsthe general process flow through the plant.
Using these factors and costs, the direct costs factor was evaluated and plotted against power.This could then be used to predic direct costs of breakdown of any machine in that particularclass.
The frequency of breakdown was evaluated from pump field data collected since September1989. A total of 329 pumps in the solvent recovery area (see Appendix 3) were studied and 711
40
failures took place over a 5 year period giving a machine reliability of 0.57 per machine per year
(using the definition as proposed by Carter (6) after Carhart:
R(t) = Cumulative probability function of occurrence of survival
Planned maintenance costs and inspection costs were calculated using the company standardhourly rates and published prices for spares. Capital costs were taken from the company recordsand adjusted for inflation using the published RPI figures. These figures were then comparedwith new quotations for the same machines from the manufacturers so that confidence could begained in this method. The comparison showed that if prices were extrapolated from pre. 1990data the deviations became very large for smaller pumps, though (taking a 10% deviation as themaximum acceptable) larger pumps could be regressed over a longer period.
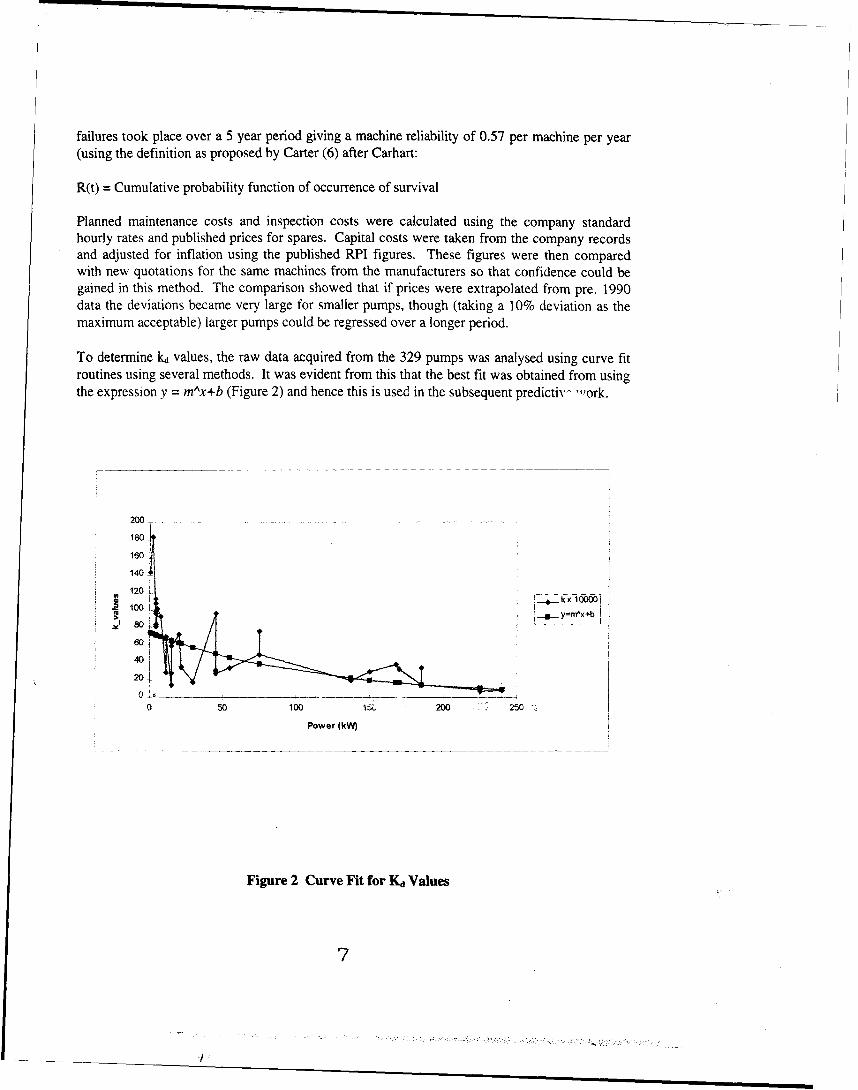
To determine kd values, the raw data acquired from the 329 pumps was analysed using curve fitroutines using several methods. It was evident from this that the best fit was obtained from usingthe expression y = mAx+b (Figure 2) and hence this is used in the subsequent predictiv- .. ork.
200
180
160
140
120
~100 .-.. kx 100001
8060
,, ~20_
0 50 100 156 200 250
Power (kW)
Figure 2 Curve Fit for Kd Values
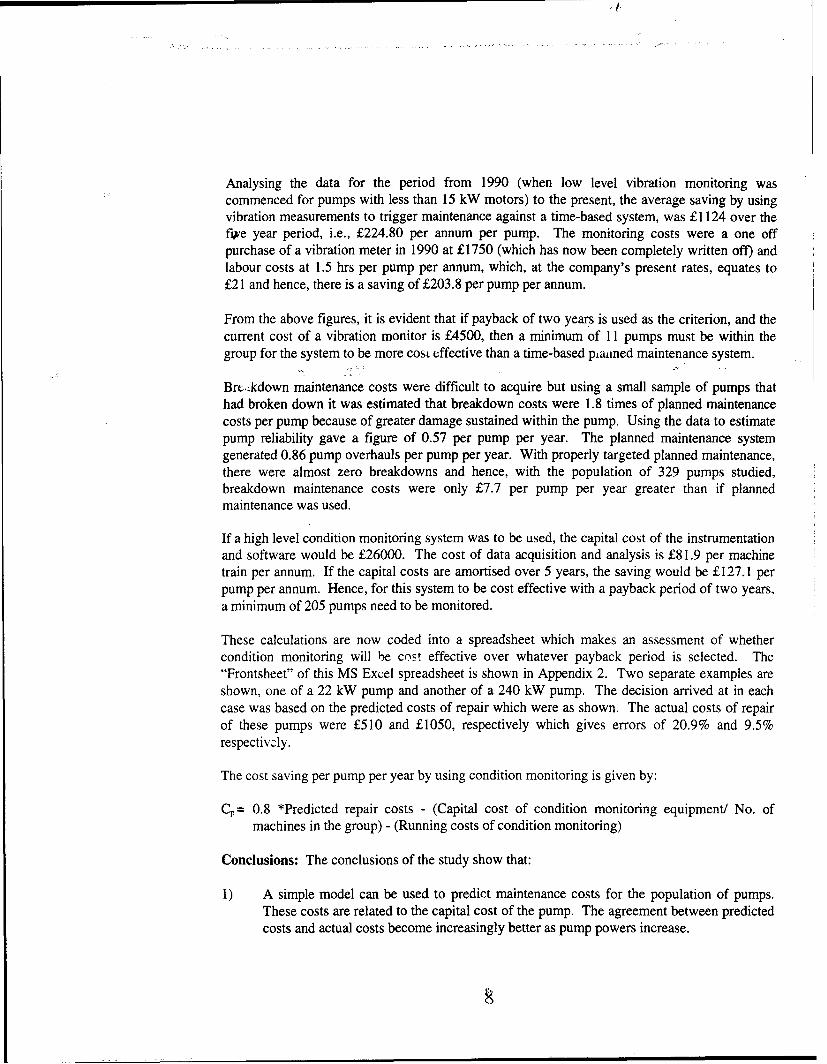
Analysing the data for the period from 1990 (when low level vibration monitoring wascommenced for pumps with less than 15 kW motors) to the present, the average saving by usingvibration measurements to trigger maintenance against a time-based system, was £1124 over thef4we year period, i.e., £224.80 per annum per pump. The monitoring costs were a one offpurchase of a vibration meter in 1990 at £1750 (which has now been completely written off) andlabour costs at 1.5 hrs per pump per annum, which, at the company's present rates, equates to£21 and hence, there is a saving of £203.8 per pump per annum.
From the above figures, it is evident that if payback of two years is used as the criterion, and thecurrent cost of a vibration monitor is £4500, then a minimum of 11 pumps must be within thegroup for the system to be more cost effective than a time-based piatined maintenance system.
Bretkdown maintenance costs were difficult to acquire but using a small sample of pumps thathad broken down it was estimated that breakdown costs were 1.8 times of planned maintenancecosts per pump because of greater damage sustained within the pump. Using the data to estimatepump reliability gave a figure of 0.57 per pump per year. The planned maintenance systemgenerated 0.86 pump overhauls per pump per year. With properly targeted planned maintenance,there were almost zero breakdowns and hence, with the population of 329 pumps studied,breakdown maintenance costs were only £7.7 per pump per year greater than if plannedmaintenance was used.
If a high level condition monitoring system was to be used, the capital cost of the instrumentationand software would be £26000. The cost of data acquisition and analysis is £81.9 per machinetrain per annum. If the capital costs are amortised over 5 years, the saving would be £127.1 perpump per annum. Hence, for this system to be cost effective with a payback period of two years,a minimum of 205 pumps need to be monitored.
These calculations are now coded into a spreadsheet which makes an assessment of whethercondition monitoring will be cost effective over whatever payback period is selected. The"Frontsheet" of this MS Excel spreadsheet is shown in Appendix 2. Two separate examples areshown, one of a 22 kW pump and another of a 240 kW pump. The decision arrived at in eachcase was based on the predicted costs of repair which were as shown. The actual costs of repairof these pumps were £510 and £1050, respectively which gives errors of 20.9% and 9.5%respectivzly.
The cost saving per pump per year by using condition monitoring is given by:
Cp= 0.8 *Predicted repair costs - (Capital cost of condition monitoring equipment/ No. ofmachines in the group) - (Running costs of condition monitoring)
Conclusions: The conclusions of the study show that:
1) A simple model can be used to predict maintenance costs for the population of pumps.These costs are related to the capital cost of the pump. The agreement between predictedcosts and actual costs become increasingly better as pump powers increase.

2) Capital costs of purchase can only be meaningfully extrapolated using the original costsand the RPI figures for a comparatively short time span (< five years).
3) The costs of maintenance using the different regimes in decreasing order of costs are:
a) Breakdown maintenanceb) Planned (time based) maintenancec) High level vibration monitoring based maintenanced) Low level vibration monitoring based maintenance
4) The above conclusions should be read with the following caveats:
a) Breakdown mainte, ance is only marginally more expensive than plannedmaintenance. A slight increase in pump reliability will bring down breakdownmaintenance costs below that of planned maintenance.
b) The extra information acquired as part of a high level vibration monitoring basedmaintenance system does not lead to any greater reliability of the pumps than if alow level vibration monitoring based system were used.
c) The break even point rises dramatically between using the low level system and thehigh level system and hence, in the introductory stages, a low level system willdeliver benefits much more positively than a high level system.
d) The above study was composed of pumps, all of which are fitted with stand-bymachines and hence failure has no consequential costs. When the study isextended into Fans, Compressors, Generators, Dryers, etc. many of which have nostand-by machines, the consequential costs will play a dominant role.
Referen. s
1. The Institute of Marine Engineers, The Running and Maintenance of Marine Machinery, 5thEdition, 1965.
2. Michael Neale and Associates (for the Department of Industry), A guide to the ConditionMonitoring of Machinery - HMSO 1970.
3. A.K.S. Jardine and S. Kennedy; Maintenance Replacement and Reliability, Pitman Pub. Ltd,1973.
4. A.D.S.Carter, Mechanical Reliability, 2nd Edition, Macmillan 1986.
5. Solartron Instruments, Cost benefit analysis methods for Condition Monitoring - Technicalnote, No. 27, 1994.
C/

Acknowledgements
The authors wish to acknowledge with grateful thanks the kind permission of GlaxoWelicomOperations UK Ltd to present and publish this paper.
Pump Type Power Rating. kW0-3 3-8 8-15 15-30 30-50
Centrifugal 4 4 4 4 4Positive Pressure 4 4 4 4 4Single Stage 4 4 4 4 4Centrigugal 4 4 4 4 4Positive Pressure 4 4 4 4 4Multi-Stage 4 4 4 4 4Centrifugal 4 4 4 4 4Vacuum 4 4 4 4 4Single Stage 4 4 4 4 4Centrifuga "4 4 4 4 4Vacuum 4 4 4 4Multi-Stage 4 4 4 4 4Positive Displacement 4 4 4 4 4Positive Pressure 4 4 4 4 4Single Stage 4 4 4 4 4
50-80 80-110 110-150 150-200 >200Centrifugal 4 4 4 4 4Positive Pressure 4 4 4 4 4Single Stage 4 4 4 4 4Centrigugal 4 4 4 4 4Positive Pressure 4 4 4 4 4Multi-Stage 4 4 4 4 4
Table 1 - Classification of Pump Type and Power Rating
'0
09
ro9
EC
Ez M - -
a v,
9cc
I1
log
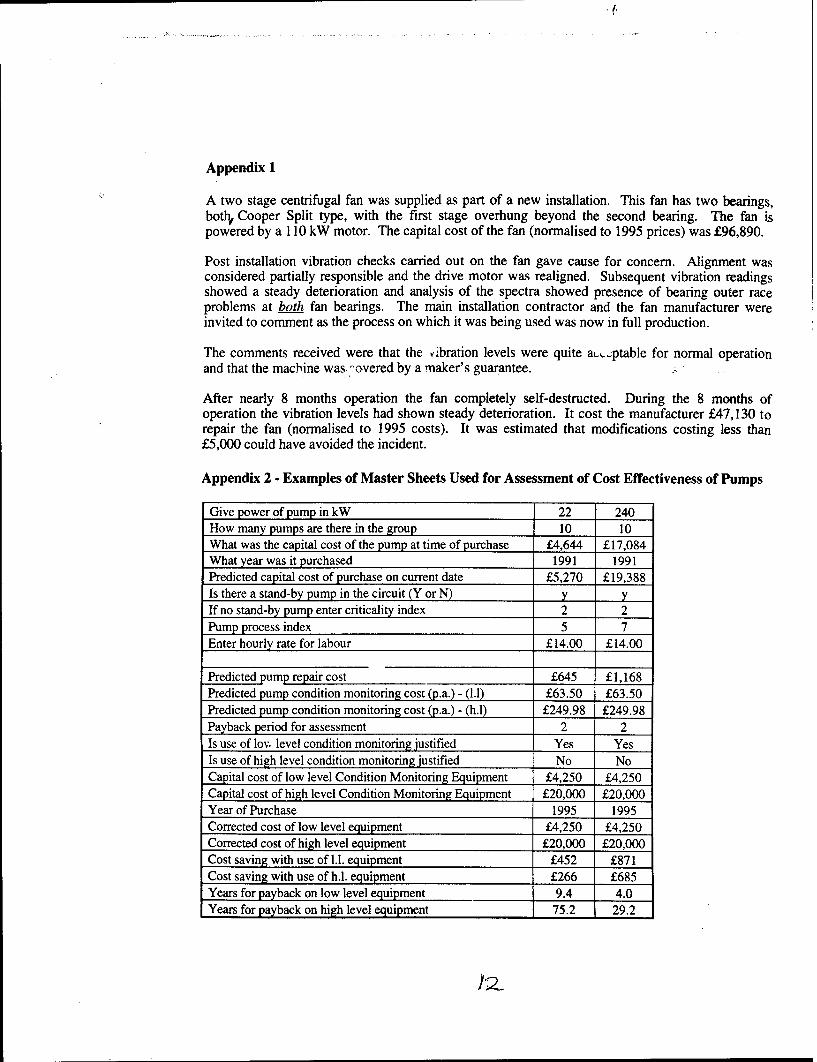
Appendix 1
A two stage centrifugal fan was supplied as part of a new installation. This fan has two bearings,both9 Cooper Split type, with the first stage overhung beyond the second bearing. The fan ispowered by a 110 kW motor. The capital cost of the fan (normalised to 1995 prices) was £96,890.
Post installation vibration checks carried out on the fan gave cause for concern. Alignment wasconsidered partially responsible and the drive motor was realigned. Subsequent vibration readingsshowed a steady deterioration and analysis of the spectra showed presence of bearing outer raceproblems at both fan bearings. The main installation contractor and the fan manufacturer wereinvited to comment as the process on which it was being used was now in full production.
The comments received were that the vibration levels were quite aLt,.ptable for normal operationand that the machine was -'vered by a maker's guarantee.
After nearly 8 months operation the fan completely self-destructed. During the 8 months ofoperation the vibration levels had shown steady deterioration. It cost the manufacturer £47,130 torepair the fan (normalised to 1995 costs). It was estimated that modifications costing less than£5,000 could have avoided the incident.
Appendix 2 - Examples of Master Sheets Used for Assessment of Cost Effectiveness of Pumps
Give power of pump in kW 22 240How many pumps are there in the group 10 10What was the capital cost of the pump at time of purchase £4,644 £17,084What year was it purchased 1991 1991Predicted capital cost of purchase on current date £5,270 £19,388Is there a stand-by pump in the circuit (Y or N) y yIf no stand-by pump enter criticality index 2 2Pump process index 5 7Enter hourly rate for labour £14.00 £14.00
Predicted pump repair cost £645 £1,168Predicted pump condition monitoring cost (p.a.) - (H.1) £63.50 £63.50Predicted pump condition monitoring cost (p.a.) - (h.M) £249.98 £249.98Payback period for assessment 2 2Is use of low level condition monitoring justified Yes YesIs use of high level condition monitoring justified No NoCapital cost of low level Condition Monitoring Equipment £4,250 £4,250Capital cost of high level Condition Monitoring Equipment £20,000 £20,000Year of Purchase 1995 1995Corrected cost of low level equipment £4,250 £4,250Corrected cost of high level equipment £20,000 £20,000Cost saving with use of 1.I. equipment £452 £871Cost saving with use of h.l. equipment £266 £685Years for payback on low level equipment 9.4 4.0Years for payback on high level equipment 75.2 29.2