competitiveness of the eu food industry - wur
TRANSCRIPT

LEI Wageningen UR is one of the world’s leading independent socio-economic research institutes. LEI’s unique data, models and knowledge offer clients insight and integrated advice on policy and decision-making in an innovative manner, and ultimately contribute to a more sustainable world. LEI is part of Wageningen UR (University and Research centre), forming the Social Sciences Group together with the Department of Social Sciences and Wageningen UR Centre for Development Innovation.
The mission of Wageningen UR (University & Research centre) is ‘To explore the potential of nature to improve the quality of life’. Within Wageningen UR, nine specialised research institutes of the DLO Foundation have joined forces with Wageningen University to help answer the most important questions in the domain of healthy food and living environment. With approximately 30 locations, 6,000 members of staff and 9,000 students, Wageningen UR is one of the leading organisations in its domain worldwide. The integral approach to problems and the cooperation between the various disciplines are at the heart of the unique Wageningen Approach.
LEI Wageningen URP.O. Box 297032502 LS Den HaagThe NetherlandsE [email protected]/lei
REPORT LEI 2016-018ISBN 978-90-8615-735-8
Jo H.M. Wijnands and David Verhoog
Ex-post assessment of trade performance embedded in international economic theory
Competitiveness of the EU food industry


Competitiveness of the EU food industry
Ex-post assessment of trade performance embedded in international economic theory
Jo H.M. Wijnands and David Verhoog
This study was carried out by LEI Wageningen UR and was commissioned by The European Competitiveness and Sustainable Industrial Policy Consortium, (ECSIP) led by Ecorys Netherlands. ECSIP assessed the competitive position of the Europe food and drink industry on behalf of the Executive Agency for Small and Medium-sized Enterprises (EASME) of the European Commission
LEI Wageningen UR Wageningen, February 2016
REPORT
LEI 2016-018
ISBN 978-90-8615-735-8

Wijnands, J.H.M. and D. Verhoog, 2016. Competitiveness of the EU food industry; Ex-post assessment of trade performance embedded in international economic theory. Wageningen, LEI Wageningen UR (University & Research centre), LEI Report 2016-018. 80 pp.; 48 fig.; 31 tab.; 37 ref. Deze studie beoordeelt de concurrentiepositie van de EU-levensmiddelenindustrie in vergelijking met die van de Verenigde Staten, Canada, Australië en Brazilië. Deze beoordeling is gebaseerd op handelsindicatoren (relatieve netto handelsvoordeel en exportaandelen op de wereldmarkt) en op economische indicatoren (toegevoegde waarde, arbeidsproductiviteit en aandeel toegevoegde waarde in de totale industriële productie). Deze studie is een actualisering van een eerdere studie uitgevoerd in 2007. De concurrentiepositie van de EU28 (exclusief de handel tussen lidstaten) bleef zwak: de drie economische indicatoren verzwakten en de handelsindicatoren verbeterden in periode 2 (2008-2012) in vergelijking met periode 1 (2003-2007). De relatieve positie in periode 2 was zelfs zwakker dan de relatief zwakke positie in periode 1. Brazilië bleef de sterkste en de Verenigde Staten werd sterker. This study assessed the competitiveness of the EU food industry benchmarked against USA, Australia, Brazil and Canada. This assessment is based on trade indicators (Relative Net trade advantage and export share on the world market) and on economic indicators (value added, labour productivity and share value added in total manufacturing). This study is an update of an earlier study executed in 2007. The overall competitiveness performance of the EU28 (intra-EU trade excluded) remained weak: the three economic indicators weakened and the trade indicators improved in period (2) 2008-2012 compared to period (1) 2003-2007. The position in period 2 was even weaker than the relative weak position in period 1. Brazil remained the strongest and the USA became strong. Key words: Competitiveness, EU, food industry, USA, trade, added value. This report can be downloaded for free at http://dx.doi.org/10.18174/369980 or at www.wageningenUR.nl/en/lei (under LEI publications). © 2016 LEI Wageningen UR P.O. Box 29703, 2502 LS The Hague, The Netherlands, T +31 (0)70 335 83 30, E [email protected], www.wageningenUR.nl/en/lei. LEI is part of Wageningen UR (University & Research centre).
For its reports, LEI utilises a Creative Commons Attributions 3.0 Netherlands license. © LEI, part of DLO Foundation, 2016 The user may reproduce, distribute and share this work and make derivative works from it. Material by third parties which is used in the work and which are subject to intellectual property rights may not be used without prior permission from the relevant third party. The user must attribute the work by stating the name indicated by the author or licensor but may not do this in such a way as to create the impression that the author/licensor endorses the use of the work or the work of the user. The user may not use the work for commercial purposes. LEI accepts no liability for any damage resulting from the use of the results of this study or the application of the advice contained in it. LEI is ISO 9001:2008 certified. LEI 2016-018 | Project code 2282500080 Cover photo: R. Babakin/Shutterstock

Contents
Preface 5
Abbreviations and industry codes 7
Executive summary 9
1 Introduction 11
2 Methodology and data 13
2.1 Competitiveness: relative multidimensional concept 13 2.2 Methodology embedded in international economics 15
2.2.1 Trade indicators 15 2.2.2 Economic indicators 17
2.3 Data: linking industry and product databases 19 2.4 Selection of countries: export orientation 20 2.5 Presentation of competitiveness: relative positions 21
3 The food and beverages Industry 23
3.1 Overview: EU competitiveness weakened 23 3.2 Structure: EU largest turnover but smallest growth 24 3.3 Trade: EU28 has stable world market shares 25 3.4 EU member states: 5 countries have two-thirds of turnover 27
4 Food and beverages subindustries 29
4.1 Largest turnover for meat, ‘other food’ and beverages 29 4.2 Meat 29
4.2.1 Overview: EU competitiveness remained weak 29 4.2.2 Structure of the industry: EU is small-scaled and has low growth 30 4.2.3 Trade: EU28 has higher export than import growth 31 4.2.4 EU member states: Italy and UK improved scores and Poland strongest 32
4.3 Fish 33 4.3.1 Overview: EU competitiveness weakened 33 4.3.2 Structure of the industry: EU relatively large but low growth 34 4.3.3 Trade: Only Canada has a positive trade balance 34 4.3.4 EU member states: Ireland strongest and Denmark weakest 35
4.4 Fruit and vegetables 36 4.4.1 Overview: EU Competitiveness weakened on economic indicators 36 4.4.2 Structure of the industry: EU small scaled and low growth 37 4.4.3 Trade: EU28’s negative trade balance becomes smaller 38 4.4.4 The EU member states: UK and Belgium strong 39
4.5 Vegetable and animal oils and fats 40 4.5.1 Overview: EU Competitiveness below average 40 4.5.2 Structure of the industry: EU has largest turnover and is small scaled 41 4.5.3 Trade: EU28 is net importer and has largest world market shares 41 4.5.4 The EU member states: UK weakest and France strong 42
4.6 Dairy 43 4.6.1 Overview: EU Competitiveness above average 43 4.6.2 Structure of the industry: EU has largest turnover but insignificant growth 44 4.6.3 Trade: EU28 net exporter and largest world market share 44 4.6.4 The EU member states: large producers strong except Germany 45

4.7 ‘Cereals’ products 46
4.7.1 Overview: EU Competitiveness remained weak 46 4.7.2 Structure of the industry: EU small turnover 47 4.7.3 Trade: EU28 largest exporter and strong trade balance 47 4.7.4 EU member states: diverse developments in competitiveness 48
4.8 ‘Bakery’ products 49 4.8.1 Overview: EU Competitiveness weak but fair trade performance 49 4.8.2 Structure of the industry: EU many small scaled enterprises 49 4.8.3 Trade: EU28 largest exporter and strong trade balance 50 4.8.4 EU: France, Belgium and Netherlands strong, UK and Ireland weak 51
4.9 ‘Other food’ products 52 4.9.1 Overview: Brazil strongest and all others weak 52 4.9.2 Structure of the industry: Brazil very strong grower 53 4.9.3 Trade: EU28 slightly above the trade levels of USA and Brazil 54 4.9.4 EU member states: largest countries in turnover also strongest 55 4.9.5 Large-scale sugar manufacturing: Brazil largest and most competitive 55 4.9.6 Confectionery: EU just above average and large EU countries strongest 56
4.10 Animal feed 58 4.10.1 Overview: EU Competitiveness remained strong intermediary sector 58 4.10.2 Structure of the industry: turnover per enterprise high 59 4.10.3 Trade: EU28 largest importer and negative trade balance 59 4.10.4 EU member states: largest countries in turnover weakest 60
4.11 Beverages 61 4.11.1 Overview: EU improved, USA strongest 61 4.11.2 Structure of the industry: Brazil strong grower and large scaled 62 4.11.3 Trade: EU28 largest exporter, USA largest importer 63 4.11.4 EU member states: largest countries show mixed position 64 4.11.5 Spirits: EU largest producer, USA most competitive 65
4.12 Overview all subsectors: only feed and dairy strong 66
5 Discussion and conclusions 68
5.1 Discussion 68 5.1.1 Domestic demand focus EU 68 5.1.2 Strong EU member states all internationally weak 69 5.1.3 Sensitivity: value added per capita and EU25 70 5.1.4 Comparison with Porter and World Economic Forum 71 5.1.5 Selected countries covers worlds food industry 73
5.2 Conclusions: EU food industry became weaker 74 5.2.1 Answers to the research questions 74 5.2.2 Robustness of approach and recommendations 75
References 77

LEI Report 2016-018 | 5
Preface
In 2005 the European Commission commissioned to LEI Wageningen UR a study on the competitiveness of the food industry, which led to the publication of the report Competitiveness of the European Food Industry. An economic and legal assessment (Wijnands et al., 2007). The Executive Agency for Small and Medium-sized Enterprises (EASME) has requested the European Competitiveness and Sustainable Industrial Policy Consortium (ECSIP) to conduct a follow-up study to the 2007 report. The objective of that study assignment is to update the 2007 findings, taking into account recent developments, and to put forward scenarios on potential future changes (Ecorys, 2016 (forthcoming)). The present study on the competitive position of the European food and drink industry was granted to the ECSIP consortium with Ecorys Netherlands as lead partner. LEI Wageningen UR assessed the ex-post-performance of the competitiveness of the EU Food Industry. The Ecorys report presents only these results on EU level. This report provides also information at member state level, as well as the impact of trade between EU member states (intra-trade) and for all food industries. In this respect it adds additional information to the main report. In addition, the methodology section is more elaborated in this report as well as the discussion on the meaning of the competitiveness concepts. Competitiveness is a relative concept and has many definitions. In this study the ex post performance of the EU28 is benchmarked against other countries. The conclusion is that the overall competitiveness performance of the EU28 in the food and beverages industries remained weak. The economic performance weakened whereas the trade performance improved and was on the strong side. Brazil remained the strongest and the USA became strong. We would like to thank EASME, the European Commission and the Ecorys project team for their constructive comments and excellent guidance and advice throughout the entire period of this study. The opinions expressed in this study are those of the authors and do not necessarily reflect the views of the European Commission, EASME or Ecorys. Prof.dr.ir. Jack G.A.J. van der Vorst General Director Social Sciences Group - Wageningen UR

6 | LEI Report 2016-018

LEI Report 2016-018 | 7
Abbreviations and industry codes
Acronyms
€ Euro AT Austria AU/AUS Australia BE Belgium BG Bulgaria bn billion = 109 BR/BRA Brazil CA/CAN Canada CY Cyprus CZ Czech Republic DE Germany DK Denmark EC European Commission EE Estonia EL Greece ES Spain EU European Union EU25 EU of 25 member states EU28 EU of 28 member states. Data are based on aggregates of individual member states.
Export data include trade between member states: intra-EU trade. EU28-int Indicates that intra-trade between EU28 member states is included. Economic data
are based on aggregates of individual member states. Export data are based on aggregates of individual EU member states and hence including extra-EU trade with third countries and intra-EU trade between member states.
FI Finland FR France HR Croatia HU Hungary IE Ireland IT Italy L1/L2 Annual growth rate labour productivity for period 1 (2003-2007)/period 2
(2008-2012) LT Lithuania LU Luxembourg LV Latvia M1/M2 Difference world market share for period 1 (2003-2007)/period 2 (2008-2012) mn million = 106 MT Malta NL Netherlands NO Norway O1/O2 Overall competitiveness for period 1 (2003-2007)/period 2 (2008-2012) P1/P2 Annual growth rate real added value for period 1 (2003-2007)/period 2 (2008-2012) PL Poland PT Portugal RMA Relative Import Advantage RO Romania RTA Relative net Trade Advantage RXA Relative Export Advantage

8 | LEI Report 2016-018
S1/S2 Annual growth share added value in manufacture industry for period 1 (2003-2007)/ period 2 (2008-2012)
SE Sweden SI Slovenia SK Slovakia SMEs Small and Medium-sized Enterprises T1/T2 Difference RTA indicator for period 1 (2003-2007)/period 2 (2008-2012) UK United Kingdom US/USA United States of America USD United States Dollar WDI World Development Indicators WEF World Economic Forum Z-scores Standardised values with a mean of 0 and a standard deviation of 1, enabling
comparison of different measurement levels.
Manufacture and food and beverages industry classes
NACE rev 2 Short Description
C Manufacturing Manufacturing
C10&C11 Food & beverages Total food & beverages
C10 Food Manufacture of food products
C101 Meat Processing and preserving of meat and production of meat products
C102 Fish Processing and preserving of fish, crustaceans and molluscs
C103 Fruit-vegetable Processing and preserving of fruit and vegetables
C104 Oil Manufacture of vegetable and animal oils and fats
C105 Dairy Manufacture of dairy products
C106 Cereals Manufacture of grain mill products, starches and starch products
C107 Bakery Manufacture of bakery and farinaceous products
C108 Other food Manufacture of other food products
C1081 Sugar Manufacture of sugar (Subindustry of C108)
C1082 Confectionery Manufacture of cocoa, chocolate and sugar confectionery (Subindustry of C108)
C109 (Animal) Feed Manufacture of prepared animal feeds
C11 Beverages Manufacture of beverages
C1101 Spirits Distilling, rectifying and blending of spirits (Subindustry of C11)
Source: Based on EC (2008).

LEI Report 2016-018 | 9
Executive summary
Competitiveness of EU food and beverages industries weak The overall competitiveness performance of the EU28 in the food and beverages industries remained weak: performance on the three economic indicators weakened (value added, labour productivity, value added share), whereas the trade indicators improved in period 2 (2008-2012) compared to period 1 (2003-2007). The EU28 position in period 2 was even weaker than the already relatively weak position in period 1. Brazil remained the strongest and the USA became strong.
Indicator Period Period Overall competitiveness O2 2008-2012 O1 2003-2007
Figure S.1 Developments in EU28 competitiveness in the food and beverages sector (internationally benchmarked) 2003/07 - 2008/12
Indicator Period Period Overall competitiveness O2 2008-2012 O1 2003-2007
Figure S.2 Developments in EU28 competitiveness of the food and beverages sectors (internationally benchmarked) 2003/07 - 2008/12
O1
O1
O1
O1
O1
O2
O2
O2
O2
O2
EU28
US
Australia
Brazil
Canada
Weak average strongManufacture of food products and beverages (C10-C11)
O1
O1
O1
O1
O1
O1
O1
O1
O1
O1
O1
O2
O2
O2
O2
O2
O2
O2
O2
O2
O2
O2
Food & Beverages
Meat
Fish
Fruit/veg.
Oil
Dairy
Cereals
Bakery
Other food
Feed
Beverages
Weak average strongAll sectors EU28 (extra-EU trade)

10 | LEI Report 2016-018
O1
O1
O1
O1
O1
O1
O1
O1
O1
O2
O2
O2
O2
O2
O2
O2
O2
O2
USA
BRA
IT
UK
ES
CAN
AUS
NL
BE
Weak average strongManufacture of food products and beverages (C10-C11)
Dairy and animal feed strong, all other sectors weak Meat manufacturing reported the highest turnover (21%), followed by ‘other food’ (16%) and beverages (14%). The beverages industry has the highest share in exports (29%), ‘other food’ is second (17%). Edible oil industry is the largest importer (24%) followed by fish (22%). In terms of the numbers of enterprises, the ‘bakery’ manufacturing accounts for over 50% of all enterprises (see Figure 2.4). The animal feed industry remained the strongest sector: this sector uses several by-products from other industries like oil cakes from the oil industry and residues from the cereal industry. The dairy industry recovered from a weak to an above-average position. All other sectors are below average compared to the performance of benchmark countries. In addition, most sectors became weaker, with the exception of bakery and beverages that slightly improved to a less weaker position.
All strong EU member states are weak on world level If the 10 EU member states with the largest turnover (counting 85% of the turnover in export or import) are benchmarked against each other, 5 countries are above average. These 5 ‘strong’ EU countries turned out to be weak if benchmarked against the USA, Australia, Brazil and Canada. In conclusion, not only the EU28 shows weak competitiveness, but also all member states. Germany, France, Poland, Denmark and Ireland are already weak if benchmarked against the 10 EU countries with the largest turnover.
Indicator Period Period Overall competitiveness O2 2008-2012 O1 2003-2007
Figure S.3 Developments in competitiveness of 5 strong EU member states internationally benchmarked (presented in decreasing order of turnover)
Recommendations The approach applied in this study is measuring competitiveness based on the ex-post performance of the industry. The first recommendation is to extend the indicators with regard to policies, governance and potential measuring competitiveness. Second, the number of countries can be expanded with countries that have a large food manufacturing sectors or are closely linked to the EU economy (e.g. Norway, Switzerland and Middle Eastern countries). Third, studying the interdependency with other the actors in the value chain will add a new dimension, in line with Porter’s approaches.
Methodology and data: improved 2007 approach The methodology is an adapted approach of Wijnands et al. (2007, 2008) and based on international economics theory. It comprises a revision of the linkage of trade products with manufacturing sectors. Only processed products are linked to the manufacturing industries, raw (unprocessed) materials are excluded in analysing the competitiveness of the food industry.

LEI Report 2016-018 | 11
1 Introduction
The European Commission (EC) requested an update of the 2007 study on the ‘Competitiveness of the European Food Industry’ (Wijnands et al., 2007). The update is executed by and under the lead of Ecorys (2016). LEI Wageningen UR was responsible for the quantitative trade assessment. This study presents the results of the quantitative competitiveness ex-post performance assessment of the EU food and beverages industries. Due to some developments and need for additional information, the approach is updated. After the previous study the industry classification (NACE) has been revised and the EU was enlarged with new member states. In addition, the EC requested a comparison between the actual competitiveness assessment and the one as indicated in the previous study (Wijnands et al., 2007). Due to the aforementioned revision of the industry classification and the enlargement of the EU, a comparison between the results of the previous and present period was hampered. A direct comparison also would present an incomplete view on the present EU28, as the EU15 was mainly used in the previous assessment. This offered the opportunity on the one hand for revising the methodology and on the other hand of presenting the developments between two periods. In chapter 2 we present the methodology for the assessment. The EU’s interest in assessing the competitiveness is based in the ambition formulated in the Lisbon strategy:
‘The Union has today set itself a new strategic goal for the next decade: to become the most competitive and dynamic knowledge-based economy in the world, capable of sustainable economic growth with more and better jobs and greater social cohesion’ (European Council, 2000).
This ‘Lisbon agenda’ from 2000 included a plan for the economic development of the European Union between 2000 and 2010. In the 2020 strategy, the focus is ‘to turn the EU into a smart, sustainable and inclusive economy delivering high levels of employment, productivity and social cohesion’. Also the competitiveness of the industry is one the priorities:
‘An industrial policy for the globalisation era to improve the business environment, notably for SMEs, and to support the development of a strong and sustainable industrial base able to compete globally’ (Commission, 2010).
Mobilising the single market is mentioned as one of the instruments. The EU ambition to be competitive has some history. In 1993, Mr. Delors, at that moment president of the European Communities, explained in Copenhagen that the high unemployment in the EU was caused by lack of competitiveness with the USA and Japan (European Communities, 1993). The aim of this study is to provide an update of the quantitative assessment regarding ex-post performance of the competitiveness of the European food and beverages industry. More specifically, the aims are: 1. To assess the competitiveness of the EU food and beverage industries benchmarked against other
countries. This answers the question how competitive the EU is benchmarked against other countries.
2. To assess the development of the EU competitiveness between periods. The development indicates the impact of the Lisbon strategy on the competitiveness of the EU food industry.
3. To assess the developments of EU member states within the EU and against the benchmark countries.
4. To assess the development of different subsectors of the food industries for the afore-mentioned three specific issues.
5. To assess the impact of the single market on the EU competitiveness. Mobilising the single market is one of the instruments. The development of the domestic and foreign market will be analysed.
12 | LEI Report 2016-018
6. To evaluate the importance of SMEs in the food industry. According to the EC, SMEs are the backbone of Europe’s economy, they account for 90% of the enterprises, 58% of the turnover and two thirds of the jobs and a driver for competitiveness (EC, 2009).
LEI Report 2016-018 | 13
2 Methodology and data
This chapter discusses the concept of competitiveness, as this is a broad concept and often misinterpreted. According to Krugman, competitiveness is often used without a second thought whether it is competition between enterprises or nations (Krugman, 1994). Furthermore, competitiveness metrics are relative: it depends on the selection of benchmark enterprises or nations. The first section is dedicated to the concept of competitiveness. Next, methodology and metrics of competiveness are discussed and presented. The data sources are discussed the third section. As the objective is to compare industries in nations, we will present the selected countries in the fourth section. The fifth section is dedicated to the presentation of the competitiveness outcomes and how to read the graphs.
2.1 Competitiveness: relative multidimensional concept
Competitiveness is a relative concept; it has different aggregation levels, is often multi-dimensional, can be assessed from different theories, is defined in diverse ways for different time horizons, and its linkages with policies are unclear (Crouch and Ritchie, 1999; Krugman, 1994; Metcalfe et al., 1992; Gorton et al., 2013; Latruffe, 2010; Buckley et al., 1988). Below these key-words are discussed: • Descriptions of the concept
The Collins Cobuild English Dictionary provides the following descriptions related to ‘compete’ (Collins, 2006): Compete: When one firm or country competes with another, it tries to get people to buy its own
goods in preference to those of the other firm of country. Competition is a situation in which two or more people our groups are trying to get something,
which not everyone can have. Competitive is used to describe activities in which people or firms compete with each other. Competitiveness: Goods or services that are at competitive price or rate are likely to be bought.
• The relative concept is expressed by ‘one firm or country competes with another’. Latruffe (2010, p50) states that ‘competitiveness should be measured with respect to a benchmark..’ Competitiveness is a comparison between entities e.g. firms or industries in different countries (Siggel, 2006). The outcome depends on who is compared with whom and will accordingly differ with the selection of entities. Being successful in competition with one specific entity, does not mean that you are also successful in the competition with other entities. In this study, the selection of countries influences the competitive position of the EU28.
• The aggregation levels are expressed in the above descriptions by the wording ‘goods or services, people, firms or countries’ In the economic literature also industries are often mentioned as competing entities (Latruffe, 2010): e.g. the five competitive forces determine industry competition of (Porter, 1990, p35). This study analyses the competitiveness of the food & beverage manufacturing sector and its subsectors in selected countries. Furthermore, the definition of competitiveness (of an industry) at national level is more complex than at firm level. Success of one industry can reduce the competitiveness of other industries within a nation. The successful industry might be able to pay higher prices for the inputs which make the other industry less successful due to the relatively high input costs (Metcalfe et al., 1992).
• The multi-dimensional feature of competitiveness reflects the complexity of the concept. The World Economic Forum, for instance, distinguishes over 100 indicators divided in 12 pillars to access the global competitiveness of countries (Schwab, 2014). Several authors stress that competitiveness cannot be defined by a singly indicator (Sagheer et al., 2009, Metcalfe et al., 1992). Porter argues that in any industry five forces determine the long run competition, whether international or domestic, of an industry. Each force is built on several indicators (Porter, 1980). Porter’s diamond model for analysing competition between nation distinguishes four determinant each also with several sub determinants for determining the competitiveness between nations (Porter, 1990). Buckley et al. propose also several indicators, depending on the (aggregation) level of analysis and

14 | LEI Report 2016-018
time horizon (Buckley et al., 1988). Siggel as well as Latruffe underline the need to include not only economic (costs, productivity, value added) and trade indicators (unit values, export indicators) but also institutional factors e.g. infrastructure or government policies (Latruffe, 2010, Siggel, 2006). The dimensions depend on the aim of the study. Krugman e.g. argues in an example that is make little sense to measure the competitiveness on the export market if the industry is (almost) fully focused on the domestic market (Krugman, 1994). The dimensions or indicators depend also on the focus of the study. Argote and Ingram stress that competitive advantage in firms is based on the creation and transfer of knowledge (Argote and Ingram, 2000). The competitive potential depends hence on innovation and knowledge.
• Several theories or schools of thought aim at defining and analysing competitiveness (Latruffe, 2010, Siggel, 2006) resulting in even more definitions. From a strategic management perspective, competitiveness refers to the conduct of companies in shaping organisational advantages (Thompson and Strickland, 2003, Wright et al., 1998) and/or market advantages (Hamel and Prahalad, 1994). Using financial ratios (profit margin, current ratio, return on assets, debtor and collector period) are the metrics in accounting (Fleisher and Bensoussan, 2003). Measuring competitiveness with international economic indicators has its roots in Adam Smith’s trade theory. It explains differences in competitiveness by way of absolute cost differences between countries. However, the application of new trade theories entails incorporating a wider array of aspects in the analysis such as product differentiation, innovation, economies of scale and productivity (Van Berkum and Van Meijl, 2000). O’Mahoney and Van Ark focus on productivity. In their study, productivity differences explain largely differences in competitiveness (O’Mahoney and Van Ark, 2003). These are some example of the impact of different theories on the metrics of measuring competitiveness.
• For some definitions time horizons play a role (Siggel, 2006). Several authors use sustainable gain in e.g. market share: hence a comparison between two periods. According to Porter (1980, 1990), sustainable competitive advantage is the fundamental source for above-average performance in the long run. Buckley et al. (1992) introduces also the dynamic aspect in the measurement of competitiveness by three characteristics: competitive performance, potential and process each with different indicators.
• The linkages of competitiveness with policies are often ambiguous. First policies are mostly never included in measuring competitiveness. Latruffe (2010) points out that competitiveness research should focus on the effects of policies and the questions whether public resources increased or could increase nation’s welfare. The assumption that being competitiveness contribute to welfare, employment or market share might be conventional wisdom, however mainly not proven be research (Siggel, 2006) and even meaningless (Krugman, 1994). However, the description of Collins (2006) suggests that products with competitive prices will be bought and hence increasing production and markets shares. This will be the case for firms, however unclear for industries and nations.
Taking stock of the afore-presented considerations regarding the concept of competitiveness we use the following working definition:
‘Competitiveness of the EU food industry and subindustry is the ex-post performance of a sustained ability to achieve profitable gain and market share in domestic and export markets in which the industry is active’.
The approach is derived from the international economics school of thought (Section 2.2). Growth rates are used as indicators. Growth rates between two years measures the ex-post performance. Industries between countries will be benchmarked against other countries (Section 2.4). In the study, an analysis of the linkages between competitiveness and policies is not foreseen: the differences in measured competitiveness and its development will just be presented. The study is therefore a measurement of ex-post competitive performance.

LEI Report 2016-018 | 15
2.2 Methodology embedded in international economics
This section is largely a summary of the methodology for assessing the competitiveness of the food industry designed by Wijnands et al. and used in their studies on the competitiveness of the European food industry (Wijnands et al., 2007; Wijnands et al., 2008; Van Berkum et al., 2014; Wijnands et al., 2015). In this section, we discuss alternative indicators that are used in assessing the competitiveness. We did not perform an extensive literature review and the indicators are derived from some key papers that are mentioned below. Therefore, the overview below is not meant to be exhaustive. Furthermore, we make a distinction between trade and economic performance measures of competitiveness.
2.2.1 Trade indicators
2.2.1.1 Market shares on the world market The export share on the world market is a straightforward performance indicator and it measure the competitive performance (Buckley et al., 1988). We will take the difference between two periods of a country’s export share on the world market. The growth we measured is the change and not an annual growth rate between two periods, as we will propose for other indicators. Growth rates between two periods have a strong flaw. Very small exporters can have large growth rates, but remaining small exporters. Even with small growth rates, large exporters will have a larger impact on the market. The definition of this indicator reflects the strong interdependency between the exports of the different countries. By taking the absolute deviation, the real impact on the world market is taken into account. Furthermore, the total sum of all changes is by definition zero. Table 2.1 presents an example of the discussion above taken from (Wijnands et al., 2007).
Table 2.1 Example of impact of indicators and market shares development
Market share (%)
1996-1998 2002-2004 Deviation Growth
Country A 1 2 1 100%
Country B 50 51 1 2%
Country C 20 20 0 0%
Country D 29 27 -2 -7%
(1) ictictict MSMSGES −= GESict Growth export share on the world market for industry i for country c in period t MSict Export share on the world market for industry i for country c in period t C Selected country i Selected industry according to classification of NACE t Selected year
(2) iwt
ictict X
XMS =
ictX The export value of industry i, country c in period t.
iwtX The export value of industry i of the world (as a whole) in period t. 2.2.1.2 Revealed comparative advantage indices The relative importance of an industry in the total trade is usually measured by the Revealed Comparative Advantage (RCA) or Balassa index or specialisation index (Latruffe, 2010; Wijnands et al., 2008; Fertö and Hubbard, 2003). If it is related to the export, it measures the export share of a
16 | LEI Report 2016-018
product of one country in the total export of the world relative to the country’s export share in the world of all products. The relative export advantage index is as follows:
(3)
wt
ct
iwt
ict
ict
XTXT
XX
RXA = Export value of specific industry i from country c in period t.
ictRXA The relative export advantage index for industry i, country c in period t.
ictX The export value of industry i, country c in period t.
iwtX The export value of industry i of the world w in total in period t.
ctXT The total export value of all industries of country c in period t.
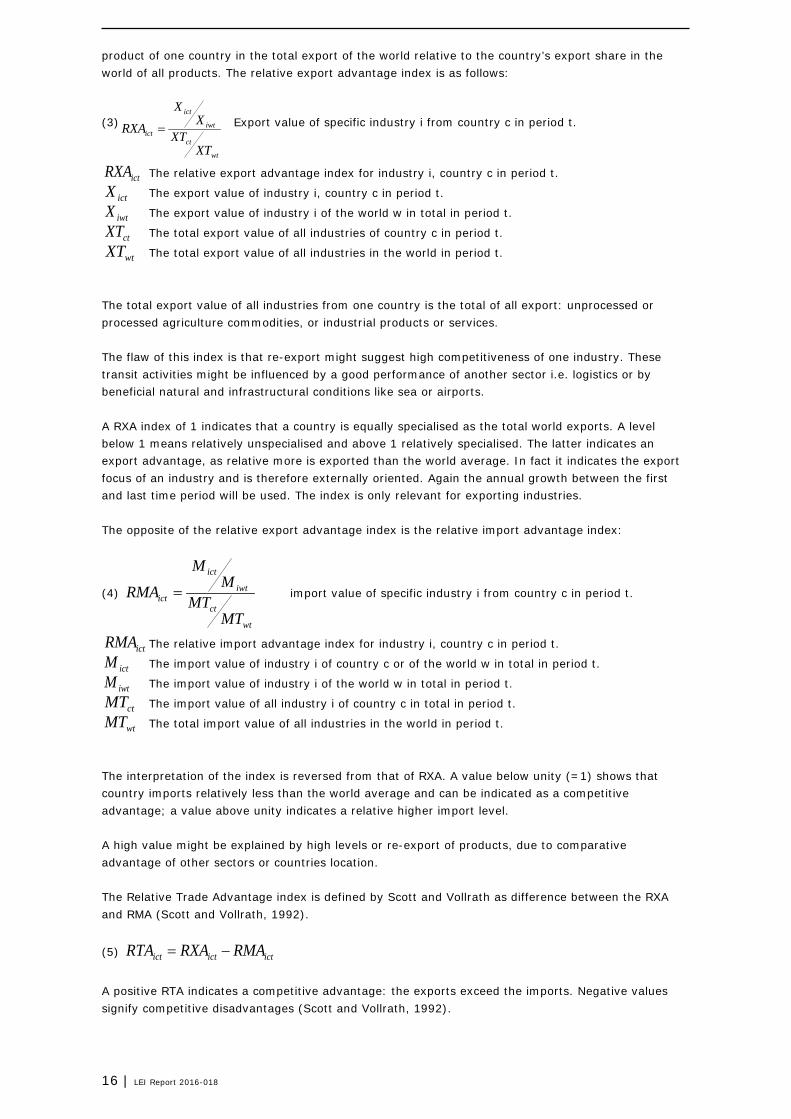
wtXT The total export value of all industries in the world in period t. The total export value of all industries from one country is the total of all export: unprocessed or processed agriculture commodities, or industrial products or services. The flaw of this index is that re-export might suggest high competitiveness of one industry. These transit activities might be influenced by a good performance of another sector i.e. logistics or by beneficial natural and infrastructural conditions like sea or airports. A RXA index of 1 indicates that a country is equally specialised as the total world exports. A level below 1 means relatively unspecialised and above 1 relatively specialised. The latter indicates an export advantage, as relative more is exported than the world average. In fact it indicates the export focus of an industry and is therefore externally oriented. Again the annual growth between the first and last time period will be used. The index is only relevant for exporting industries. The opposite of the relative export advantage index is the relative import advantage index:
(4)
wt
ct
iwt
ict
ict
MTMT
MM
RMA = import value of specific industry i from country c in period t.
ictRMA The relative import advantage index for industry i, country c in period t.
ictM The import value of industry i of country c or of the world w in total in period t.
iwtM The import value of industry i of the world w in total in period t.
ctMT The import value of all industry i of country c in total in period t.
wtMT The total import value of all industries in the world in period t. The interpretation of the index is reversed from that of RXA. A value below unity (=1) shows that country imports relatively less than the world average and can be indicated as a competitive advantage; a value above unity indicates a relative higher import level. A high value might be explained by high levels or re-export of products, due to comparative advantage of other sectors or countries location. The Relative Trade Advantage index is defined by Scott and Vollrath as difference between the RXA and RMA (Scott and Vollrath, 1992).
(5) ictictict RMARXARTA −=
A positive RTA indicates a competitive advantage: the exports exceed the imports. Negative values signify competitive disadvantages (Scott and Vollrath, 1992).

LEI Report 2016-018 | 17
The advantage of these indices is the simplicity to calculate these indicators based on an available and well accessible database. In this report, the values of all three indices are presented. As metrics in the assessment of the competiveness, the difference between 2 periods of the Relative Trade Advantage is used as this index summarises the export and import developments. This index has an advantage above the indices based on either export or imports (Frohberg and Hartmann, 1997). This indicator is a modification of the approach of Wijnands et al. (2008). 2.2.1.3 Other indices based on trade Several other indicators related to international trade are available such as the Net Trade Ratio that expresses the ratio between imports and exports of a country or the Grubel-Loyd intra-industry trade index, Porter-adapted index of RXA or the Dunning adapted RXA. Furthermore, several modifications of the indices mentioned above are discussed in the literature (Latruffe, 2010, Frohberg and Hartmann, 1997, Gellynck, 2002). We do not consider these indices because above we already mentioned the export and import advantage indices whose interpretation is less complicated in terms of competitiveness. The Porter and Dunning indices include outward and inbound production. We do not consider these indices because as we are using data from national accounts that includes only domestic production as we will present below.
2.2.2 Economic indicators
The selected indicators for quantifying the industry’s competitiveness are taken from Wijnands et al. (2008) and are presented below. 2.2.2.1 Real value added Creating added value is an important economic indicator. It is related to the industrial dynamism. Total value added is not only based on the production factor labour but also on the production factor capital and land. Again the growth is taken, so that countries can be compared easily. Annual growth in real value added of the food industry (or subsector). Their growth is taken as an indicator, so that countries can be compared despite differences in PPP. To determine the real value added we use the development of consumer prices also indicated as inflation. The inflation measures the change in the costs that the average consumer has to pay for a basket for services and goods. For our purpose, we use the consumer price index of the World Development Indicators database. To derive the real value added at factor costs, the nominal value added is deflated by the consumer price index.
(6) ct
ictict CP
VARVA =
ictRVA Real value added for industry i in in country c for period t
ictVA Nominal value added for industry i in country c for period t
ctCP Consumer price indicator for country c in period t 2.2.2.2 Labour productivity Labour productivity affects prices in the market. Growth of labour productivity improves industrial competitiveness in international markets. O’Mahoney and Van Ark use the growth in labour productivity (or value added) as performance indicator (O’Mahoney and Van Ark, 2003). This choice can be argued based on a statement by Krugman and Obstfield:
‘...absolute productivity advantage over other countries in producing a good is neither a necessary nor a sufficient condition for having a comparative advantage in that good.’ (Krugman and Obstfeld, 2006).

18 | LEI Report 2016-018
Labour productivity is often seen as a crucial determinant of competitiveness. The labour productivity is the real value added divided by the number of employees. This indicator cannot be compared between different countries due to different levels of Purchasing Power Parities. As we take the growth of the labour productivity, the indices of different countries can be compared. This indicator can be seen as measurement of the potential competitiveness.
(8) ict
ictict E
RVARLP =
ictRLP is real labour productivity for industry i in country c for period t
ictE is number of employees in industry i in country c for period t 2.2.2.3 Real value added shares Comparative advantage has two dimensions: • Cost of uniqueness advantage
This requires a comparison between domestic and foreign sectors or products. The other indicators are measuring the performance of that concept
• Efficiency gap Even if a sector performs well, other sectors might perform even better. In the long run, the sector that is thought to be successful performs less well than partial competitiveness studies predict. The better performing sectors can pay an additional ‘rent’ for the production factors (labour and/or capital) and outperform the high, but domestically lower performing sectors (Van Berkum and Van Meijl, 2000). The indicator below measures this aspect.
The importance of a specific subindustry is derived from its share in the food industry. A growth in the share reflects a competitive advantage. The industry is then able to attract resources for their production. This reflects the competition for production factors (labour and/or capital) between different industries within a country. The manufacturing industry is used for comparison. The metrics is the growth of the share of the specific (sub) industry in the manufacturing industry. A positive growth shows a better than average performance than the food industry as a whole.
(7) mct
ictict RVA
RVASRVA =
itSRVA Share of the real value added for industry i in total manufacture industry (m) in country c
for period t
m Manufacture industry as a whole 2.2.2.4 Exchange rates All indicators are growth percentages. Growth percentages are not influenced by exchange rates, so they can be calculated in the original currency. The nominal values in the descriptive parts are converted to euros with the exchange rate as mentioned by Eurostat and DNB. The conversion rate from EUR to USD in 2012 is 1.2848 and for 2008 1.4708. 2.2.2.5 Competitiveness assessment: growth of the indices According to Porter sustainable competitive advantage is the fundamental source for above-average performance in the long run (Porter, 1980; Porter, 1990). In line with Porter’s viewpoints, competitiveness of the food industry is defined as the sustained ability to achieve profitable gain and market share in domestic and export markets in which the industry is active. Annual growth rates (except for market shares on the world market and Net Trade Advantage index) between 2 periods are used as indicators. For the trade indicators we will use the difference between the last and first year. High growth rates indicate high ex-post performance, compared to other industries of a particular
LEI Report 2016-018 | 19
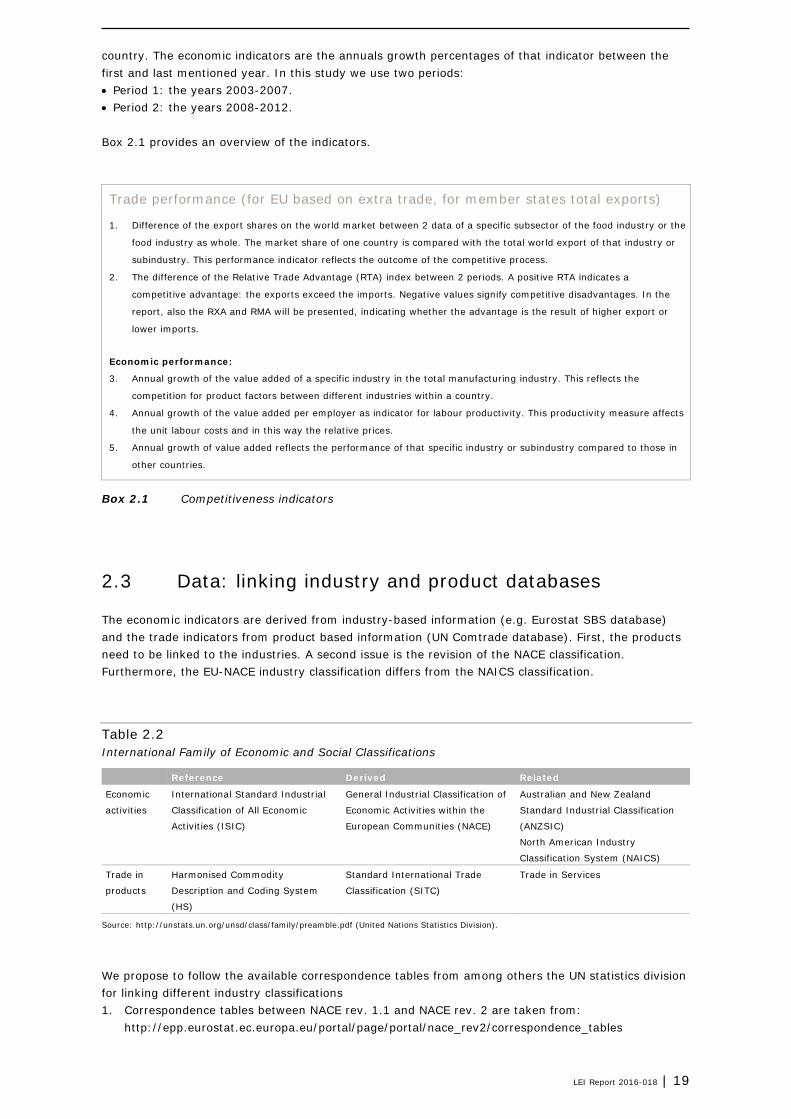
country. The economic indicators are the annuals growth percentages of that indicator between the first and last mentioned year. In this study we use two periods: • Period 1: the years 2003-2007. • Period 2: the years 2008-2012. Box 2.1 provides an overview of the indicators.
Trade performance (for EU based on extra trade, for member states total exports)
1. Difference of the export shares on the world market between 2 data of a specific subsector of the food industry or the
food industry as whole. The market share of one country is compared with the total world export of that industry or
subindustry. This performance indicator reflects the outcome of the competitive process.
2. The difference of the Relative Trade Advantage (RTA) index between 2 periods. A positive RTA indicates a
competitive advantage: the exports exceed the imports. Negative values signify competitive disadvantages. In the
report, also the RXA and RMA will be presented, indicating whether the advantage is the result of higher export or
lower imports.
Economic performance:
3. Annual growth of the value added of a specific industry in the total manufacturing industry. This reflects the
competition for product factors between different industries within a country.
4. Annual growth of the value added per employer as indicator for labour productivity. This productivity measure affects
the unit labour costs and in this way the relative prices.
5. Annual growth of value added reflects the performance of that specific industry or subindustry compared to those in
other countries.
Box 2.1 Competitiveness indicators
2.3 Data: linking industry and product databases
The economic indicators are derived from industry-based information (e.g. Eurostat SBS database) and the trade indicators from product based information (UN Comtrade database). First, the products need to be linked to the industries. A second issue is the revision of the NACE classification. Furthermore, the EU-NACE industry classification differs from the NAICS classification.
Table 2.2 International Family of Economic and Social Classifications
Reference Derived Related
Economic
activities
International Standard Industrial
Classification of All Economic
Activities (ISIC)
General Industrial Classification of
Economic Activities within the
European Communities (NACE)
Australian and New Zealand
Standard Industrial Classification
(ANZSIC)
North American Industry
Classification System (NAICS)
Trade in
products
Harmonised Commodity
Description and Coding System
(HS)
Standard International Trade
Classification (SITC)
Trade in Services
Source: http://unstats.un.org/unsd/class/family/preamble.pdf (United Nations Statistics Division).
We propose to follow the available correspondence tables from among others the UN statistics division for linking different industry classifications 1. Correspondence tables between NACE rev. 1.1 and NACE rev. 2 are taken from:
http://epp.eurostat.ec.europa.eu/portal/page/portal/nace_rev2/correspondence_tables

20 | LEI Report 2016-018
2. Linking industry classifications of the different regions by correspondence tables between NACE respectively NAICS and SITC are available. See for the link between NACE and ISIC also page 63 of (EC, 2008).
3. In Wijnands et al. (2007), all products - raw materials as well as processed food products - were linked to industries. Recently, an approach has been published on a two-digit HS and NACE code, making a distinction between agriculture and food industry (Carraresi and Banterle, 2015). In this study, products are linked to economic activities (NACE) based on a specific formulated correspondence table. All UN Comtrade 6-digit HS codes are linked to 4-digit NACE codes. Similar correspondence tables for linking HS codes to SITC codes are made before but not fully available (Arip et al., 2010). The bottom line is that we exclude raw materials because these are related to the competitiveness of the primary sector. That sector is not the object of this study.
Table 2.3 Export of agricultural products in 2012
Trade incl. intra-EU trade EU- intra-trade Trade excl. intra-EU trade
USDbn % USDbn USDbn %
Netherlands 96 6.2 76 20 1.8
Germany 87 5.6 65 21 1.9
France 76 4.9 50 26 2.3
Spain 46 3.0 35 12 1.0
Belgium 45 2.9 38 6 0.6
Italy 42 2.7 28 14 1.2
UK 31 2.0 19 12 1.1
Denmark 24 1.5 15 9 0.8
Poland 23 1.5 18 5 0.5
Ireland 20 1.3 13 7 0.6
Rest of EU 95 6.1 68 27 2.4
EU 585 37.8 425 160 14.2
USA 161 10.4 161 14.3
Brazil 84 5.4 84 7.5
China 64 4.1 64 5.7
Canada 56 3.6 56 4.9
Argentina 43 2.8 43 3.9
India 43 2.8 43 3.8
Thailand 42 2.7 42 3.8
Indonesia 42 2.7 42 3.7
Australia 38 2.5 38 3.4
Malaysia 32 2.1 32 2.9
New Zealand 25 1.6 25 2.2
Viet Nam 24 1.6 24 2.1
Mexico 22 1.4 22 2.0
Russia 22 1.4 22 2.0
Rest of World 266 17.2 266 23.7
World 1,548 100.0 1,123 100.0
Source: Calculation based by LEI Wageningen UR based on UN Comtrade.
2.4 Selection of countries: export orientation
As one of the objectives for this research was an update of the 2007 study (Wijnands et al., 2007), the country selection had to be similar. In the earlier study the selection was mainly based on the export of agricultural products and coverage of most of the subindustries. The export figures are presented in Table 2.3.

LEI Report 2016-018 | 21
If EU28 is considered as one region, the trade between EU member states complicates the interpretation. In the case the EU is the sum of 28 independent countries, the EU28-int is by far the largest exporter, with an export share on the world market of 38%. However, around 73% is trade between the member states: this trade is indicated as intra-EU trade. EU28 as one region, excluding the intra-EU trade between member states, is still a significant exporter, however in 2012 on the same level as the USA: both just above 14% of the world export (adjusted for intra-EU trade). It also shows that several EU member states have a high rank in the export position due to the intra-EU trade. The Netherlands and Germany rank second and third after the USA and before Brazil if intra-EU trade is included. Without intra-EU trade, they rank after Russia, in the double-digit positions. If we compare the EU without individual member states, we will use the trade without intra-EU trade. If member states are included, intra-EU trade will be included: all trade is important then. A second criterion in 2007 was the accessibility of structural business data. These data could not easily be retrieved from several countries. In addition, a third criterion was covering as many subindustries as possible. Furthermore, the resources were not sufficient to explore several new sources for retrieving data. The final selection included the EU, USA, Brazil (the 3 largest exporters), Canada and Australia. These 5 countries have over 60% of the world trade (if intra-EU trade is included) or almost 50% (if intra-EU trade is excluded).
2.5 Presentation of competitiveness: relative positions
For visual purposes, indicators for the countries are presented in Z-scores. A ‘Z-score’ is a standard score that is dimensionless, has an average of 0 and a standard deviation of 1. In a graphic representation of Z-scores, indicators of one country will be seen according to its relative position against indicators of other countries included in the analysis. In this way it is possible to visualise the assessment: whether the country is positioned weak, average or strong with respect to its competitors. Z-scores are calculated in the following way: Z-SCORE = (INDIVIDUAL INDICATOR – AVERAGE)/STANDARD DEVIATION. As an example, in Table 2.4 the observed data and Z-scores for 2 indicators are presented.
Table 2.4 Observed values and Z-scores of a trade and economic indicator
Indicator Period Metrics EU28 USA Australia Brazil Canada
Difference
market share
2003-2007 % -1.04 -0.96 -0.29 0.89 -0.67
Z-score -0.80 -0.69 0.16 1.66 -0.32
2008-2012 % 0.60 0.99 -0.01 0.23 0.10
Z-score 0.52 1.49 -0.95 -0.37 -0.69
Growth real value
added
2003-2007 % -0.21 -4.38 -4.82 12.03 3.55
Z-score -0.21 -0.81 -0.87 1.56 0.33
2008-2012 % -0.52 3.48 9.05 11.42 3.94
Z-score -1.26 -0.42 0.75 1.25 -0.32
The indicators showed that the EU28 lost the largest market share (-1.04%) of all countries in the first period 2003-2007. By this it is classified as the weakest country. Brazil had the highest gain in market share (0.89%) and is positioned on the strong side. Australia lost also market share, however modest compared to other countries: for that reason it positioned above average. In the second period 2008-2012 EU has a positive gain in market (0.60%), but below the growth of the USA (0.99%) reflected in the both position. The average gain in market share of all 5 countries was 0.38% and both countries are above average. Despite that all countries, except Australia, have a positive market share gain; all are positioned on the weak side. These countries perform weakly compared to USA and the EU28. The annual growth of the real value added of Canada (3.94%) was in the second period 2008-2012 higher than in the first period 2003-2007(3.55%). Nevertheless, the position of Canada was in the second period below that of the first period. The average growth in the first period of all

22 | LEI Report 2016-018
countries was 1.23% and in the second period (5.47%), and hence Canada performed below average in second period and above average in the first period. The Z-scores are depicted in Figure 2.1 with indicator acronyms as identification labels. The graphs are all standardised on values between -2 and +2. Z-scores out of that range are always depicted just outside the margin of the graph.
Category Indicator Period
2003-2007 2008-2012 Economic Annual growth rate real added value P1 P2 Trade Difference world market share M1 M2
Figure 2.1 Example of presentations of Z-scores for 2 indicators of developments in competitiveness
For each country an ‘overall’ competitiveness score will be calculated. That score is the Z-score of the average, all weighted with unity, of all Z-score of the indicators. This unity weighting can be discussed as some indicators might be more important: e.g. if the home market is the largest market for the food industry.
M1
M1
M1
M1
M1
M2
M2
M2
M2
M2
P1
P1
P1
P1
P1
P2
P2
P2
P2
P2
EU28
USA
Australia
Brazil
Canada
Weak average strongExample food products and beverages (C10-C11)
LEI Report 2016-018 | 23
3 The food and beverages Industry
3.1 Overview: EU competitiveness weakened
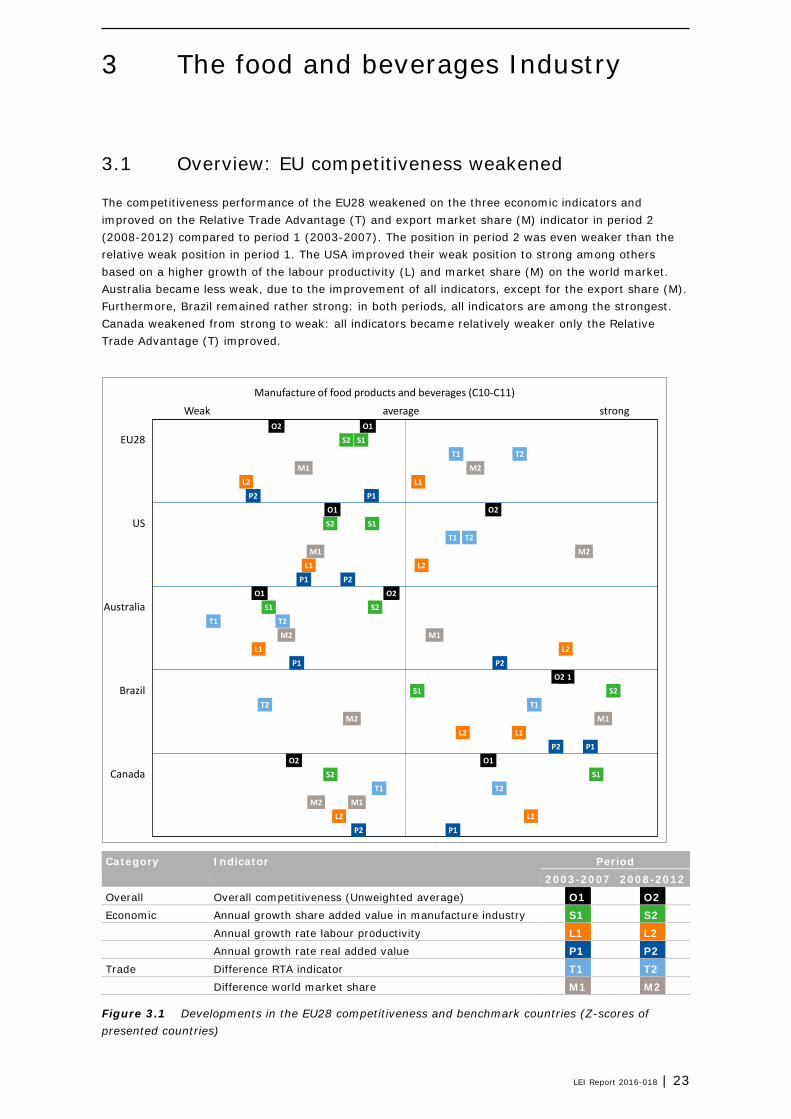
The competitiveness performance of the EU28 weakened on the three economic indicators and improved on the Relative Trade Advantage (T) and export market share (M) indicator in period 2 (2008-2012) compared to period 1 (2003-2007). The position in period 2 was even weaker than the relative weak position in period 1. The USA improved their weak position to strong among others based on a higher growth of the labour productivity (L) and market share (M) on the world market. Australia became less weak, due to the improvement of all indicators, except for the export share (M). Furthermore, Brazil remained rather strong: in both periods, all indicators are among the strongest. Canada weakened from strong to weak: all indicators became relatively weaker only the Relative Trade Advantage (T) improved.
Category Indicator Period
2003-2007 2008-2012 Overall Overall competitiveness (Unweighted average) O1 O2 Economic Annual growth share added value in manufacture industry S1 S2 Annual growth rate labour productivity L1 L2 Annual growth rate real added value P1 P2 Trade Difference RTA indicator T1 T2 Difference world market share M1 M2
Figure 3.1 Developments in the EU28 competitiveness and benchmark countries (Z-scores of presented countries)
O1
O1
O1
O1
O1
O2
O2
O2
O2
O2
S1
S1
S1
S1
S1
S2
S2
S2
S2
S2
T1
T1
T1
T1
T1
T2
T2
T2
T2
T2
M1
M1
M1
M1
M1
M2
M2
M2
M2
M2
L1
L1
L1
L1
L1
L2
L2
L2
L2
L2
P1
P1
P1
P1
P1
P2
P2
P2
P2
P2
EU28
US
Australia
Brazil
Canada
Weak average strongManufacture of food products and beverages (C10-C11)

24 | LEI Report 2016-018
3.2 Structure: EU largest turnover but smallest growth
Manufacture of food products (C10) includes the processing of the products of agriculture, forestry and fishing into food for humans or animals, and includes the production of various intermediate products that are not directly food or feed products (e.g. hides). Manufacture of beverages (C11) includes the manufacture of beverages, such as non-alcoholic beverages and mineral water, manufacture of alcoholic beverages and distilled alcoholic beverages, but excludes manufacture of fruit and vegetable juices, of milk-based beverages and of coffee, tea and mate products (EC, 2008). The EU28 food and beverages industry is the largest in turnover, enterprises and employment of the selected regions: 1.5 times the size of USA industry. However, the average turnover per enterprise is the lowest: only 10% of the Brazilian enterprises and round 15% of the USA turnover. In addition, the growth is among the lowest. In the period 2003-2007, the growth of the turnover was after Brazil the largest, but the other structure parameters were more or less the same. The numbers of enterprises within the EU seems rather large compared to the USA. One of the reasons might be the definitions of firms/enterprises. The USA has the definition for the coverage of the census:
‘Manufacturing establishments with one or more paid employees or nonemployees that use leased employees for manufacturing.’1
The coverage for Eurostat is:
‘To constitute the enterprise unit, use is made of legal units that exercise, wholly or partially, a productive activity. Legal units include legal persons whose existence is recognized by law independently of the individuals or institutions which may own them or are members of them, or natural persons who are engaged in an economic activity in their own right.’
In the EU, also private persons without employees are included, whereas the definition of the USA excludes such entities. Due to this difference in definition, average per enterprises will have always a flaw. The available statistics do not allow excluding enterprises without employees. There will be no impact on the competitiveness assessment, as no indicators based on enterprise sizes are included. Furthermore, small-scaled enterprises are large in numbers but contribute only a very small share to the industries employment and turnover.
Table 3.1 Structure of the food products and beverages industry (C10-C11) in 2012 and growth 2008-2012
Turnover
(€bn)
Growth in
turnover
(%)
Number of
enterprises
Growth in
enterprises
(%)
Turnover
per
enterprise
(€m)
Growth in
turnover
per
enterprise
(%)
Persons
employed
(1,000)
Growth in
persons
employed
(%)
EU28 1,061 1.5 288,655 -0.5 3.7 2.1 4,515 0.8
USA 652 6.7 25,974 1.0 25.1 5.6 1,550 -0.3
Australia 71 10.7 13,018 1.4 5.4 9.2 240 0.5
Brazil 186 13.6 4,959 5.2 37.5 8.0 1,615 5.9
Canada 73 7.5 8,318 -2.5 8.7 10.3 266 2.1
Sources: Based on Eurostat (EU), AUSSTATS (Australia), CANSIM (Canada), CENSUS (USA) and IBGE (Brazil).
1 http://www.census.gov/manufacturing/asm/about_the_surveys/index.html

LEI Report 2016-018 | 25
Figure 3.2 Lorentz curves of enterprises and turnover/employment for the food manufacturing Sources: Based on Eurostat (EU) and CENSUS (USA).
The size distribution of the food industry is skewed: 90% of the enterprises produces 10% of the total turnover. In addition, around 80% of the enterprises have less than 20% of the employees in the EU as well as in the USA. The large-scaled enterprises determine the main contribution to countries economy.
3.3 Trade: EU28 has stable world market shares
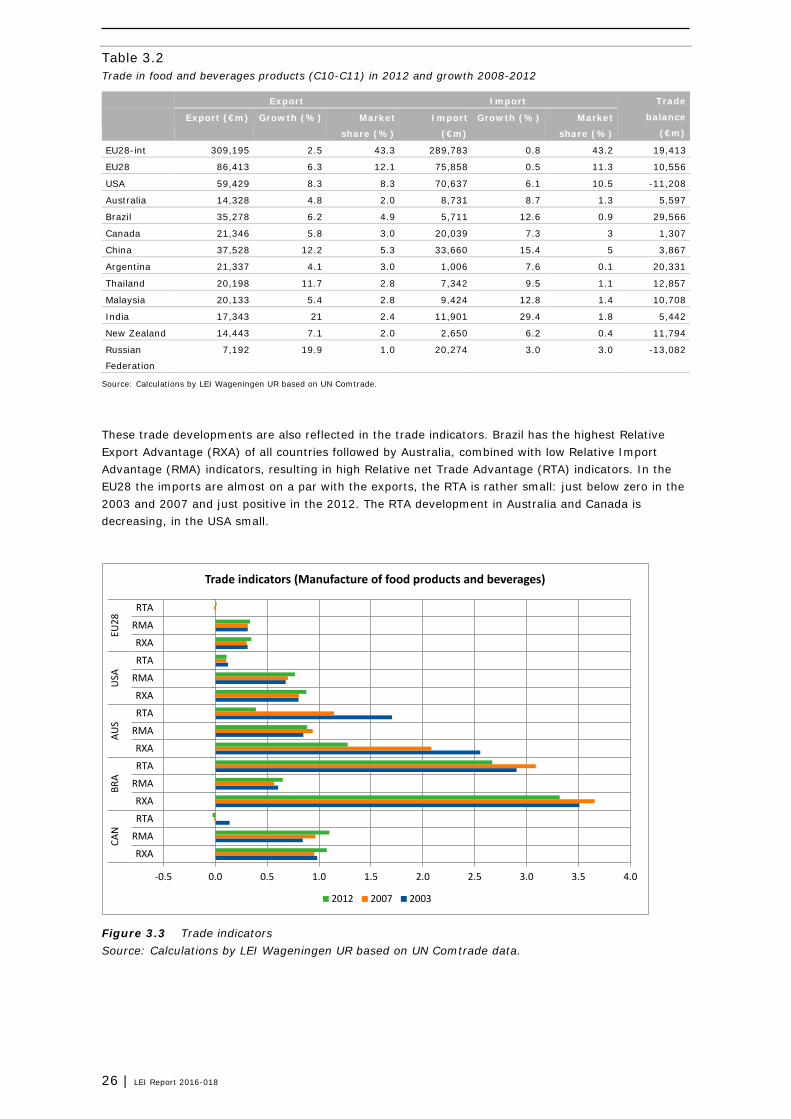
The extra-EU trade (intra-EU trade is excluded), indicated as EU28, grew 6.3%: faster than the export growth in other presented countries except for the US. The EU28 market share on the world market was nevertheless just a fraction (0.03%) above the level in 2007. A different development can be observed for the imports, the growth of the EU28 was at lower pace than other countries: the market share of imports dropped from 12.8% in 2003 to 11.3% in 2012. These two developments resulted in a more positive trade balance: from USD3.5bn negative in 2003 to over USD10bn positive in 2012. The net trade balance also improved for the USA, but most strongly for Brazil. The Brazilian exports were almost USD18bn in 2007 and 35bn USD in 2012. It is remarkable that the export of the EU28 (the sum of 28 member states) grew annually by 2.5% in the second period, below the level of 6.3% of the extra-EU trade, indicating that the common market did not stimulate the intra-trade additionally. On the other hand, the growth of imports (0.8%) of the aggregate of the EU28-int member states was slightly higher than the imports from the external markets.
0
10
20
30
40
50
60
70
80
90
100
0 10 20 30 40 50 60 70 80 90 100
% T
urno
ver
or E
mpl
oyee
s
% Enterprises
Food manufacturing (NACE C10 and NAICS 311)
EU28 employees
EU28 turnover
USA Employees
Equality
26 | LEI Report 2016-018
Table 3.2 Trade in food and beverages products (C10-C11) in 2012 and growth 2008-2012
Export Import Trade
balance
(€m) Export (€m) Growth (%) Market
share (%)
Import
(€m)
Growth (%) Market
share (%)
EU28-int 309,195 2.5 43.3 289,783 0.8 43.2 19,413
EU28 86,413 6.3 12.1 75,858 0.5 11.3 10,556
USA 59,429 8.3 8.3 70,637 6.1 10.5 -11,208
Australia 14,328 4.8 2.0 8,731 8.7 1.3 5,597
Brazil 35,278 6.2 4.9 5,711 12.6 0.9 29,566
Canada 21,346 5.8 3.0 20,039 7.3 3 1,307
China 37,528 12.2 5.3 33,660 15.4 5 3,867
Argentina 21,337 4.1 3.0 1,006 7.6 0.1 20,331
Thailand 20,198 11.7 2.8 7,342 9.5 1.1 12,857
Malaysia 20,133 5.4 2.8 9,424 12.8 1.4 10,708
India 17,343 21 2.4 11,901 29.4 1.8 5,442
New Zealand 14,443 7.1 2.0 2,650 6.2 0.4 11,794
Russian
Federation
7,192 19.9 1.0 20,274 3.0 3.0 -13,082
Source: Calculations by LEI Wageningen UR based on UN Comtrade.
These trade developments are also reflected in the trade indicators. Brazil has the highest Relative Export Advantage (RXA) of all countries followed by Australia, combined with low Relative Import Advantage (RMA) indicators, resulting in high Relative net Trade Advantage (RTA) indicators. In the EU28 the imports are almost on a par with the exports, the RTA is rather small: just below zero in the 2003 and 2007 and just positive in the 2012. The RTA development in Australia and Canada is decreasing, in the USA small.
Figure 3.3 Trade indicators Source: Calculations by LEI Wageningen UR based on UN Comtrade data.
-0.5 0.0 0.5 1.0 1.5 2.0 2.5 3.0 3.5 4.0
RXA
RMA
RTA
RXA
RMA
RTA
RXA
RMA
RTA
RXA
RMA
RTA
RXA
RMA
RTA
CAN
BRA
AUS
USA
EU28
Trade indicators (Manufacture of food products and beverages)
2012 2007 2003
LEI Report 2016-018 | 27
3.4 EU member states: 5 countries have two-thirds of turnover
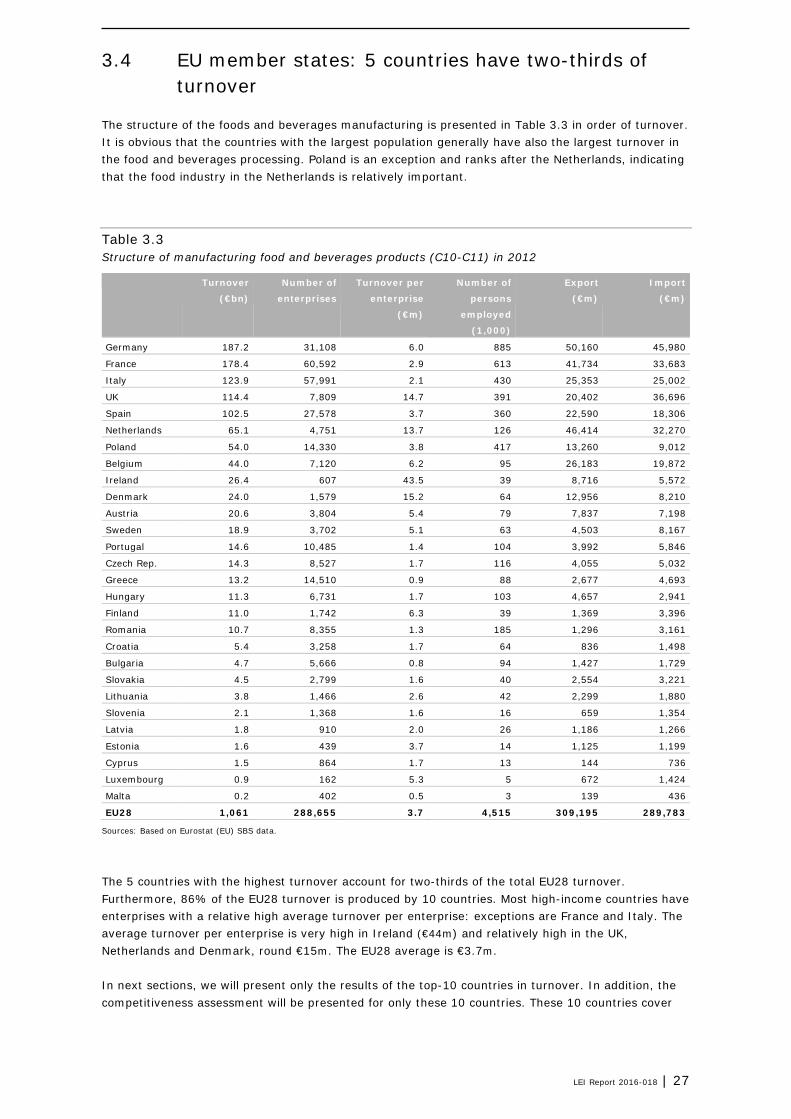
The structure of the foods and beverages manufacturing is presented in Table 3.3 in order of turnover. It is obvious that the countries with the largest population generally have also the largest turnover in the food and beverages processing. Poland is an exception and ranks after the Netherlands, indicating that the food industry in the Netherlands is relatively important.
Table 3.3 Structure of manufacturing food and beverages products (C10-C11) in 2012
Turnover
(€bn)
Number of
enterprises
Turnover per
enterprise
(€m)
Number of
persons
employed
(1,000)
Export
(€m)
Import
(€m)
Germany 187.2 31,108 6.0 885 50,160 45,980
France 178.4 60,592 2.9 613 41,734 33,683
Italy 123.9 57,991 2.1 430 25,353 25,002
UK 114.4 7,809 14.7 391 20,402 36,696
Spain 102.5 27,578 3.7 360 22,590 18,306
Netherlands 65.1 4,751 13.7 126 46,414 32,270
Poland 54.0 14,330 3.8 417 13,260 9,012
Belgium 44.0 7,120 6.2 95 26,183 19,872
Ireland 26.4 607 43.5 39 8,716 5,572
Denmark 24.0 1,579 15.2 64 12,956 8,210
Austria 20.6 3,804 5.4 79 7,837 7,198
Sweden 18.9 3,702 5.1 63 4,503 8,167
Portugal 14.6 10,485 1.4 104 3,992 5,846
Czech Rep. 14.3 8,527 1.7 116 4,055 5,032
Greece 13.2 14,510 0.9 88 2,677 4,693
Hungary 11.3 6,731 1.7 103 4,657 2,941
Finland 11.0 1,742 6.3 39 1,369 3,396
Romania 10.7 8,355 1.3 185 1,296 3,161
Croatia 5.4 3,258 1.7 64 836 1,498
Bulgaria 4.7 5,666 0.8 94 1,427 1,729
Slovakia 4.5 2,799 1.6 40 2,554 3,221
Lithuania 3.8 1,466 2.6 42 2,299 1,880
Slovenia 2.1 1,368 1.6 16 659 1,354
Latvia 1.8 910 2.0 26 1,186 1,266
Estonia 1.6 439 3.7 14 1,125 1,199
Cyprus 1.5 864 1.7 13 144 736
Luxembourg 0.9 162 5.3 5 672 1,424
Malta 0.2 402 0.5 3 139 436
EU28 1,061 288,655 3.7 4,515 309,195 289,783
Sources: Based on Eurostat (EU) SBS data.
The 5 countries with the highest turnover account for two-thirds of the total EU28 turnover. Furthermore, 86% of the EU28 turnover is produced by 10 countries. Most high-income countries have enterprises with a relative high average turnover per enterprise: exceptions are France and Italy. The average turnover per enterprise is very high in Ireland (€44m) and relatively high in the UK, Netherlands and Denmark, round €15m. The EU28 average is €3.7m. In next sections, we will present only the results of the top-10 countries in turnover. In addition, the competitiveness assessment will be presented for only these 10 countries. These 10 countries cover

28 | LEI Report 2016-018
round 85% of the total EU28 turnover, export, import value, and round 75% of the number of enterprises and of persons employed. The competitiveness of the EU28 as a whole is relatively weak. However, the assessment of countries varies as is shown in the figure below. The competitiveness positions of the relatively large countries Germany, France and Poland are weak in period 2 and weaker than in period 1. The competitive positions of Italy, Netherlands and to a lesser extent UK, Spain and Belgium are relatively strong. The Netherlands had the strongest position in period 2, after being amongst the weakest in period 1.
Indicator Period 2 Period 1 Overall competitiveness O2 2008-2012 O1 2003-2007
Figure 3.4 Developments in competitiveness of 10 selected EU28 member states in decreasing order of turnover
O1
O1
O1
O1
O1
O1
O1
O1
O1
O1
O2
O2
O2
O2
O2
O2
O2
O2
O2
O2
DE
FR
IT
UK
ES
NL
PL
BE
IE
DK
Weak average strongManufacture of food products and beverages (C10-C11)

LEI Report 2016-018 | 29
4 Food and beverages subindustries
4.1 Largest turnover for meat, ‘other food’ and beverages
The top subsectors based on turnover are meat, ‘other food’ products, beverages and on the fourth position dairy manufacturing (see sections below for definitions). However, in the number of enterprises the manufacture of bakery and farinaceous products outnumbers the total of all other subsectors. Although fish processing is the smallest sector, it is the largest in imports. Beverages manufacture is the largest exporter to third countries; animal feed is the largest importer, whereas dairy has a very low import level. In the sections below all subsectors are analysed at 3-digit level. For the subindustry other food the subsectors sugar and confectionary and for the subindustry beverages the subsector spirits is additionally presented.
Figure 4.1 Enterprises, turnover and extra-EU trade of selected subsectors in the EU28 in 2012 Source: LEI Wageningen UR (based on Eurostat SBS data and UN Comtrade).
4.2 Meat
4.2.1 Overview: EU competitiveness remained weak
Manufacture of meat products (C101) includes processing and preserving of meat and production of meat products (frozen, cuts, dried or smoked) from all kinds of animals including processing hides, feathers and down. It excludes packaging of meat (EC, 2008). The competitiveness performance of the EU28 meat processing sector remained weak on the three economic indicators and improved on the Relative Trade Advantage (T) and export market share (M) indicator in period 2 (2008-2012) compared to period 1 (2003-2007). The position in period 2 was even weaker than the relative weak position in period 1. The USA and Australia improved their weak positions to strong. The USA improved its position based on the trade indicators and Australia on the
0102030405060708090
100
Enterprises Turnover Export Import
Share of sub-industries in total food and beverages manufacturing
Meat Fish Fruit-vegetables Oil Dairy
Cereals Bakery Other food Animal feed Beverages

30 | LEI Report 2016-018
economic indicators. Brazil became less strong: due to poor trade indicators. Canada weakened from strong to weak: all indicators became relatively weaker only the Relative Trade Advantage (T) improved.
Category Indicator Period
2003-2007 2008-2012 Overall Overall competitiveness (Unweighted average) O1 O2 Economic Annual growth share added value in manufacture industry S1 S2 Annual growth rate labour productivity L1 L2 Annual growth rate real added value P1 P2 Trade Difference RTA indicator T1 T2 Difference world market share M1 M2
Figure 4.2 Developments in competitiveness of the EU28 and benchmark countries (Z-scores of presented countries)
4.2.2 Structure of the industry: EU is small-scaled and has low growth
The EU28 meat industry is the largest in turnover, number of enterprises and employment of the selected regions. However, the average turnover per enterprise is the lowest: only 10% of the level of those in the USA and Brazil. In addition, the growth of the turnover is the lowest in total as per enterprise. Brazil and Australia are the fastest growers. The meat sector is the largest sector in the EU-food industry accounting for 20.5% of the total turnover of the food and beverages industry. Moreover, in period 2 2008-2012 the growth of the turnover was twice the level of the food and beverages. The average turnover per enterprise is above the average of the food and beverages industry. In addition, the enterprise size grew faster than the food and beverages industry.
O1
O1
O1
O1
O1
O2
O2
O2
O2
O2
S1
S1
S1
S1
S1
S2
S2
S2
S2
S2
T1
T1
T1
T1
T1
T2
T2
T2
T2
T2
M1
M1
M1
M1
M1
M2
M2
M2
M2
M2
L1
L1
L1
L1
L1
L2
L2
L2
L2
L2
P1
P1
P1
P1
P1
P2
P2
P2
P2
P2
EU28
US
Australia
Brazil
Canada
Weak average strongProcessing and preserving of meat and production of meat products (C101)

LEI Report 2016-018 | 31
Table 4.1 Structure of the meat industry (C101) in 2012 and growth 2008-2012
Turnover
(€bn)
Growth in
turnover
(%)
Number of
enterprise
s
Growth in
enter-
prises (%)
Turnover
per
enterprise
(€m)
Growth in
turnover
per
enterprise
(%)
Persons
employed
(1,000)
Growth in
persons
employed
(%)
EU28 217 3.2 39,016 -1.6 5.6 4.9 936,602 -1.0
USA 156 7.7 3,000 -1.1 52.1 9.0 486,478 -1.0
Australia 18 12.1 1,096 0.4 16.6 11.6 59,748 0.5
Brazil 51 13.7 826 3.9 62.0 9.5 479,245 3.0
Canada 17 6.3 1,003 -2.6 17.4 9.2 64,570 -1.4
Sources: Based on Eurostat (EU), AUSSTATS (Australia), CANSIM (Canada), CENSUS (USA) and IBGE (Brazil).
4.2.3 Trade: EU28 has higher export than import growth
The extra-EU trade (intra-EU trade is excluded), grew by 8.7%, which was faster than the export growth in all other presented countries. The EU28 market share on the world market improved with 1.3% from 7.5% in 2007 to 8.9% in 2012. The import share showed the opposite development from 8.6 to 7.2%. These two developments resulted in a positive trade balance. For all other countries, the net trade balance deteriorated due to a higher import growth compared to the export growth. However, for Australia and Brazil the exports are 10 to 30 times the import levels. Remarkable is that the export of the EU28-int (the sum of 28 member states) grew annually with 2.8% in the second period, below the level of 8.7% of the extra-EU trade, indicating that the common market did not stimulate the intra-trade additionally. On the other hand, the growth of imports (1.1%) by the aggregate of the EU28 member states was significant higher than (negative) growth by the EU28 (-1.9%).
Table 4.2 Trade in meat products (C101) in 2012 and growth 2008-2012
Export Import Trade
balance
(€m) Export (€m) Growth
(%)
Market
share (%)
Import
(€m)
Growth (%) Market
share (%)
EU28-int 52,406 2.8 47 46,573 1.1 48 5,832
EU28 9,882 8.7 8.9 7,003 -1.9 7.2 2,879
USA 14,198 7.6 12.7 5,629 5.3 5.8 8,569
Australia 5,901 5.5 5.3 539 11.3 0.6 5,362
Brazil 12,316 1.9 11.1 362 13 0.4 11,953
Canada 3,870 3.2 3.5 2,598 11.5 2.7 1,272
Source: Calculations by LEI Wageningen UR based on UN Comtrade.
These trade developments are also reflected in the trade indicators. Brazil and Australia have the highest Relative Export Advantage (RXA), combined with low Relative Import Advantage (RMA) indicators, resulting in high Relative net Trade Advantage (RTA) indicators. In the EU28 the imports are almost on a par with the exports, the RTA is rather small: just below zero in the 2003 and 2007 and just positive in the 2012. The developments in USA are varying and the Net trade balance for Canada declined.

32 | LEI Report 2016-018
Figure 4.3 Trade indicators Source: Calculations by LEI Wageningen UR based on UN Comtrade data.
4.2.4 EU member states: Italy and UK improved scores and Poland strongest
The competitiveness of the EU28 as a whole is relatively weak. However, the assessment of countries varies as is shown in the figure below.
Indicator Period 2 Period 1 Overall competitiveness O2 2008-2012 O1 2003-2007
Figure 4.4 Developments in competitiveness of 10 selected EU28 member states in decreasing order of turnover
-1.0 -0.5 0.0 0.5 1.0 1.5 2.0 2.5 3.0 3.5 4.0 4.5 5.0 5.5 6.0 6.5 7.0 7.5 8.0 8.5 9.0 9.5 10.010.5
RXARMARTARXA
RMARTARXA
RMARTARXA
RMARTARXA
RMARTA
CAN
BRA
AUS
USA
EU28
Trade indicators (Processing and preserving of meat and production of meat products)
2012 2007 2003
O1
O1
O1
O1
O1
O1
O1
O1
O1
O1
O2
O2
O2
O2
O2
O2
O2
O2
O2
O2
DE
FR
IT
ES
UK
PL
NL
BE
DK
IE
Weak average strongProcessing and preserving of meat and production of meat products (C101)

LEI Report 2016-018 | 33
The presented countries account for 87% of the turnover, 90% of the export and 81% of the import. The competitiveness of Germany, Netherlands and Ireland weakened from a relatively strong position to weak. Italy and UK improved their positions from relatively weak to strong. Poland improved its strong position, whereas Denmark remained very weak.
4.3 Fish
4.3.1 Overview: EU competitiveness weakened
Processing and preserving of fish, crustaceans and molluscs (C102) include preparation and preservation of fish, crustaceans and molluscs and their products by freezing, deep-freezing, drying, cooking, smoking, salting, immersing in brine, canning etc. for human consumption or animal feed. It includes also vessels with only purpose of processing fish and also the activity of processing of seaweed. It excludes all activities on fishing vessels, processing whales, production of fish oils and fats as well as manufacture of fish dishes or soups (EC, 2008).
Indicator Period
2003-2007 2008-2012 Overall Overall competitiveness (Unweighted average) O1 O2 Economic Annual growth share added value in manufacture industry S1 S2 Annual growth rate labour productivity L1 L2 Annual growth rate real added value P1 P2 Trade Difference RTA indicator T1 T2 Difference world market share M1 M2
Figure 4.5 Developments in competitiveness of the EU28 and benchmark countries (Z-scores of presented countries)
O1
O1
O1
O1
O1
O2
O2
O2
O2
O2
S1
S1
S1
S1
S1
S2
S2
S2
S2
S2
T1
T1
T1
T1
T1
T2
T2
T2
T2
T2
M1
M1
M1
M1
M1
M2
M2
M2
M2
M2
L1
L1
L1
L1
L1
L2
L2
L2
L2
L2
P1
P1
P1
P1
P1
P2
P2
P2
P2
P2
EU28
US
Australia
Brazil
Canada
Weak average strongProcessing and preserving of fish, crustaceans and molluscs (C102)

34 | LEI Report 2016-018
The competitiveness performance of the EU28 became weak on the three economic indicators (S, L, P) and improved slightly on the Relative Trade Advantage (T) and remained stable on the export market share (M) indicator in period 2 (2008-2012) compared to period 1 (2003-2007). The overall position shifted to weak in period 2 from relatively strong in period 1. Australia became even weaker from just below average to rather weak. Also, the USA became weaker; however the country is still on the stronger side. Brazil improved its position and became the strongest of all countries: the economic indicators improved strongly, the trade indicator become weak. Canada remained weak due to a mixed development of the indicators.
4.3.2 Structure of the industry: EU relatively large but low growth
The EU28 fish industry is the largest in turnover, number of enterprises and employment of the selected regions. The average turnover per enterprise is 40% of the level in the USA, but on par with the other countries. Brazil and to a lesser extent Canada are the fastest growers in turnover, the EU growth is the lowest. The fish sector has the smallest share in the food and beverages industry; however, the average turnover per enterprise and its growth is above that of the whole food and beverages sector.
Table 4.3 Structure of fish industry (C102) in 2012 and growth 2008-2012
Turno
ver
(€bn)
Growth
in
turnover
(%)
Number of
enterprise
s
Growth in
enterprise
s (%)
Turnover
per
enterprise
(€m)
Growth in
turnover per
enterprise
(%)
Persons
employe
d
(1,000)
Growth in no.
of persons
employed
(%)
EU28 24 2.4 3,568 -2.1 6.7 4.6 109,487 -2.6
USA 8 5.4 497 -3.3 17.0 9.0 30,988 -4.5
Australia 1 6.7 252 -4.7 3.5 12.0 3,314 1.9
Brazil 1 14.6 95 7.2 9.8 6.9 12,425 1.0
Canada 3 9.0 732 -7.8 4.6 18.2 33,034 4.6
Sources: Based on Eurostat (EU), AUSSTATS (Australia), CANSIM (Canada), CENSUS (USA) and IBGE (Brazil).
4.3.3 Trade: Only Canada has a positive trade balance
The extra-EU trade of the EU28 (intra-EU trade is excluded), grew by 6.1% and that of the USA by 6.9%, which was far faster than in all other presented countries. The EU28 market share on the world market improved slightly from 4.4% in 2007 to 4.6% in 2012.
Table 4.4 Trade of fish products (C102) in 2012 and growth 2008-2012
Export Import Trade
balance
(€m) Export (€m) Growth
(%)
Market
share (%)
Import
(€m)
Growth (%) Market
share (%)
EU28-int 15,377 1.8 21.1 27,228 0.3 34.7 -11,851
EU28 3,373 6.1 4.6 16,634 0.4 21.2 -13,261
USA 4,057 6.9 5.6 12,449 4.2 15.9 -8,392
Australia 688 2 0.9 1,107 9.1 1.4 -419
Brazil 154 -5.6 0.2 778 14.8 1 -624
Canada 2,729 3.4 3.7 1,781 7.7 2.3 948
Source: Calculations by LEI Wageningen UR based on UN Comtrade.

LEI Report 2016-018 | 35
The import share showed the opposite development from 24.1 to 21.2%. In the end the trade balance, remained negative. Similar to the food and beverages industry the export and import of the EU28 (the sum of 28 member states) grew slower than the extra-EU trade, indicating that the common market did not stimulate the intra-EU trade additionally. The sector has the largest share (22%) in the total imports of the food and beverages industry. These trade developments are also reflected in the trade indicators. All countries have a negative Relative net Trade Advantage (RTA) indicator in 2012, except Canada. In Brazil and Australia the RTA changed from positive in 2003 to negative in 2012.
Figure 4.6 Trade indicators Source: Calculations by LEI Wageningen UR based on UN Comtrade data.
4.3.4 EU member states: Ireland strongest and Denmark weakest
The competitiveness of the EU28 changed from strong to weak. Several EU member states improved their position from weak to strong: especially Belgium and Ireland improved their competitiveness. Poland lost its strong position and the weak Denmark became even the weakest. The presented countries account for 84 to 89% of the EU28 turnover, export or of the import of this subsector. Spain (19% of EU’s turnover), France (15%), the UK (13%) and Germany (10%) together have two-thirds of the total EU’s turnover. In addition, Spain is the largest exporter (16% of EU export including intra-EU trade) and importer (18%).
-1.0 -0.5 0.0 0.5 1.0 1.5 2.0
RXA
RMA
RTA
RXA
RMA
RTA
RXA
RMA
RTA
RXA
RMA
RTA
RXA
RMA
RTA
CAN
BRA
AUS
USA
EU28
Trade indicators (Processing and preserving of fish, crustaceans and molluscs)
2012 2007 2003

36 | LEI Report 2016-018
Indicator Period 2 Period 1 Overall competitiveness O2 2008-2012 O1 2003-2007
Figure 4.7 Developments in competitiveness of 10 selected EU28 member states in decreasing order of turnover
4.4 Fruit and vegetables
4.4.1 Overview: EU Competitiveness weakened on economic indicators
Manufacture of fruit and vegetable products (C103) includes: • Processing and preserving of potatoes. • Manufacture of fruit and vegetable juice. • Other processing and preserving of fruit, nuts and vegetables consisting chiefly of fruit or
vegetables, except ready-made dishes in frozen or canned form. • Manufacture of jams, marmalades, table jellies, roasting of nuts, nut pastes. • Manufacture of perishable prepared foods of fruit and vegetables, such as peeled, mixed or
packaged salads; mixed salads, packaged (EC, 2008). The competitiveness performance of the EU28 weakened on the three economic indicators: they are all three weak. The Relative Trade Advantage (T) remained relatively strong and the export market share (M) indicator relatively weak. The position of the market share in period 2 was even weaker than the relative weak position in period 1. Australia improved the weak position to strong and is together with Brazil, which position weakened, the strongest of the 5 countries. The USA improved his position just slightly above average. Canada weakened from strong to weak: all indicators became weaker.
O1
O1
O1
O1
O1
O1
O1
O1
O1
O1
O2
O2
O2
O2
O2
O2
O2
O2
O2
O2
ES
FR
UK
DE
IT
DK
PL
NL
BE
IE
Weak average strongProcessing and preserving of fish, crustaceans and molluscs (C102)

LEI Report 2016-018 | 37
Category Indicator Period
2003-2007 2008-2012 Overall Overall competitiveness (Unweighted average) O1 O2 Economic Annual growth share added value in manufacture industry S1 S2 Annual growth rate labour productivity L1 L2 Annual growth rate real added value P1 P2 Trade Difference RTA indicator T1 T2 Difference world market share M1 M2
Figure 4.8 Developments in competitiveness of the EU28 and benchmark countries (Z-scores of presented countries)
4.4.2 Structure of the industry: EU small scaled and low growth
The EU28 fruit and vegetable industry is the largest in turnover, number of enterprises and employment of the selected regions. However, the average turnover per enterprise is the lowest: only 15% to 30% of the levels in the USA and Brazil. In addition, the growth of the turnover is the lowest in total as per enterprise. Brazil and Australia are the fastest growers. Fruit and vegetable processing has the fourth smallest share (6%), after fish, oil and cereals processing in the total food and beverages industry. The average turnover per enterprise is almost twice the level of the food and beverages.
O1
O1
O1
O1
O1
O2
O2
O2
O2
O2
S1
S1
S1
S1
S1
S2
S2
S2
S2
S2
T1
T1
T1
T1
T1
T2
T2
T2
T2
T2
M1
M1
M1
M1
M1
M2
M2
M2
M2
M2
L1
L1
L1
L1
L1
L2
L2
L2
L2
L2
P1
P1
P1
P1
P1
P2
P2
P2
P2
P2
EU28
US
Australia
Brazil
Canada
Weak average strong
Processing and preserving of fruit and vegetables (C103)

38 | LEI Report 2016-018
Table 4.5 Structure of the fruit and vegetable industry (C103) in 2012 and growth 2008-2012
Turnover
(€bn)
Growth in
turnover
(%)
Number of
enterprise
s
Growth in
enter-
prises (%)
Turnover
per
enterprise
(€m)
Growth in
turnover
per
enterprise
(%)
Persons
employed
(1,000)
Growth in
no. of
persons
employed
(%)
EU28 64 2.1 10,529 0.7 6.1 1.4 258,121 -1.1
USA 53 5.2 1,339 1.5 39.6 3.7 152,540 -2.3
Australia 5 11.1 536 1.1 8.4 9.9 14,971 4.4
Brazil 7 20.7 324 3.0 22.8 17.2 82,527 2.3
Canada 5 6.6 491 -0.9 9.8 7.6 20,107 -0.2
Sources: Based on Eurostat (EU), AUSSTATS (Australia), CANSIM (Canada), CENSUS (USA) and IBGE (Brazil).
4.4.3 Trade: EU28’s negative trade balance becomes smaller
The extra-EU trade (intra-EU trade is excluded), grew with 4.2% below the export at world level (5.3%): the EU28 market share on the world market declined. Australia is a fast grower. The EU import shares showed the opposite development: the imports grew at slower pace than the world imports (3.8%). These two developments still resulted in a negative trade balance. For USA, Brazil and Canada, the net trade balance deteriorated due to higher import growth compared to the export growth. As already indicated for others sectors the export of the EU28 (the sum of 28 member states) grew annually with 0.7% in the second period, below the level of 4.2% of the extra-EU trade. The external market gained importance.
Table 4.6 Trade in fruit and vegetable products (C103) in 2012 and growth 2008-2012
Export Import Trade
balance
(€m) Export
(€m)
Growth
(%)
Market
share (%)
Import
(€m)
Growth
(%)
Market
share (%)
EU28-int 27,003 0.7 37.4 29,970 -0.2 43.7 -2,968
EU28 5,739 4.2 7.9 10,103 -0.5 14.7 -4,363
USA 5,858 6.5 8.1 11,213 11.4 16.3 -5,354
Australia 1,041 22.7 1.4 1,066 7.4 1.6 -24
Brazil 2,155 3 3 808 8.6 1.2 1,347
Canada 3,036 1.9 4.2 2,421 7.6 3.5 616
Source: Calculations by LEI Wageningen UR based on UN Comtrade.
These trade developments are also reflected in the trade indicators. Brazil has the highest Relative Export Advantage (RXA), combined with lower Relative Import Advantage (RMA) indicators, resulting in high Relative net Trade Advantage (RTA) indicators. In the EU28 the imports are smaller than the exports, the RTA is rather stable, but negative. The developments in USA showed a negative development, with a negative RTA indicator in 2012 compared to positive in 2003.

LEI Report 2016-018 | 39
Figure 4.9 Trade indicators Source: Calculations by LEI Wageningen UR based on UN Comtrade data.
4.4.4 The EU member states: UK and Belgium strong
The presented 10 countries account for around 85% of the turnover, export and import. The competitiveness position of UK improved strongly on all indicators. This applies also for Belgium, although it lost export market share. Countries renowned for the exports of fresh vegetables and/or fruits like Spain and the Netherlands are weak in the second period, whereas they were strong in the first period.
Indicator Period 2 Period 1 Overall competitiveness O2 2008-2012 O1 2003-2007
Figure 4.10 Developments in competitiveness of 10 selected EU28 member states in decreasing order of turnover
-1.0 -0.5 0.0 0.5 1.0 1.5 2.0 2.5 3.0 3.5 4.0
RXARMARTARXA
RMARTARXA
RMARTARXA
RMARTARXA
RMARTA
CAN
BRA
AUS
USA
EU28
Trade indicators (Processing and preserving of fruit and vegetables)
2012 2007 2003
O1
O1
O1
O1
O1
O1
O1
O1
O1
O1
O2
O2
O2
O2
O2
O2
O2
O2
O2
O2
DE
IT
UK
ES
FR
NL
BE
PL
DK
IE
Weak average strongProcessing and preserving of fruit and vegetables (C103)

40 | LEI Report 2016-018
4.5 Vegetable and animal oils and fats
4.5.1 Overview: EU Competitiveness below average
Manufacture of vegetable and animal oils and fats (C104) includes the processing of crude and refined oils and fats from vegetable or animal materials, except rendering or refining of lard and other edible animal fats (EC, 2008). The competitiveness performance of the EU28 weakened slightly on the all indicators except for the world-market export share that improved considerable. Together with the Relative Trade Advantage (T) these remained above average. Australia improved the weak position to strong and is after Canada the strongest of the 5 countries. However, both countries have a small turnover of €1bn viz. €5bn or 2 and 10% of the EU28 level. USA scored weak on all indicators in the second period: its position changed from strong to weak. Brazil improved its position but remained weak.
Category Indicator Period 2003-2007 2008-2012
Overall Overall competitiveness (Unweighted average) O1 O2 Economic Annual growth share added value in manufacture industry S1 S2 Annual growth rate labour productivity L1 L2 Annual growth rate real added value P1 P2 Trade Difference RTA indicator T1 T2 Difference world market share M1 M2
Figure 4.11 Developments in competitiveness of the EU28 and benchmark countries (Z-scores of presented countries)
O1
O1
O1
O1
O1
O2
O2
O2
O2
O2
S1
S1
S1
S1
S1
S2
S2
S2
S2
S2
T1
T1
T1
T1
T1
T2
T2
T2
T2
T2
M1
M1
M1
M1
M1
M2
M2
M2
M2
M2
L1
L1
L1
L1
L1
L2
L2
L2
L2
L2
P1
P1
P1
P1
P1
P2
P2
P2
P2
P2
EU28
US
Australia
Brazil
Canada
Weak average strongManufacture of vegetable and animal oils and fats (C104)

LEI Report 2016-018 | 41
4.5.2 Structure of the industry: EU has largest turnover and is small scaled
The EU28 edible oil manufacturing is the largest in turnover of all countries: twice the level of Brazil and larger than the total of the benchmark countries. The EU also outnumbers the number of enterprises and employment. However, the average turnover per enterprise is among the lowest: only 3% of the level in Brazil and 5% of the USA. The EU growth of the turnover (3.3%) is in the range of the second largest producer Brazil (3.6%) and far above the USA (-1.1%). Canada is the fastest grower, but the turnover of the industry is a mere 10% of the EU level. Edible oil processing has a small share (5%) in the total EU and is smaller than the fruit and vegetable processing. The average turnover per enterprise is almost twice the level of the overall food and beverages enterprises.
Table 4.7 Structure of the edible oil industry (C104) in 2012 and growth 2008-2012
Turnover
(€bn)
Growth
turnover
(%)
Number of
enterprise
s
Growth
enter-
prises (%)
Turnover
per enter-
prise (€m)
Growth
turnover
per enter-
prise (%)
Persons
employed
(1,000)
Growth
persons
employed
(%)
EU28 55 3.3 8,070 -2.5 6.8 6.0 60,359 0.9
USA 12 -1.1 90 4.7 138.1 -5.5 10,104 3.2
Australia 1 -1.0 221 -3.2 6.0 2.3 1,447 -5.8
Brazil 23 3.6 95 -2.0 243.0 5.7 45,982 6.3
Canada 5 9.8 66 0.0 76.6 9.8 3,064 7.8
Sources: Based on Eurostat (EU), AUSSTATS (Australia), CANSIM (Canada), CENSUS (USA) and IBGE (Brazil).
* Number of enterprises in 2012 is the level of 2010 for Canada
4.5.3 Trade: EU28 is net importer and has largest world market shares
The extra-EU trade (intra-EU trade is excluded), grew with 8% faster than the export growth in the large producing countries: Canadian export grew in double digits. The EU28 market share on the world market grew: the world export grew at a slower pace (4.9%) than the EU export growth. The import share showed the opposite development. These two developments resulted still in a negative trade balance. As already indicated for others sectors the export of the EU28 (the sum of 28 member states) grew annually by 1.8% in the second period, below the level of 6.7% of the extra-EU trade. The external market gained importance.
Table 4.8 Trade in oil products (C104) in 2012 and growth 2008-2012
Export Import Trade
balance
(€m) Export
(€m)
Growth
(%)
Market
share (%)
Import
(€m)
Growth
(%)
Market
share (%)
EU28-int 24,686 2.1 23.1 36,996 0.5 37.5 -12,310
EU28 5,213 8.0 4.9 18,358 0.2 18.6 -13,144
USA 6,356 2.4 5.9 5,656 5.5 5.7 699
Australia 511 3.5 0.5 721 4.9 0.7 -210
Brazil 7,110 5.6 6.7 747 5.3 0.8 6,363
Canada 4,004 17.2 3.7 1,220 2.3 1.2 2,783
Source: Calculations by LEI Wageningen UR based on UN Comtrade.
The trade indicators reflected these trade developments. Brazil has the highest Relative Export Advantage (RXA), combined with lower Relative Import Advantage (RMA) indicators, resulting in high Relative net Trade Advantage (RTA) indicators. In the EU28 and Australia, the imports are larger than the exports: the RTA is declining. The RTA indicator of the USA declined, but remained positive.

42 | LEI Report 2016-018
Figure 4.12 Trade indicators Source: Calculations by LEI Wageningen UR based on UN Comtrade data.
4.5.4 The EU member states: UK weakest and France strong
The presented 10 countries account for around 90% of the turnover and round 85% of the export and import. Ireland is the strongest but its turnover is very small below 1% of EU total. The position of Spain (the largest manufacturer) improved, whereas France (the third largest) remained strong but lost strength. The UK is the weakest, followed by the Netherlands, which has the second largest turnover. Poland’s position deteriorated considerably, due to weak economic indicators in the second period.
Figure 4.13 Developments in competitiveness of 10 selected EU28 member states in decreasing order of turnover
Indicator Period 2 Period 1 Overall competitiveness O2 2008-2012 O1 2003-2007
-1.0 -0.5 0.0 0.5 1.0 1.5 2.0 2.5 3.0 3.5 4.0 4.5 5.0 5.5 6.0 6.5 7.0 7.5 8.0 8.5 9.0 9.5 10.0
RXARMARTARXA
RMARTARXA
RMARTARXA
RMARTARXA
RMARTA
CAN
BRA
AUS
USA
EU28
_ext
Trade indicators (Manufacture of vegetable and animal oils and fats)
Series4 2012 2007 2003
O1
O1
O1
O1
O1
O1
O1
O1
O1
O1
O2
O2
O2
O2
O2
O2
O2
O2
O2
O2
ES
NL
FR
DE
IT
BE
PL
UK
DK
IE
Weak average strongManufacture of vegetable and animal oils and fats (C104)

LEI Report 2016-018 | 43
4.6 Dairy
4.6.1 Overview: EU Competitiveness above average
Manufacture of dairy (C105) includes the processing of all products based on milk (e.g. liquid or dried milk, yoghurts, butter, cheese, lactose) including all edible ice creams (e.g. sorbets) but excludes the production of raw milk and retail activities (EC, 2008). The competitiveness performance of the EU28 strengthened strongly on the trade indicators and the share in the manufacturing industry. Overall, the position changed from weak to above average. The USA showed improvement on all indicators and is slightly stronger than the EU. The other 3 countries have a turnover of round 10% of the EU level. Especially Brazil’s competitiveness lost significantly on all indicators and hence overall.
Category Indicator Period
2003-2007 2008-2012 Overall Overall competitiveness (Unweighted average) O1 O2 Economic Annual growth share added value in manufacture industry S1 S2 Annual growth rate labour productivity L1 L2 Annual growth rate real added value P1 P2 Trade Difference RTA indicator T1 T2 Difference world market share M1 M2
Figure 4.14 Developments in competitiveness of the EU28 and benchmark countries (Z-scores of presented countries)
O1
O1
O1
O1
O1
O2
O2
O2
O2
O2
S1
S1
S1
S1
S1
S2
S2
S2
S2
S2
T1
T1
T1
T1
T1
T2
T2
T2
T2
T2
M1
M1
M1
M1
M1
M2
M2
M2
M2
M2
L1
L1
L1
L1
L1
L2
L2
L2
L2
L2
P1
P1
P1
P1
P1
P2
P2
P2
P2
P2
EU28
US
Australia
Brazil
Canada
Weak average strongManufacture of dairy products (C105)

44 | LEI Report 2016-018
4.6.2 Structure of the industry: EU has largest turnover but insignificant growth
The EU28 dairy manufacturing is the largest in turnover: 165% of the USA level, whereas the other three countries are rather small in turnover. Australia showed the strongest growth in turnover, but also the other countries grew fast compared to the EU. The EU grew with a mere 0.8%, which is the impact of the dairy quota system. The EU outnumbers also the number of enterprises and employment of the selected regions. However, the average turnover per enterprise is the lowest: only 15% of the USA level. Dairy processing is with a share of 13.3% the fourth largest sector in turnover.
Table 4.9 Structure of the dairy industry (C105) in 2012 and growth 2008-2012
Turnover
(€bn)
Growth in
turnover
(%)
Number of
enterprises
Growth in
enter-
prises (%)
Turnover
per
enterprise
(€m)
Growth in
turnover
per
enterprise
(%)
Persons
employed
(1,000)
Growth in
no. of
persons
employed
(%)
EU28 140 0.8 11,988 0.0 11.7 0.8 364,772 -0.5
USA 85 6.2 1,093 0.5 77.6 5.7 133,670 0.3
Australia 11 10.4 399 3.0 27.1 7.1 17,552 -0.8
Brazil 15 6.5 629 4.4 23.7 2.0 98,555 0.8
Canada 11 7.1 737 -11.3 14.3 20.7 25,280 3.9
Sources: Based on Eurostat (EU), AUSSTATS (Australia), CANSIM (Canada), CENSUS (USA) and IBGE (Brazil).
4.6.3 Trade: EU28 net exporter and largest world market share
The extra-EU trade (intra-EU trade is excluded), grew with 5.1% slightly below the level of the USA. The EU was by far the largest exporter: three times the level of the USA. Also the trade balance is the largest. Australia has a significant positive trade balance (round 15% of the EU’s and 75% of the USA’s) relative to the turnover Brazil and Canada are small traders on the world market with a small negative trade balance. The EU28 market share on the world market grew as the world export grew at a slower pace (2.1%) than the EU export growth. The import share showed an opposite development: negative import growths by the EU, whereas the world imports grew with 0.7%. These two developments resulted in a growing positive trade balance.
Table 4.10 Trade in dairy products (C105) in 2012 and growth 2008-2012
Export Import Trade
balance
(€m) Export
(€m)
Growth
(%)
Market
share (%)
Import
(€m)
Growth
(%)
Market
share (%)
EU28-int 37,716 0.7 64.8 29,494 -0.3 57.0 8,222
EU28 8,969 5.1 15.4 670 -9.1 1.3 8,299
USA 3,020 6.1 5.2 1,368 0.5 2.6 1,652
Australia 1,747 0.1 3.0 505 3.4 1.0 1,242
Brazil 72 -34.7 0.1 499 30.4 1.0 -427
Canada 199 0.3 0.3 339 -0.7 0.7 -140
Source: Calculations by LEI Wageningen UR based on UN Comtrade.
These trade developments are also reflected in the trade indicators. In the EU28 the imports are significant smaller than the exports, the RTA is slightly improving. The developments in Australia showed a negative development, with a relatively high RTA indicator in 2003 compared to the level in 2012: the RTA remained the highest. Brazil has fluctuating trade indicators.

LEI Report 2016-018 | 45
Figure 4.15 Trade indicators Source: Calculations by LEI Wageningen UR based on UN Comtrade data.
4.6.4 The EU member states: large producers strong except Germany
The presented 9 countries account for around 83% of the turnover and round 81% of the export and import. Denmark is not included due to insufficient data. Italy is the strongest closely followed by France and the UK. All the three countries showed an improvement in the competitiveness of which Italy the strongest. Italy was on almost all indicators the strongest in period 2. Germany, the second largest country in turn over improved its position on almost all indicators and most significantly on the world market share. Poland’s position deteriorated considerable, due to weak indicators except the world market share in the second period. A direct correlation with the feed industry is not possible, because the feed industry supplies the producers (farmers) of meat, fish as well as dairy with inputs.
Denmark not included due to insufficient data
Figure 4.16 Developments in competitiveness of 10 selected EU28 member states in decreasing order of turnover
Indicator Period 2 Period 1 Overall competitiveness O2 2008-2012 O1 2003-2007
O1
O1
O1
O1
O1
O1
O1
O1
O1
O2
O2
O2
O2
O2
O2
O2
O2
O2
FR
DE
IT
UK
ES
NL
PL
BE
IE
Weak average strongManufacture of dairy products (C105)
-1.0 -0.5 0.0 0.5 1.0 1.5 2.0 2.5 3.0 3.5 4.0 4.5
RXARMARTARXA
RMARTARXA
RMARTARXA
RMARTARXA
RMARTA
CAN
BRA
AUS
USA
EU28
_ext
Trade indicators (Manufacture of dairy products)
2012 2007 2003

46 | LEI Report 2016-018
4.7 ‘Cereals’ products
4.7.1 Overview: EU Competitiveness remained weak
Manufacture of grain mill products, starches and starch products - in short ‘cereals’ (C106) - includes the milling of flour or meal from grains or vegetables, the milling, cleaning and polishing of rice, as well as the manufacture of flour mixes or doughs from these products. Also included in this group are the wet milling of corn and vegetables and the manufacture of starch and starch products (EC, 2008). This sector produces in fact the raw materials for the bakery sector (C107). The competitiveness performance of the EU28 remained weak. All indicators are weak in the second period. The USA, with the largest turnover for this sector improved its position and Brazil remained the strongest, slightly weaker than in the first period. Australia improved the weak position to strong and Canada became the weakest whereas it was the strongest in the first period.
Category Indicator Period 2003-2007 2008-2012
Overall Overall competitiveness (Unweighted average) O1 O2 Economic Annual growth share added value in manufacture industry S1 S2 Annual growth rate labour productivity L1 L2 Annual growth rate real added value P1 P2 Trade Difference RTA indicator T1 T2 Difference world market share M1 M2
Figure 4.17 Developments in competitiveness of the EU28 and benchmark countries (Z-scores of presented countries)
O1
O1
O1
O1
O1
O2
O2
O2
O2
O2
S1
S1
S1
S1
S1
S2
S2
S2
S2
S2
T1
T1
T1
T1
T1
T2
T2
T2
T2
T2
M1
M1
M1
M1
M1
M2
M2
M2
M2
M2
L1
L1
L1
L1
L1
L2
L2
L2
L2
L2
P1
P1
P1
P1
P1
P2
P2
P2
P2
P2
EU28
US
Australia
Brazil
Canada
Weak average strongManufacture of grain mill products, starches and starch products (C106)

LEI Report 2016-018 | 47
4.7.2 Structure of the industry: EU small turnover
The EU28 cereal manufacturing is one of the sectors whose total turnover is not the largest of all countries. The USA’s turnover is 50% higher. In employees the Brazilian sector is larger, despite that the turnover is round 40% of the EU. The absence of growth of the turnover in EU is quite below the levels of Australia and Brazil (12-13%). Cereals processing has a small share (4%) in the total EU food and beverages manufacturing and is after fish the smallest sector. The average turnover per enterprise is almost twice the level of the overall food and beverages enterprises.
Table 4.11 Structure of the ‘cereal’ industry (C106) in 2012 and growth 2008-2012
Turnover
(€bn)
Growth in
turnover
(%)
Number of
enterprise
s
Growth in
enterprise
s (%)
Turnover
per
enterprise
(mn€)
Growth
turnover
per
enterprise
(%)
Persons
employed
(1,000)
Growth in
no. of
persons
employed
(%)
EU28 45 0.0 6,026 -4.1 7.5 4.3 106,791 -2.0
USA 77 4.6 461 -0.7 166.8 5.4 52,955 -0.2
Australia 4 12.8 316 0.6 14.2 12.1 9,207 1.2
Brazil 17 12.2 621 3.4 27.5 8.5 112,390 7.6
Canada 1 -15.3 140 0.2 6.5 -15.5 3,469 -4.8
Sources: Based on Eurostat (EU), AUSSTATS (Australia), CANSIM (Canada), CENSUS (USA) and IBGE (Brazil).
* Number of enterprises in 2012 is the level of 2010 for Canada
4.7.3 Trade: EU28 largest exporter and strong trade balance
The extra-EU trade (intra-EU trade is excluded), grew round 2% at a slower pace than the world exports (4.7%). USA’s export grew far above the world market level. The imports by the EU grew at higher space than the world import (3.4%) The majority of trade is intra-EU trade, but a significant share of the exports is to third countries. The trade balance of the EU is positive, despite its loss of share on the world export market and growth of the imports.
Table 4.12 Trade in ‘cereals’ products (C106) in 2012 and growth 2008-2012
Export Import Trade
balance
(€m) Export
(€m)
Growth
(%)
Market
share (%)
Import
(€m)
Growth
(%)
Market
share (%)
EU28-int 7,935 2.1 34.8 6,618 2.7 31.0 1,317
EU28 2,857 1.9 12.5 897 5.1 4.2 1,961
USA 3,481 9.5 15.3 1,336 5.2 6.3 2,145
Australia 715 2.3 3.1 107 2.3 0.5 608
Brazil 92 -5.2 0.4 676 0.2 3.2 -584
Canada 803 2.2 3.5 532 6.0 2.5 272
Source: Calculations by LEI Wageningen UR based on UN Comtrade.
The Relative Import Advantage (RMA) is rather high in Brazil, resulting also in negative Relative net Trade Advantage (RTA) indicators. In the EU28 the imports are smaller than the exports, the RTA is positive with little fluctuation. The developments in the Australia showed a positive development, with increasing RXA and RTA indicators.

48 | LEI Report 2016-018
Figure 4.18 Trade indicators Source: Calculations by LEI Wageningen UR based on UN Comtrade data.
4.7.4 EU member states: diverse developments in competitiveness
The presented 10 countries account for round 81 to 85% of the turnover, of the export and of the import of the total EU. Of largest countries, Germany and France are strong, whereas UK and Italy are on the weak side; both lost position. The developments in Belgium and the Netherlands showed strong fluctuation in value added, for that reason the data of other years - in line with the trend - are used.
Indicator Period 2 Period 1 Overall competitiveness O2 2008-2012 O1 2003-2007
Figure 4.19 Developments in competitiveness of 10 selected EU28 member states in decreasing order of turnover
-3.0 -2.5 -2.0 -1.5 -1.0 -0.5 0.0 0.5 1.0 1.5 2.0 2.5 3.0 3.5 4.0
RXARMARTARXA
RMARTARXA
RMARTARXA
RMARTARXA
RMARTA
CAN
BRA
AUS
USA
EU28
Trade indicators (Manufacture of grain mill products, starches and starch products)
2012 2007 2003
O1
O1
O1
O1
O1
O1
O1
O1
O1
O1
O2
O2
O2
O2
O2
O2
O2
O2
O2
O2
UK
FR
DE
IT
BE
ES
NL
PL
DK
IE
Weak average strongManufacture of grain mill products, starches and starch products (C106)

LEI Report 2016-018 | 49
4.8 ‘Bakery’ products
4.8.1 Overview: EU Competitiveness weak but fair trade performance
Manufacture of bakery and farinaceous products (C107) includes the production of bakery products, macaroni, noodles and similar products (EC, 2008). The competitiveness performance of the EU28 is below average but improved strongly on the trade indicators (M and T), but weakened on all economic indicators. The USA improved his position but remained weaker than the EU. Brazil switched from the strongest to the weakest position: in the second period weak on all indicators except the growth of the value added. Australia improved the weak position to the strongest position mainly on economic indicators.
Category Indicator Period
2003-2007 2008-2012 Overall Overall competitiveness (Unweighted average) O1 O2 Economic Annual growth share added value in manufacture industry S1 S2 Annual growth rate labour productivity L1 L2 Annual growth rate real added value P1 P2 Trade Difference RTA indicator T1 T2 Difference world market share M1 M2
Figure 4.20 Developments in competitiveness of the EU28 and benchmark countries (Z-scores of presented countries)
4.8.2 Structure of the industry: EU many small scaled enterprises
The EU28 bakery manufacturing is the fifth largest sector in turnover (share 11%) and has the highest share in the number of enterprises (54%) in total of food and beverages sector. The growth of the
O1
O1
O1
O1
O1
O2
O2
O2
O2
O2
S1
S1
S1
S1
S1
S2
S2
S2
S2
S2
T1
T1
T1
T1
T1
T2
T2
T2
T2
T2
M1
M1
M1
M1
M1
M2
M2
M2
M2
M2
L1
L1
L1
L1
L1
L2
L2
L2
L2
L2
P1
P1
P1
P1
P1
P2
P2
P2
P2
P2
EU28
US
Australia
Brazil
Canada
Weak average strongManufacture of bakery and farinaceous products (C107)
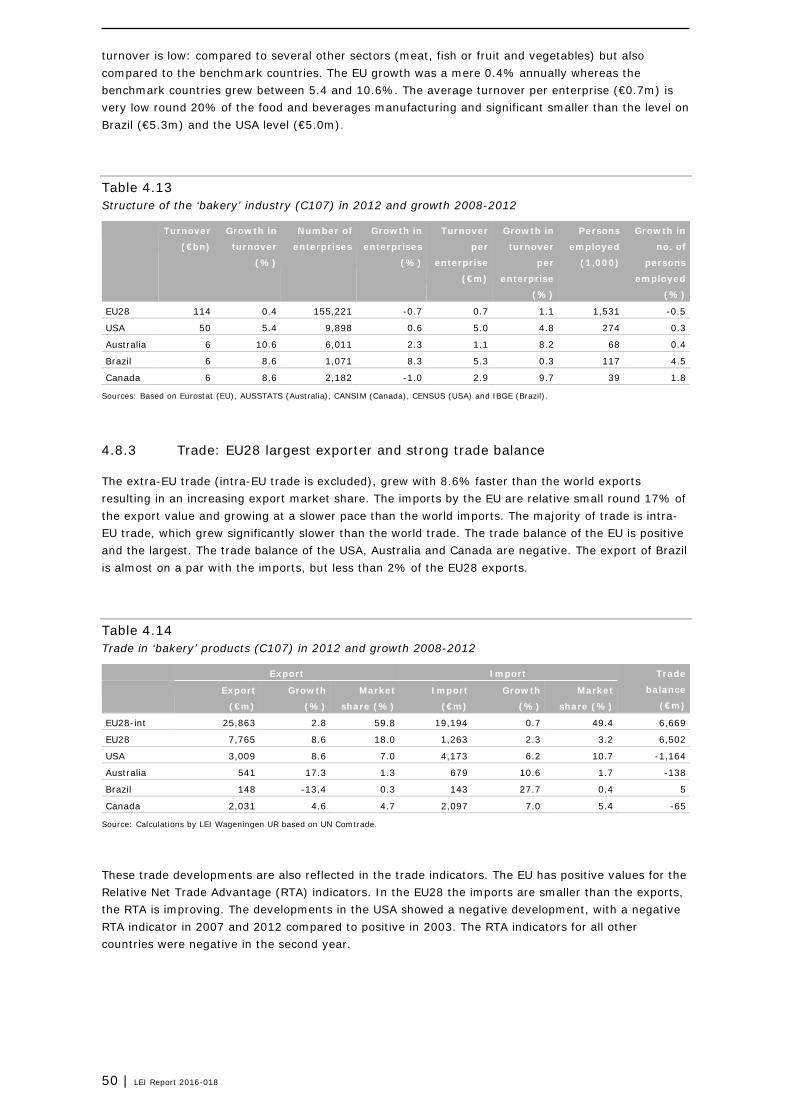
50 | LEI Report 2016-018
turnover is low: compared to several other sectors (meat, fish or fruit and vegetables) but also compared to the benchmark countries. The EU growth was a mere 0.4% annually whereas the benchmark countries grew between 5.4 and 10.6%. The average turnover per enterprise (€0.7m) is very low round 20% of the food and beverages manufacturing and significant smaller than the level on Brazil (€5.3m) and the USA level (€5.0m).
Table 4.13 Structure of the ‘bakery’ industry (C107) in 2012 and growth 2008-2012
Turnover
(€bn)
Growth in
turnover
(%)
Number of
enterprises
Growth in
enterprises
(%)
Turnover
per
enterprise
(€m)
Growth in
turnover
per
enterprise
(%)
Persons
employed
(1,000)
Growth in
no. of
persons
employed
(%)
EU28 114 0.4 155,221 -0.7 0.7 1.1 1,531 -0.5
USA 50 5.4 9,898 0.6 5.0 4.8 274 0.3
Australia 6 10.6 6,011 2.3 1.1 8.2 68 0.4
Brazil 6 8.6 1,071 8.3 5.3 0.3 117 4.5
Canada 6 8.6 2,182 -1.0 2.9 9.7 39 1.8
Sources: Based on Eurostat (EU), AUSSTATS (Australia), CANSIM (Canada), CENSUS (USA) and IBGE (Brazil).
4.8.3 Trade: EU28 largest exporter and strong trade balance
The extra-EU trade (intra-EU trade is excluded), grew with 8.6% faster than the world exports resulting in an increasing export market share. The imports by the EU are relative small round 17% of the export value and growing at a slower pace than the world imports. The majority of trade is intra-EU trade, which grew significantly slower than the world trade. The trade balance of the EU is positive and the largest. The trade balance of the USA, Australia and Canada are negative. The export of Brazil is almost on a par with the imports, but less than 2% of the EU28 exports.
Table 4.14 Trade in ‘bakery’ products (C107) in 2012 and growth 2008-2012
Export Import Trade
balance
(€m) Export
(€m)
Growth
(%)
Market
share (%)
Import
(€m)
Growth
(%)
Market
share (%)
EU28-int 25,863 2.8 59.8 19,194 0.7 49.4 6,669
EU28 7,765 8.6 18.0 1,263 2.3 3.2 6,502
USA 3,009 8.6 7.0 4,173 6.2 10.7 -1,164
Australia 541 17.3 1.3 679 10.6 1.7 -138
Brazil 148 -13.4 0.3 143 27.7 0.4 5
Canada 2,031 4.6 4.7 2,097 7.0 5.4 -65
Source: Calculations by LEI Wageningen UR based on UN Comtrade.
These trade developments are also reflected in the trade indicators. The EU has positive values for the Relative Net Trade Advantage (RTA) indicators. In the EU28 the imports are smaller than the exports, the RTA is improving. The developments in the USA showed a negative development, with a negative RTA indicator in 2007 and 2012 compared to positive in 2003. The RTA indicators for all other countries were negative in the second year.

LEI Report 2016-018 | 51
Figure 4.21 Trade indicators Source: Calculations by LEI Wageningen UR based on UN Comtrade data.
4.8.4 EU: France, Belgium and Netherlands strong, UK and Ireland weak
The presented 10 countries account for around 78 to 85% of the turnover, of the export and of the import of the total EU. France is rather strong due to strong economic indicators, Belgium and the Netherlands have strong trade indicators. UK and Ireland are weak on almost all indicators. Especially Ireland weakened strongly on all indicators.
Indicator Period Period Overall competitiveness O2 2008-2012 O1 2003-2007
Figure 4.22 Developments in competitiveness of 10 selected EU28 member states in decreasing order of turnover
-1.0 -0.5 0.0 0.5 1.0 1.5 2.0 2.5
RXA
RMA
RTA
RXA
RMA
RTA
RXA
RMA
RTA
RXA
RMA
RTA
RXA
RMA
RTA
CAN
BRA
AUS
USA
EU28
Trade indicators (Manufacture of bakery and farinaceous products)
2012 2007 2003
O1
O1
O1
O1
O1
O1
O1
O1
O1
O1
O2
O2
O2
O2
O2
O2
O2
O2
O2
O2
DE
FR
IT
UK
ES
PL
NL
BE
DK
IE
Weak average strongManufacture of bakery and farinaceous products (C107)

52 | LEI Report 2016-018
4.9 ‘Other food’ products
4.9.1 Overview: Brazil strongest and all others weak
Manufacture of other food products (C108) includes the production of sugar and confectionery, prepared meals and dishes, coffee, tea and spices, as well as perishable and specialty food products. This class is quite diverse and counts seven subclasses (EC, 2008). In the next sections, we discuss some of the subclasses. The competitiveness performance of the EU28 was below average in period 1 and weakened in period 2 on all indicators. Brazil is by far the strongest based on an improvement of all indicators. All other countries are below average: only the USA improved its position but remained weak.
Category Indicator Period
2003-2007 2008-2012 Overall Overall competitiveness (Unweighted average) O1 O2 Economic Annual growth share added value in manufacture industry S1 S2 Annual growth rate labour productivity L1 L2 Annual growth rate real added value P1 P2 Trade Difference RTA indicator T1 T2 Difference world market share M1 M2
Figure 4.23 Developments in competitiveness of the EU28 and benchmark countries (Z-scores of presented countries)
O1
O1
O1
O1
O1
O2
O2
O2
O2
O2
S1
S1
S1
S1
S1
S2
S2
S2
S2
S2
T1
T1
T1
T1
T1
T2
T2
T2
T2
T2
M1
M1
M1
M1
M1
M2
M2
M2
M2
M2
L1
L1
L1
L1
L1
L2
L2
L2
L2
L2
P1
P1
P1
P1
P1
P2
P2
P2
P2
P2
EU28
US
Australia
Brazil
Canada
Weak average strongManufacture of other food products (C108)
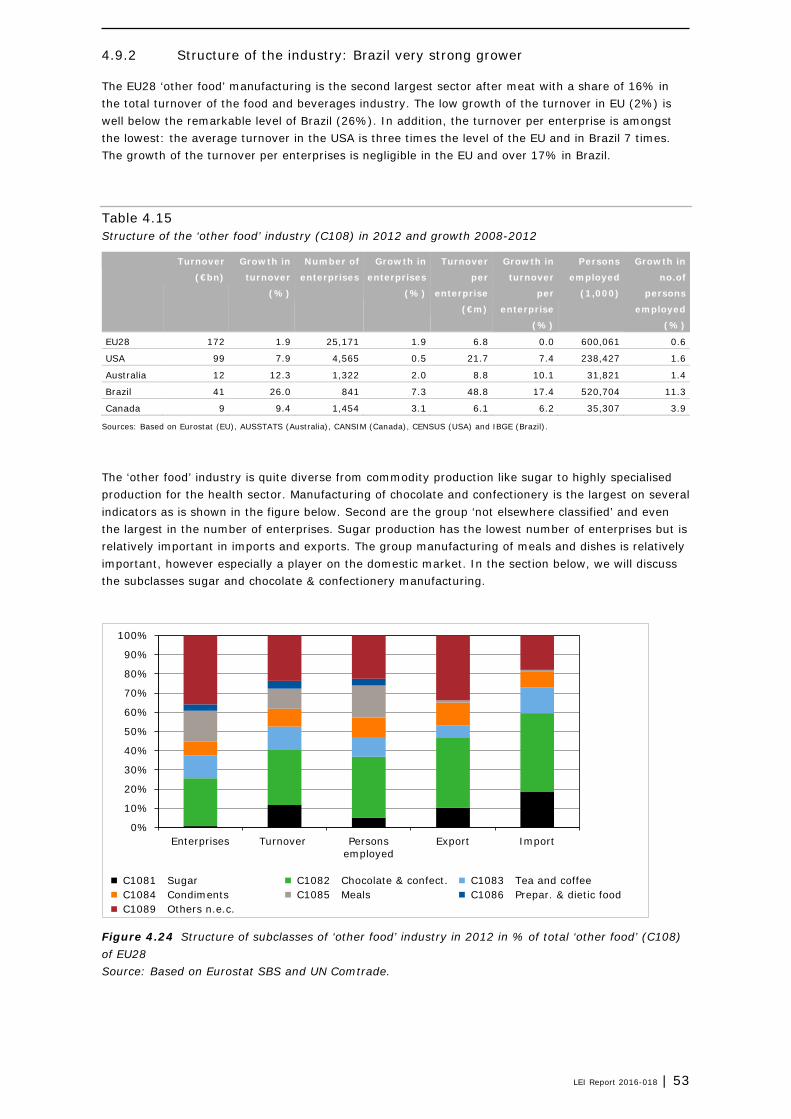
LEI Report 2016-018 | 53
4.9.2 Structure of the industry: Brazil very strong grower
The EU28 ‘other food’ manufacturing is the second largest sector after meat with a share of 16% in the total turnover of the food and beverages industry. The low growth of the turnover in EU (2%) is well below the remarkable level of Brazil (26%). In addition, the turnover per enterprise is amongst the lowest: the average turnover in the USA is three times the level of the EU and in Brazil 7 times. The growth of the turnover per enterprises is negligible in the EU and over 17% in Brazil.
Table 4.15 Structure of the ‘other food’ industry (C108) in 2012 and growth 2008-2012
Turnover
(€bn)
Growth in
turnover
(%)
Number of
enterprises
Growth in
enterprises
(%)
Turnover
per
enterprise
(€m)
Growth in
turnover
per
enterprise
(%)
Persons
employed
(1,000)
Growth in
no.of
persons
employed
(%)
EU28 172 1.9 25,171 1.9 6.8 0.0 600,061 0.6
USA 99 7.9 4,565 0.5 21.7 7.4 238,427 1.6
Australia 12 12.3 1,322 2.0 8.8 10.1 31,821 1.4
Brazil 41 26.0 841 7.3 48.8 17.4 520,704 11.3
Canada 9 9.4 1,454 3.1 6.1 6.2 35,307 3.9
Sources: Based on Eurostat (EU), AUSSTATS (Australia), CANSIM (Canada), CENSUS (USA) and IBGE (Brazil).
The ‘other food’ industry is quite diverse from commodity production like sugar to highly specialised production for the health sector. Manufacturing of chocolate and confectionery is the largest on several indicators as is shown in the figure below. Second are the group ‘not elsewhere classified’ and even the largest in the number of enterprises. Sugar production has the lowest number of enterprises but is relatively important in imports and exports. The group manufacturing of meals and dishes is relatively important, however especially a player on the domestic market. In the section below, we will discuss the subclasses sugar and chocolate & confectionery manufacturing.
Figure 4.24 Structure of subclasses of ‘other food’ industry in 2012 in % of total ‘other food’ (C108) of EU28 Source: Based on Eurostat SBS and UN Comtrade.
0%
10%
20%
30%
40%
50%
60%
70%
80%
90%
100%
Enterprises Turnover Personsemployed
Export Import
C1081 Sugar C1082 Chocolate & confect. C1083 Tea and coffee C1084 Condiments C1085 Meals C1086 Prepar. & dietic food C1089 Others n.e.c.

54 | LEI Report 2016-018
4.9.3 Trade: EU28 slightly above the trade levels of USA and Brazil
The EU28 market shares on the world market declined as the import and export growth were below the world market levels. The imports by the EU grew at a slower pace than the exports: the positive trade balance in 2012 was half the level of 2007 (€708m). Brazil doubled its positive trade balance in that period: the country realised high export and import growth in line with the high growth of the turnover. The trade balance of the other countries remained negative.
Table 4.16 Trade in ‘other food’ products (C108) in 2012 and growth 2008-2012
Export Import Trade
balance
(€m) Export
(€m)
Growth
(%)
Market
share (%)
Import
(€m)
Growth
(%)
Market
share (%)
EU28-int 53,751 4.4 43.3 52,196 2.6 43.9 1,554
EU28 14,858 6.1 12.0 14,543 5.0 12.2 314
USA 9,867 11.2 8.0 11,669 8.4 9.8 -1,802
Australia 733 7.2 0.6 2,407 11.5 2.0 -1,674
Brazil 11,297 18.9 9.1 766 16.0 0.6 10,531
Canada 3,278 6.6 2.6 4,510 7.6 3.8 -1,231
Source: Calculations by LEI Wageningen UR based on UN Comtrade.
In the EU28 the imports are almost equal to the exports, the RTA is round zero. Brazil has the highest Relative Advantage (RXA), combined with the low Relative Import Advantage (RMA) indicators, resulting in high Relative net Trade Advantage (RTA) indicators. The developments in Australia and Canada showed a negative development, with growing negative RTA indicators.
Figure 4.25 Trade indicators Source: Calculations by LEI Wageningen UR based on UN Comtrade data.
-1.5 -1.0 -0.5 0.0 0.5 1.0 1.5 2.0 2.5 3.0 3.5 4.0 4.5 5.0 5.5 6.0 6.5
RXA
RMA
RTA
RXA
RMA
RTA
RXA
RMA
RTA
RXA
RMA
RTA
RXA
RMA
RTA
CAN
BRA
AUS
USA
EU28
Trade indicators (Manufacture of other food products)
2012 2007 2003

LEI Report 2016-018 | 55
4.9.4 EU member states: largest countries in turnover also strongest
The presented 10 countries account for around 78 to 89% of the turnover, of the export and of the import of the total EU. The countries with the largest turnover - Germany, France and the UK - scored below average. Italy remained strong. The Netherlands has the strongest competitiveness position. In addition, Ireland and Spain with a turnover near to the Dutch level remained respectively became above average.
Indicator Period Period Overall competitiveness O2 2008-2012 O1 2003-2007
Figure 4.26 Developments in competitiveness of 10 selected EU28 member states in decreasing order of turnover
4.9.5 Large-scale sugar manufacturing: Brazil largest and most competitive
This subindustry (C1081) includes manufacturing or refining of sugar (sucrose), sugar products and sugar substitutes from the juice of cane, beet, maple and palm (EC, 2008). This class excludes manufacture of glucose, glucose syrup, maltose that is part of cereals manufacturing (C106). This industry is rather large-scaled: the average turnover per enterprise is above €90m compared to €3.7 m for the food and beverages industry as a whole or the €6.8m of the subindustry ‘other food’. In addition, the turnover growth per enterprise is with 14% above the average of the food industry as well as of the subindustry ‘other food’. With a total turnover of €15bn the sector is rather small with a share of 1.4% in the turnover of the food and beverages industry. The competitiveness performance of the EU28 remained weak. Almost all indicators are weak in the second period, except for the growth of the labour productivity (L). All economic indicators weakened and the trade indicators improved. Brazil with the largest turnover for this sector (24 bn€) improved his position and remained the strongest. USA (turnover €8bn) improved but the position remained weak. Australia (€2bn turnover) and Canada (€1bn) are small players. Within the EU, the sugar industry in France (turnover €4.5bn) and Germany (€4.1bn) are considerable larger than in these two benchmark countries.
O1
O1
O1
O1
O1
O1
O1
O1
O1
O1
O2
O2
O2
O2
O2
O2
O2
O2
O2
O2
DE
FR
UK
IT
NL
IE
ES
BE
PL
DK
Weak average strongManufacture of other food products (C108)
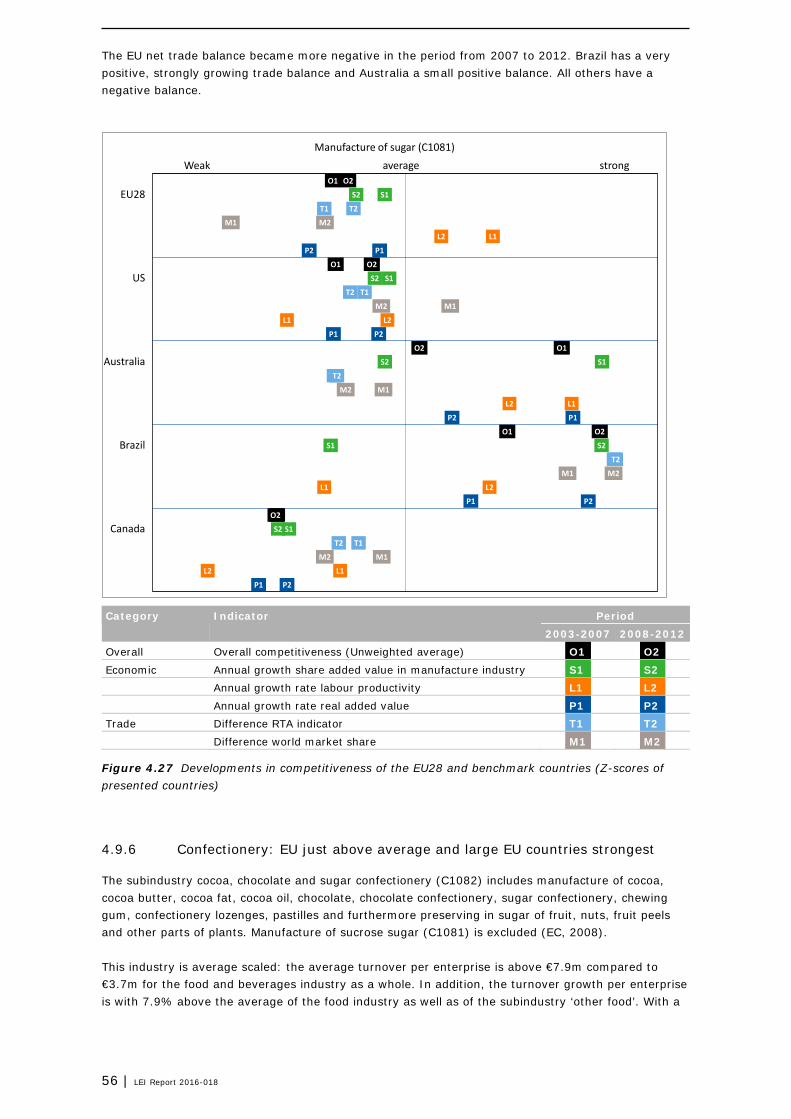
56 | LEI Report 2016-018
The EU net trade balance became more negative in the period from 2007 to 2012. Brazil has a very positive, strongly growing trade balance and Australia a small positive balance. All others have a negative balance.
Category Indicator Period
2003-2007 2008-2012 Overall Overall competitiveness (Unweighted average) O1 O2 Economic Annual growth share added value in manufacture industry S1 S2 Annual growth rate labour productivity L1 L2 Annual growth rate real added value P1 P2 Trade Difference RTA indicator T1 T2 Difference world market share M1 M2
Figure 4.27 Developments in competitiveness of the EU28 and benchmark countries (Z-scores of presented countries)
4.9.6 Confectionery: EU just above average and large EU countries strongest
The subindustry cocoa, chocolate and sugar confectionery (C1082) includes manufacture of cocoa, cocoa butter, cocoa fat, cocoa oil, chocolate, chocolate confectionery, sugar confectionery, chewing gum, confectionery lozenges, pastilles and furthermore preserving in sugar of fruit, nuts, fruit peels and other parts of plants. Manufacture of sucrose sugar (C1081) is excluded (EC, 2008). This industry is average scaled: the average turnover per enterprise is above €7.9m compared to €3.7m for the food and beverages industry as a whole. In addition, the turnover growth per enterprise is with 7.9% above the average of the food industry as well as of the subindustry ‘other food’. With a
O1
O1
O1
O1
O1
O2
O2
O2
O2
O2
S1
S1
S1
S1
S1
S2
S2
S2
S2
S2
T1
T1
T1
T1
T1
T2
T2
T2
T2
T2
M1
M1
M1
M1
M1
M2
M2
M2
M2
M2
L1
L1
L1
L1
L1
L2
L2
L2
L2
L2
P1
P1
P1
P1
P1
P2
P2
P2
P2
P2
EU28
US
Australia
Brazil
Canada
Weak average strongManufacture of sugar (C1081)

LEI Report 2016-018 | 57
total turnover of €49m the subsector is in the range of fruit& vegetable (C103), oil (C104) and ‘cereals’ (C106) and has a share of 4.6% in the turnover of the total food and beverages industry. The competitiveness performance of the subindustry in EU28 (turnover of €49bn) remained just above average. Almost all indicators are weak in the second period, expect for the growth of the market share. Canada with the smallest turnover for this sector (€1bn) improved his position from the weakest to the strongest. USA (turnover €18bn) and Australia (€4bn) became weak and Brazil (€10bn) remained weak. Within the EU, the confectionery industry in three largest producing countries Germany (turnover €9.6bn), France (€8bn) and Italy (€6.7bn) is strong compared to that in the other top-10 EU countries. These 3 countries account for around 50% of the total EU turnover. The EU net trade balance became less negative in the period from 2007 to 2012. In contrast, the USA showed the opposite direction. The 5 regions summed are net importers hence not included countries are net exporter.
Category Indicator Period
2003-2007 2008-2012 Overall Overall competitiveness (Unweighted average) O1 O2 Economic Annual growth share added value in manufacture industry S1 S2 Annual growth rate labour productivity L1 L2 Annual growth rate real added value P1 P2 Trade Difference RTA indicator T1 T2 Difference world market share M1 M2
Figure 4.28 Developments in competitiveness of the EU28 and benchmark countries (Z-scores of presented countries)
O1
O1
O1
O1
O1
O2
O2
O2
O2
O2
S1
S1
S1
S1
S1
S2
S2
S2
S2
S2
T1
T1
T1
T1
T1
T2
T2
T2
T2
T2
M1
M1
M1
M1
M1
M2
M2
M2
M2
M2
L1
L1
L1
L1
L1
L2
L2
L2
L2
L2
P1
P1
P1
P1
P1
P2
P2
P2
P2
P2
EU28
US
Australia
Brazil
Canada
Weak average strongManufacture of cocoa, chocolate and sugar confectionery (C1082)

58 | LEI Report 2016-018
4.10 Animal feed
4.10.1 Overview: EU Competitiveness remained strong intermediary sector
Manufacture of prepared animal feeds (C109) includes production of prepared feeds for farm animals and pets, including concentrated animal feed and feed supplements. It also includes treatment of slaughter waste to produce animal feeds (EC, 2008). However, it excludes the production of fishmeal for animal feed (see C102), oilseed cake (see C104) and activities resulting in by-products usable as animal feed without special treatment (e.g. from oilseeds (see C104) or from grain milling residues (see C106). This sector adds value to by-products (e.g. oilcakes) from other food industries and by supplying raw materials (feed) to e.g. meat, milk and fish producers. One should take into account that the trade of the by-products - important raw materials for the feed industry - is included in the trade of the other sectors. It might be possible that large quantities of oil cakes are imported - and hence included in the trade of the oil sector (C104) - that are only used in the feed industry. In the figure below Australia is not included due to lacking business data.
Category Indicator Period
2003-2007 2008-2012 Overall Overall competitiveness (Unweighted average) O1 O2 Economic Annual growth share added value in manufacture industry S1 S2 Annual growth rate labour productivity L1 L2 Annual growth rate real added value P1 P2 Trade Difference RTA indicator T1 T2 Difference world market share M1 M2
Legend: Australia not included due to lacking data.
Figure 4.29 Developments in competitiveness of the EU28 and benchmark countries (Z-scores of presented countries)
O1
O1
O1
O1
O2
O2
O2
O2
S1
S1
S1
S1
S2
S2
S2
S2
T1
T1
T1
T1
T2
T2
T2
T2
M1
M1
M1
M1
M2
M2
M2
M2
L1
L1
L1
L1
L2
L2
L2
L2
P1
P1
P1
P1
P2
P2
P2
P2
EU28
US
Brazil
Canada
Weak average strongManufacture of prepared animal feeds (C109)
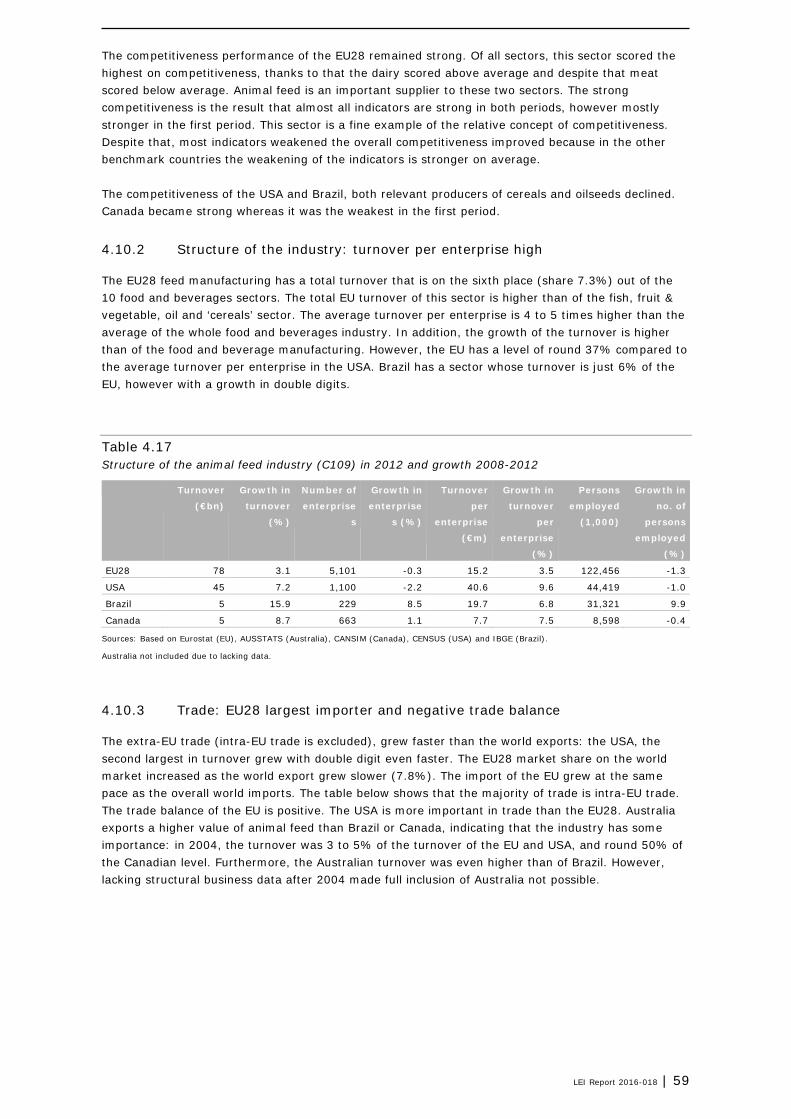
LEI Report 2016-018 | 59
The competitiveness performance of the EU28 remained strong. Of all sectors, this sector scored the highest on competitiveness, thanks to that the dairy scored above average and despite that meat scored below average. Animal feed is an important supplier to these two sectors. The strong competitiveness is the result that almost all indicators are strong in both periods, however mostly stronger in the first period. This sector is a fine example of the relative concept of competitiveness. Despite that, most indicators weakened the overall competitiveness improved because in the other benchmark countries the weakening of the indicators is stronger on average. The competitiveness of the USA and Brazil, both relevant producers of cereals and oilseeds declined. Canada became strong whereas it was the weakest in the first period.
4.10.2 Structure of the industry: turnover per enterprise high
The EU28 feed manufacturing has a total turnover that is on the sixth place (share 7.3%) out of the 10 food and beverages sectors. The total EU turnover of this sector is higher than of the fish, fruit & vegetable, oil and ‘cereals’ sector. The average turnover per enterprise is 4 to 5 times higher than the average of the whole food and beverages industry. In addition, the growth of the turnover is higher than of the food and beverage manufacturing. However, the EU has a level of round 37% compared to the average turnover per enterprise in the USA. Brazil has a sector whose turnover is just 6% of the EU, however with a growth in double digits.
Table 4.17 Structure of the animal feed industry (C109) in 2012 and growth 2008-2012
Turnover
(€bn)
Growth in
turnover
(%)
Number of
enterprise
s
Growth in
enterprise
s (%)
Turnover
per
enterprise
(€m)
Growth in
turnover
per
enterprise
(%)
Persons
employed
(1,000)
Growth in
no. of
persons
employed
(%)
EU28 78 3.1 5,101 -0.3 15.2 3.5 122,456 -1.3
USA 45 7.2 1,100 -2.2 40.6 9.6 44,419 -1.0
Brazil 5 15.9 229 8.5 19.7 6.8 31,321 9.9
Canada 5 8.7 663 1.1 7.7 7.5 8,598 -0.4
Sources: Based on Eurostat (EU), AUSSTATS (Australia), CANSIM (Canada), CENSUS (USA) and IBGE (Brazil).
Australia not included due to lacking data.
4.10.3 Trade: EU28 largest importer and negative trade balance
The extra-EU trade (intra-EU trade is excluded), grew faster than the world exports: the USA, the second largest in turnover grew with double digit even faster. The EU28 market share on the world market increased as the world export grew slower (7.8%). The import of the EU grew at the same pace as the overall world imports. The table below shows that the majority of trade is intra-EU trade. The trade balance of the EU is positive. The USA is more important in trade than the EU28. Australia exports a higher value of animal feed than Brazil or Canada, indicating that the industry has some importance: in 2004, the turnover was 3 to 5% of the turnover of the EU and USA, and round 50% of the Canadian level. Furthermore, the Australian turnover was even higher than of Brazil. However, lacking structural business data after 2004 made full inclusion of Australia not possible.

60 | LEI Report 2016-018
Table 4.18 Trade in animal feed products (C109) in 2012 and growth 2008-2012
Export Import Trade
balance
(€m) Export
(€m)
Growth
(%)
Market
share (%)
Import
(€m)
Growth
(%)
Market
share (%)
EU28-int 12,130 4.7 54.3 9,149 2.7 46.7 2,982
EU28 3,030 9.1 13.6 879 4.4 4.5 2,151
USA 4,201 11.4 18.8 1,091 13.4 5.6 3,110
Australia 762 5.6 3.4 228 5.6 1.2 534
Brazil 132 3.3 0.6 173 9.4 0.9 -42
Canada 628 12.1 2.8 698 5.8 3.6 -70
Source: Calculations by LEI Wageningen UR based on UN Comtrade.
In the EU28 the exports are larger than the imports; the RTA is positive and increasing. The developments in the USA showed stable developments with positive RTA indicators. Brazil and Canada have negative Relative net Trade Advantage (RTA) indicators: those of Canada are declining and of Brazil improving. Australia has the highest positive RTAs.
Figure 4.30 Trade indicators Source: Calculations by LEI Wageningen UR based on UN Comtrade data.
4.10.4 EU member states: largest countries in turnover weakest
The presented 10 countries account for 88% of the turnover, 87% of the export and 77% of the import of the total EU. France and Germany, counting combined for 30% of EU’s turnover, are below average. Spain and the UK, together 24% of EU’s turnover are the strongest.
-1.0 -0.5 0.0 0.5 1.0 1.5 2.0 2.5 3.0 3.5 4.0 4.5 5.0
RXA
RMA
RTA
RXA
RMA
RTA
RXA
RMA
RTA
RXA
RMA
RTA
RXA
RMA
RTA
CAN
BRA
AUS
USA
EU28
Trade indicators (Manufacture of prepared animal feeds)
2012 2007 2003

LEI Report 2016-018 | 61
Indicator Period Period Overall competitiveness O2 2008-2012 O1 2003-2007
Figure 4.31 Developments in competitiveness of 10 selected EU28 member states in decreasing order of turnover
4.11 Beverages
4.11.1 Overview: EU improved, USA strongest
Manufacture beverages includes production and processing of beverages, such as non-alcoholic beverages and mineral water, alcoholic beverages mainly through fermentation, beer and wine, and the manufacture of distilled alcoholic beverages. This division excludes production of fruit and vegetable juices (C103), of milk-based beverages (C105) and of coffee, tea and mate products (C108). This class is quite diverse and counts seven subclasses (EC, 2008). Below, we discuss the subclass ‘spirits’ (C1101). The competitiveness performance of the EU28 was below average in period 1 and strengthened in period 2 on most indicators. USA is by far the strongest, based on an improvement of all indicators. All other countries are below average due to the strong indicators of the USA. Brazil was the strongest in period 1 and became below average in the second period.
O1
O1
O1
O1
O1
O1
O1
O1
O1
O1
O2
O2
O2
O2
O2
O2
O2
O2
O2
O2
FR
DE
ES
UK
NL
IT
BE
PL
DK
IE
Weak average strongManufacture of prepared animal feeds (C109)

62 | LEI Report 2016-018
Category Indicator Period
2003-2007 2008-2012 Overall Overall competitiveness (Unweighted average) O1 O2 Economic Annual growth share added value in manufacture industry S1 S2 Annual growth rate labour productivity L1 L2 Annual growth rate real added value P1 P2 Trade Difference RTA indicator T1 T2 Difference world market share M1 M2
Figure 4.32 Developments in competitiveness of the EU28 and benchmark countries (Z-scores of presented countries)
4.11.2 Structure of the industry: Brazil strong grower and large scaled
The EU28 beverages manufacturing is the third largest sector after meat and ‘other food’ with a share of 14% in the total turnover of the food and beverages industry. The negative growth of the turnover in EU (-0.3%) is quite different from the amazing level of Brazil (15%). In addition, the turnover per enterprise is amongst the lowest: the average turnover in the USA is three times the level of the EU and in Brazil 8 times. The growth of the turnover per enterprises is negative in the EU and over 10% in Brazil.
O1
O1
O1
O1
O1
O2
O2
O2
O2
O2
S1
S1
S1
S1
S1
S2
S2
S2
S2
S2
T1
T1
T1
T1
T1
T2
T2
T2
T2
T2
M1
M1
M1
M1
M1
M2
M2
M2
M2
M2
L1
L1
L1
L1
L1
L2
L2
L2
L2
L2
P1
P1
P1
P1
P1
P2
P2
P2
P2
P2
EU28
US
Australia
Brazil
Canada
Weak average strongManufacture of beverages (C11)
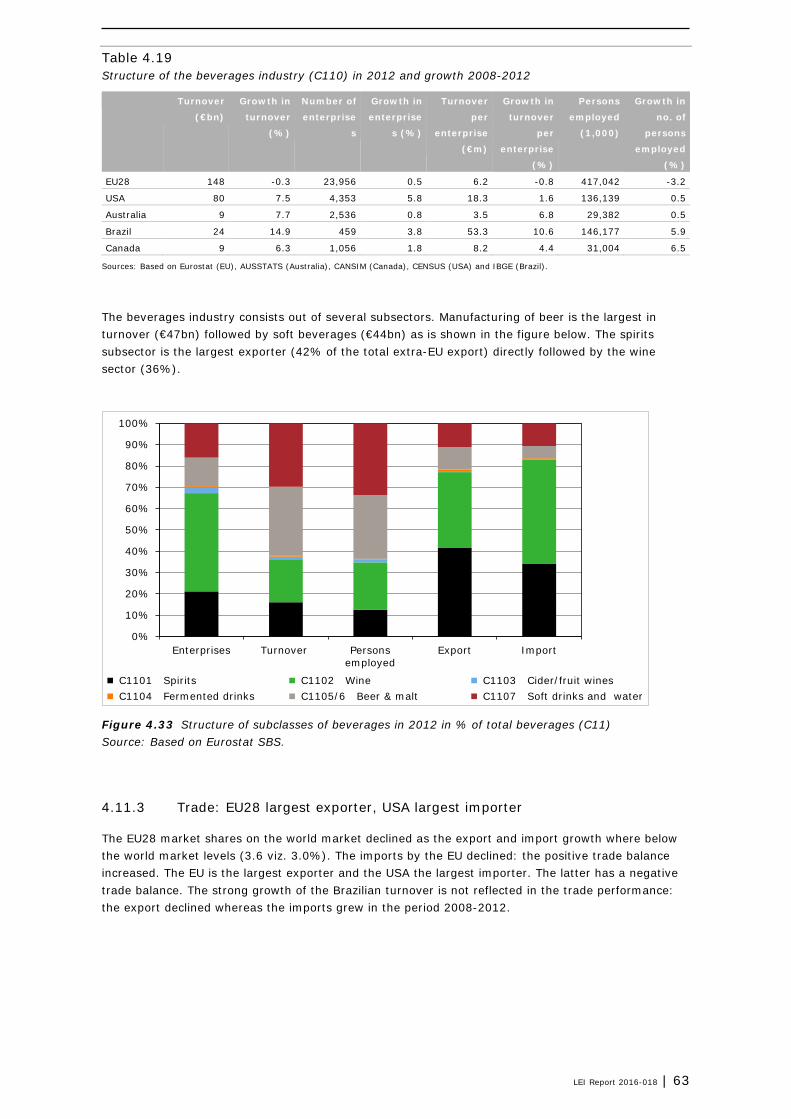
LEI Report 2016-018 | 63
Table 4.19 Structure of the beverages industry (C110) in 2012 and growth 2008-2012
Turnover
(€bn)
Growth in
turnover
(%)
Number of
enterprise
s
Growth in
enterprise
s (%)
Turnover
per
enterprise
(€m)
Growth in
turnover
per
enterprise
(%)
Persons
employed
(1,000)
Growth in
no. of
persons
employed
(%)
EU28 148 -0.3 23,956 0.5 6.2 -0.8 417,042 -3.2
USA 80 7.5 4,353 5.8 18.3 1.6 136,139 0.5
Australia 9 7.7 2,536 0.8 3.5 6.8 29,382 0.5
Brazil 24 14.9 459 3.8 53.3 10.6 146,177 5.9
Canada 9 6.3 1,056 1.8 8.2 4.4 31,004 6.5
Sources: Based on Eurostat (EU), AUSSTATS (Australia), CANSIM (Canada), CENSUS (USA) and IBGE (Brazil).
The beverages industry consists out of several subsectors. Manufacturing of beer is the largest in turnover (€47bn) followed by soft beverages (€44bn) as is shown in the figure below. The spirits subsector is the largest exporter (42% of the total extra-EU export) directly followed by the wine sector (36%).
Figure 4.33 Structure of subclasses of beverages in 2012 in % of total beverages (C11) Source: Based on Eurostat SBS.
4.11.3 Trade: EU28 largest exporter, USA largest importer
The EU28 market shares on the world market declined as the export and import growth where below the world market levels (3.6 viz. 3.0%). The imports by the EU declined: the positive trade balance increased. The EU is the largest exporter and the USA the largest importer. The latter has a negative trade balance. The strong growth of the Brazilian turnover is not reflected in the trade performance: the export declined whereas the imports grew in the period 2008-2012.
0%
10%
20%
30%
40%
50%
60%
70%
80%
90%
100%
Enterprises Turnover Personsemployed
Export Import
C1101 Spirits C1102 Wine C1103 Cider/fruit wines C1104 Fermented drinks C1105/6 Beer & malt C1107 Soft drinks and water

64 | LEI Report 2016-018
Table 4.20 Trade in beverages (C110) in 2012 and growth 2008-2012
Export Import Trade
balance
(€m) Export
(mn€)
Growth
(%)
Market
share (%)
Import
(€m)
Growth
(%)
Market
share (%)
EU28-int 52,328 2.5 65.0 32,363 -0.7 41.9 19,965
EU28 24,727 5.7 30.7 5,508 -3.9 7.1 19,219
USA 5,381 16.2 6.7 16,053 3.5 20.8 -10,672
Australia 1,687 -0.8 2.1 1,372 8.4 1.8 315
Brazil 1,803 -1.8 2.2 758 32.2 1.0 1,045
Canada 766 1.6 1.0 3,843 7.3 5.0 -3,077
Source: Calculations by LEI Wageningen UR based on UN Comtrade.
EU’s Relative Advantage (RXA) indicator improved combined with lower Relative Import Advantage (RMA) indicators, the EU’s Relative net Trade Advantage (RTA) indicators increased. The USA as a net importer has negative RTA indicators. Brazil had a strong export growth in the first period (2004-2007) resulting in a higher RTA in 2007, that declined slightly in 2012. The developments in the Canada showed a negative development, with growing negative RTA indicators. Australia has a similar development but the RTA remained positive.
Figure 4.34 Trade indicators Source: Calculations by LEI Wageningen UR based on UN Comtrade data.
4.11.4 EU member states: largest countries show mixed position
The presented 10 countries account for around 83 to 87% of the turnover, of the export and of the import of the total EU. The countries with the large turnovers showed mixed developments. France Germany and Spain scored below average: most indicators became weaker. UK became even stronger mainly due to the better trade indicators (Trade Advantage and market share). Italy improved its position from weak to strong due to an improvement on all indicators.
-2.0 -1.5 -1.0 -0.5 0.0 0.5 1.0 1.5 2.0 2.5 3.0 3.5 4.0
RXA
RMA
RTA
RXA
RMA
RTA
RXA
RMA
RTA
RXA
RMA
RTA
RXA
RMA
RTA
CAN
BRA
AUS
USA
EU28
Trade indicators (Manufacture of beverages)
2012 2007 2003

LEI Report 2016-018 | 65
Indicator Period Period Overall competitiveness O2 2008-2012 O1 2003-2007
Figure 4.35 Developments in competitiveness of 10 selected EU28 member states in decreasing order of turnover
4.11.5 Spirits: EU largest producer, USA most competitive
This subindustry (C1101) ‘distilling, rectifying and blending of spirits’ includes manufacture of distilled, potable, alcoholic beverages (whisky, brandy, gin, liqueurs etc.) and neutral spirits and furthermore mixing or blending these beverages (EC, 2008). With a total turnover of 21bn€ the sector is rather small with a share of 2% in the turnover of the food and beverages industry. The turnover of the EU is by far the largest of all selected countries: three times the level of the USA (€7bn). Brazil and Canada are small producers (both a turnover of €1bn). Structural business data of Australia are lacking. The competitiveness performance of the EU28 became below average due to weaker economic competitiveness indicators. However, the trade indicators improved. The USA improved his position and became by far the strongest: a (strong) improvement on all indicators. The EU net trade balance became more positive in the period from 2007 to 2012 and the USA less negative. Due to lacking SBS data for many large EU producers, the competitiveness of EU member states could not be assessed.
O1
O1
O1
O1
O1
O1
O1
O1
O1
O1
O2
O2
O2
O2
O2
O2
O2
O2
O2
O2
FR
UK
DE
IT
ES
PL
NL
BE
IE
DK
Weak average strongManufacture of beverages (C11)

66 | LEI Report 2016-018
Category Indicator Period
2003-2007 2008-2012 Overall Overall competitiveness (Unweighted average) O1 O2 Economic Annual growth share added value in manufacture industry S1 S2 Annual growth rate labour productivity L1 L2 Annual growth rate real added value P1 P2 Trade Difference RTA indicator T1 T2 Difference world market share M1 M2
Figure 4.36 Developments in competitiveness of the EU28 and benchmark countries (Z-scores of presented countries)
4.12 Overview all subsectors: only feed and dairy strong
Figure 4.37 presents an overview of all sectors. The overall conclusion is that the EU28 weakened and also in 2012 is weak in most sectors. In 2007, the EU28 was still above average for fish and feed. Fish became a weak sector in 2012 and feed became stronger compared to 2007. Dairy improved from weak in 2007 to strong in 2008. Bakery and beverages improved their position, but are still just below average. The overall developments are: • The growth of value added (P) was for all sectors below average in period 2 compared with
benchmark countries and below the scores in period 1. • The share of subsectors in the manufacture industry (S) was below average for most sectors. The
sector dairy and feed are above average in period 2. The score improved for meat, dairy and beverages in period 2 compared to period 1.
• The labour productivity (L) weakened for almost all sectors, except for animal feed and beverages.
O1
O1
O1
O1
O2
O2
O2
O2
S1
S1
S1
S1
S2
S2
S2
S2
T1
T1
T1
T1
T2
T2
T2
T2
M1
M1
M1
M1
M2
M2
M2
M2
L1
L1
L1
L1
L2
L2
L2
L2
P1
P1
P1
P1
P2
P2
P2
P2
EU28
US
Brazil
Canada
Weak average strongDistilling, rectifying and blending of spirits (C1101)

LEI Report 2016-018 | 67
• The Net Trade Advantage (T) and the extra-EU export market share (M) are for most sectors above average in period 2. Most sectors showed an improvement in period 2 compared to period 1. ‘Other food’ and animal feed lost significantly position on both indicators.
Category Indicator Period
2003-2007 2008-2012 Overall Overall competitiveness (Unweighted average) O1 O2 Economic Annual growth share added value in manufacture industry S1 S2 Annual growth rate labour productivity L1 L2 Annual growth rate real added value P1 P2 Trade Difference RTA indicator T1 T2 Difference world market share M1 M2
Figure 4.37 Developments in competitiveness of the food subsectors in the EU28 (based on Z-scores with benchmark countries)
O1
O1
O1
O1
O1
O1
O1
O1
O1
O1
O1
O2
O2
O2
O2
O2
O2
O2
O2
O2
O2
O2
S1
S1
S1
S1
S1
S1
S1
S1
S1
S1
S1
S2
S2
S2
S2
S2
S2
S2
S2
S2
S2
S2
T1
T1
T1
T1
T1
T1
T1
T1
T1
T1
T1
T2
T2
T2
T2
T2
T2
T2
T2
T2
T2
T2
M1
M1
M1
M1
M1
M1
M1
M1
M1
M1
M1
M2
M2
M2
M2
M2
M2
M2
M2
M2
M2
M2
L1
L1
L1
L1
L1
L1
L1
L1
L1
L1
L1
L2
L2
L2
L2
L2
L2
L2
L2
L2
L2
L2
P1
P1
P1
P1
P1
P1
P1
P1
P1
P1
P1
P2
P2
P2
P2
P2
P2
P2
P2
P2
P2
P2
Food & Beverages
Meat
Fish
Fruit/veg.
Oil
Dairy
Cereals
Bakery
Other food
Feed
Beverages
Weak average strong
EU28 all sectors

68 | LEI Report 2016-018
5 Discussion and conclusions
5.1 Discussion
5.1.1 Domestic demand focus EU
In Section 2.2 we cited Krugman that the performance on the world markets is irrelevant if the industry is focused only on the domestic market (Krugman, 1994). Table 5.1 (compiled from the Tables 3.1 and 3.2 in Chapter 3) shows that the value of exports or imports of EU28 represents 8 viz. 7% of the value of turnover, thus confirming that the statement of Krugman that for the EU its domestic market is of greater importance than the world market. This applies also for the USA and even more clearly if only net-trade is considered. The export market is relevant for the other three benchmark countries, where the export value is 19 to 29% of their turnover. Brazil has of the selected countries the largest net-export share in turnover and to a much lesser extent also Australia. Hence, the export market should be in the competitiveness performance indicator.
Table 5.1 Turnover and trade of the food and beverages manufacturing in 2012
Turnover Export Import Net trade
€bn €bn % in
turnover
€bn % in
turnover
€bn % in
turnover
EU 28-int 1,061 309 29.1 290 27.3 19 1.8
EU 28 1,061 86 8.1 76 7.1 11 1.0
USA 652 59 9.1 71 10.8 -11 -1.7
Australia 71 14 20.2 9 12.3 6 7.9
Brazil 186 35 19.0 6 3.1 30 15.9
Canada 73 21 29.2 20 27.5 1 1.8
Sources: Based on Eurostat (EU), AUSSTATS (Australia), CANSIM (Canada), CENSUS (USA) and IBGE (Brazil) and UN Comtrade.
The observation afore indicates that indicators measuring the EU performance on the domestic market should have higher weights than on the export market. As the economic indicators of the EU are all on the lowest side of all countries, the position would even be worse than the presented assessment. As a major share of the world trade is between EU member states, trade indicators are of high importance for an assessment on the member state level. Table 5.2 shows that values of exports and imports of member states are between 17 and 71% of their turnover value. Even the net-trade share is for several countries in double digits and in the range of the Brazilian share. However, a net-trade approach will raise the question on appropriate indicators for the UK as net importing country.

LEI Report 2016-018 | 69
Table 5.2 Turnover and trade of the food and beverages manufacturing in 2012 of EU member states
Turnover Export Import Net trade
€bn €bn % in
turnover
€bn % in
turnover
€bn % in
turnover
Germany 187 50 26.8 46 24.6 4 2.2
France 178 42 23.4 34 18.9 8 4.5
Italy 124 25 20.5 25 20.2 0 0.3
UK 114 20 17.8 37 32.1 -16 -14.2
Spain 102 23 22.0 18 17.9 4 4.2
Netherlands 65 46 71.3 32 49.6 14 21.7
Poland 54 13 24.5 9 16.7 4 7.9
Belgium 44 26 59.5 20 45.2 6 14.3
Ireland 26 9 33.0 6 21.1 3 11.9
Denmark 24 13 53.9 8 34.2 5 19.8
Sources: Based on Eurostat (EU) and UN Comtrade.
Concluding: the EU and intra-EU market is highly relevant for the competitiveness of the EU food and beverages manufacturing. Policies for improving the competitiveness should address the development of the internal market.
5.1.2 Strong EU member states all internationally weak
In the previous sections, we analysed the competitiveness of the EU28 against the 4 non-EU benchmark countries and we benchmarked 10 EU member states with the largest turnover against each other. In this section, we raise the question: Are the strong EU member states also strong if they are benchmarked against the 4 non-EU countries? As depicted in Tables.3.1 and 3.3 the turnover of the food and beverages industry of the large EU countries is larger than those of Australia and Canada. Figure 5.1 shows that even the 5 strongest EU countries have competitiveness’ scores below average benchmarked against the international playing field. Australia was assessed below average in analyses with EU28; USA, Brazil and Canada. Australia became above average if benchmarked against the 5 EU member states and USA, Brazil and Canada. Only the Netherlands improved its competitiveness slightly in between the two periods: the competitiveness of all other EU member states and also of Canada weakened. Trade indicators improved for most EU member states, whereas economic indicators are often on the weak side. An exception is the Netherlands: the performances of the economic indicators are all on the strong side whereas the trade indicators are on the weak side in the second period.

70 | LEI Report 2016-018
Category Indicator Period
2003-2007 2008-2012 Overall Overall competitiveness (Unweighted average) O1 O2 Economic Annual growth share added value in manufacture industry S1 S2 Annual growth rate labour productivity L1 L2 Annual growth rate real added value P1 P2 Trade Difference RTA indicator T1 T2 Difference world market share M1 M2
Figure 5.1 Developments in Competitiveness of 5 strong EU member states internationally benchmarked (presented in decreasing order of turnover)
5.1.3 Sensitivity: value added per capita and EU25
Our analyses cover the EU28 for the period 2003 to 2012. However, EU28 did not yet exist in 2012. With the accession of 10 Central Eastern countries in 2004 the EU25 became reality. These 25 countries are member for almost the full period of the analyses 2003 to 2012. In 2007 Bulgaria and Romania and in 2013 Croatia accessed the EU. The question can be raised: Does analysing the performance of EU28 instead of EU25 has an impact on the competitiveness performance? We analysed the difference in competitiveness if EU25int was considered instead of EU28int (which
O1
O1
O1
O1
O1
O1
O1
O1
O1
O2
O2
O2
O2
O2
O2
O2
O2
O2
S1
S1
S1
S1
S1
S1
S1
S1
S1
S2
S2
S2
S2
S2
S2
S2
S2
S2
T1
T1
T1
T1
T1
T1
T1
T1
T1
T2
T2
T2
T2
T2
T2
T2
T2
T2
M1
M1
M1
M1
M1
M1
M1
M1
M1
M2
M2
M2
M2
M2
M2
M2
M2
M2
L1
L1
L1
L1
L1
L1
L1
L1
L1
L2
L2
L2
L2
L2
L2
L2
L2
L2
P1
P1
P1
P1
P1
P1
P1
P1
P1
P2
P2
P2
P2
P2
P2
P2
P2
P2
USA
AUS
Can
BRA
IT
UK
ES
NL
BE
Weak average strongEU28 all sectors

LEI Report 2016-018 | 71
included the recently accessed countries Bulgaria, Romania and Croatia). The conclusion is that EU28 or EU25 makes no difference for the food and beverages industry as a whole: the overall indicator does not change. The changes of the basic indicators are between 0 and 2% for the EU28 and all benchmark countries. The negligible impact is not so remarkable as the share of these 3 countries together in EU28 turnover, import or export of the food and beverages manufacturing is 1 to 2% (Table 3.3 provides specific data). As the impact of the EU25 versus EU28 is negligible, we performed the analyses for the EU28. Section 5.1 shows that the majority of food production is consumed domestically. Food consumption is strongly related to the size and composition of the population. The population growth in the EU28 is low compared to the benchmark countries (Table 5.3). An increasing population results in a larger demand for food, that is lower in the EU28 than in the benchmark countries. One can argue that value added per capita is a better indicator for competitiveness than total value added. The first is not sensitive for the population size. We analysed the impact of using the growth of ‘value added per capita’ instead of ‘total value added’. The impact on the competitive position of the EU28 is insignificant. The EU scores on the value added indicator improved very slightly, resulting in almost no impact on the overall competitive ranking. The methodology used is in this respect robust.
Table 5.3 Population growth (annual %)
Country 2003-2007 2008-2012
EU28 0.3 0.1
USA 0.8 0.7
Australia 0.9 1.4
Brazil 1.0 0.8
Canada 0.8 0.9
5.1.4 Comparison with Porter and World Economic Forum
Section 2.1 discusses concepts of competitiveness. The question in this section is ‘Will the position be different if another approach had been taken’. A recent study uses the Porter’s diamond (Porter, 1990) for accessing the competitiveness of countries. That study offers an opportunity of making a comparison between the dairy value chain and the dairy manufacturing as used in this study. Due to a difference between the definition of a value chain ‘Farm to Fork’ and a processing industry other sectors cannot be compared. The definition of the dairy value chain and dairy processing are the nearest. For the methodological background we refer to the study of Wijnands et al. (Wijnands et al., 2016). The focus of that study is on the individual countries of Commonwealth of Independent States (CIS) and of the EU28. As the USA, Australia, Brazil and Canada are not included in that study and comparison of EU28 with those countries is not possible. Figure 5.2 shows the scoring on Porter’s diamonds determinants for 2012 and the score for period 2 (also ending 2012) used in this study. We used the 9 largest EU countries: lacking data for Denmark is the reason it is not included. The scoring methodology is in both studies identical. Due to difference in indicators in measuring competitiveness and focus (value chain viz. processing industry) a direct comparison is not fully possible. The results presented in Figure 5.2 shows some similarities in the positioning: Belgium and Poland are on the weak side and France, Netherlands and the UK are on the strong side in both approaches. Most remarkable are the opposite positions of Ireland and Italy. Italy is rather weak on the determinant factor conditions that is strongly related to the primary sector and also weak on the determinants firm strategy and governance. For Ireland the opposite is the case. Also Spain and Germany have opposite positions: all determinants of Porter are strong for Germany and relatively weak for Spain. The Porter approach includes also institutional (e.g. education, infrastructure) and governance issues. This approach includes not only performance indicators, but also process and potential indicators for measuring competitiveness as framed by Buckley et al. (1998).

72 | LEI Report 2016-018
Legend: Acronyms of countries indicates the position
Figure 5.2 Competitiveness of the dairy sector compared with Porter’s diamond
Porter’s approach is compared with the overall ranking of the World Economic Forum (Schwab, 2014). The ranking range of the selected EU countries is between 5 for Germany (highest rank) and 49 for Italy (the lowest rank of the selected countries). The rankings are transformed in Z-scores, indicating that Germany is the strongest and Italy the weakest. The competitiveness scores based on the WEF are largely in line with the Porter approach. The assessment of the WEF includes also institutional and governance indicators. The conclusion on the comparison of the assessment in this study and the other two approaches are: 1. The approach in this study is partial, as only performance indicators embedded in the international
economics are included. Indicators measuring the competitive process and potential are not in included. A recommendation might be: enriching the assessment by including such indicators. The weights of such indicators need to be studied.
2. To include more indicators such as e.g. is proposed by Buckley et al. (1988), that distinguishes next to performance indicators also competitiveness’ process and potential in the analyses. Also the link of the processing industry with the production of raw materials (farmers) might be considered.
3. Porter’s diamond approach ranks the countries for the dairy value chain almost in line with the ranking of nation based on the World Economic Forum study. This is line with the expectations: a competitive nation and demanding home market is one of the important indicators in Porter’s school of thoughts.
DE
DE
DE
DE
DE
DE
DE
DE
FR
FR
FR
FR
FR
FR
FR
FR
IT
IT
IT
IT
IT
IT
IT
IT
UK
UK
UK
UK
UK
UK
UK
UK
ES
ES
ES
ES
ES
ES
ES
ES
NL
NL
NL
NL
NL
NL
NL
NL
PL
PL
PL
PL
PL
PL
PL
PL
BE
BE
BE
BE
BE
BE
BE
BE
IE
IE
IE
IE
IE
IE
IE
IE
Factor conditions
Demand conditions
Supporting industries
Firm strategy
Government
Overall
"O2" overall
Word Economic Forum
Dairy
val
ue c
hain
Por
ter's
dia
mon
dDa
iry (C
105)
Nat
ion
Comparison with other approachesWeak Average Strong
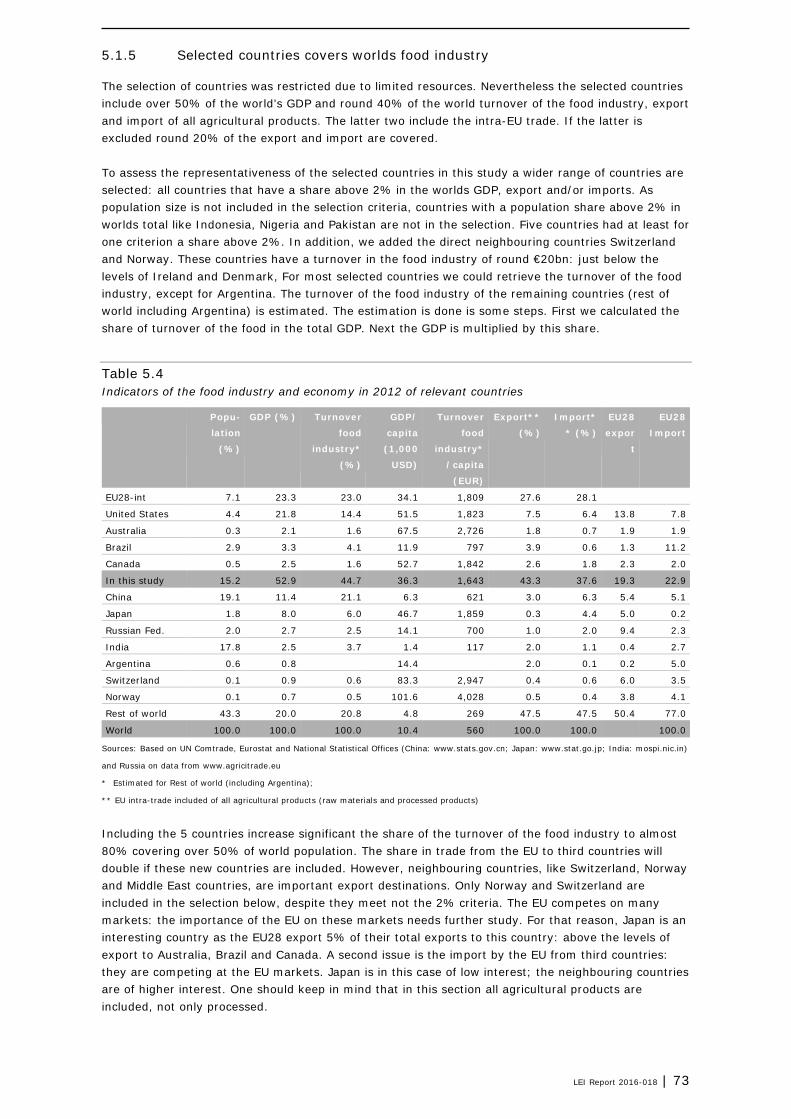
LEI Report 2016-018 | 73
5.1.5 Selected countries covers worlds food industry
The selection of countries was restricted due to limited resources. Nevertheless the selected countries include over 50% of the world’s GDP and round 40% of the world turnover of the food industry, export and import of all agricultural products. The latter two include the intra-EU trade. If the latter is excluded round 20% of the export and import are covered. To assess the representativeness of the selected countries in this study a wider range of countries are selected: all countries that have a share above 2% in the worlds GDP, export and/or imports. As population size is not included in the selection criteria, countries with a population share above 2% in worlds total like Indonesia, Nigeria and Pakistan are not in the selection. Five countries had at least for one criterion a share above 2%. In addition, we added the direct neighbouring countries Switzerland and Norway. These countries have a turnover in the food industry of round €20bn: just below the levels of Ireland and Denmark, For most selected countries we could retrieve the turnover of the food industry, except for Argentina. The turnover of the food industry of the remaining countries (rest of world including Argentina) is estimated. The estimation is done is some steps. First we calculated the share of turnover of the food in the total GDP. Next the GDP is multiplied by this share.
Table 5.4 Indicators of the food industry and economy in 2012 of relevant countries
Popu-
lation
(%)
GDP (%) Turnover
food
industry*
(%)
GDP/
capita
(1,000
USD)
Turnover
food
industry*
/capita
(EUR)
Export**
(%)
Import*
* (%)
EU28
expor
t
EU28
Import
EU28-int 7.1 23.3 23.0 34.1 1,809 27.6 28.1
United States 4.4 21.8 14.4 51.5 1,823 7.5 6.4 13.8 7.8
Australia 0.3 2.1 1.6 67.5 2,726 1.8 0.7 1.9 1.9
Brazil 2.9 3.3 4.1 11.9 797 3.9 0.6 1.3 11.2
Canada 0.5 2.5 1.6 52.7 1,842 2.6 1.8 2.3 2.0
In this study 15.2 52.9 44.7 36.3 1,643 43.3 37.6 19.3 22.9
China 19.1 11.4 21.1 6.3 621 3.0 6.3 5.4 5.1
Japan 1.8 8.0 6.0 46.7 1,859 0.3 4.4 5.0 0.2
Russian Fed. 2.0 2.7 2.5 14.1 700 1.0 2.0 9.4 2.3
India 17.8 2.5 3.7 1.4 117 2.0 1.1 0.4 2.7
Argentina 0.6 0.8 14.4 2.0 0.1 0.2 5.0
Switzerland 0.1 0.9 0.6 83.3 2,947 0.4 0.6 6.0 3.5
Norway 0.1 0.7 0.5 101.6 4,028 0.5 0.4 3.8 4.1
Rest of world 43.3 20.0 20.8 4.8 269 47.5 47.5 50.4 77.0
World 100.0 100.0 100.0 10.4 560 100.0 100.0 100.0
Sources: Based on UN Comtrade, Eurostat and National Statistical Offices (China: www.stats.gov.cn; Japan: www.stat.go.jp; India: mospi.nic.in)
and Russia on data from www.agricitrade.eu
* Estimated for Rest of world (including Argentina);
** EU intra-trade included of all agricultural products (raw materials and processed products)
Including the 5 countries increase significant the share of the turnover of the food industry to almost 80% covering over 50% of world population. The share in trade from the EU to third countries will double if these new countries are included. However, neighbouring countries, like Switzerland, Norway and Middle East countries, are important export destinations. Only Norway and Switzerland are included in the selection below, despite they meet not the 2% criteria. The EU competes on many markets: the importance of the EU on these markets needs further study. For that reason, Japan is an interesting country as the EU28 export 5% of their total exports to this country: above the levels of export to Australia, Brazil and Canada. A second issue is the import by the EU from third countries: they are competing at the EU markets. Japan is in this case of low interest; the neighbouring countries are of higher interest. One should keep in mind that in this section all agricultural products are included, not only processed.
74 | LEI Report 2016-018
In the selected countries the GDP per capita varies strongly from USD1,400 per capita in India to USD101,600in Norway. The turnover of the food industry per capita varies accordingly. The impact of income on competitiveness might be considered to be included, as high demanding consumer has a positive impact according to Porter (1990). We recommend: 1. To include more countries in this analyses for assessing the EU food industry competitiveness.
Despite that a significant share (45%) of the world’s food industry is already covered in the present study.
2. To include countries that have a strong trade relationship with the EU, export as well import. Two examples are provided in the table above.
5.2 Conclusions: EU food industry became weaker
5.2.1 Answers to the research questions
The answers on the specific research question in chapter 1 are: 1. The competitiveness of the EU food and beverage manufacturing and most subindustries
benchmarked against USA, Australia, Brazil and Canada is weak. The EU has relatively high scores on the trade indicators (developments in market share and Relative Net Trade advantage) and relatively low scores on economic indicators (developments in labour productivity, value added and share value added in manufacturing). This ex-post performance assessment shows that the EU policy aim of ‘being the strongest region’ has not been fully achieved.
2. The development of the EU competitiveness of the food and beverage manufacturing shows a deterioration of the position: the position is even lower in the second period than the relatively weak position in the first period. The developments for the subindustries vary: a. Dairy improved from weak to just above average; b. Feed improved its strong position; c. Bakery and beverages improved also their position to less weak; d. Fish and oil lost position from the strong side to the weak side; e. Meat, fruit, vegetables, cereals and other food became weaker in the second period than in
the first period. 3. The position of member states depends on the benchmark countries:
a. Within EU28, the 10 countries with the largest turnover are benchmarked against each other. The competitiveness of the food and beverages manufacturing in Germany, France, and Poland is weak and became even weaker in the second period. Italy and the Netherlands improved their position from weak to the strongest countries. UK, Spain and Belgium are also on the strongest side (see Figure 3.4).
b. If the USA, Australia, Brazil and Canada are used as benchmark countries, even the strongest EU member states all show weak performance (see Figure 5.1)
4. The competiveness of the subindustries for the EU countries varies: almost all selected member states have strong as well as weak subindustries. However, countries that have a weak position for the food and beverage manufacturing have relatively more weak sectors and strong countries have relatively more strong sectors.
5. The indicators linked to the internal and external market are the trade indicators. Earlier, it was shown that the trade to third markets grew faster than to the internal market (intra-EU trade). The position of the EU28-int will be weaker than if EU28 (without intra-EU trade) is benchmarked against USA, Australia, Brazil and Canada.
6. The importance of SMEs in the food industry is limited. Figure 3.2 shows that 90% of the enterprises has a share in the total turnover of just above 10% and employs around 25% of the personnel. The 10% largest enterprises take the remaining part of turnover and employment. For the food industry, the large enterprises are the backbone of Europe’s food industry and not the SMES as stated by the EC (2009). Given this observation policies to enhance the SMEs in the food industry need a specific focus.

LEI Report 2016-018 | 75
Legend: Acronyms of countries indicate the position. Countries outside the range of the graph (e.g. DK, IE and UK for some subindustries) are depicted on the margins.
Figure 5.3 Competitiveness of subindustries for EU member states for period 2 (2008-2012)
5.2.2 Robustness of approach and recommendations
The approach in this study measures competitiveness based on the ex-post performance of the industry. The approach has some limitations, as outlined in Section 2.1: 1. The metrics do not include indicators that provide insight into the competitiveness process and
potentials (Buckley et al., 1988). 2. The links of the metrics with governance and policies is almost fully absent, whereas
competitiveness is often used for indicating the prosperity of industries or countries. New indicators need to be added, linking the competitiveness with policies (Latruffe, 2010; Siggel, 2006).
3. Furthermore, research is needed to investigate whether competitiveness measurement is an indicator for the future development of the industry. At this moment the link between competiveness and development of an industry is largely based on assumptions (Krugman, 1994).
A strong point of the approach is that major economic indicators are included: the EU28 food and beverage manufacturing serves for about 90% the EU28 consumers. Studies that only focus on export indicators (Fertö and Hubbard, 2003, Carraresi and Banterle, 2015, Fischer, 2010) include just a small part of the relevant markets. The selection of benchmark countries is mainly based on export markets shares: this is a somewhat limited focus despite that a major part of world food manufacturing and agricultural trade is included (see section 5.4). We recommend reconsidering the selection of countries. Other elements, such as growth of an industry, growth of trade as well as the trade with the EU28, can be added to the
DE
DE
DE
DE
DE
DE
DE
DE
DE
DE
DE
FR
FR
FR
FR
FR
FR
FR
FR
FR
FR
FR
IT
IT
IT
IT
IT
IT
IT
IT
IT
IT
IT
UK
UK
UK
UK
UK
UK
UK
UK
UK
UK
UK
ES
ES
ES
ES
ES
ES
ES
ES
ES
ES
ES
NL
NL
NL
NL
NL
NL
NL
NL
NL
NL
NL
PL
PL
PL
PL
PL
PL
PL
PL
PL
PL
PL
BE
BE
BE
BE
BE
BE
BE
BE
BE
BE
BE
IE
IE
IE
IE
IE
IE
IE
IE
IE
IE
IE
DK
DK
DK
DK
DK
DK
DK
DK
DK
DK
Meat
Fish
Fruit-veg.
Oil
Dairy
Cereals
Bakery
Other food
Feed
Beverages
Food&bev.
Sub
indu
strie
s F
& B
Overall competitiveness of food subindustries
Weak Average Strong

76 | LEI Report 2016-018
selection criteria. Despite the fact that for some countries sufficient data is lacking, the number of countries can be extended. The competitiveness of the food manufacturing is assessed independently from other links in the value chain. The performance of supplying actors (such as raw materials) and of the demanding actors (such as wholesalers and retailers) is not taken into account. As mentioned before, governance issues are also not included. We recommend further studying the competitiveness of the food industry linked with the value chain and governance. The overall recommendation is to extend the indicators with regard to policies, governance and potential measuring competitiveness. In addition, the number of countries can be extended and dependency with other the actors in the value chain will add a new dimension in line with Porter’s approaches (Porter, 1990).

LEI Report 2016-018 | 77
References
ARGOTE, L. & INGRAM, P. 2000. Knowledge transfer: A basis for competitive advantage in firms. Organizational behavior and human decision processes, 82, 150-169.
ARIP, M. A., LAU, S. Y. & SATORU, M. 2010. Commodity-industry classification proxy : a correspondence table between SITC Revision 2 and ISIC Revision 3. Journal of international economic studies, 24, 185-202.
BUCKLEY, P. J., PASS, C. L. & PRESCOTT, K. 1988. Measures of international competitiveness: A critical survey∗†. Journal of marketing management, 4, 175-200.
CARRARESI, L. & BANTERLE, A. 2015. Agri-food Competitive Performance in EU Countries: A Fifteen-Year Retrospective. International Food and Agribusiness Management Review, 18, 37.
COLLINS 2006. Collins COBUILD advanced learner’s English dictionary, Collins Cobuild. COMMISSION, C. F. T. 2010. Europe 2020 A strategy for smart, sustainable and inclusive growth.
COM (2010), 2020. CROUCH, G. I. & RITCHIE, J. B. 1999. Tourism, competitiveness, and societal prosperity. Journal of
business research, 44, 137-152. EC 2008. NACE Rev. 2 – Statistical classification of economic activities in the European Community.
Luxembourg: European Commission: Office for Official Publications of the European Communities. EC 2009. Report of the Expert Group. Think Small First – Considering SME interests in policy-making
including the application of an ‘SME Test’, Brussel, European Commission. ECORYS 2016 (forthcoming). The competitive position of the European food and drink industry,
Rotterdam, Ecorys/ECSIP Consortium. EUROPEAN COMMUNITIES 1993. Growth, Competitiveness, Employment: The Challenges and Ways
Forward Into the 21st Century (white Paper), Office for Official Publications of the European Communities.
EUROPEAN COUNCIL 2000. Ppresidency conclusions, Lisbon European Council. 23 and 24 march 2000. FERTÖ, I. & HUBBARD, L. J. 2003. Revealed Comparative Advantage and Competitiveness in
Hungarian Agri–Food Sectors. The World Economy, 26, 247–259. FISCHER, C. 2010. Food quality and product export performance: an empirical investigation of the EU
situation. Journal of International Food & Agribusiness Marketing, 22, 210-233. FLEISHER, C. S. & BENSOUSSAN, B. E. 2003. Strategic and competitive analysis: methods and
techniques for analyzing business competition, Prentice Hall Upper Saddle River, NJ. FROHBERG, K. & HARTMANN, M. 1997. Comparing measures of competitveness. Halle: Institute of
Agricultural Development in Central and Eastern Europe. GELLYNCK, X. 2002. Changing Environment and Competitiveness in the Food Industry. PhD, University
Gent. GORTON, M., HUBBARD, C. & FERTŐ, I. 2013. Theoretical background and conceptual framework.
Halle: Leibniz Institute of Agricultural Development in Transition Economies (IAMO). HAMEL, G. & PRAHALAD, C. K. 1994. Competing for the future: Breakthrough strategies for seizing
control of your industries and creating the markets of tomorrow., Harvard, Harvard Business School Press.
KRUGMAN, P. 1994. Competitiveness: a dangerous obsession. FOREIGN AFFAIRS-NEW YORK-, 73, 28-28.
KRUGMAN, P. R. & OBSTFELD, M. 2006. International Economics: Theory and Policy, Boston, Pearson/Addison-Wesley.
LATRUFFE, L. 2010. Competitiveness, Productivity and Efficiency in the Agricultural and Agri-Food Sectors’, OECD Food, Agriculture and Fisheries Working Papers No. 30. Paris: OECD Publishing.
METCALFE, J. S., GEORGHIOU, L., CUNNINGHAM, P. & CAMERON, H. M. 1992. Evaluation of the impact of European Community research programmes upon the competitiveness of European industry-Concepts and approaches. EUR 14198 EN. Research evaluation. Science and Technology Policy Series.
O’MAHONEY, M. & VAN ARK, B. 2003. EU-productivity and competitiveness: an industry perspective. Luxembourg: Office for Official Publication of the European Community.

78 | LEI Report 2016-018
PORTER, M. E. 1980. Competitive strategy: Techniques for Analyzing Industries and Competitiors, New York, The Free Press.
PORTER, M. E. 1990. The competitive advantage of nations, London, The MacMillam Press Ltd. SAGHEER, S., YADAV, S. S. & DESHMUKH, S. G. 2009. Developing a conceptual framework for
assessing competitiveness of India’s agrifood chain. International Journal of Emerging Markets, 4, 137-159.
SCHWAB, K. 2014. The Global Competitiveness Report 2014–2015. Geneva: World Economic Forum. SCOTT, L. & VOLLRATH, T. 1992. Global Competitive Advantages and Overall Bilateral
Complementarity in Agriculture: A Statistical Review. Washington: Economic Research Service,U.S. Department of Agriculture.
SIGGEL, E. 2006. International competitiveness and comparative advantage: a survey and a proposal for measurement. Journal of Industry, Competition and Trade, 6, 137-159.
THOMPSON, A. A. & STRICKLAND, A. J. 2003. Strategic management. Concepts and Cases, New York, McGraw Hill.
VAN BERKUM, S., RUTTEN, M., WIJNANDS, J. & VERHOOG, D. 2014. Effects of an EU-US trade agreement on the Dutch agro-food sector, Wageningen, LEI Wageningen UR.
WIJNANDS, J. H. M., BREMMERS, H. J., POPPE, K. J. & VAN DER MEULEN, B. M. J. 2008. An economic and legal assessment of the EU food industry’s competitiveness. Agribusiness, 24, 417 - 439.
WIJNANDS, J. H. M., VAN BERKUM, S. & VERHOOG, D. 2016. Competitiveness of CIS food and biomass chains on international markets, The Hague, LEI Wageningen UR. www.agricistrade.eu/wp-content/uploads/2015/11/Agricistrade-D4.1-201511.pdf
WIJNANDS, J. H. M., VAN DER MEULEN, B. M. J. & POPPE, K. J. 2007. Competitiveness of the European Food Industry : an economic and legal assessment, Luxemburg, Office for Official Publications of the European Communities.
WIJNANDS, J. H. M., VERHOOG, D. & BERKUM, S. V. 2015. Measuring Competitiveness of Agro-Food Industries: The Swiss Case, Paris, OECD Publishing.
WRIGHT, P., KROLL, M. J. & PARNELL, J. 1998. Strategic Management Concepts, London, Prentice Hall.

LEI Report 2016-018 | 79
LEI Wageningen UR P.O. Box 29703 2502 LS The Hague The Netherlands T +31 (0)70 335 83 30 E [email protected] www.wageningenUR.nl/en/lei REPORT LEI 2016-018
LEI Wageningen UR is one of the world’s leading independent socio-economic research institutes. LEI’s unique data, models and knowledge offer clients insight and integrated advice on policy and decision-making in an innovative manner, and ultimately contribute to a more sustainable world. LEI is part of Wageningen UR (University and Research centre), forming the Social Sciences Group together with the Department of Social Sciences and Wageningen UR Centre for Development Innovation. The mission of Wageningen UR (University & Research centre) is ‘To explore the potential of nature to improve the quality of life’. Within Wageningen UR, nine specialised research institutes of the DLO Foundation have joined forces with Wageningen University to help answer the most important questions in the domain of healthy food and living environment. With approximately 30 locations, 6,000 members of staff and 9,000 students, Wageningen UR is one of the leading organisations in its domain worldwide. The integral approach to problems and the cooperation between the various disciplines are at the heart of the unique Wageningen Approach.

LEI Wageningen UR is one of the world’s leading independent socio-economic research institutes. LEI’s unique data, models and knowledge offer clients insight and integrated advice on policy and decision-making in an innovative manner, and ultimately contribute to a more sustainable world. LEI is part of Wageningen UR (University and Research centre), forming the Social Sciences Group together with the Department of Social Sciences and Wageningen UR Centre for Development Innovation.
The mission of Wageningen UR (University & Research centre) is ‘To explore the potential of nature to improve the quality of life’. Within Wageningen UR, nine specialised research institutes of the DLO Foundation have joined forces with Wageningen University to help answer the most important questions in the domain of healthy food and living environment. With approximately 30 locations, 6,000 members of staff and 9,000 students, Wageningen UR is one of the leading organisations in its domain worldwide. The integral approach to problems and the cooperation between the various disciplines are at the heart of the unique Wageningen Approach.
LEI Wageningen URP.O. Box 297032502 LS Den HaagThe NetherlandsE [email protected]/lei
REPORT LEI 2016-018ISBN 978-90-8615-735-8
Jo H.M. Wijnands and David Verhoog
Ex-post assessment of trade performance embedded in international economic theory
Competitiveness of the EU food industry