competitive analysis: american airlines group 5: laura moore jeffri vaughn grant gerhardt patrick...
TRANSCRIPT

Competitive Analysis: American Airlines
Group 5:Laura MooreJeffri VaughnGrant GerhardtPatrick KirklandChet Visser

Current Performance and Strategy:Overview Currently, American Airlines is not performing
very well. Their 10-K for 2008, issued in 2009, portrays the company in more of a positive way than it probably should be. American Airlines attributes most of their losses to the skyrocketing fuel prices in 2008, as well as the economic downturn in the last half of the year.
AA plans on continuing its Fleet Renewal Plans, Turnaround Plans, and plans to make more alliances around North America and Europe.

Net Earnings and Losses
AA had a decent 2007 with net earnings of $504 million while in 2008 American posted a net loss of $2.1 billion. the biggest reason for the company’s net operating
loss is because of the outrageous increase in gas prices from 2007 to 2008.
The average per gallon price in 2007 was $2.13, and jumped to an average of $3.03 per gallon in 2008. Gas became American Airlines’ biggest expense, costing them $2.7 billion.
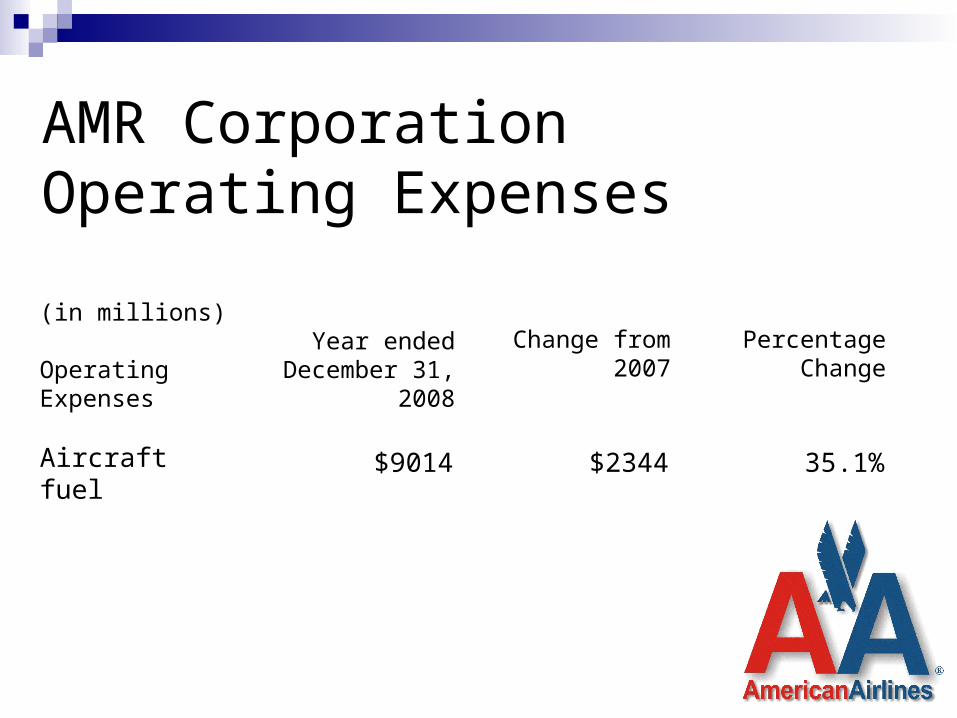
(in millions)
Operating Expenses
Year ended December 31, 2008
Change from 2007
Percentage Change
Aircraft fuel
$9014 $2344 35.1%
AMR Corporation Operating Expenses
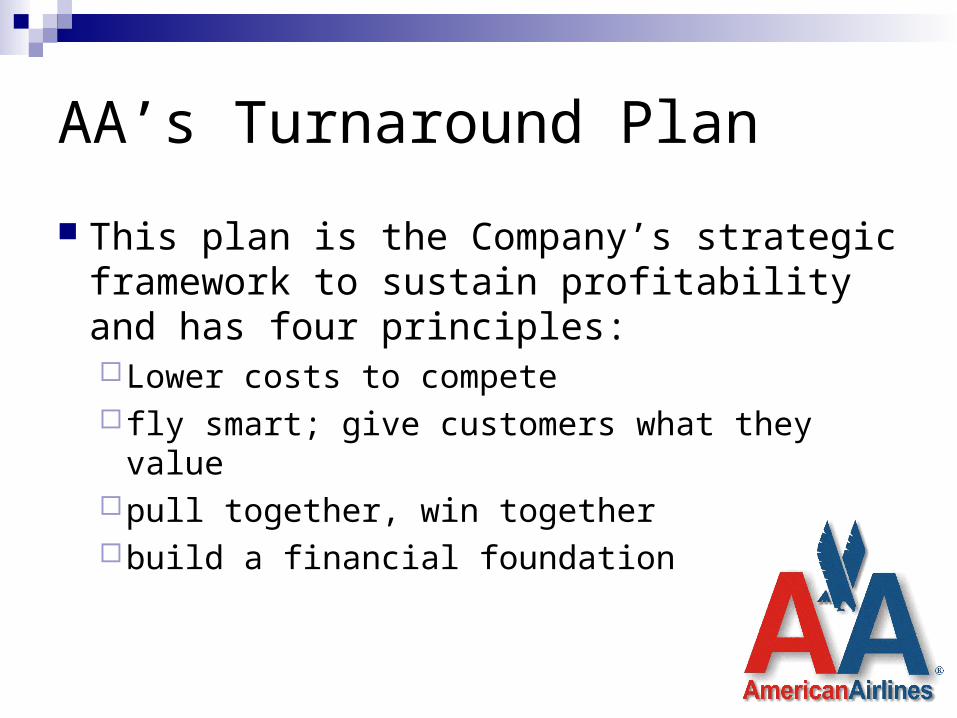
AA’s Turnaround Plan
This plan is the Company’s strategic framework to sustain profitability and has four principles: Lower costs to compete fly smart; give customers what they value pull together, win together build a financial foundation

Give Customers What They Value
This is a good strategic framework and puts AA on the right track if implemented correctly
The Issue: AA has been searching for additional sources of revenue
plus has been increasing existing revenues in already established sources. Some new revenue sources applied between 2002 and 2008 are “checked baggage service charges, flight change service charges, onboard food sales, single day passes for AAdmirals Club admission, reservations ticketing service charges, First Class upgrades on day of departure, and numerous other initiatives.”

(in millions, except per share amounts)
Year Ended December 31,
Revenues 2008 2007 2006Passenger - American Airlines 18,234 17,651 17,291
- Regional Affiliates 2,486 2,470 2,502
Cargo 874 825 827Other revenues 2,172 1,989 1,943
Total operating revenues 23,766 22,935 22,563
Passenger - American Airlines 18,234 17,651 17,291
AMR Corp. Consolidated Statements of Operations

Liquidity and Borrowing Capacity
American Airlines relies heavily on “liquidity and borrowing capacity” to sustain operations. AA has reduced its total debt from $13.2 billion in
2002 down to an even $11.0 billion in 2008. Cash and Short-term investments increased from
$900 million to $3.6 billion until 2008 when it decreased because of “debt repayments, increased fuel expense and fuel hedge collateral.”

Commercial Cooperation
AA entered into a business agreement with related marketing arrangements with British Airways, and Iberia. In this agreement they will pool and share
specific “revenues and costs on transatlantic flights, expanded codesharing on each other’s flights, enhanced frequent flyer program reciprocity, and cooperation in the areas of planning, marketing and certain operations.”

Fleet Renewal
The purchase agreements with Boeing will extend from 2009 through 2016 with a total of 94 aircraft, and “payments for the related aircraft purchase commitments will be approximately $1.0 billion in 2009, $1.1 billion in 2010, $355 million in 2011, $218 million in 2012, $417 million in 2013 and $584 million for 2014 and beyond.”

Sources of Financing
American Airlines describes primarily seven possible financing sources in their 10-K. They include: a limited amount of additional secured aircraft debt or sale
leaseback transactions involving owned aircraft debt secured by new aircraft deliveries debt secured by other assets securitization of future operating receipts the sale or monetization of certain assets unsecured debt issuance of equity and/or equity-like securities

Consequences of Obligations Limit the Company’s ability to obtain
additional funding for working capital, capital expenditures, acquisitions and general corporate purposes, and adversely affect the terms on which such funding could be obtained
Require the Company to dedicate a substantial portion of its cash flow from operations to payments on its indebtedness and other obligations, thereby reducing the funds available for other purposes
Make the Company more vulnerable to economic downturns
Limit the Company’s ability to withstand competitive pressures and reduce its flexibility in responding to changing business and economic conditions.
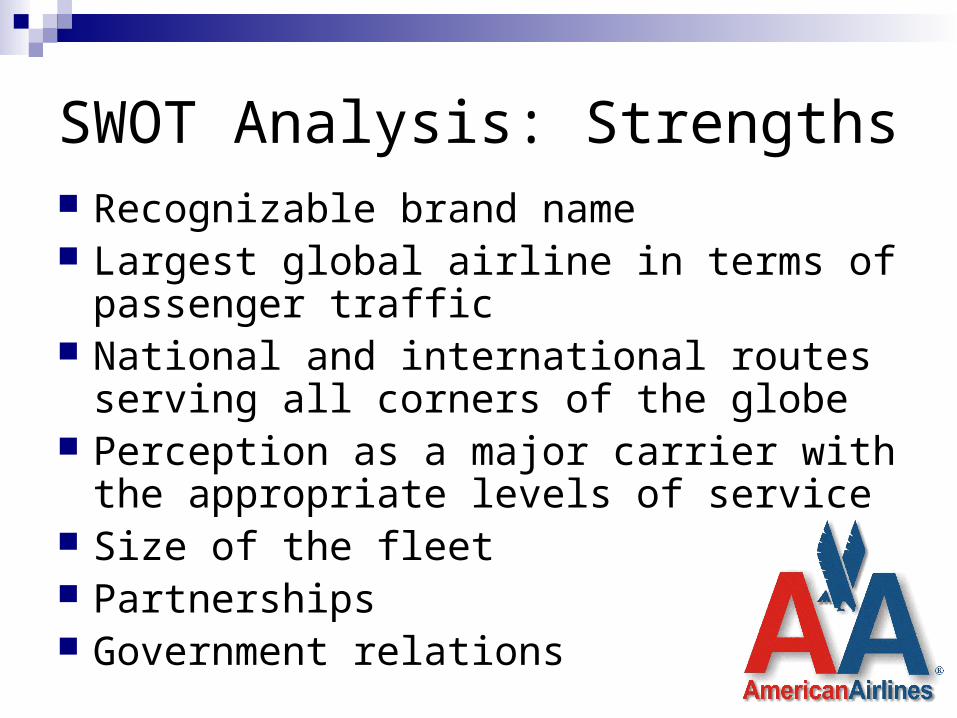
SWOT Analysis: Strengths Recognizable brand name Largest global airline in terms of passenger
traffic National and international routes serving all
corners of the globe Perception as a major carrier with the
appropriate levels of service Size of the fleet Partnerships Government relations
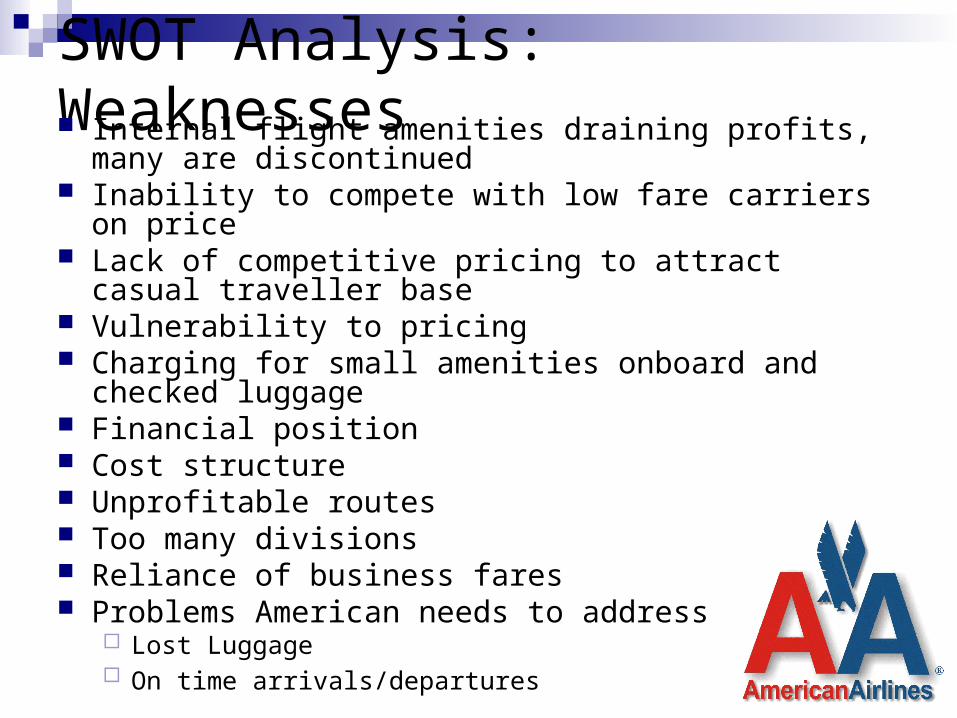
SWOT Analysis: Weaknesses Internal flight amenities draining profits, many are
discontinued Inability to compete with low fare carriers on price Lack of competitive pricing to attract casual traveller
base Vulnerability to pricing Charging for small amenities onboard and checked
luggage Financial position Cost structure Unprofitable routes Too many divisions Reliance of business fares Problems American needs to address
Lost Luggage On time arrivals/departures

SWAT Analysis: Opportunities Code sharing agreements with domestic
and international airlines SABRE ticketing system Presence at most airports American Eagle regional routes Rewarding route structure Government backed loans Information technology Partnerships with other airlines around
the world Fuel efficient engines

SWAT Analysis: Threats Thin operating margins favoring low fare carriers Public acceptance of low fare carrier concept Customer quality perception of low fare carriers that
exceeds the major airlines Prolonged slow economy favours low fare carrier
pricing structure Segmentation of the industry into business and
discount carrier classifications High fuel prices Government intervention Increased competition from point-to-point
competitors Availability of pricing information Overcapacity in industry

SWAT Analysis Matrix: S-O Strengths with Opportunities
Recognizable brand name is made possible by
Presence at most airports Even regional airports are serviced by American
Eagle National and international routes
A large fleet of airplanesPartnerships are already a great
strength for American Airlines, and an opportunity to partner with more airlines still exists

SWAT Analysis Matrix: S-T Strengths to Threats
Use IT to reduce the check-in and wait times on flights.
More curb-side check-ins at larger airports and e-tickets
Use current market position to reduce number of unprofitable flights and reduce industry capacity
Operating margins will increase for American from the low fare carriers
Overcapacity in industry will decrease

SWAT Analysis Matrix: W-O
Weaknesses to OpportunitiesSell unprofitable and smaller divisions to
improve financial position Create more partnerships with other airlines while
also improving financial position
Negotiate lower wage rates with unions to improve cost structure

SWAT Analysis Matrix: W-T Weakness to Threats
Make some operations point-to-point to improve cost structure and reduce customer inconvenience
Compete better with competition Eliminate unprofitable routes to improve
financial position Reduces industry capacity
Reduce vulnerability with pricing by improving customer quality perceptions
Pricing is vulnerable because of customers choosing low fare carriers instead of the quality carriers of major airlines
Market quality instead of cost

Competitive Advantage
American Airlines has few strong competitive advantages and even fewer that are sustainable
AA isn’t the low cost leader, and doesn’t have differentiated customer service techniques, but AMR is consistently been the pioneer of technology, marketing campaigns and ideas, and also uses its alliances as a competitive strategy.

The AAdvantage Program
In the 1980’s American Airlines started their “Frequent Flyer Program,” which is more widely known as “AAdvantage Travel Awards.”
This program gave “Frequent Flyers” discounts and even free tickets for flights when they accrued different levels of miles traveled. Quickly imitated by the competition

Alliances
American Airlines uses its alliances with the carriers in Canada, Mexico, and Europe to share costs and revenues. In this agreement they will pool and share
specific “revenues and costs on transatlantic flights, expanded codesharing on each other’s flights, enhanced frequent flyer program reciprocity, and cooperation in the areas of planning, marketing and certain operations.”

Pioneering Technology
1960’s-American Airlines® develops SABRE, the first totally automated computer reservations system, allowing American to match a seat sold on one of its flights to an individual customer
2001-AA.com offers proactive flight status notification to customers via a variety of wired and wireless devices. AA.com features hotel and car rental booking
service within the Travel Planning section. The site also offers weather updates, maps, driving directions and destination information for more than 200 destinations worldwide.

Pioneering Technology
2004-Flight Check-In at AA.com is enhanced - Customers can now check in up to 24 hours before their flight without even logging into the site by simply entering their first name, last name and record locator.
2008/9-One of the newest technological advances that AA is experimenting with is in-flight Wi-Fi.

Relative Cost Position
American ranks second in terms of cost per available seat mile
Number that is frequently used to allow a cost comparison between different airlines

Relative Cost Position, Cont.
In theory, the lower the CASM, the more profitable the airline should be
Available seat miles (ASM) is a measure of an airline flight’s passenger carrying capacity
Number of seats available x Number of miles flown

Operating Expenses

Cost Analysis: Aircraft
Main cost
Cost Analysis: Aircraft, Cont.

Cost Analysis: Aircraft, Cont.
Operating cost of aircraft

Cost Analysis: Aircraft, Cont. Average amount of revenue lost in a fiscal
year due to seats left vacant on flights

Cost Analysis: Jet Fuel
Costs American $77,000 to top off a Boeing 767 when the average price per gallon is $3.85
Average flight from JFK to LAX brings revenues of $54,000, jet fuel costs $34,000, and that leaves $20,000 for other expenses
American’s financial results and daily operations are significantly affected by the availability and price of jet fuel

Cost Analysis: Jet Fuel, Cont.

Cost Analysis: Jet Fuel, Cont. Hedging strategies – Airlines set prices for jet
fuel before using the fuel Good for when fuel prices are higher, bad for
when fuel prices drop below hedging price Dampens volatility of jet fuel prices

Cost Analysis: Jet Fuel, Cont.

Cost Analysis: Labor
Airline industry is labor intensive Wages, salaries, and benefits represented
26% of American’s operating expenses in 2008
Average number of full-time employees for 2008 was 84,100
Cost Analysis Employee Costs
American’s 2008 pension benefit obligations: $643 million
Increase of $66 million for 2009
2008 postretirement benefit obligations: $150 million
Increase of $16 million for 2009
Route Acquisition Costs 2008 route acquisition costs: $828 million Major acquisition was London Heathrow

American Airlines: Issues, Problems and Options

Issues and Problems at American and in the Airline Industry Largest Problem is the vicious competition
in the industry driving the profit potential down.The Graph on the next page illustrates this.

The graph clearly shows that profit margins have fallen severely over the last 20+ years.

Slim Profit Margins can be very dangerous Spike in fuel prices and/or a drop off in passenger
volumes can be fatal to even the biggest airlines.
Another problem the industry has is a loss of prestige Recently, airline travel has began to seem like a
glorified bus service. Many passengers do not care or even know what
airline they are on. Airlines no longer strive to create significant
differences in their service.

Solutions
To cope with the above problems, American needs to change their competitive strategySuggestions
Providing the best and most comfortable aircraft Disciplined hub and spoke system Reduce the frequency of flights

Three Strategy Options for the Future
1. Maintain the current strategy
2. Amend the current strategy
3. Develop a new strategy

Maintaining the Current Strategy Main Points of Strategy
Use of commuter/regional airline American Eagle to service many smaller cities, even those that are greater than 500 miles.
Poor domestic in-cabin service with no complementary hot or cold food, and petty charges for pillows, blankets and check baggage.
Competition on ticket price A la carte food purchasing service Aircraft fleet consisting of all twin engine
airplanes that carry from 50 to 350 passengers

Amending the Current Strategy First, re-allocate American Eagle flights
of 400+ miles to mainline service. This will help to save money by reducing
maintenance cost, landing fees and taxes, and crew costs
Reason: Smaller aircraft replaced with larger ones reduces the flight volume
Second, add more amenities to their domestic and international cabins. Food service on long domestic flights End petty charges on pillows and blankets No more charges on 1st or additional
checked or overweight bags

Third, improve upon the a la carte service Add more menu choices Make ordering possible from in-airport kiosk when
done 45 minutes prior to departure Fourth, fleet changes
Replace ageing MD-80s as they come up to their major overhaul dates
Replace medium sized aircraft on domestic routes with larger ones
Use larger aircraft on international flights, reducing the flight volume

A New Strategy American will change over from its current
strategy of competing on price and fighting directly with other major US airlines to one where they will compete on service, quality, and comfort, and with it, creating a blue ocean in the faltering airline industry
Plan is long-term and will take 10-20 years to be fully realized
Plan is an adaptation of Pan American’s strong international model with a strong domestic presence to complement it

Changes I. Small Cities 50 to 400 Nautical Miles from
Major Hubs - American should utilize America Eagle to fly to these cities from their regional hubs. Flights will have a drink and cold meal service when
flight is long enough Operated by 20-60 seat regional jets and turboprops
-Ex. EMB-120 Brasilia turboprop, EMB-135/145 regional jets

II. Medium size Domestic Cities- American will use its mainline service operating from their regional hubs. Aircraft used on these routes will be medium to large
single aisle airplanes with more leg room and seat pitch. -Ex. 737-800/900 series, 757, and MD-80s
Onboard services: In-flight entertainment in each seatback. (all three classes) Hot meals, snacks, and non-alcoholic beverages will be
provided free of charge Alcoholic beverages will be complementary in business and
first classes but will still have to be purchased in tourist class (formally coach).
Each destination will have 2-5 flights a day depending on traffic studies, seasonality studies, and distance.

III. Large Sized Domestic Cities, Alaska and Hawaii- American will utilize its mainline service operating from regional hubs. Aircraft used on these routes will be medium to
large wide bodies, ample leg room, and comfortable seat pitch. –Ex. 767, 777, A310, 787s
Onboard services: In-flight entertainment in each seatback in all three classes Hot meals, snacks, and non-alcoholic beverages will be provided
free of charge Alcoholic beverages will be complementary in business and first
classes but will still need to be purchased in tourist class. First class and business sections on the Hawaiian and Alaskan
flights will include flat seats due to the extended length of these flights.
Each destination will have 2-3 flights a day depending on traffic studies, seasonality studies, and distance.

IV. Canada, Mexico, and the Caribbean-American will utilize its mainline service, and their regional carrier American Eagle operating from their regional hubs in the United States. Aircraft used on these routes will range from the 50 seat
regional jets for the closest and smallest Mexican and Caribbean destinations to medium and large wide bodies for the larger cities in Canada and Mexico. – Ex. EMB- 135/145, 767, 777, A310, 787s
Onboard services: In-flight entertainment in each seatback in all three classes
(only in the wide bodies). Hot meals, snacks, and non-alcoholic beverages will be
provided free of charge. Snacks and Drinks but no hot meals will be provided on the
regional jets. Alcoholic beverages will be complementary in business and
first classes again but will still need to be purchased in tourist class, and on the regional jets (all one class configurations).
1-4 flights a day again based on traffic studies, seasonality studies, and distance.

V. Large International Cities- American will utilize its mainline service operating from its regional hubs. Aircraft used on these routes will be large wide bodied aircraft with the
same leg room and seat pitch modifications as mentioned above. –Ex. 747-400/800, and A380
Onboard services: In-flight entertainment in each seatback in all three classes. Hot meals, snacks, and non-alcoholic beverages will be provided free of
charge. Alcoholic beverages will be complementary in business and first classes
but will still need to be purchased in tourist class. First class will include travel cubicles for 2-3 people Business Class will have lie-flat seats. Each of the three classes will have a lounge area located somewhere in
that section of the aircraft. Lounges in first and business classes will have a small bar. Tourist class lounge will have couches and tables for card playing or easier
laptop use. Each destination will have 1-5 flights a day depending on traffic studies, seasonality studies, and distance. International flights will be considered the Premier service of American Airlines
VI. Medium to Small International Flights- Operates in a similar fashion to the medium and small domestic flights, but with some changes. Use large and medium international cities as
regional hubs when able. In areas where the destinations are too few
or it is not possible to create a regional hub American will use code sharing
In the areas that regional hubs are able to be used, the operations will essentially be the same as those used to fly to the medium to small size domestic destinations.
Aircraft utilized in this plan will vary from mid-sized wide bodies to very small short field capable turboprops. –Ex. 737-800/900, EMB-135/145, 757, 767, Dash 8, and the Dash 7 for extreme short fields.

New Regional Hub Plan
Regional hubs located in different regions of the world, some regions may require multiple hubs.
Five Proposed regions: North America, South America, Europe, Asia, and Pacific (Australia and the nearby Pacific Islands).
At each hub, American will provide local regional service via regional mainline service, regional American Eagle commuter service, and code-sharing when the volume cannot support their regional mainline, or commuter services.
Regional versions of American Airlines will be adapted to the region.

Simplified Visualization of New Regional Hub Plan

VII. Optional Ancillary Services- High end services such as heli-taxi services in large cities, catering, and resort purchases. Will be considered in select cities such as
New York, Tokyo, and London to improve passenger traffic and demand.

Benefits of Larger AircraftFlights Per 1000 Passengers
25
33
19
38
22
0
5
10
15
20
25
30
35
40
1
Flig
hts
747-400
777-200
A380
767-300
747-800

Graph shows the number of flights per aircraft type needed to fly 10,000 passengers.
Want to choose the aircraft that gives you the lowest number of flights because: The more flights you make, the more slots at the
corresponding airport you will have to purchase, and there will be fewer slots available for expansion and domestic services.
The more slots you own, the more money you will have to pay
Having more flights to carry the same amount of people will cost you money on ground fees such as parking fees, landing fees, ground service fees, and catering fees
Based on the information in this graph, American should use the A380, 747-400, and the 747-800 once available to serve its international destinations.

Conclusion
If American executes this plan properly, it will create a blue ocean for them because they will become the only airline that has the most comfortable planes, the best service, and the most comprehensive list of destinations in the world.