competition dynamics and regional trade flows in the ... six country... · 3.1 main cement...
TRANSCRIPT
1
Competition Dynamics and Regional Trade Flows in the Cement
Industry: The Case of Botswana, Kenya, Namibia, South Africa,
Tanzania and Zambia
An African Competition Forum Six Country Research Project
FINAL REPORT
21st November 2013
Prepared by Country Researchers:
Thabiso Mbongwe - Botswana
Benson O. Nyagol - Kenya
Taimi Amunkete - Namibia
Dr Michael Humavindu - Namibia
Junior Khumalo - South Africa
George Nguruse - Tanzania
Emmanuel Chokwe - Zambia
2
Table of Contents
1. Introduction ....................................................................................................................... 4
2. Background to the Cement Industry ............................................................................. 4
2.1 The nature of the cement product ........................................................................ 4
2.2 The cement production process ............................................................................ 5
2.3 Typical value chain in the cement industry .......................................................... 6
3. Structure of the Cement Industry within and across the six countries ...................... 8
3.1 Main cement producers within each country and across the six countries,
and location and size of their operations ........................................................................ 8
3.1.1 Ownership structure within and across the six countries .............................. 8
3.1.2 Location of operations and their size ........................................................... 10
3.2 Vertical integration ................................................................................................. 13
3.3 Trade flows ............................................................................................................... 16
3.3.1 Volumes traded and their source ................................................................. 16
4. Regulatory Environment ................................................................................................ 22
4.1 The role of government.......................................................................................... 22
4.2 Trade restrictions ..................................................................................................... 22
4.3 Industry associations ............................................................................................... 23
5. Cement Prices and Volumes ........................................................................................ 24
5.1 Prices, margins and pricing strategies ................................................................. 24
5.1.1 Pricing ................................................................................................................ 24
5.1.2 Pricing strategies .............................................................................................. 31
5.1.3 Margin analysis ................................................................................................. 34
5.1.4 Consolidated regional price analysis ........................................................... 35
6. Competition Issues in the Six Countries ....................................................................... 36
6.1 Barriers to entry ........................................................................................................ 36
6.2 Competition concerns ........................................................................................... 39
6.2.1 Domestic concerns within each country ..................................................... 39
6.2.2 Concerns from a regional perspective ........................................................ 41
7. Conclusion ...................................................................................................................... 41
3
Table of figures
Figure 1: Cement production process .................................................................................. 5
Figure 2: Cement value chain ............................................................................................... 8
Figure 3: Botswana’s clinker imports ................................................................................... 17
Figure 4: Kenya’s world trade in cement (2006 – 2010) ................................................... 18
Figure 5: South Africa’s world trade in cement (2001 – 2011) ......................................... 20
Figure 6: South Africa’s exports of Cement (2001 to 2011) .............................................. 20
Figure 7: Tanzania’s world trade in cement (2000 – 2011) ............................................... 21
Figure 8: Zambia’s world trade in cement (2000 – 2011) ................................................. 21
Figure 9: Botswana average annual cement prices by different locations (Pula per
50kg bag) ............................................................................................................................... 24
Figure 10: Prices to a major retailer in Botswana for bagged cement (3-mma) ......... 25
Figure 11: Kenya quarterly cement prices (Kenyan Shillings per 50kg bag) ................. 26
Figure 12: Cement wholesale prices in various regions of Kenya ................................... 26
Figure 13: Cement retail prices in various regions of Kenya ............................................ 27
Figure 14: Namibian annual average ex-factory gate prices (N$) ................................ 27
Figure 15: Prices to a major retailer in Namibia for bagged cement (3-mma) ............ 28
Figure 16: Prices to a major retailer in South Africa for bagged cement (3-mma) ..... 29
Figure 17: Cement prices before and after government interventions ......................... 30
Figure 18: Zambia ex-factory price trend for the three players in the sector ............... 31
Figure 19: PPC’s margins from cement operations ........................................................... 34
Figure 20: Estimated ex-factory cement prices in five of the six countries in US$ (2000 –
2012) ........................................................................................................................................ 35
Figure 21: Estimated retail cement prices in five of the six countries in US$ (2006 –
2012) ........................................................................................................................................ 36
4
1. Introduction
In a speech delivered recently at a conference in India1, Frederic Jenny, Chairman of
the Organisation for Economic Cooperation and Development’s (OECD)
Competition Committee highlighted the fact that an increasing number of cartel
investigations being conducted by competition authorities are global in scope. An
large number of regional economic groupings, such as the Southern African Customs
Union (SACU), Common Market for Eastern and Southern Africa (COMESA), Southern
African Development Community (SADC), etc. have adopted competition articles in
their agreements as they recognise the increasing cross-border nature of
anticompetitive conduct.
It is in this context that the African Competition Forum (ACF) launched the six country
(Botswana, Kenya, Namibia, South Africa, Tanzania and Zambia) research project
covering three industries; cement, poultry and sugar. This report covers all the six
countries in the project and looks at cement. It is structured at follows: section 2
presents a short background to the cement industry, section 3 looks at the structure
of the cement industries in each of the six countries, section 4 discusses regulatory
issues in the six countries, in section 5 we present an analysis of cement prices in the
six countries, section 6 looks at competition issues within each other, juxtaposed
against competition developments in the region. Section 7 provides concluding
remarks.
2. Background to the Cement Industry
2.1 The nature of the cement product
Cement is mainly a homogenous product, produced in the same way by all the
players in the industry. However, by using an extender (such as slag or fly ash) cement
manufacturers can produce blended products (typically cement sold in bags) that
differ in strengths.
Cement is a relatively low value, high weight product that is expensive to transport by
land. Transport costs can be as much as 30% of the product price2. Because of its
weight, cement supply is ideally limited to an area within a 50km radius of any one-
plant site, but can be delivered beyond a 300km radius in special circumstances.
However, notwithstanding the localised nature of the industry, cement producers
within the different countries in the region are able to export surplus cement to their
neighbours in the region.
1 The 3rd Biennial International Conference on Competition organised by CUTS and CIRC. 2 Whoownswhom 2010
5
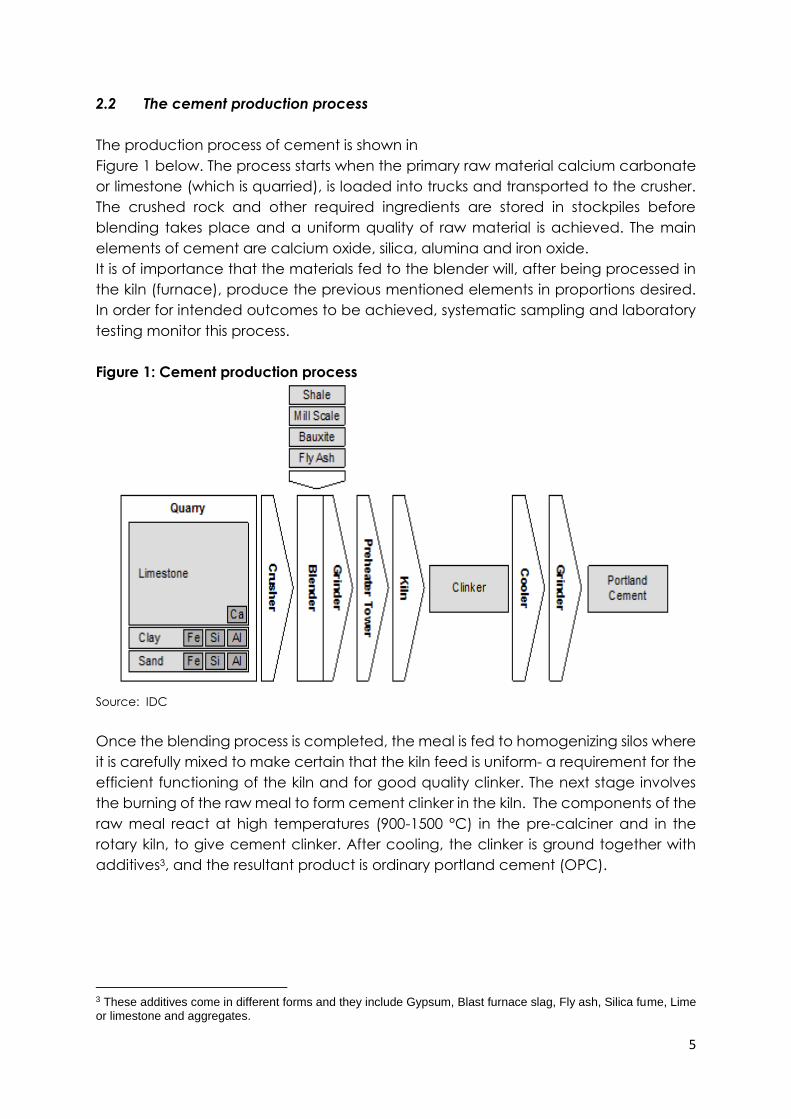
2.2 The cement production process
The production process of cement is shown in
Figure 1 below. The process starts when the primary raw material calcium carbonate
or limestone (which is quarried), is loaded into trucks and transported to the crusher.
The crushed rock and other required ingredients are stored in stockpiles before
blending takes place and a uniform quality of raw material is achieved. The main
elements of cement are calcium oxide, silica, alumina and iron oxide.
It is of importance that the materials fed to the blender will, after being processed in
the kiln (furnace), produce the previous mentioned elements in proportions desired.
In order for intended outcomes to be achieved, systematic sampling and laboratory
testing monitor this process.
Figure 1: Cement production process
Source: IDC
Once the blending process is completed, the meal is fed to homogenizing silos where
it is carefully mixed to make certain that the kiln feed is uniform- a requirement for the
efficient functioning of the kiln and for good quality clinker. The next stage involves
the burning of the raw meal to form cement clinker in the kiln. The components of the
raw meal react at high temperatures (900-1500 °C) in the pre-calciner and in the
rotary kiln, to give cement clinker. After cooling, the clinker is ground together with
additives3, and the resultant product is ordinary portland cement (OPC).
3 These additives come in different forms and they include Gypsum, Blast furnace slag, Fly ash, Silica fume, Lime or limestone and aggregates.
6
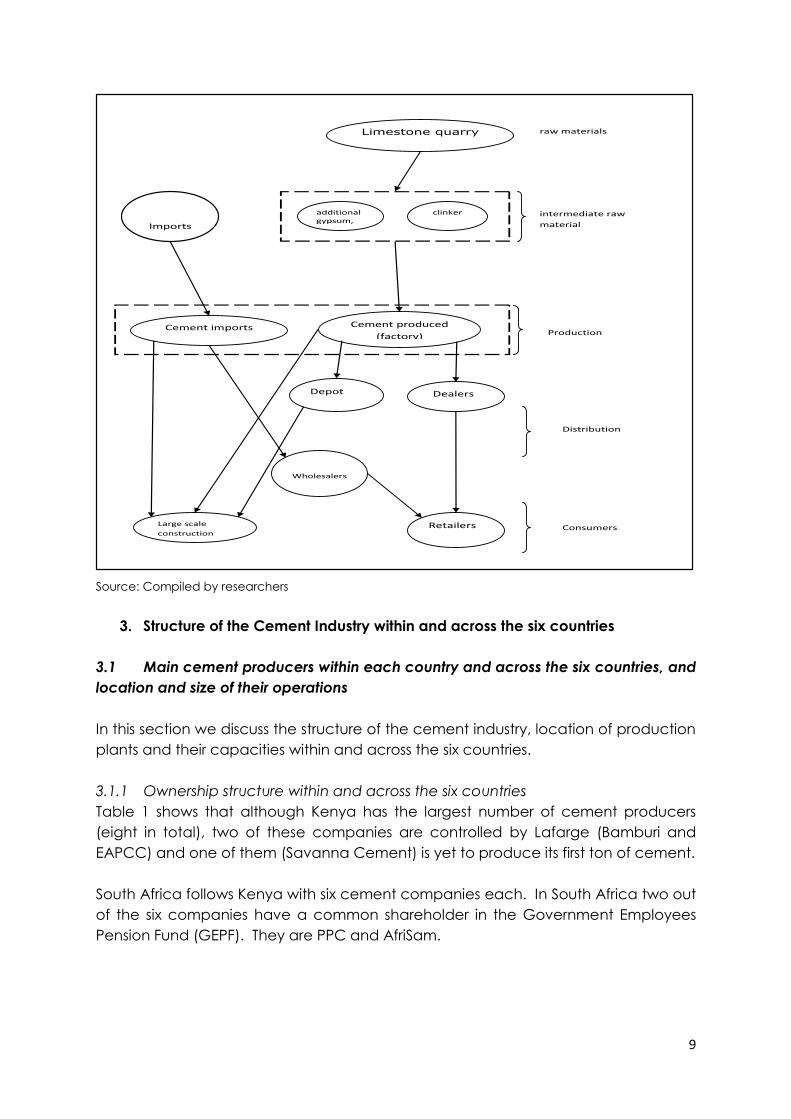
2.3 Typical value chain in the cement industry
In all the six countries that are subject of this study, the value chains that facilitate the
flow of cement products have similar structures or functions, with some variations
occurring mainly in the supply of raw material for cement production (see
Figure 2). As mentioned, the main raw materials in use are limestone and fly ash, while
the end raw material is clinker. Limestone is mined from quarries while fly ash (an
electricity generation by-product) is often obtained either directly from electricity
supply companies or indirectly through middlemen. Most cement producing factories
have clinker producing capabilities where they process limestone to obtain clinker,
but in other instances factories are merely grinding facilities that source clinker from
external suppliers with excess clinkering capacity or they import the clinker into the
country.
In fact, in some countries factories do not produce cement at all, but specialise
instead in producing clinker for sale into the open market.
Cement producers in Namibia, Kenya, Zambia and South Africa also sell clinker.
South African cement factories also sell clinker to Botswana (which imports most if not
all of its clinker) and in Tanzania all producers have grinding capacity larger than their
clinker production capacity and therefore occasionally import from other countries.
Across the six countries, cement producers usually have a physical presence in the

7
countries in which they operate, but they also serve external export markets. There
are also large amounts of cement that is imported by either independent trading
companies or large scale consumers who import cement for their projects.
As mentioned, cement is expensive to transport, with a low value-to-weight ratio.
Transportation and distribution logistics are therefore an important element in the
value chain. Cement needs to be made available to consumers wherever they are
in the right price and quantities. The distribution channels vary widely, not only across
countries but also between companies within particular countries. The most common
distribution models involve the use of producers’ own depots, dealership
arrangements, subsidiary companies and direct supply. Traditionally, depots are
often owned and operated by cement producing companies themselves or by
subsidiary companies. Depots often offer cement at ex-factory prices, a relatively
lower price than the retail market would often guarantee. The dealership
arrangement is organized through contracts agreement between producers and
established trading companies. Distribution through subsidiary companies operates
when a cement producing company uses its subsidiary to distribute the cement
consignment. Direct sales to consumers (where producers deliver the cement directly
to consumers) are usually feasible with large scale consumers such as large
construction projects that require substantial amounts of cement in bulk.
The distribution patterns for locally produced and imported cement across the studied
countries are in many ways identical. For instance depot distribution is widely used by
producers in Tanzania, Kenya and South Africa.
In Tanzania all big producers supply cement within and outside the country through
the use of depots. They also use depots to serve some regional markets within the
country. Depots can also be operated by subsidiary companies, the model widely
used by the AfriSam Consortium, Lafarge, Ohorongo and Sino Cement who all export
cement from their home countries to Botswana. In Tanzania, one player uses
established logistics companies to handle all of its transportation logistics. Dealership
arrangements between producers and business firms are used in Tanzania, Zambia,
Kenya, Botswana and South Africa.
This distribution method is normally regulated by exclusive agreements between
producers and firms doing the business. The arrangement is associated with upward
movement of retail prices, as dealers raise retail price to reflect the transportation cost
and their margin. In some instances, it was established that producers give indicative
retail prices to their dealers. To ensure retail prices are maintained producers
compensate dealers for transport costs by offering ex-factory price discounts
depending on distance from the factory.
Another distribution model is the direct supply to especially large scale consumers. It
entails transporting cement direct to customers, most of whom are construction
companies. Cement is transported directly to construction sites where it is offloaded
to mini silos which are usually installed at the construction site. This is feasible when

8
consumption and production points are in close proximity. Sales to small scale private
use by individuals usually are conducted through 50kg bags distributed through retail
outlets.
Figure 2: Cement value chain
9
Source: Compiled by researchers
3. Structure of the Cement Industry within and across the six countries
3.1 Main cement producers within each country and across the six countries, and
location and size of their operations
In this section we discuss the structure of the cement industry, location of production
plants and their capacities within and across the six countries.
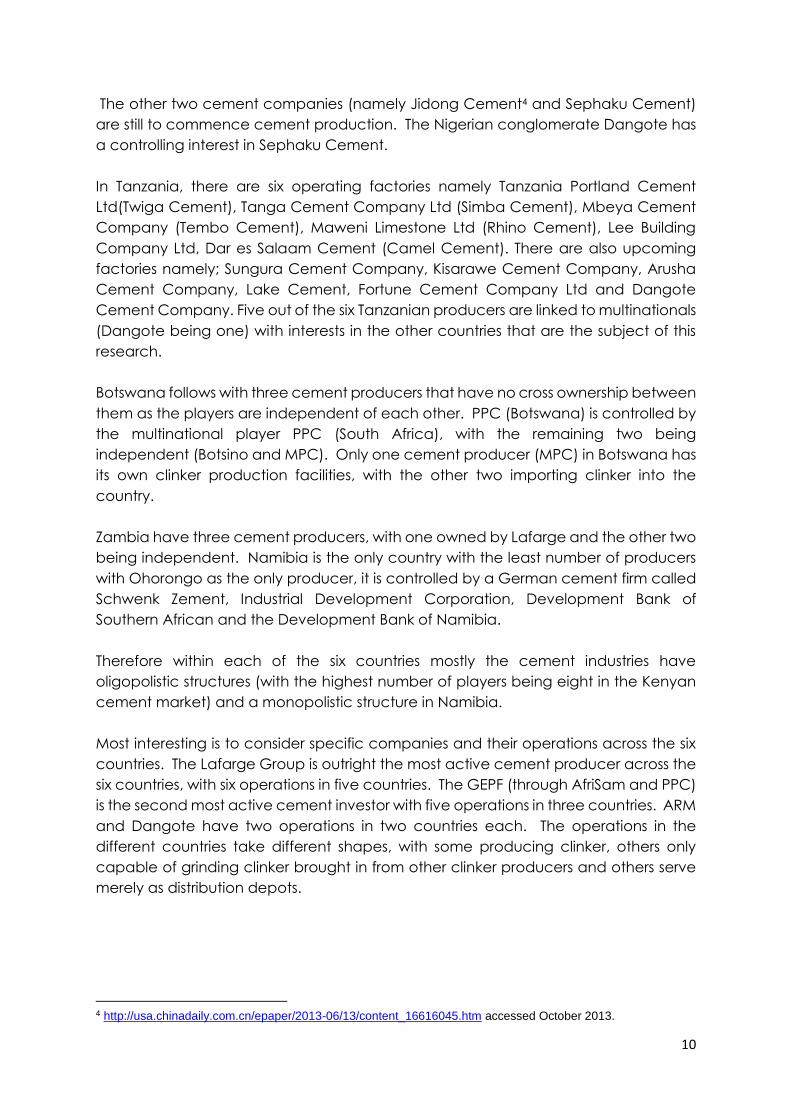
3.1.1 Ownership structure within and across the six countries
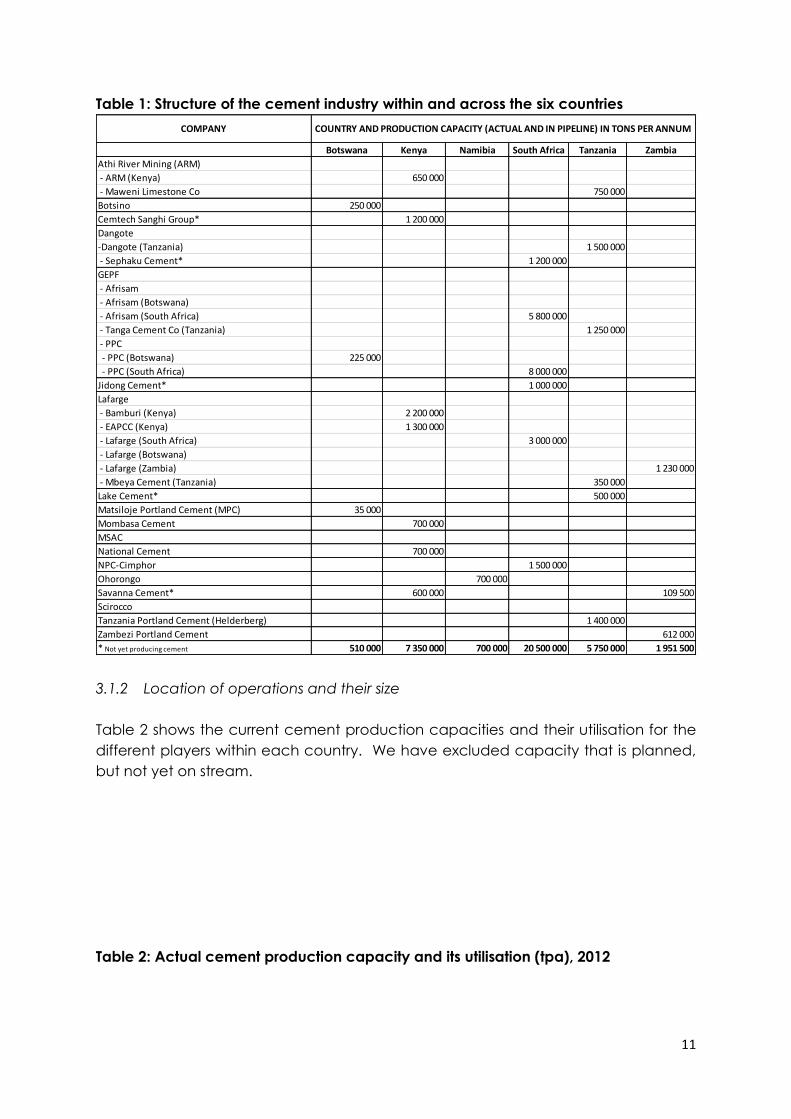
Table 1 shows that although Kenya has the largest number of cement producers
(eight in total), two of these companies are controlled by Lafarge (Bamburi and
EAPCC) and one of them (Savanna Cement) is yet to produce its first ton of cement.
South Africa follows Kenya with six cement companies each. In South Africa two out
of the six companies have a common shareholder in the Government Employees
Pension Fund (GEPF). They are PPC and AfriSam.
Limestone quarry
Depot
Large scale
construction
projects
Cement imports Cement produced
(factory)
Dealers
Retailers
Wholesalers
Imports
Production
additional gypsum, fly ash
clinker
Distribution
intermediate raw
material
raw materials
Consumers
10
The other two cement companies (namely Jidong Cement4 and Sephaku Cement)
are still to commence cement production. The Nigerian conglomerate Dangote has
a controlling interest in Sephaku Cement.
In Tanzania, there are six operating factories namely Tanzania Portland Cement
Ltd(Twiga Cement), Tanga Cement Company Ltd (Simba Cement), Mbeya Cement
Company (Tembo Cement), Maweni Limestone Ltd (Rhino Cement), Lee Building
Company Ltd, Dar es Salaam Cement (Camel Cement). There are also upcoming
factories namely; Sungura Cement Company, Kisarawe Cement Company, Arusha
Cement Company, Lake Cement, Fortune Cement Company Ltd and Dangote
Cement Company. Five out of the six Tanzanian producers are linked to multinationals
(Dangote being one) with interests in the other countries that are the subject of this
research.
Botswana follows with three cement producers that have no cross ownership between
them as the players are independent of each other. PPC (Botswana) is controlled by
the multinational player PPC (South Africa), with the remaining two being
independent (Botsino and MPC). Only one cement producer (MPC) in Botswana has
its own clinker production facilities, with the other two importing clinker into the
country.
Zambia have three cement producers, with one owned by Lafarge and the other two
being independent. Namibia is the only country with the least number of producers
with Ohorongo as the only producer, it is controlled by a German cement firm called
Schwenk Zement, Industrial Development Corporation, Development Bank of
Southern African and the Development Bank of Namibia.
Therefore within each of the six countries mostly the cement industries have
oligopolistic structures (with the highest number of players being eight in the Kenyan
cement market) and a monopolistic structure in Namibia.
Most interesting is to consider specific companies and their operations across the six
countries. The Lafarge Group is outright the most active cement producer across the
six countries, with six operations in five countries. The GEPF (through AfriSam and PPC)
is the second most active cement investor with five operations in three countries. ARM
and Dangote have two operations in two countries each. The operations in the
different countries take different shapes, with some producing clinker, others only
capable of grinding clinker brought in from other clinker producers and others serve
merely as distribution depots.
4 http://usa.chinadaily.com.cn/epaper/2013-06/13/content_16616045.htm accessed October 2013.
11
Table 1: Structure of the cement industry within and across the six countries
3.1.2 Location of operations and their size
Table 2 shows the current cement production capacities and their utilisation for the
different players within each country. We have excluded capacity that is planned,
but not yet on stream.
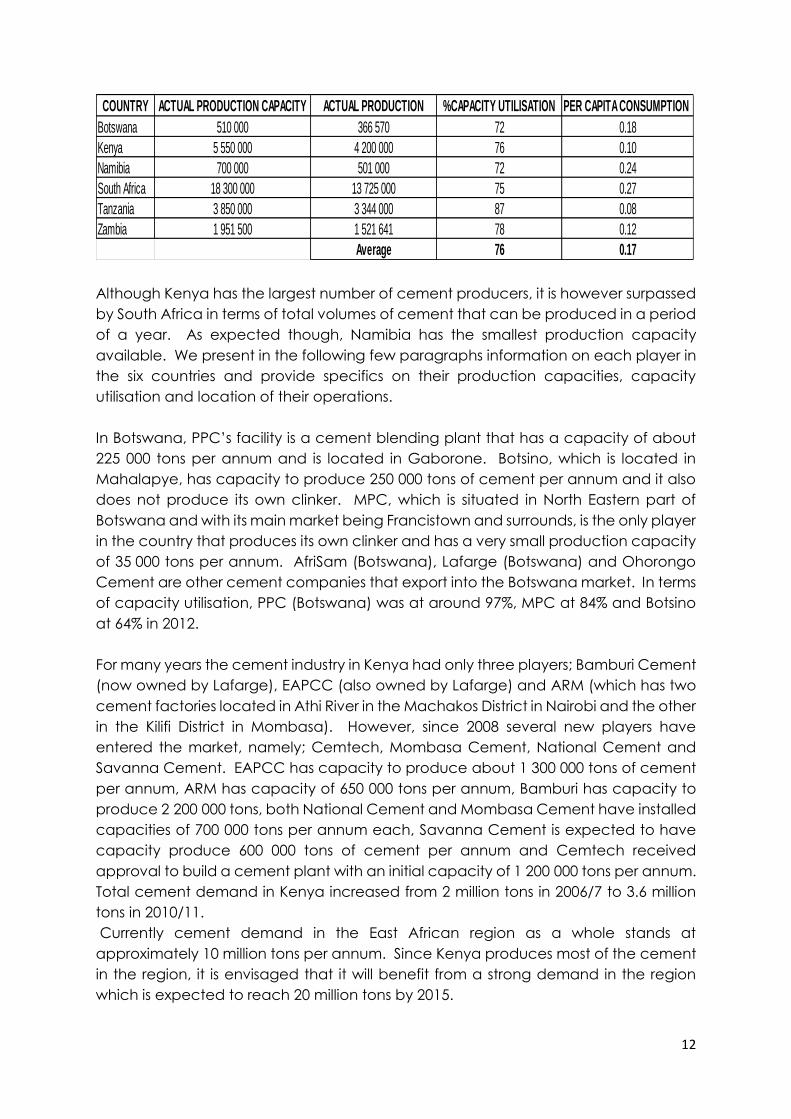
Table 2: Actual cement production capacity and its utilisation (tpa), 2012
Botswana Kenya Namibia South Africa Tanzania Zambia
Athi River Mining (ARM)
- ARM (Kenya) 650 000
- Maweni Limestone Co 750 000
Botsino 250 000
Cemtech Sanghi Group* 1 200 000
Dangote
-Dangote (Tanzania) 1 500 000
- Sephaku Cement* 1 200 000
GEPF
- Afrisam
- Afrisam (Botswana)
- Afrisam (South Africa) 5 800 000
- Tanga Cement Co (Tanzania) 1 250 000
- PPC
- PPC (Botswana) 225 000
- PPC (South Africa) 8 000 000
Jidong Cement* 1 000 000
Lafarge
- Bamburi (Kenya) 2 200 000
- EAPCC (Kenya) 1 300 000
- Lafarge (South Africa) 3 000 000
- Lafarge (Botswana)
- Lafarge (Zambia) 1 230 000
- Mbeya Cement (Tanzania) 350 000
Lake Cement* 500 000
Matsiloje Portland Cement (MPC) 35 000
Mombasa Cement 700 000
MSAC
National Cement 700 000
NPC-Cimphor 1 500 000
Ohorongo 700 000
Savanna Cement* 600 000 109 500
Scirocco
Tanzania Portland Cement (Helderberg) 1 400 000
Zambezi Portland Cement 612 000
* Not yet producing cement 510 000 7 350 000 700 000 20 500 000 5 750 000 1 951 500
COMPANY COUNTRY AND PRODUCTION CAPACITY (ACTUAL AND IN PIPELINE) IN TONS PER ANNUM
12
Although Kenya has the largest number of cement producers, it is however surpassed
by South Africa in terms of total volumes of cement that can be produced in a period
of a year. As expected though, Namibia has the smallest production capacity
available. We present in the following few paragraphs information on each player in
the six countries and provide specifics on their production capacities, capacity
utilisation and location of their operations.
In Botswana, PPC’s facility is a cement blending plant that has a capacity of about
225 000 tons per annum and is located in Gaborone. Botsino, which is located in
Mahalapye, has capacity to produce 250 000 tons of cement per annum and it also
does not produce its own clinker. MPC, which is situated in North Eastern part of
Botswana and with its main market being Francistown and surrounds, is the only player
in the country that produces its own clinker and has a very small production capacity
of 35 000 tons per annum. AfriSam (Botswana), Lafarge (Botswana) and Ohorongo
Cement are other cement companies that export into the Botswana market. In terms
of capacity utilisation, PPC (Botswana) was at around 97%, MPC at 84% and Botsino
at 64% in 2012.
For many years the cement industry in Kenya had only three players; Bamburi Cement
(now owned by Lafarge), EAPCC (also owned by Lafarge) and ARM (which has two
cement factories located in Athi River in the Machakos District in Nairobi and the other
in the Kilifi District in Mombasa). However, since 2008 several new players have
entered the market, namely; Cemtech, Mombasa Cement, National Cement and
Savanna Cement. EAPCC has capacity to produce about 1 300 000 tons of cement
per annum, ARM has capacity of 650 000 tons per annum, Bamburi has capacity to
produce 2 200 000 tons, both National Cement and Mombasa Cement have installed
capacities of 700 000 tons per annum each, Savanna Cement is expected to have
capacity produce 600 000 tons of cement per annum and Cemtech received
approval to build a cement plant with an initial capacity of 1 200 000 tons per annum.
Total cement demand in Kenya increased from 2 million tons in 2006/7 to 3.6 million
tons in 2010/11.
Currently cement demand in the East African region as a whole stands at
approximately 10 million tons per annum. Since Kenya produces most of the cement
in the region, it is envisaged that it will benefit from a strong demand in the region
which is expected to reach 20 million tons by 2015.
COUNTRY ACTUAL PRODUCTION CAPACITY ACTUAL PRODUCTION %CAPACITY UTILISATION PER CAPITA CONSUMPTION
Botswana 510 000 366 570 72 0.18
Kenya 5 550 000 4 200 000 76 0.10
Namibia 700 000 501 000 72 0.24
South Africa 18 300 000 13 725 000 75 0.27
Tanzania 3 850 000 3 344 000 87 0.08
Zambia 1 951 500 1 521 641 78 0.12
Average 76 0.17
13
Ohorongo Cement is the sole cement producer in Namibia; it commenced its
operations in December 2010. It has production capacity of 700 000 tons per annum.
Prior to the establishment of Ohorongo Cement, the Namibian cement market was
supplied by the South African cement producer AfriSam, which covered 95 per cent
of the Namibian market.
A very large proportion of cement demand in Namibia comes from the greater
Windhoek, Walvis Bay, Swakopmund and the northern parts of the country. These
markets are all very distant (for example about 1 645 km in the case of Windhoek)
from what was the source of cement, Afrisam’s Ulco cement plant situated near
Kimberley in the Northern Cape Province of South Africa.
The South African cement producer PPC has 9 cement manufacturing plants and 3
milling depots in South Africa, Botswana, Rwanda and Zimbabwe. It also has a 27 per
cent shareholding in Ethiopia’s Habesha Cement Company. It has a capacity to
produce about 8 000 000 tons of cement per annum. Its nearest rival, AfriSam, has
capacity to produce 5 800 000 tons per annum. Lafarge is the third largest cement
producer in South Africa; it has a clinker facility in Lichtenburg and grinding facilities in
Richards Bay and Randfontein. It can produce a total of 3 000 000 tons of cement
per annum. NPC-Cimpor is currently the fourth largest cement producer in South
Africa. It has manufacturing facilities in Durban, Newcastle and Port Shepstone, which
are all situated in the KwaZulu-Natal province of South Africa. Recently there has
been new entrants in the South African cement market, namely Sephaku Cement
(with a 1 200 000 tons per annum facility in Lichtenburg and a grinding facility in
Delmas) and Jidong (which is expected to produce about 1 000 000 tons of cement
per annum at its facility in the Limpopo province).
There are currently six active cement producing firms in Tanzania, namely Tanzania
Portland Cement, Tanga Cement, Mbeya Cement, Maweni Cement, Dar es Salaam
Cement and Lee Building Materials. There have also been six entrants in the Tanzanian
cement market in the name of Sungura Cement, Kisarawe Cement, Arusha Cement,
Lake Cement, Fortune Cement and Dangote (the Nigerian multinational firm), all are
yet to commence production. Tanzania Portland Cement is located in Dar es Salaam
City with a facility to produce 1 400 000 tons of cement per annum, Tanga Cement
has operations in the Tanga region (which is about 354 km from Dar es Salaam) and
can produce 1 250 000 tons of cement per annum, whilst Mbeya Cement has
operations in the Mbeya region (which is about 851 km from Dar es Salaam) and can
produce 350 000 tons of cement per annum. Cement manufacturers in Tanzania
have consistently maintained that they have been operating above their capacities,
attributing high prices primarily to the supply-demand mismatch.
However, this is contrary to evidence showing that the cement industry has been
operating below capacity, albeit having been near full capacity during the 2007
cement crisis.
In Zambia, Lafarge has two cement plants, one in the Chilanga District in Lusaka
province and the other in the Copperbelt province’s Ndola town. The two plants have

14
a combined installed capacity of 1 230 000 tons per annum, and are both operating
at about 80 per cent of the capacity. Zambezi Portland Cement is the second largest
cement producer in Zamibia, with the capacity to produce about 612 000 tons of
cement per annum at its Ndola town plant. It is operating at 73 per cent capacity.
The third cement player in Zambia is Scirocco, with one plant in Makeni (in the outskirts
of Lusaka province). It has installed capacity to produce about 109 500 tons of
cement per annum and is currently utilising about 83 per cent of that capacity.
In summary, Table 2 shows that in all the six countries overall capacity utilisation was
above 70 per cent in 2012.
3.2 Vertical integration
Usually, firms operating in markets do not sell their products directly to the end
consumer, but through various intermediaries such as wholesalers and retailers. Also,
the final product is often manufactured in stages, from raw materials, to intermediate
good, to the final product (Motta, 2004). Vertical integration describes the ownership
or control5 by a firm of different stages of the production process, for example cement
producers in the upstream mining limestone (an important raw material input in the
production of cement) and/or owning in the downstream the terminal storage and
distribution facilities6.
As we discuss in the following paragraphs, the cement producers in the six countries
tend to adopt disparate business models, ranging from those that procure clinker from
other producers and then manufacture Portland cement, to those that have their own
limestone quarries and also engage in wholesale distribution of the final product.
Economic literature identifies several potential anticompetitive effects from vertical
integration, such as foreclosure and also the potential to facilitate collusion.
Botswana
In Botswana, PPC is planning to explore for cement grade limestone, it is also involved
in ready mix concrete production. Botsino is not vertically integrated. Botswana has
limited limestone deposits, which is controlled only by MPC in its Matsiloje Quarry.
Therefore, the other manufacturers have to source fly ash and clinker material from
neighbouring countries. The available limestone is in small quantities which would not
be enough for all the producers.
Kenya
5 This can also be achieved through vertical contracts or what is referred to as vertical restraints. 6 This is also referred to as "backward integration” or “forward integration”.
15
In Kenya, most of the cement manufacturers are becoming vertically integrated by
producing clinker (an intermediate product) as well as cement (the final product).
Some of the vertically integrated cement firms are Bamburi, EAPCC, ARM, Mombasa
Cement and recently National Cement (which is establishing a clinker plant). Some
companies like EAPCC are in the process of expanding their total clinker production
so as to reduce costs on imported clinker. New entrants, who start only with a grinding
plant, find that their capital requirements become high due to the need to import
clinker expensively. Therefore new non-vertically integrated firms become less
profitable compared to the fully integrated firms. This has necessitated other new
entrants to establish both a clinker and a clinker grinding plant at the point of entry,
which requires a very high level of capital and therefore may create a barrier to new
entry.
There are more than 27 major crystalline limestone occurrences in Kenya, reported
from meta-sedimentary gneiss sequence of the Mozambique Belt (Bosse, 1996).
Limestone mining is therefore done in various parts of the country but more in the
coastal region and the areas near Nairobi. The firms in the coast have clinker plants
in the coastal region and have established grinding plants at Athi River (near Nairobi).
Other firms, such as EAPCC and National Cement, have mining sites at Athi River
where they have established both clinker and cement plants. Most of the cement
companies own the land on which they mine limestone and a few (such as National
Cement) mine limestone on leased land.
Namibia
Ohorongo Cement is directly involved in the extraction of limestone. The company
has a limestone mine near its production plant situated not far from Otavi in northern
Namibia. It also undertakes de-bushing to produce wood chips, which is an input into
the manufacturing process. The company has undertaken to replace 100 per cent of
its current fuel usage with wood chips harvested from encroacher bush as an
alternative source of energy and is currently at the 20 per cent mark.
South Africa
In South Africa all the cement producers are vertically integrated, from the raw
material inputs (such as limestone, fly-ash and slagment) to cement, aggregates and
readymix concrete. Limestone is an important input into the cement manufacturing
process and therefore it is important to have easy access to it and also in enough
volumes. The new entrant Sephaku Cement indicated that limestone is a very scarce
resource in South Africa, but it managed to secure supplies from the mining firm Anglo
American. Other limestone deposits are far from the main markets.
Further, what emerged from the South African cement cartel investigation was that
forward integration into readymix was used by the cement producers to divide the
cement market by selling cement into each other’s’ readymix concrete operations.

16
The investigation also uncovered that the cement producers had planned to curtail
the activities of cement blending firms that buy clinker from them for further processing
into cement. They would however enter into vertical agreements to sell or grind
clinker for each other as the primary cement producers.
Tanzania
Each cement producer in Tanzania that produces clinker has its own source of
limestone or pozolana, facilities for producing and grinding clinker. Further, one of the
manufacturers uses its sister company for the distribution of cement and the other two
operate their own distribution depots. Furthermore, all three cement producers in
Tanzania use wholesalers to distribute their products. The wholesaler arrangement is
such that costs of transport and the associated risks are solely the responsibility of the
wholesalers/distributors.
Zambia
In the Zambian cement market Lafarge Cement indicated that they are directly
integrated into the following raw materials, namely limestone and shale, at their
quarries and the rest of the raw materials are either acquired from other firms on the
domestic market or imported from outside Zambia. For example, coal is locally
produced from Mamba collieries and column coal mines in the southern province,
gypsum from Chambishi mine on the Copperbelt province, and saw dust from Ndola
city council, on the Copperbelt province.
In terms of other raw materials such as bauxite, it is imported from Mozambique and
when there is a shortage of coal locally, it is imported from Hwange, Zimbabwe.
As for Scirocco Cement and Zambezi Portland Cement they are also vertically
integrated into the input market. However, it would appear that the companies in the
cement sector in Zambia have common vertical integration in terms of the input
market, thus, regardless of the level of operation, each firm faces the cost of buying
other raw materials from either the domestic or foreign market.
For raw materials/inputs for which the cement firms are vertically integrated they do
not sell these inputs to each other, instead they feed into their own operations. As
such, instances of abuse of market power which may lead to discrimination in terms
of pricing of the raw materials in which firms are vertically integrated may not arise.
Thus, it would appear that there is fair competition in terms of the input market for the
competitors in the cement sector.
Summary on vertical integration
17
In summary, it is clear from each of the six countries that with new entrants most
beginning their cement production process at the grinding and blending stages, they
find that their capital requirements are high due to the need for sourcing clinker from
their competitors or importing it into the country. This makes the new non-vertically
integrated firms to be less profitable compared to the fully integrated firms. With
clinker comprising about 95 per cent of the cost of inputs in cement manufacturing, it
is essential for companies to vertically integrate. Furthermore, in cases where there
are other vertical arrangements, such as for example between a cement producer
and an important distributor of cement, that may be a source of concern as due to
the potential adverse effect on competition especially where those arrangements
have exclusive clauses.
3.3 Trade flows
3.3.1 Volumes traded and their source
While all countries studied have some amount of imports, countries such as Botswana
and Namibia stand out in having significant amounts of cement being imported. The
importation is done by entrepreneurial individuals or companies and large scale
consumers of cement. When significant amounts of cement are imported, usually
there is a backlash from local incumbent cement producers, either lobbying the
government for imposition of import duties or the producers react directly by
aggressively lowering prices. For example, in Namibia and Tanzania local producers
lobbied their governments for protection, arguing that the increased imports may kill
the local industry. We present in the following few paragraphs cement trade flows for
each of the six countries.
Botswana
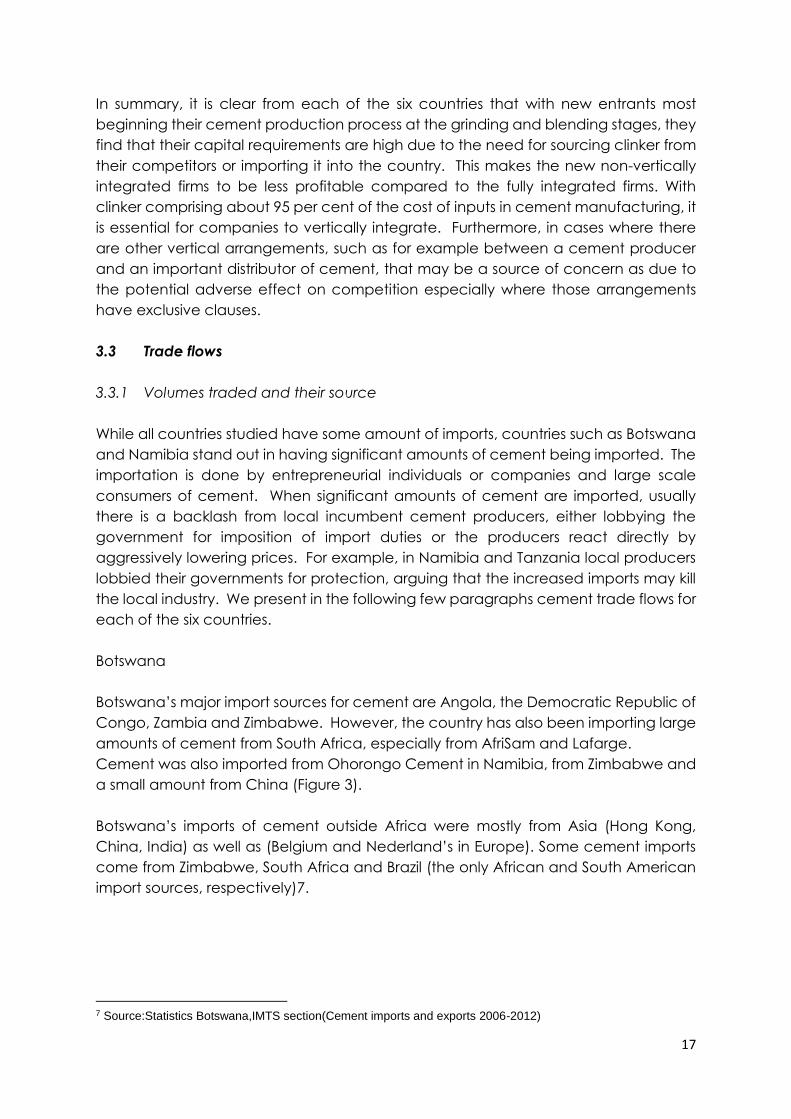
Botswana’s major import sources for cement are Angola, the Democratic Republic of
Congo, Zambia and Zimbabwe. However, the country has also been importing large
amounts of cement from South Africa, especially from AfriSam and Lafarge.
Cement was also imported from Ohorongo Cement in Namibia, from Zimbabwe and
a small amount from China (Figure 3).
Botswana’s imports of cement outside Africa were mostly from Asia (Hong Kong,
China, India) as well as (Belgium and Nederland’s in Europe). Some cement imports
come from Zimbabwe, South Africa and Brazil (the only African and South American
import sources, respectively)7.
7 Source:Statistics Botswana,IMTS section(Cement imports and exports 2006-2012)
18
Figure 3: Botswana’s clinker imports
Source: Statistics Botswana, IMTS section (Cement imports and exports 2006-2012)
Kenya
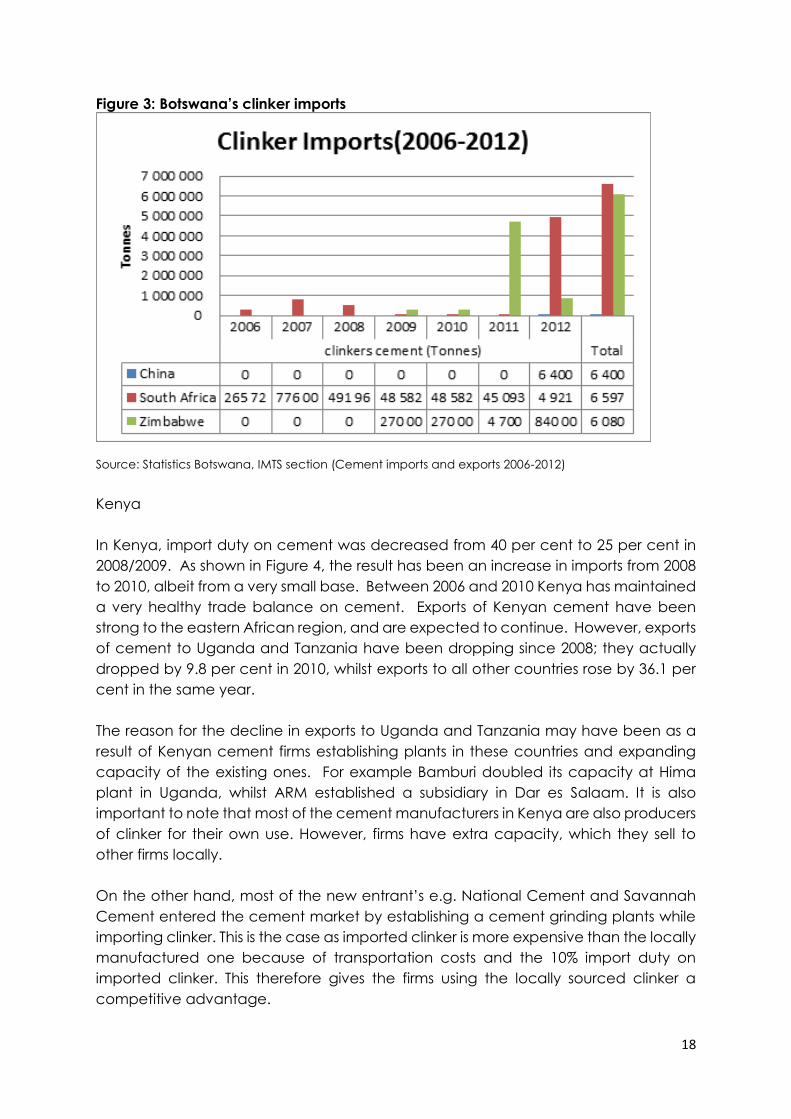
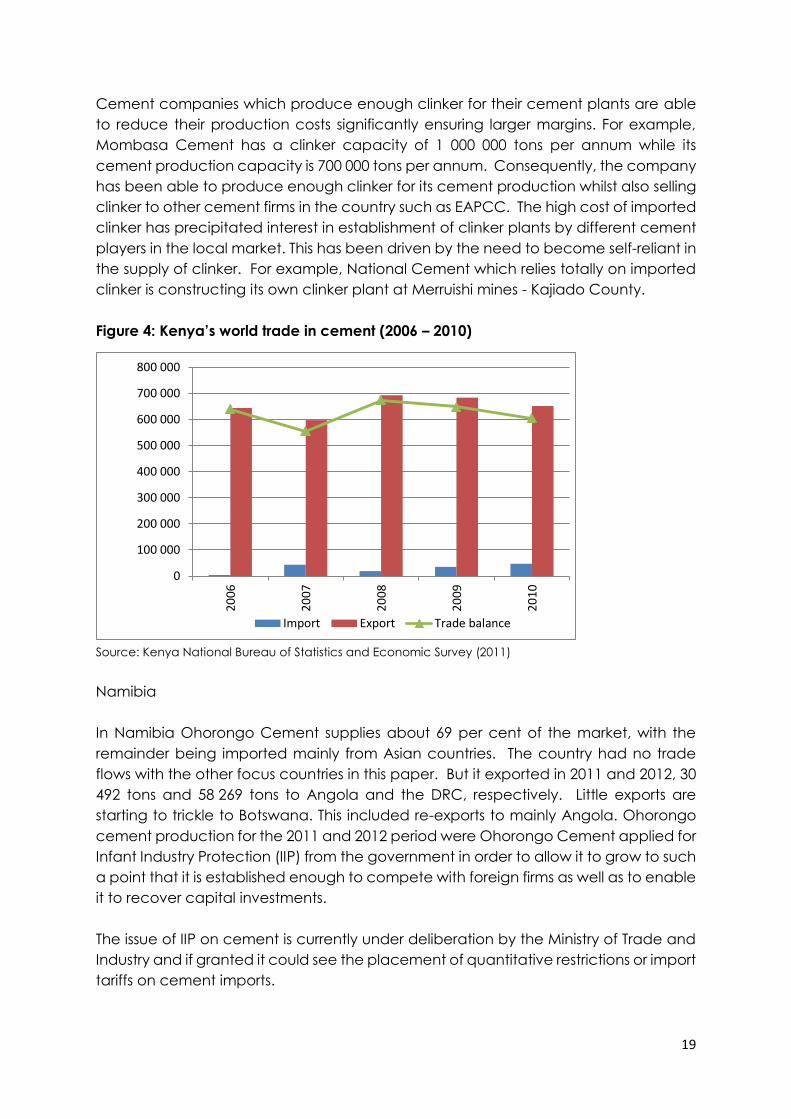
In Kenya, import duty on cement was decreased from 40 per cent to 25 per cent in
2008/2009. As shown in Figure 4, the result has been an increase in imports from 2008
to 2010, albeit from a very small base. Between 2006 and 2010 Kenya has maintained
a very healthy trade balance on cement. Exports of Kenyan cement have been
strong to the eastern African region, and are expected to continue. However, exports
of cement to Uganda and Tanzania have been dropping since 2008; they actually
dropped by 9.8 per cent in 2010, whilst exports to all other countries rose by 36.1 per
cent in the same year.
The reason for the decline in exports to Uganda and Tanzania may have been as a
result of Kenyan cement firms establishing plants in these countries and expanding
capacity of the existing ones. For example Bamburi doubled its capacity at Hima
plant in Uganda, whilst ARM established a subsidiary in Dar es Salaam. It is also
important to note that most of the cement manufacturers in Kenya are also producers
of clinker for their own use. However, firms have extra capacity, which they sell to
other firms locally.
On the other hand, most of the new entrant’s e.g. National Cement and Savannah
Cement entered the cement market by establishing a cement grinding plants while
importing clinker. This is the case as imported clinker is more expensive than the locally
manufactured one because of transportation costs and the 10% import duty on
imported clinker. This therefore gives the firms using the locally sourced clinker a
competitive advantage.
19
Cement companies which produce enough clinker for their cement plants are able
to reduce their production costs significantly ensuring larger margins. For example,
Mombasa Cement has a clinker capacity of 1 000 000 tons per annum while its
cement production capacity is 700 000 tons per annum. Consequently, the company
has been able to produce enough clinker for its cement production whilst also selling
clinker to other cement firms in the country such as EAPCC. The high cost of imported
clinker has precipitated interest in establishment of clinker plants by different cement
players in the local market. This has been driven by the need to become self-reliant in
the supply of clinker. For example, National Cement which relies totally on imported
clinker is constructing its own clinker plant at Merruishi mines - Kajiado County.
Figure 4: Kenya’s world trade in cement (2006 – 2010)
Source: Kenya National Bureau of Statistics and Economic Survey (2011)
Namibia
In Namibia Ohorongo Cement supplies about 69 per cent of the market, with the
remainder being imported mainly from Asian countries. The country had no trade
flows with the other focus countries in this paper. But it exported in 2011 and 2012, 30
492 tons and 58 269 tons to Angola and the DRC, respectively. Little exports are
starting to trickle to Botswana. This included re-exports to mainly Angola. Ohorongo
cement production for the 2011 and 2012 period were Ohorongo Cement applied for
Infant Industry Protection (IIP) from the government in order to allow it to grow to such
a point that it is established enough to compete with foreign firms as well as to enable
it to recover capital investments.
The issue of IIP on cement is currently under deliberation by the Ministry of Trade and
Industry and if granted it could see the placement of quantitative restrictions or import
tariffs on cement imports.
0
100 000
200 000
300 000
400 000
500 000
600 000
700 000
800 000
20
06
20
07
20
08
20
09
20
10
Import Export Trade balance
20
South Africa
South Africa’s trade balance in cement ranged between a trade deficit of US$46
807 532 and a trade surplus of US$23 759 786 in the period 2001-2011. From 2001 to
2004 the trade balance steadily declined and entered negative territory in 2005,
achieving its lowest point in 2007. This was mainly driven by a sharp increase in imports
from 2005-2007 matched by a decline in exports (
Figure 5). The period 2007 to 2008 saw an increase in exports and a decline in imports,
which culminated in a positive trade balance in 2009 and 2010. However, an increase
in imports matched by a decline in exports in 2011 saw the trade balance slip back
into negative territory.
South Africa’s major export destinations were mainly to Mozambique, Angola,
Zimbabwe, the DRC and Zambia (Figure 6). These countries received exports from
South Africa consistently in the period (with the exception of the DRC), who’s
prominence as an export destination became noticeable post 2007. South Africa also
exported to a number of overseas destinations such as the US, China and Japan,
although the value of trade was relatively small.
The majority of cement exports from South Africa were of ordinary Portland cement
and not much for clinker. In addition, South Africa was a net exporter of limestone
used in the manufacture of lime or cement for the period 2001-2011. The country’s
main export destinations for limestone were other Southern African Development
Community (SADC) member states. The DRC, Malawi, Mozambique, Zambia, and
Zimbabwe, have consistently purchased limestone from South Africa during the
period 2001-20118.
The SADC share of South Africa’s limestone exports ranged from 16 per cent to 95 per
cent for the same period, with the lowest exports in the region occurring in 2005. With
regards to imports, South Africa sourced cement mostly from Asia (Rep. of Korea,
Pakistan, China, India and Indonesia) and the European Union (France and United
Kingdom), with some coming from Zimbabwe and Brazil (the only African and South
American import sources, respectively). The imports were mainly driven by cement
clinker, which contributed 41% to the imports.
8 There was some limestone trade with Angola, but the trade was sporadic and the value of the trade was relatively small.

21
Figure 5: South Africa’s world trade in cement (2001 – 2011)
Source: UN Comtrade
Figure 6: South Africa’s exports of Cement (2001 to 2011)
Source: UN Comtrade
Tanzania
22
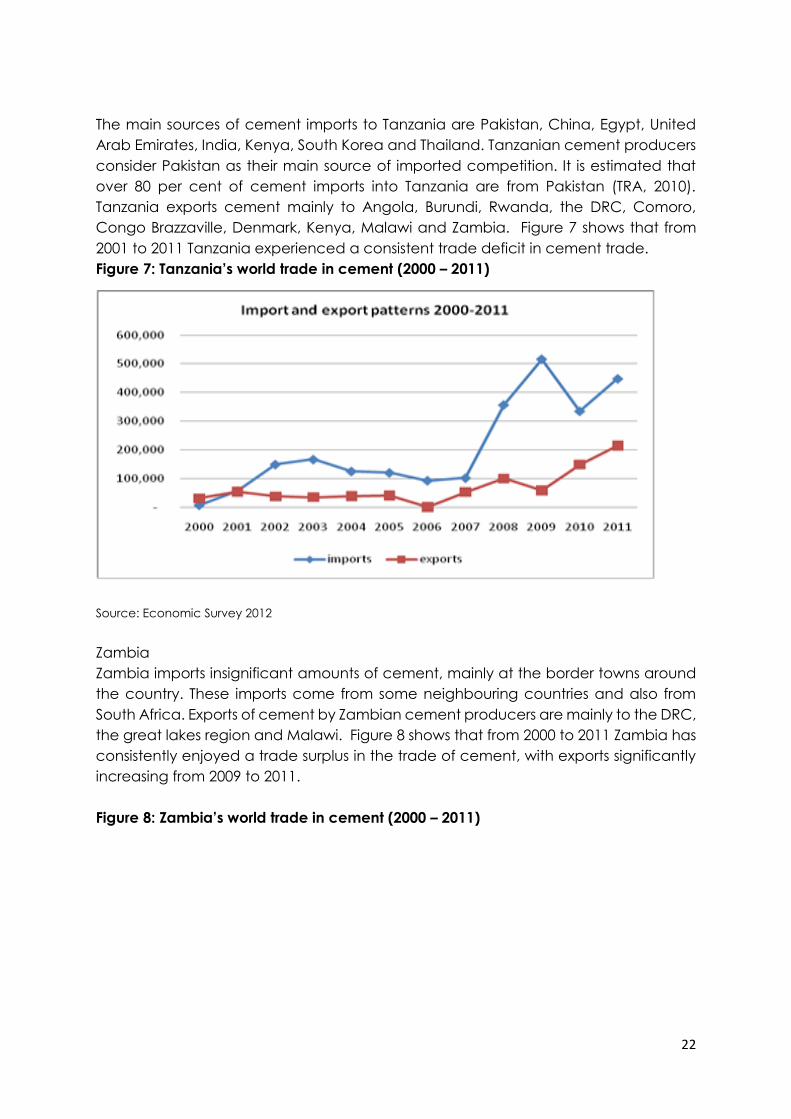
The main sources of cement imports to Tanzania are Pakistan, China, Egypt, United
Arab Emirates, India, Kenya, South Korea and Thailand. Tanzanian cement producers
consider Pakistan as their main source of imported competition. It is estimated that
over 80 per cent of cement imports into Tanzania are from Pakistan (TRA, 2010).
Tanzania exports cement mainly to Angola, Burundi, Rwanda, the DRC, Comoro,
Congo Brazzaville, Denmark, Kenya, Malawi and Zambia. Figure 7 shows that from
2001 to 2011 Tanzania experienced a consistent trade deficit in cement trade.
Figure 7: Tanzania’s world trade in cement (2000 – 2011)
Source: Economic Survey 2012
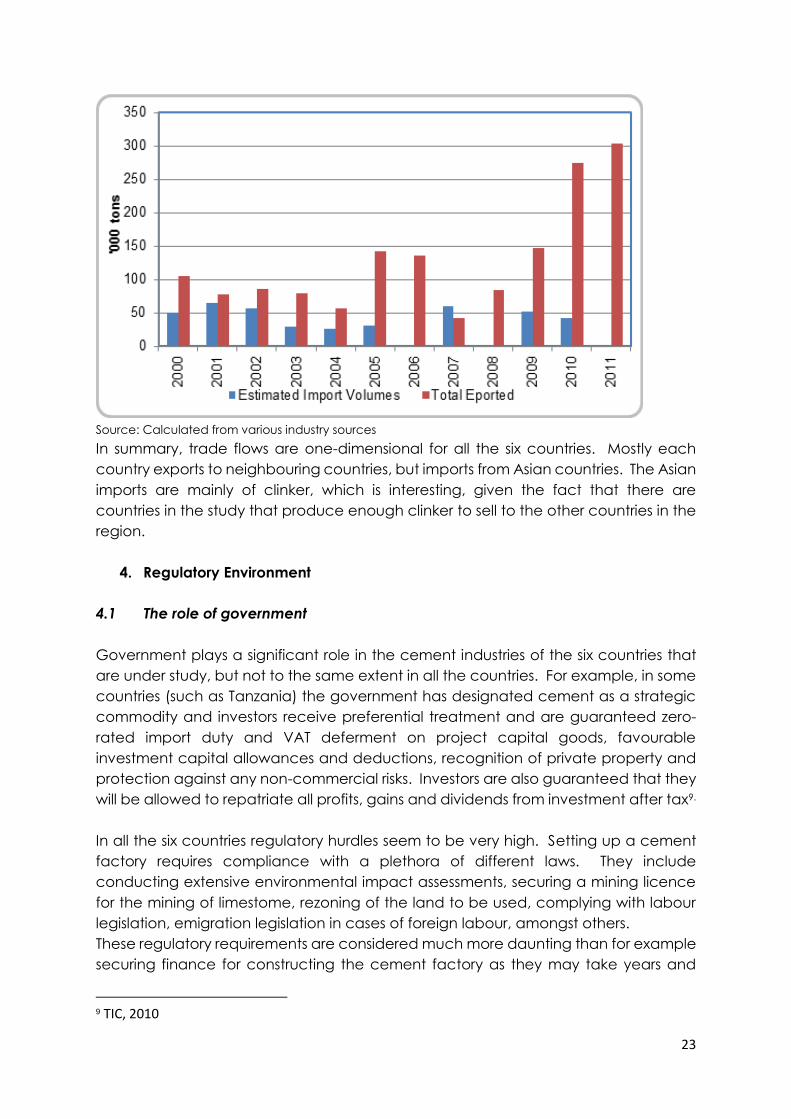
Zambia
Zambia imports insignificant amounts of cement, mainly at the border towns around
the country. These imports come from some neighbouring countries and also from
South Africa. Exports of cement by Zambian cement producers are mainly to the DRC,
the great lakes region and Malawi. Figure 8 shows that from 2000 to 2011 Zambia has
consistently enjoyed a trade surplus in the trade of cement, with exports significantly
increasing from 2009 to 2011.
Figure 8: Zambia’s world trade in cement (2000 – 2011)
23
Source: Calculated from various industry sources
In summary, trade flows are one-dimensional for all the six countries. Mostly each
country exports to neighbouring countries, but imports from Asian countries. The Asian
imports are mainly of clinker, which is interesting, given the fact that there are
countries in the study that produce enough clinker to sell to the other countries in the
region.
4. Regulatory Environment
4.1 The role of government
Government plays a significant role in the cement industries of the six countries that
are under study, but not to the same extent in all the countries. For example, in some
countries (such as Tanzania) the government has designated cement as a strategic
commodity and investors receive preferential treatment and are guaranteed zero-
rated import duty and VAT deferment on project capital goods, favourable
investment capital allowances and deductions, recognition of private property and
protection against any non-commercial risks. Investors are also guaranteed that they
will be allowed to repatriate all profits, gains and dividends from investment after tax9.
In all the six countries regulatory hurdles seem to be very high. Setting up a cement
factory requires compliance with a plethora of different laws. They include
conducting extensive environmental impact assessments, securing a mining licence
for the mining of limestome, rezoning of the land to be used, complying with labour
legislation, emigration legislation in cases of foreign labour, amongst others.
These regulatory requirements are considered much more daunting than for example
securing finance for constructing the cement factory as they may take years and
9 TIC, 2010
24
large amounts of money before the first brick is layed to build the factory. For
example, in one case it took a new entrant 18 months to comply just with emigration
legislation. The firm suggested that it would have been easier if all these regulatory
requirements were centralised and handled by one government body.
4.2 Trade restrictions
Botswana, Namibia and South Africa (together with Lesotho and Swaziland) are
members of the Southern African Customs Union (SACU), meaning that these
countries can freely trade in cement with each other. There are however exceptions,
such as Article 26 of the SACU Agreement of 2002, which affords certain industries
infant industry protection for a period of about eight years. In fact, the cement
industry in Namibia was recently granted an infant industry protection in 2012, with an
import duty of 60 per cent being imposed until 2014. This duty will however reduce
gradually to 50 per cent, 42 per cent, 24 per cent and finally 12 per cent in 2016, 2017
and 2018 respectively. However, the process of has been stalled by court challenges
from the Namibian importers of cement.
Together with Botswana, Namibia and South Africa, Tanzania and Zambia are
members of the Southern African Development Community (SADC), which has in total
15 member states. Again, this means free trade of cement between these countries.
Furthermore, Kenya and Tanzania are members of the East African Community (EAC)
(which also includes Burundi, Rwanda and Uganda). Under an agreed EAC Protocol,
cement was for a while considered a sensitive product to be treated differently from
other products. It was agreed that import of cement to the EAC would attract a 55
per cent common external tariff, to be decreased by 5 per cent annually to allow
time for the EAC member states to accumulate efficiency necessary to sustain
competition from outside the region. However, following unprecedented price
increases in 2007, it was determined that the protection be waived to allow for
imports, which eventually resulted in price stability.
4.3 Industry associations
It has been established in many competition jurisdictions that industry associations
could be used to facilitate cartel conduct. Cartel meetings could be held under the
auspices of the association. In addition, competition sensitive information can be
shared by players in an industry, designed to increase transparency and therefore
bring stability to a cartel arrangement.
Recently the South African Competition Commission uncovered a cement cartel
involving the four incumbent cement producers. In that case, it was established that
the cement producers had agreed to share detailed information through the Cement
and Concrete Institute (C&CI), their industry association.
This information sharing did not only cover South Africa, but also Botswana, Lesotho,
Namibia and Swaziland. This was very detailed monthly data on sales by province
25
(including the other four countries); by packaging and transport type, by product
composition, by product strength, by end use sector and also covering imports of
members. In 2009 the South African Competition Commission stopped this information
exchange (at least in its original form) after having conditionally granted PPC
immunity from being prosecuted. The C&CI has since closed its doors.
Cement producers in Kenya and Tanzania belong to the East African Cement
Producers Association (EACPA), which also includes producers from Burundi, Rwanda
and Uganda. There are country chapters in each of the countries. Through their
association, manufacturers have commissioned a research company to conduct
studies related to technology and challenges facing the cement industry. One such
study is to create a level playing field for cement manufacturers. The study was
commissioned to give manufactures facts on cement market dynamics which was
eventually used as tool to advocate their positions in different platforms including
government bodies. According to the report the main challenge facing the industry
includes; high energy cost, transportation costs, cheap imported cement, subsidized
imported cement and under declaration at the point of entry.
5. Cement Prices and Volumes
5.1 Prices, margins and pricing strategies
In this section we first present a discussion on the cement prices within each country,
then we tie this back to the region by plotting these prices in one diagram with one
common currency (US$) to bring out a regional pricing story. We also look at the
cement margins where we have information, and then we conclude the section by
discussing cement producers’ pricing strategies. In fact, the latter discussion is mainly
on the South African cement industry given the recent uncovering of the cartel there.
We argue that the other jurisdictions can learn from this discussion.
5.1.1 Pricing
Figure 9 below shows average annual cement prices for three areas in Botswana. The
prices of cement showed an increasing trend until 2009, when they flattened. The
effect of the 2009 change in the trend could possibly have been the result of
government intervention. The other possibility could be the busting of the cement
cartel in South Africa, which had included Botswana in its market allocation. The
cartel was stopped from sharing detailed information from 2009.
Figure 9: Botswana average annual cement prices by different locations (Pula per
50kg bag)
26
Source: Various retail stores in Botswana
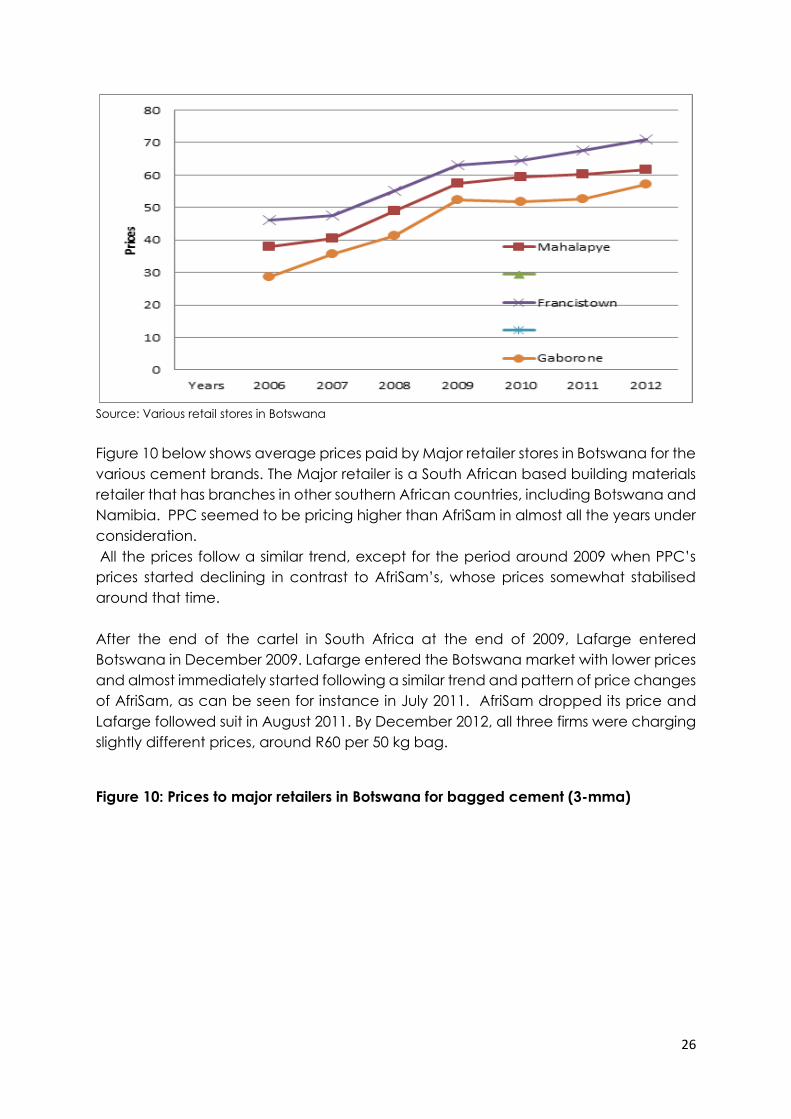
Figure 10 below shows average prices paid by Major retailer stores in Botswana for the
various cement brands. The Major retailer is a South African based building materials
retailer that has branches in other southern African countries, including Botswana and
Namibia. PPC seemed to be pricing higher than AfriSam in almost all the years under
consideration.
All the prices follow a similar trend, except for the period around 2009 when PPC’s
prices started declining in contrast to AfriSam’s, whose prices somewhat stabilised
around that time.
After the end of the cartel in South Africa at the end of 2009, Lafarge entered
Botswana in December 2009. Lafarge entered the Botswana market with lower prices
and almost immediately started following a similar trend and pattern of price changes
of AfriSam, as can be seen for instance in July 2011. AfriSam dropped its price and
Lafarge followed suit in August 2011. By December 2012, all three firms were charging
slightly different prices, around R60 per 50 kg bag.
Figure 10: Prices to major retailers in Botswana for bagged cement (3-mma)
27
Source: Various retail stores in Botswana
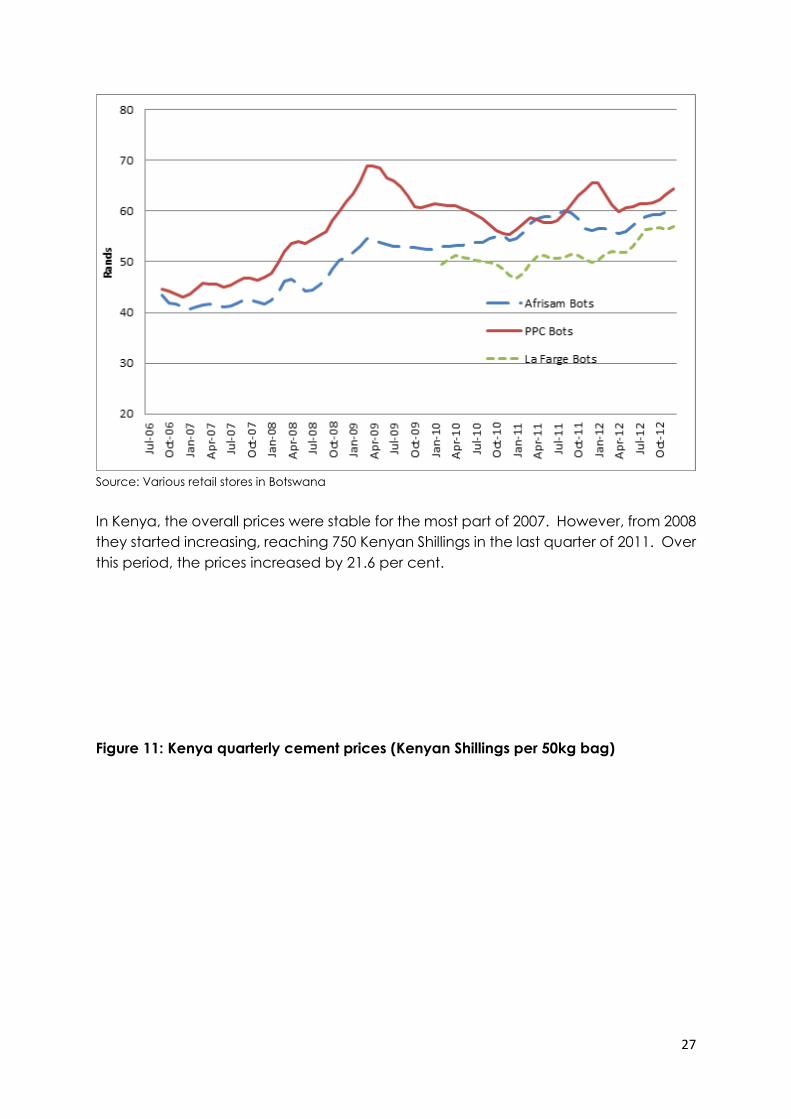
In Kenya, the overall prices were stable for the most part of 2007. However, from 2008
they started increasing, reaching 750 Kenyan Shillings in the last quarter of 2011. Over
this period, the prices increased by 21.6 per cent.
Figure 11: Kenya quarterly cement prices (Kenyan Shillings per 50kg bag)

28
Source: Kenya National Bureau of Statistics
It is important to note that the price pattern depicted in Figure 12 above appear to
contradict publicly available information that prices of cement in Kenya declined due
to entry of new cement manufacturers.
Figure 12: Cement wholesale prices in various regions of Kenya
Figure 13: Cement retail prices in various regions of Kenya
500
550
600
650
700
750
800
Q1 Q2 Q3 Q4 Q1 Q2 Q3 Q4 Q1 Q2 Q3 Q4 Q1 Q2 Q3 Q4 Q1 Q2 Q3 Q4
2007 2008 2009 2010 2011
Pric
es (K
S)
29
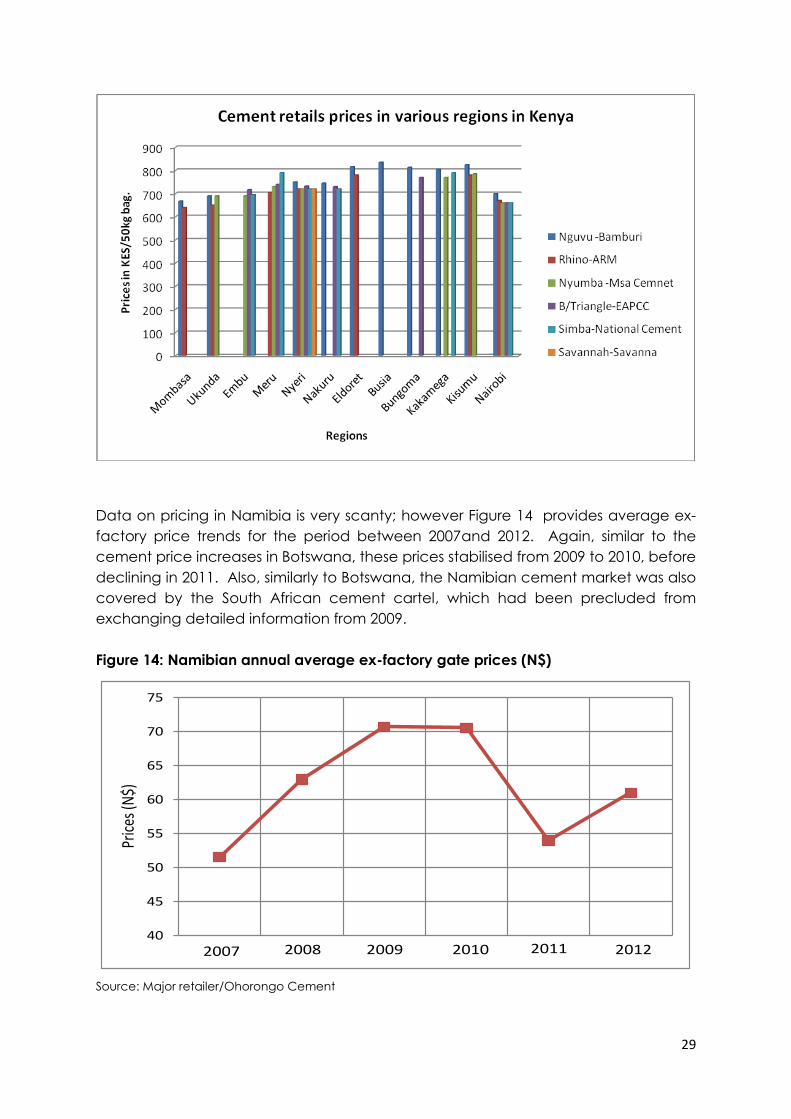
Data on pricing in Namibia is very scanty; however Figure 14 provides average ex-
factory price trends for the period between 2007and 2012. Again, similar to the
cement price increases in Botswana, these prices stabilised from 2009 to 2010, before
declining in 2011. Also, similarly to Botswana, the Namibian cement market was also
covered by the South African cement cartel, which had been precluded from
exchanging detailed information from 2009.
Figure 14: Namibian annual average ex-factory gate prices (N$)
Source: Major retailer/Ohorongo Cement
40
45
50
55
60
65
70
75
2007 2008 2009 2010 2011 2012
Pric
es (N
$)
30
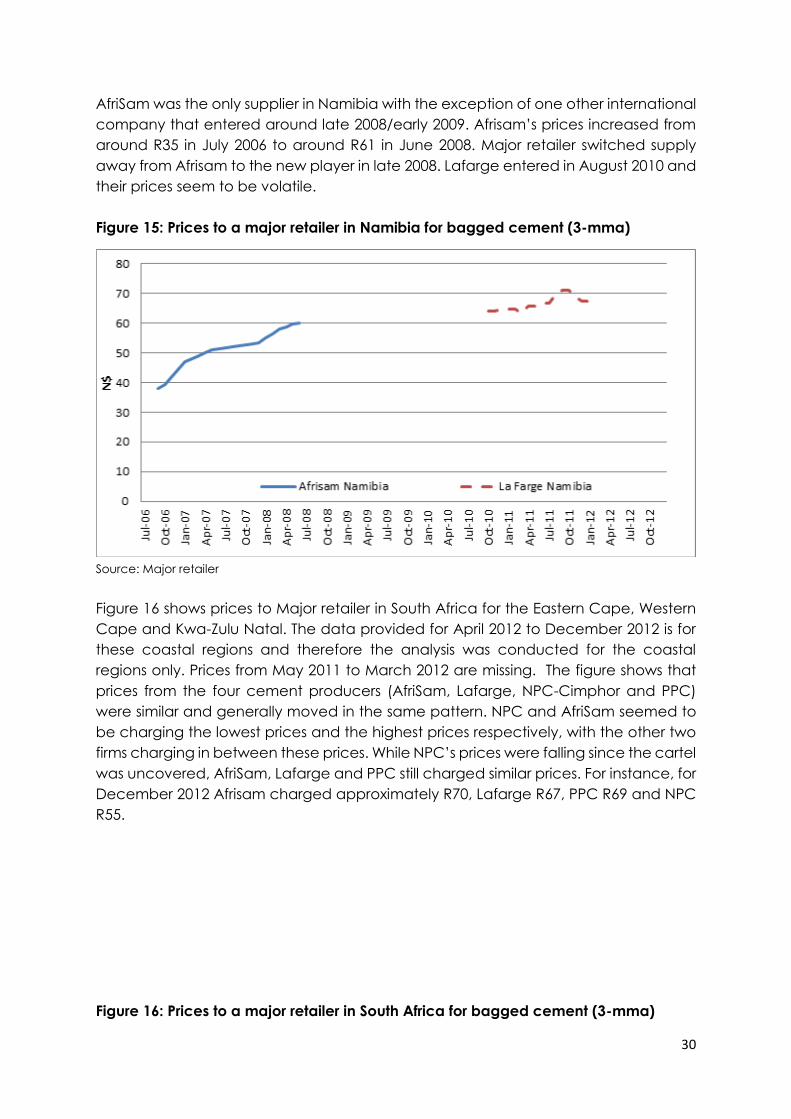
AfriSam was the only supplier in Namibia with the exception of one other international
company that entered around late 2008/early 2009. Afrisam’s prices increased from
around R35 in July 2006 to around R61 in June 2008. Major retailer switched supply
away from Afrisam to the new player in late 2008. Lafarge entered in August 2010 and
their prices seem to be volatile.
Figure 15: Prices to a major retailer in Namibia for bagged cement (3-mma)
Source: Major retailer
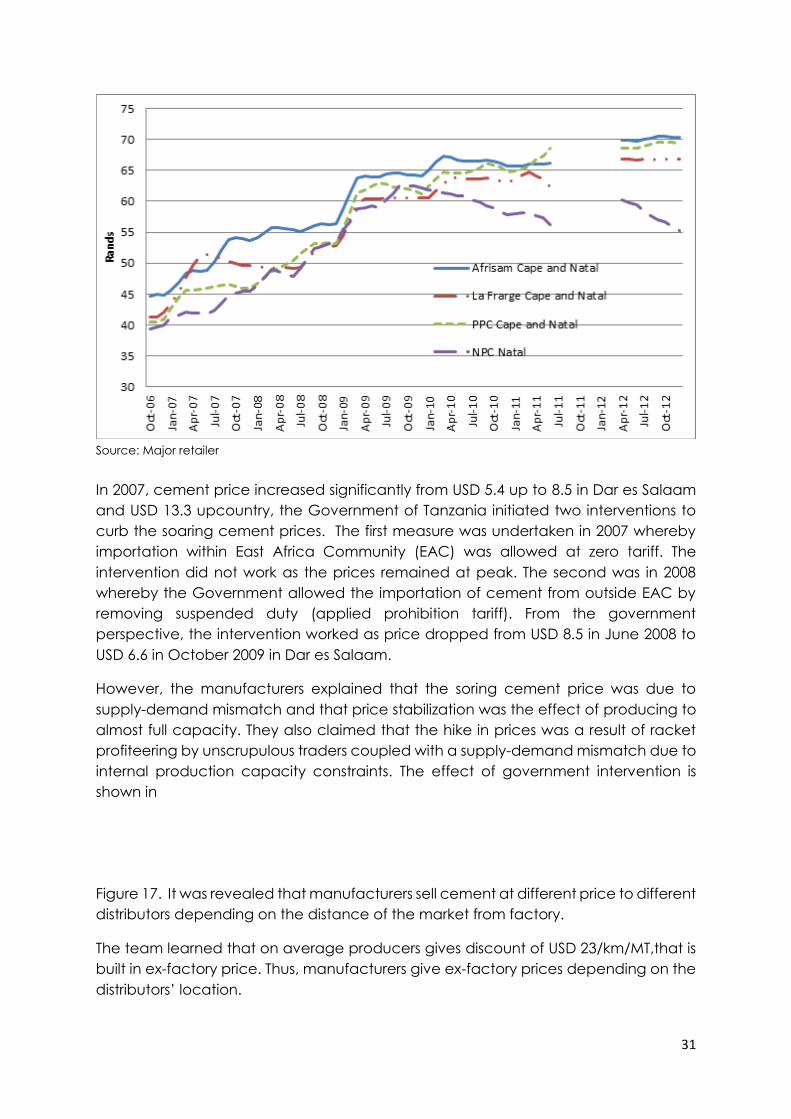
Figure 16 shows prices to Major retailer in South Africa for the Eastern Cape, Western
Cape and Kwa-Zulu Natal. The data provided for April 2012 to December 2012 is for
these coastal regions and therefore the analysis was conducted for the coastal
regions only. Prices from May 2011 to March 2012 are missing. The figure shows that
prices from the four cement producers (AfriSam, Lafarge, NPC-Cimphor and PPC)
were similar and generally moved in the same pattern. NPC and AfriSam seemed to
be charging the lowest prices and the highest prices respectively, with the other two
firms charging in between these prices. While NPC’s prices were falling since the cartel
was uncovered, AfriSam, Lafarge and PPC still charged similar prices. For instance, for
December 2012 Afrisam charged approximately R70, Lafarge R67, PPC R69 and NPC
R55.
Figure 16: Prices to a major retailer in South Africa for bagged cement (3-mma)
31
Source: Major retailer
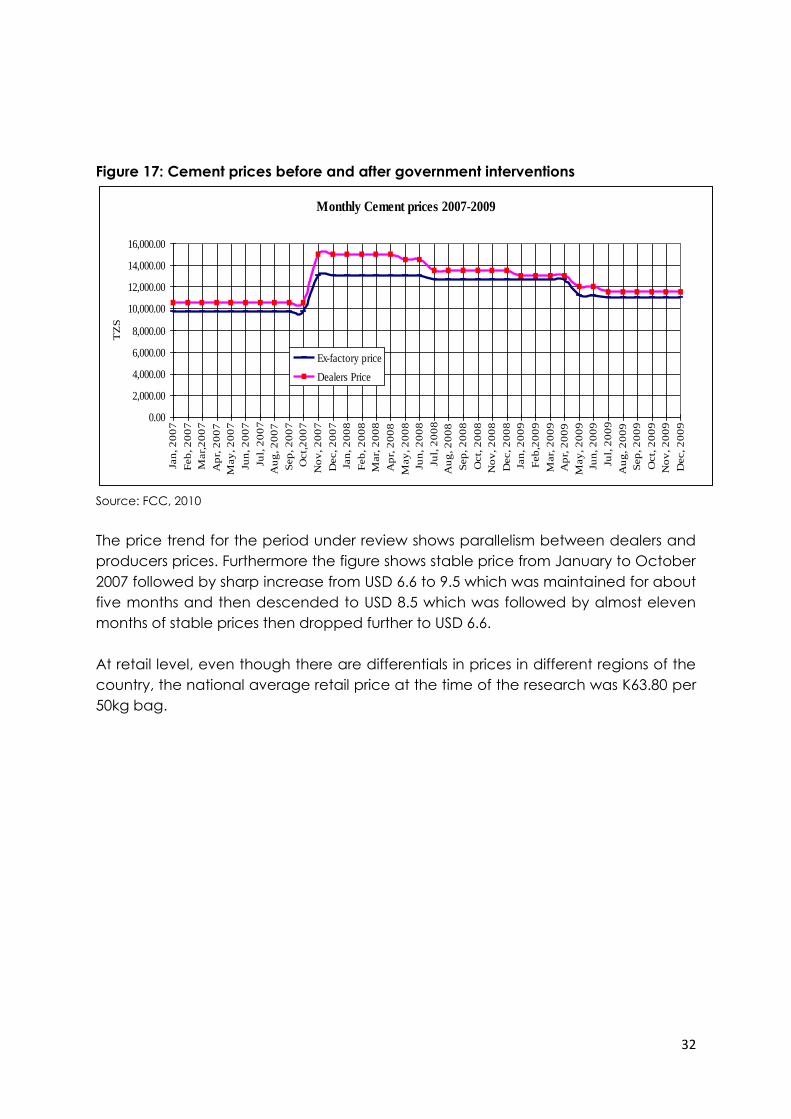
In 2007, cement price increased significantly from USD 5.4 up to 8.5 in Dar es Salaam
and USD 13.3 upcountry, the Government of Tanzania initiated two interventions to
curb the soaring cement prices. The first measure was undertaken in 2007 whereby
importation within East Africa Community (EAC) was allowed at zero tariff. The
intervention did not work as the prices remained at peak. The second was in 2008
whereby the Government allowed the importation of cement from outside EAC by
removing suspended duty (applied prohibition tariff). From the government
perspective, the intervention worked as price dropped from USD 8.5 in June 2008 to
USD 6.6 in October 2009 in Dar es Salaam.
However, the manufacturers explained that the soring cement price was due to
supply-demand mismatch and that price stabilization was the effect of producing to
almost full capacity. They also claimed that the hike in prices was a result of racket
profiteering by unscrupulous traders coupled with a supply-demand mismatch due to
internal production capacity constraints. The effect of government intervention is
shown in
Figure 17. It was revealed that manufacturers sell cement at different price to different
distributors depending on the distance of the market from factory.
The team learned that on average producers gives discount of USD 23/km/MT,that is
built in ex-factory price. Thus, manufacturers give ex-factory prices depending on the
distributors’ location.
32
Figure 17: Cement prices before and after government interventions
Source: FCC, 2010
The price trend for the period under review shows parallelism between dealers and
producers prices. Furthermore the figure shows stable price from January to October
2007 followed by sharp increase from USD 6.6 to 9.5 which was maintained for about
five months and then descended to USD 8.5 which was followed by almost eleven
months of stable prices then dropped further to USD 6.6.
At retail level, even though there are differentials in prices in different regions of the
country, the national average retail price at the time of the research was K63.80 per
50kg bag.
Monthly Cement prices 2007-2009
0.00
2,000.00
4,000.00
6,000.00
8,000.00
10,000.00
12,000.00
14,000.00
16,000.00
Jan
, 2
00
7
Feb
, 2
00
7
Mar,
20
07
Ap
r, 2
00
7
May
, 2
00
7
Jun
, 2
00
7
Jul,
20
07
Au
g, 2
00
7
Sep
, 2
00
7
Oct,
20
07
No
v, 2
00
7
Dec, 2
00
7
Jan
, 2
00
8
Feb
, 2
00
8
Mar,
20
08
Ap
r, 2
00
8
May
, 2
00
8
Jun
, 2
00
8
Jul,
20
08
Au
g, 2
00
8
Sep
, 2
00
8
Oct,
20
08
No
v, 2
00
8
Dec, 2
00
8
Jan
, 2
00
9
Feb
,20
09
Mar,
20
09
Ap
r, 2
00
9
May
, 2
00
9
Jun
, 2
00
9
Jul,
20
09
Au
g, 2
00
9
Sep
, 2
00
9
Oct,
20
09
No
v, 2
00
9
Dec, 2
00
9
TZ
S
Ex-factory price
Dealers Price
33
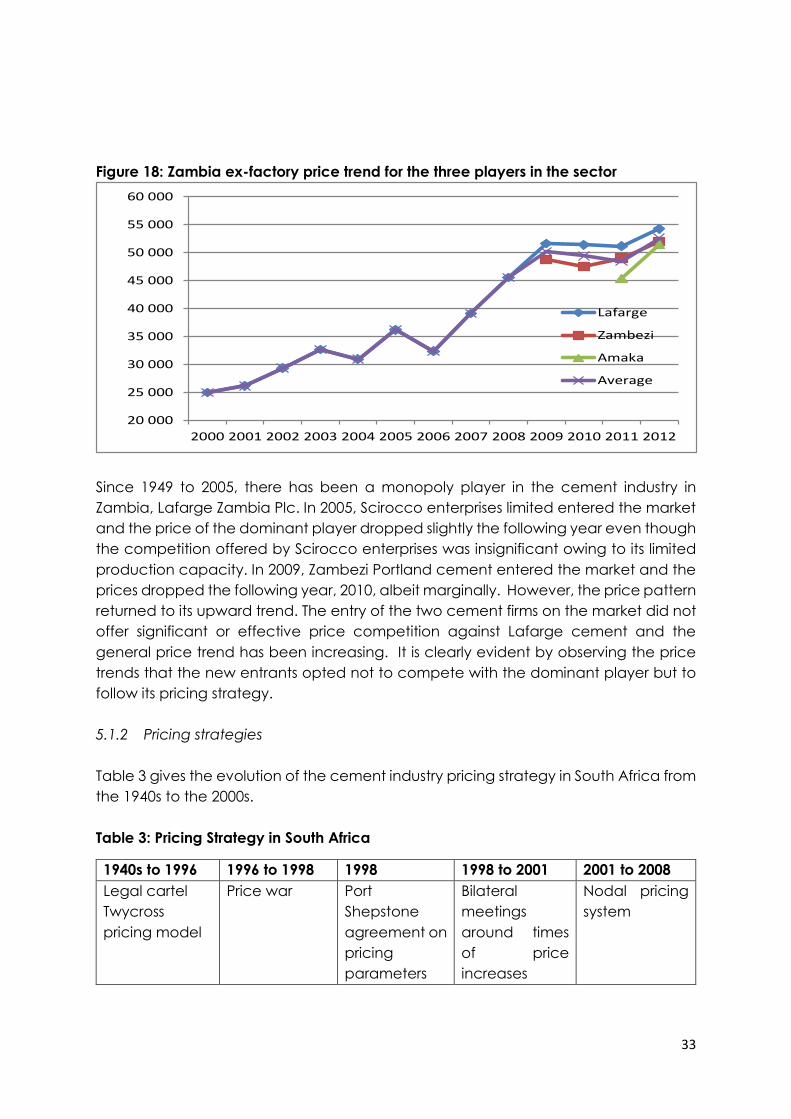
Figure 18: Zambia ex-factory price trend for the three players in the sector
Since 1949 to 2005, there has been a monopoly player in the cement industry in
Zambia, Lafarge Zambia Plc. In 2005, Scirocco enterprises limited entered the market
and the price of the dominant player dropped slightly the following year even though
the competition offered by Scirocco enterprises was insignificant owing to its limited
production capacity. In 2009, Zambezi Portland cement entered the market and the
prices dropped the following year, 2010, albeit marginally. However, the price pattern
returned to its upward trend. The entry of the two cement firms on the market did not
offer significant or effective price competition against Lafarge cement and the
general price trend has been increasing. It is clearly evident by observing the price
trends that the new entrants opted not to compete with the dominant player but to
follow its pricing strategy.
5.1.2 Pricing strategies
Table 3 gives the evolution of the cement industry pricing strategy in South Africa from
the 1940s to the 2000s.
Table 3: Pricing Strategy in South Africa
1940s to 1996 1996 to 1998 1998 1998 to 2001 2001 to 2008
Legal cartel
Twycross
pricing model
Price war Port
Shepstone
agreement on
pricing
parameters
Bilateral
meetings
around times
of price
increases
Nodal pricing
system
20 000
25 000
30 000
35 000
40 000
45 000
50 000
55 000
60 000
2000 2001 2002 2003 2004 2005 2006 2007 2008 2009 2010 2011 2012
Lafarge
Zambezi
Amaka
Average
34
every six
months
a. Pricing during legal cartel
Pricing of cement was done using a model called the Twycross pricing model that
optimised rail transport.
This model used Lafarge’s Lichtenburg plant as the base pricing point off which all
sales in the CDSA10 market area were priced by adding the transport costs from the
Twycross pricing model.11 Indeed, it was this very function that was notionally the
raison d’etre for the cartel: optimising the rail transport of cement so as to minimise
the distribution cost of cement. This amounted to price fixing because it set a rule on
delivered prices to customers.
The cartel was given until 1996 to disband and each producer to operate
independently. Operating independently not only meant that each producer would
set prices independently, but that they would also market and distribute their product
independently. In anticipation of the disbandment of the cartel in 1996, cement
producers had agreed in 1995 that each producer would continue to hold a market
share they had enjoyed during the official cartel period. However this did not happen,
as immediately after the cartel was disbanded a brief price war ensued, lasting until
1998.
In the years immediately following the end of the legal cartel (1996 to 1998) PPC
began to gain market share and expanded infrastructure to the point that, by 1998,
they had over 50% of the market.12 While this was partly through pricing competitively
and hence regarded by the industry as a price war, it was also achieved through
competing on non-price measures. These were better marketing and distribution that
PPC had begun focusing on far earlier than Lafarge and Afrisam, and so were in a
better relative position post cartel.13 The consequence of this price war period to
competitors of PPC was a large reduction in both market shares and market prices.14
b. Port Shepstone agreement
In 1998 all the cement producers showed poor financial performance due to the price
competition, leading them to hold several preliminary meetings, in Port Shepstone
Kwa-Zulu Natal, to attempt to bring the market back to stability. During these meetings
10 A company known as Cement Distributors (South Africa) (Pty) Ltd (“CDSA”) was formed and took responsibility for all cement sales and distribution and the balancing of the cartel members’ interests. All producers had to market their product through the CDSA, which covered all of the Northern Regions of the country. 11 Competition Commission referral report, case number 2008JUN3769 12 Interview of Gomersall 29 June 2009, page 5 13 PPC leniency application in 2008Jun3769, 7 August 2009, para 4.2.7, and 4.3.1 14 See the statement by Michael Malachi Doyle page 18 para 44
35
PPC was accused by Lafarge and Afrisam of breaching the market share agreement,
and spending too much money on promotions and the branding of its products,
which destabilized the market. The aim of these preliminary meetings was to restore
trust amongst the cement producers.
Before the Port Shepstone agreement a decentralized pricing system was in place
where discounting at regional level was common practice. Among other things, these
meeting resulted in agreement on pricing parameters for different types of cement
and cartel members agreed not to offer special discounts on higher quality cement.15
The amount by which prices were to increase every six months still had to be
determined and continuous forums facilitated this determination.
The initial meetings took place in 1998, 1999 and 2000 to discuss pricing as well as
market shares. The Cement producers then maintained contact on a bilateral basis
after these main meetings. These bilateral interactions typically took place around
the time of price increases, where representatives from each of the players would
seek to find out what the others were likely to do in relation to pending price
adjustments. According to PPC the industry-wide type meetings continued until
approximately 2000/2001.16 However, it seems contact between competitors on a
bilateral basis continued beyond 2001. This had the effect that competitors could
easily monitor each other’s prices in the market.
c. Nodal Pricing System
The price-monitoring also seems to have been augmented by a nodal pricing strategy
adopted by PPC, Lafarge, and followed by others from 2001 onwards. The nodal
pricing system meant that PPC allowed no discounting on prices, and that customers
within a node were charged the same price. Prices were determined at executive
level for ‘nodes’, which were geographic regions or zones of supply. Thus towns in any
given node would pay the same price irrespective of distance from the core. Different
nodal prices were calculated for different cement products and packaging options.
PPC claims the bilateral meetings continued until early 2008, however, there seems to
be no concrete evidence of this.17 The Commission’s investigation observed that
during the period 2000 to 2008 cement producers increased the price of cement by
roughly similar percentages and around the same time.18
d. Prices since November 2009
Major retailer, a customer in South Africa, Botswana, Namibia, Swaziland and Lesotho,
have observed that price increases in South Africa have been much lower in the last
15 Competition Commission referral report, case number 2008JUN3769 16 PPC leniency application in 2008Jun3769, 7 August 2009, para 4.4.10 17 Competition Commission referral report, case number 2008JUN3769 18 Competition Commission Cement Impact Assessment draft 16/04/2013
36
few years. It attributes this to increased competition from second tier blenders like
Cement Blender and lower inflation in the industry.19 Cement Blender has also
observed lower price increases, ranging from 10% to as low as 3%.20
However, Cement Blender has not observed any significant changes in the discount
policy or credit terms offered by the major OPC suppliers in the last 4 to 5 years. The
frequency of price increases still occurs every 6 months and customers are usually
informed a month before they take effect.
In summary, this pricing strategy as used by the by the South African cartel was also
facilitated through the industry association. This should be mulled over, especially by
the authorities of Kenya and Tanzania with regard to the EACPA.
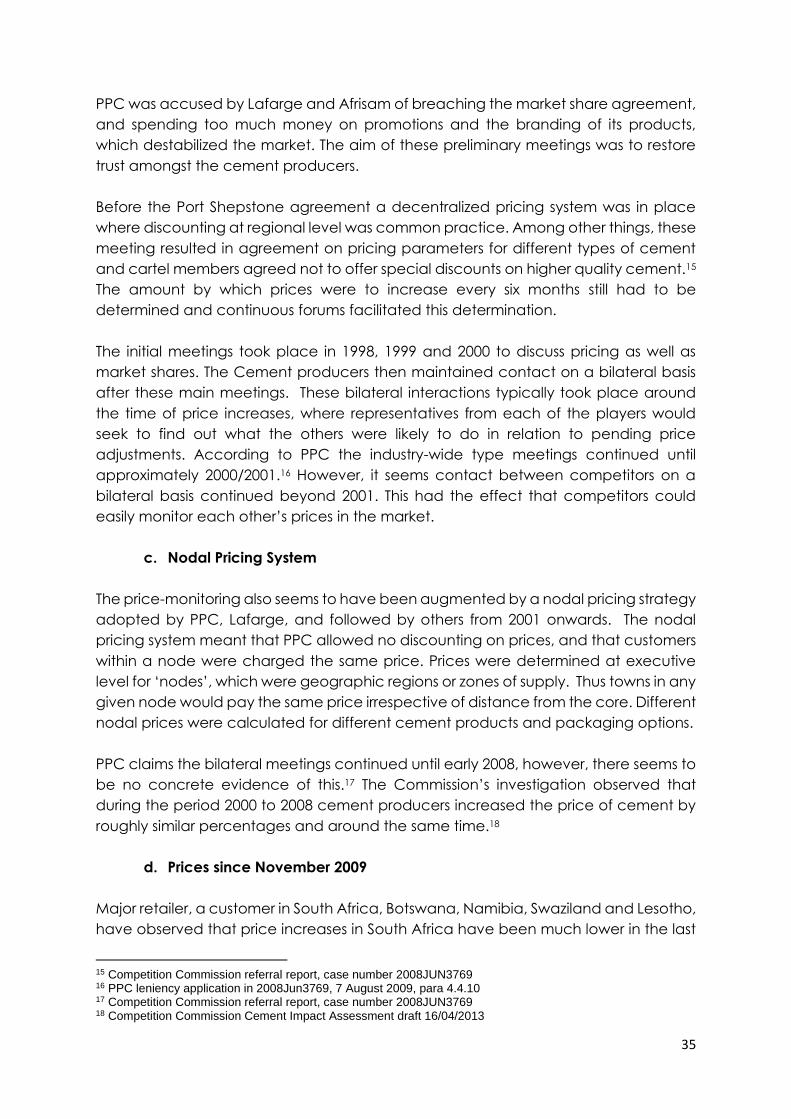
5.1.3 Margin analysis
In South Africa, of the four cement producers currently, only PPC (the largest
producer) is listed on the Johannesburg Stock Exchange and whose financial data
are publicly available. Figure 19 reveals a declining trend from 1995 to 1999 after
which a strong recovery is witnessed until 2006. At this point, the margins are in excess
of 40%. This is then followed by a moderate decline until 2009. The decline from 1995
to 1999 coincides with the period of price wars in the South African cement industry
following the termination of the legal cartel in 1996. The recovery from 1999 also
coincides with the subsequent illegal cartel agreement between cement producers
in 1998. A further sharp decline is seen from 2009 till 2011, where the margin reached
27% compared to 38% in 2009. The available data also reveals that margins from the
South African cement operations are in line with the overall margin (i.e. the group’s
margin). Margins from other African operations, however, show a contrasting trend.
These appear to have been falling from 1999 to 2005. These have been significantly
lower than those from the South African operations since 2001. To demonstrate,
margins from South African operations in 2005 were 43% compared to 12% from other
African operations.
Figure 19: PPC’s margins from cement operations
19 Submission by Major retailer on 06/04/2013 20 Submission by Cement Blender on 26/03/2013
37
Source: Authors calculation based on data from various annual financial reports
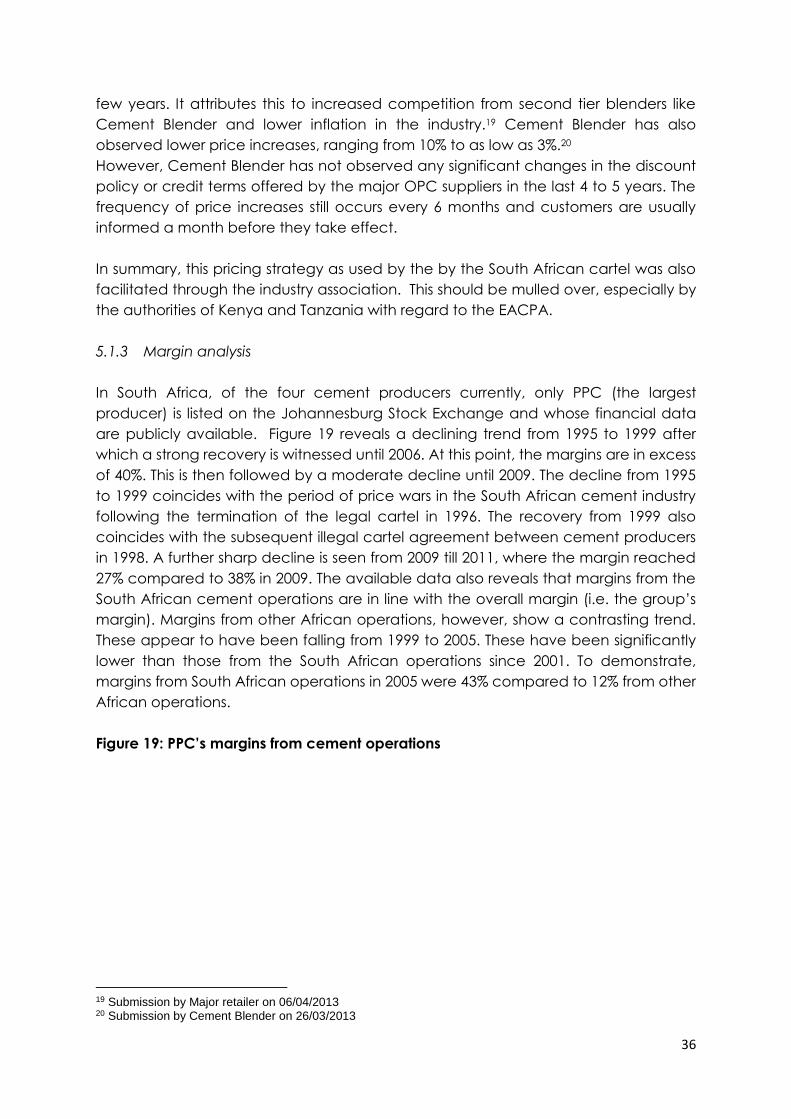
5.1.4 Consolidated regional price analysis
Figure 19 shows estimated ex-factory cement prices in US dollars for a 50kg 32.5MPa
strength cement in five of the six countries under study for the period 2000 to 2012.
Throughout the period, Zambia’s prices have remained above those of the other
countries, accelerating between 2004 and 2008, before stabilising at around US$10 a
bag between 2009 and 2012. Namibia’s prices were the second highest for the period
2007 to 2012. For the period 2008 to 2012, South Africa’s prices were the lowest.
Figure 20: Estimated ex-factory cement prices in five of the six countries in US$ (2000
– 2012)
2
4
6
8
10
12
14
2000 2001 2002 2003 2004 2005 2006 2007 2008 2009 2010 2011 2012
Botswana Namibia South Africa Tanzania Zambia
US
Dolla
rs
38
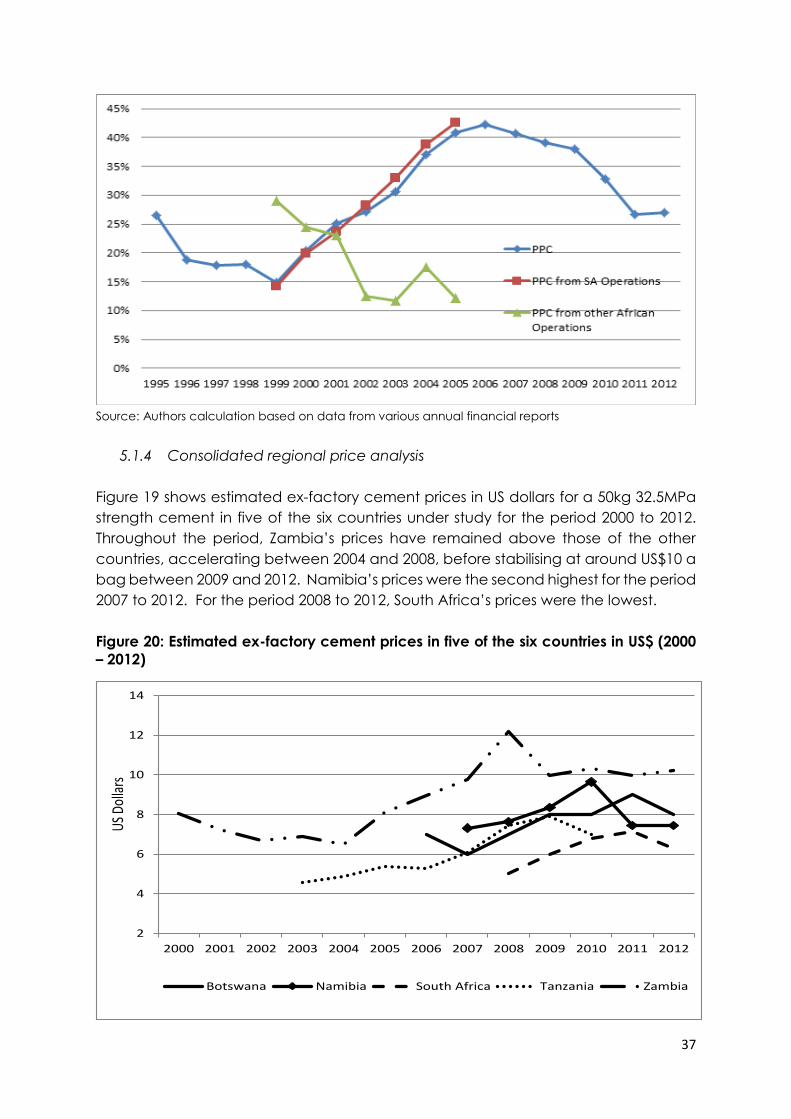
Figure 20 shows estimated retail prices for a 32.5Mpa 50kg cement bag in US$ from
five of the six countries under study. Zambia’s ex-factory prices seem to have been
higher compared to the other 4 countries, the country has one dominant cement
producer that is a price leader. The South African prices have been lower.
Figure 21: Estimated retail cement prices in five of the six countries in US$ (2006 –
2012)
Figure 21 shows average retail prices for a 32,5MPa 50kg cement bag in the five
countries. Zambia’s prices reduced in 2009 and have stabilised around US$12.
Botswana and South Africa had the lowest retail prices.
6. Competition Issues in the Six Countries
6.1 Barriers to entry
4
6
8
10
12
14
16
18
2006 2007 2008 2009 2010 2011 2012
Botswana Namibia South Africa Tanzania Zambia
US D
olla
rs
39
In order to understand the barriers to entry to an industry it is appropriate to
understand what it takes for a firm not only to enter a particular market but to be able
to grow to the point of posing a credible threat to the existing firms. Barriers to entry
and expansion broadly differentiate between those that arise due to the intrinsic
nature of the products and activities in question (and which can be viewed as
exogenous to the decisions of existing firms), and those which are associated with the
existing firm’s conduct which may result from strategic decisions by the incumbent
firms.
In the Namibian cement industry, barriers are mainly natural due to the fact that
cement production is a highly capital intensive market. Inputs such as limestone,
although readily available, require mining, a costly activity. The fact that Namibia is a
very small market which can only absorb so much production makes it unattractive
to investors as the bulk of production would need to be exported and cement as a
naturally bulky product, may be costly to transport.
Licensing and regulatory policy is generally not a concern in Namibia as the
government is eager and open to investment opportunities. Since the entry of
Ohorongo Cement, there has been no other entry into the Namibian cement industry.
Chinese importer Jack’s Trading has indicated interest in setting up a cement
manufacturing plant in Walvisbay, however, this seems to have been put on hold for
now.
The main exogenous barriers to entry into the South African cement industry are;
availability of limestone reserves, capital and regulatory requirements. The cement
industry is characterised by large economies of scale, the need to access key inputs.
The single biggest input in cement production is limestone (1.5 ton of limestone is
required to produce 1 ton of cement) within reasonable distance to the areas with
high demand. The inland region in South Africa has the highest demand for cement
and there are no accessible limestone reserves for potential entrants. It is understood
that to be a credible player in the cement industry it is crucial to have access to your
own limestone reserves. There are limestone reserves available in the Northern
Province, however, it would be uneconomical to build plants in this region due to
distance from high demand region. Cement is a low value high volume product thus
transportation is expensive. For the same reasons importing the inputs such as
limestone is uneconomical. Thus limestone availability poses a barrier to entry into the
cement market.
A minimum efficient scale cement producing plant is approximately 2.5 million tons
per annum or 5-6000 tons per day. Start-up costs of a plant this size are approximately
R3 billion. Even in the event that an entrant would elect to build a plant that is half
the minimum efficient scale the start-up costs would still be approximately 75 per cent
of the efficient plant. The costs involved in producing cement, from initial investment
to operating costs such as energy and transportation, act as formidable barriers to
entry. Small-scale production is not economical.
40
Once the entrant has secured the raw materials and the capital required to enter,
regulatory approval poses the next challenge. Sephaku Cement has submitted that
in South Africa there is no clear guidance on how and where a firm can go to secure
the required licences. The process is not centralised and as such it takes time to lodge
applications with all the right departments. It took Sephaku Cement approximately
two years to secure the mining rights, water and environmental licenses. The
company is in the process of entering the market for cement production in South
Africa. The decision to enter the market was taken in 2007 and cement production is
expected to commence in February 2014. The decision to enter was influenced by
Sephaku Cement’s acquisition of limestone reserves from Anglo American in 2006 as
a consequence of the use it or lose it minerals principle adopted by government.
Sephaku Cement then secured its first limestone mining right in the financial year
ending February 200921. The initial production will be produced on a single kiln clinker
line in Aganang, near Litchenburg in the NorthWest province with a clinker capacity
of 2.5mt per annum. This will be produced into cement at both Aganang and at a
plant in Delmas, in Mpumalanga, using extenders secured by Sephaku Cement
through a long term agreement with Eskom for fly ash. Subsequent to the completion
of the Aganang plant, Sephaku Cement will commence production of a secondary
clinker facility near Dwaalboom. In the minimum then it will have taken 6 years and a
few months between acquiring limestone reserves and the first production of cement
by Sephaku Cement. This long period can be attributed to a number of factors
including, regulation and securing investors. The required regulatory approval alone
took approximately two years.
This was however happening at the same time as securing investments. The design
and construction of the plants commenced from the end of 2010 and has taken
approximately 3 years. The entry of Sephaku Cement shows that, when scarce
limestone deposits are available, it takes a significant investment and time period
before the first output of cement is produced. One would expect that the cartel that
was uncovered by the Commission in 2008 would also pose a barrier to entry into the
market for the production and sale of cement. However we note that Sephaku
Cement took the decision to enter before the Commission uncovered the cartel.
Sephaku Cement has also not experienced significant resistance from the existing
cement producers as yet. It is noteworthy that the existing cement firms may only
react to Sephaku Cement’s entry when the first bag of cement is sold.
In Botswana the main barriers to entry and expansion are those of availability and
access to main inputs which are fly ash and clinker material. One of the vertically
integrated cement firms in Botswana is Matsiloje Portland Cement (MPC). With new
entrants most beginning their cement production process at the grinding and
21 See Sephaku Holding’s Financial Statements for the 2009 financial year accessed at http://www.sephakuholdings.co.za/investors.html
41
blending stages, they currently find that their capital requirements are high due to the
need for importing clinker, which is more expensive than those locally produced.
Therefore in order to cease the advantage of vertical integration cement producers
and new entrants are forced to establish both a clinker and a cement plant at the
point of entry, which requires a very high level of capital, which may create a barrier
to new entry.
In Tanzania, there has been joint effort by incumbents to fight against imported
cement through their lobby association EACPA. The joint effort through EACPA was
and is still to see cement reinstated its sensitive status waved away in 2008. After
introduction of imports, there have been allegations that imports are subsidized,
substandard and duties are not properly paid.
According to Tanzania Bureau of Standards, all cement imports are subject to
standard verifications and as far as the bureau is concerned, all imports in the market
have passed required standards otherwise it would not be allowed. There is opinion
from the general public that since introduction of imports, domestic manufacturers
have found it difficult to raise price as compared to the period before.
Research has revealed that the prevailing barriers to entry into the cement market in
Zambia as indicated by the industry players are as follows; rare skilled manpower,
large capital outlay for the construction of a cement plant, high domestic rates/taxes,
there are few suppliers of inputs/raw materials, high cost freights contribute to high
cost of inputs and poor infrastructure such as poor condition of roads, railways and
erratic power supply. The existence of these barriers to entry into the cement sector
in Zambia however, has not stopped firms from entering the market. Therefore, these
barriers to entry into the sector are surmountable and any firm wishing to establish a
cement company in Zambia has a high opportunity to succeed.
6.2 Competition concerns
6.2.1 Domestic concerns within each country
In Botswana, MPC has access to the available and limited limestone in Matsiloje
Quarry while other manufacturers have to source fly ash and clinker material from
neighbouring countries. The available limestone is in small quantities which would not
be enough for all the producers. Currently the available fly ash in Morupule Colliery
Mine is given on contractual basis making it difficult for other cement players to source
it.The agreement in place only allows PPC Cement as a first mover advantage to
source the available fly ash. With PPC Botswana being vertically integrated with South
African plant, it makes it easier to source its input materials unlike other players who
are forced to find alternate sources for their inputs. This therefore requires new
entrants’ high capital investment into key inputs as it may require setting up a clinker
and cement plant which may create a barrier to entry and even expansion.

42
In Namibia during 2010, a proposal was submitted for a merger between AfriSam and
Ohorongo Cement. The merger proposed that Ohorongo Cement and AfriSam
Namibia enter into an agreement under which AfriSam would sell and distribute
cement under the management and brand of Ohorongo Cement in Namibia and
neighbouring countries. The proposed merger was prohibited on the grounds that the
supply agreement would potentially lead to the prevention or lessening of
competition, or restriction of trade or the provision of any service, or endanger the
continuity of supplies in the cement market as provided for under Section 47 (2) (a) of
the Competition Act, 2003. Ohorongo Cement then independently started
production in early 2011 and soon after, AfriSam closed its operations in Namibia,
citing inability to compete with locally produced cement as their reason for closure.
In Kenya the existence of the EACPA may be creating a conducive environment for
cartel activities.
Furthermore, the fact that Lafarge has a stake in the EACC which allows it to appoint
two board members is a concern because then the company has excess to their
strategy and that may reduce competition.
In Tanzania, the cement market is divided into three parts according to geographical
location of producers. However, the Dar es Salaam market is shared by all producers
and importers. The price information gathered from distributors, depots, wholesalers
and surveys revealed that, prices in Dar es Salaam were the same for all producers. It
would be expected that apart from TPCC, cement prices for other manufacturers
should be higher because of transport costs. When the Dar es Salaam prices were
compared to where the other firms are located, it was found that price at their local
market is higher than the price charged at the Dar es Salaam market. These
distributors then sell to retailers, block layers and other end users etc. Distributors have
limited influence on the prevailing market price as they are usually given an indicative
price by the manufacturer. Wholesalers either receive cement products from the
company directly or from the distributor. Most of them sell cement in addition to other
products, mostly building material. The cement economics suggest natural
geographical division but the fact that manufacturers charge the same price on
common market and different prices in isolated markets suggests the possibility of
market imperfection.
In Zambia, in terms of market shares Lafarge dominates the cement industry 64.4 per
cent market share, followed by Zambezi Portland Cement with 29.6 per cent market
share and lastly Scirocco with 6 per cent market share. This industry is clearly highly
concentrated with limited competition. The dominant player22, Lafarge influences
market conditions in the industry and especially in terms of pricing strategy. The smaller
firms, Zambezi Portland Cement and Scirocco are to a large extent following the
market leader in its pricing strategy instead of offering competition as can be
observed in the minor differences in their ex-factory prices. Perhaps they have opted
22 In the Zambian scenario, the competition and consumer protection Act defines unilateral dominance at 30.0% market share
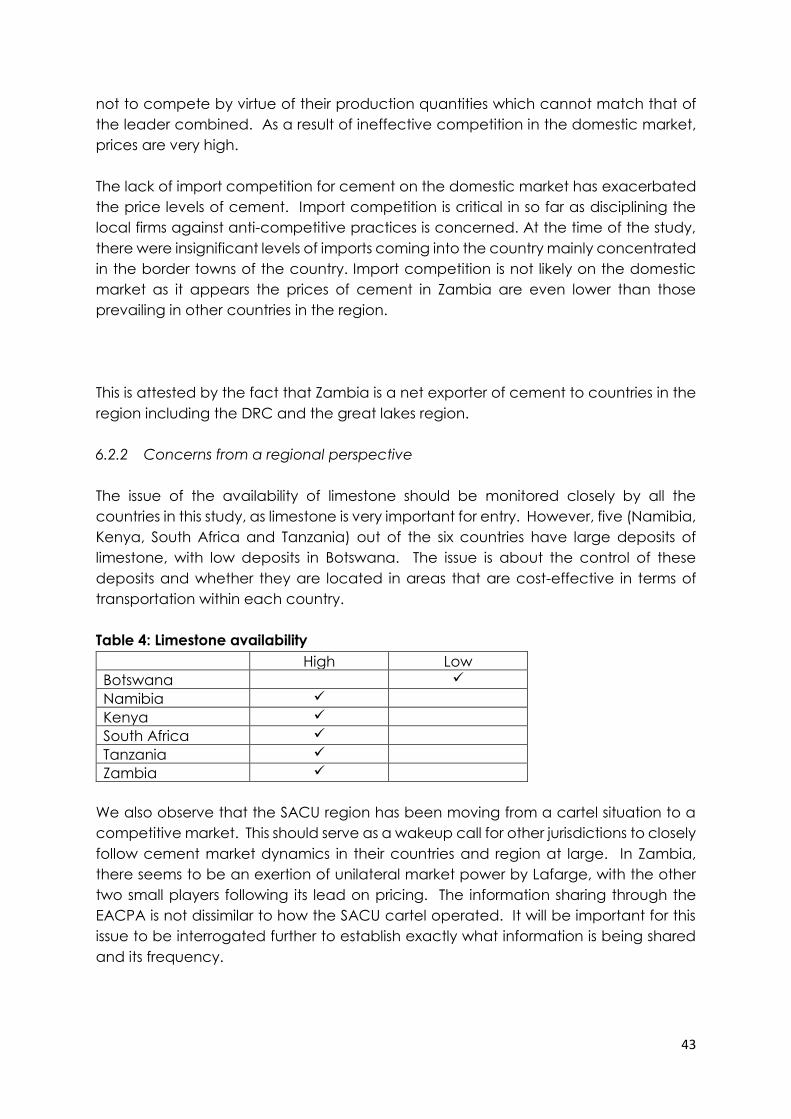
43
not to compete by virtue of their production quantities which cannot match that of
the leader combined. As a result of ineffective competition in the domestic market,
prices are very high.
The lack of import competition for cement on the domestic market has exacerbated
the price levels of cement. Import competition is critical in so far as disciplining the
local firms against anti-competitive practices is concerned. At the time of the study,
there were insignificant levels of imports coming into the country mainly concentrated
in the border towns of the country. Import competition is not likely on the domestic
market as it appears the prices of cement in Zambia are even lower than those
prevailing in other countries in the region.
This is attested by the fact that Zambia is a net exporter of cement to countries in the
region including the DRC and the great lakes region.
6.2.2 Concerns from a regional perspective
The issue of the availability of limestone should be monitored closely by all the
countries in this study, as limestone is very important for entry. However, five (Namibia,
Kenya, South Africa and Tanzania) out of the six countries have large deposits of
limestone, with low deposits in Botswana. The issue is about the control of these
deposits and whether they are located in areas that are cost-effective in terms of
transportation within each country.
Table 4: Limestone availability
High Low
Botswana
Namibia
Kenya
South Africa
Tanzania
Zambia
We also observe that the SACU region has been moving from a cartel situation to a
competitive market. This should serve as a wakeup call for other jurisdictions to closely
follow cement market dynamics in their countries and region at large. In Zambia,
there seems to be an exertion of unilateral market power by Lafarge, with the other
two small players following its lead on pricing. The information sharing through the
EACPA is not dissimilar to how the SACU cartel operated. It will be important for this
issue to be interrogated further to establish exactly what information is being shared
and its frequency.
44
7. Conclusion
Traditionally cement has been considered to be a bulky product, difficult to transport
and therefore localized. However, this study has revealed that in reality this may not
be the case. Cement companies may operate in different regions either through the
exportation of cement to those regions or by establishing plants. It is obvious that any
assessment of the cement industry cannot be limited within the individual countries,
but must be approached on a broader geographical basis. Cement is produced by
multinational companies that develop strategies on a wider regional basis rather than
on a country-by-country basis.
The cement cartel that was recently uncovered in South Africa actually cartelized not
only the South African market, but the SACU region as a whole. The cartelists shared
highly disaggregated data on a monthly and in some instances weekly basis.
Could the EACPA be using similar modus operandi to cartelize the markets in Kenya
and Tanzania? If there is a cartel, what variable is it based on; volumes, prices or
geographic allocation?
It seems in Zambia that the dominant cement producer may be using its market
power to charge high prices (see figure 19). The entry of two cement producers has
not changed this status quo; instead these companies seem to be following the lead
of the dominant player.
With regard to trade in cement between the six countries, it seems peculiar that they
are mostly importing clinker and cement from Asian countries instead of from each
other. What is the reason for this? There is also the issue of protection of the cement
industry, as in Namibia, that governments have adopted.
With regard to new entry, all the countries under study have been experiencing entry
by totally new players and also more established multinationals. What does this mean
for competition? Are these new entrants vigorously competing or are they just
enjoying high profits through being accommodated by the incumbents?