competition between two estuarine snails: implications for invasions of exotic species
TRANSCRIPT
Competition between Two Estuarine Snails: Implications for Invasions of Exotic SpeciesAuthor(s): James E. ByersSource: Ecology, Vol. 81, No. 5 (May, 2000), pp. 1225-1239Published by: Ecological Society of AmericaStable URL: http://www.jstor.org/stable/177203 .
Accessed: 08/05/2014 23:07
Your use of the JSTOR archive indicates your acceptance of the Terms & Conditions of Use, available at .http://www.jstor.org/page/info/about/policies/terms.jsp
.JSTOR is a not-for-profit service that helps scholars, researchers, and students discover, use, and build upon a wide range ofcontent in a trusted digital archive. We use information technology and tools to increase productivity and facilitate new formsof scholarship. For more information about JSTOR, please contact [email protected].
.
Ecological Society of America is collaborating with JSTOR to digitize, preserve and extend access to Ecology.
http://www.jstor.org
This content downloaded from 169.229.32.137 on Thu, 8 May 2014 23:07:41 PMAll use subject to JSTOR Terms and Conditions
Ecology, 81(5), 2000, pp. 1225-1239 ? 2000 by the Ecological Society of America
COMPETITION BETWEEN TWO ESTUARINE SNAILS: IMPLICATIONS FOR INVASIONS OF EXOTIC SPECIES
JAMES E. BYERS1
Department of Ecology, Evolution, and Marine Biology, University of California, Santa Barbara, California 93106 USA
Abstract. An introduced snail, Batillaria attramentaria, has successfully invaded sev- eral salt marshes and mud flats in northern California. In these areas populations of the native mud snail, Cerithidea californica, have declined precipitously. Since both species feed on epipelic diatoms, I hypothesized that the decline in Cerithidea was a result of exploitative competition with Batillaria. To test this hypothesis I manipulated snail densities in Bolinas Lagoon, California, to estimate their effects on, and responses to, food resources. For two size classes of each snail species I quantified (1) the effect of intraspecific density on food availability, and (2) the growth response of each size class to different food levels. These relationships were used to generate predictions of the exploitative competitive effect of each snail on the other species. These predictions were tested against direct measurements of the effect of interspecific competition on snail tissue growth using field experiments. The observed values of snail growth matched well the predicted relationships, suggesting that exploitative competition does occur. Although the two snails did not differ in their effect on resource levels at any experimental snail density, the introduced snail was always more efficient at converting limited resources to tissue growth. Similar results were obtained in three different experimental periods. Batillaria's enhanced resource conversion efficiency provides a sufficient explanation for its successful invasion and subsequent exclusion of Cerithidea. Theoretically, conversion efficiency of resources should be just as important as resource suppression and uptake to exploitative competitive ability, but it is rarely examined experimentally. By separating exploitative competition into its component parts, the protocol used here allowed identification of a seldom implicated mechanism that can affect invasion success.
Key words: Batillaria; Cerithidea; competitive exclusion; consumer-resource interactions; dia- toms; exploitative competition; indirect effects; interspecific competition; introduced species; mud snails; nonindigenous species; resource conversion efficiency; salt marshes.
INTRODUCTION
Invasions of ecosystems by exotic species are in- creasing, especially in aquatic environments (Drake et al. 1989, Carlton 1992, Carlton and Geller 1993, Lodge 1993, Mills et al. 1993, Ruesink et al. 1995, Lafferty and Kuris 1996, Cohen and Carlton 1998). Understand- ing the mechanisms that lead to the success of exotic species will provide predictive power for future inva- sions and insight for the management of presently in- vaded systems. Several authors have stressed the im- portance of a mechanistic understanding of invasions, calling for experiments delineating the interactions be- tween native and exotic species (Wootton 1994a, Grosholz and Ruiz 1996, Petren and Case 1996). Such information would enhance our understanding of traits of successful invaders, and the conditions under which these traits promote invasion.
Most studies of invasion have emphasized the in- strumental role that freedom from natural predators plays in enabling the establishment of exotic species
Manuscript received 19 March 1998; revised 8 March 1999; accepted 27 March 1999:
' Present address: Friday Harbor Marine Laboratory, 620 University Road, Friday Harbor, Washington 98250 USA.
(e.g., Huffaker 1971, Lawton and Brown 1986, Craw- ley 1987, Wilson 1989, Wells and Henderson 1993, Trowbridge 1995). The "predator-free space" provided by a novel environment may indeed be important to successful invasions, but a basic requirement for any species, including exotics, is resources. An alternative determinant of invasion success may thus be the nature of competitive interactions with native ecological an- alogs (Herbold and Moyle 1986). Therefore, compet- itive superiority could be an essential trait leading to successful invasion. Superior competitive ability could manifest itself through interference and/or exploitation, neither of which has been explored as intensively in the context of invasion ecology as the role of "predator- free space." The development and influence of Elton's (1958) concept of empty niches and island biogeog- raphy theory (MacArthur and Wilson 1967), which both largely attribute successful invasion to a lack of competition, may explain partly why competitive abil- ity has been undervalued as a viable explanation for invasion success. To investigate the role of competitive ability in invasions, I have examined interactions be- tween a native salt marsh mud snail and an invading, non-indigenous mud snail.
The common mud snail, Cerithidea californica, is
1225
This content downloaded from 169.229.32.137 on Thu, 8 May 2014 23:07:41 PMAll use subject to JSTOR Terms and Conditions

Ecology, Vol. 81, No. 5
TABLE 1. Mortality rates over the duration of experiments and incidence of parasitic infection. Missing snails were not included in these computations.
Mortality Parasitism Year Species (%) (%)
1995 Large Batillaria 0 2.6 Large Cerithidea 6.5 20.5 Small Batillaria 0 0 Small Cerithidea 0.16 1.97
1996 Large Batillaria 0.26 1.83 Large Cerithidea 2.9 5.54 Small Batillaria 0.85 0 Small Cerithidea 1.4 1.3
1997 Large Batillaria 3.1 3.7 Large Cerithidea 2.9 16.2
an abundant epifaunal grazer that inhabits salt marshes from San Ignacio Bay, Mexico to Tomales Bay, Cali- fornia, USA. The exotic mud snail, Batillaria attra- mentaria, is common in a few bays and estuaries at the northern extent of C. californica's range. B. attramen- taria is one of several species introduced to a few bays in northern California in the early part of this century with plantings of the Japanese oyster, Crassostrea gi- gas (Bonnot 1935). Because it is a direct developer, B. attramentaria has stayed confined within these bays. In these bays, the native snail has declined and, in a few areas where B. attramentaria has attained high abundances, it may have disappeared entirely (Carlton 1975, McDermott 1996). For example, in parts of To- males Bay (50 km north of San Francisco Bay) Cer- ithidea used to be "seen by the thousands" along the west bank (Dickson 1936). Since the arrival of Batil- laria -50-70 years ago (Bonnot 1935, Carlton 1992) only one small, isolated marsh in Tomales Bay now contains Cerithidea (Byers, in press). In isolated sec- tions of Bolinas Lagoon (Marin County, California), Cerithidea populations have disappeared and densities of Batillaria up to 5000 snails/m2 have been measured (McDermott 1996; Byers, in press). In Elkhorn Slough (Monterey County, California) Cerithidea is complete- ly absent, and Batillaria achieves densities up to 10 000 snails/m2, nearly an order of magnitude greater than Cerithidea has been observed to attain anywhere (Byers, in press).
The principal natural enemy of the snails, parasitic trematodes, may play a role in Batillaria's success (McDermott 1996), as Batillaria exhibits lower prev- alence of infection by parasitic trematodes than does Cerithidea (Table 1). These parasites do not typically kill their snail host, but rather castrate it, thereby cut- ting off all future reproduction of the snail. Competi- tion, however, may also play a major role in this species invasion. The two species are practically identical in many life history attributes. They grow to about the same maximum size, live for the same length of time, enter winter dormancy at the same time for the same duration (November-March), become mature at the
same age, reproduce at the same time of year, and share the same preferred food resource: epipelic diatoms (di- atoms that grow on mud surfaces) (McLean 1960, Dris- coll 1972, Whitlatch 1972, Yamada and Sankurathri 1977, Morris et al. 1980, Whitlatch and Obrebski 1980, Yamada 1982, Race 1982). Whitlatch and Obrebski (1980) demonstrated that epipelic diatoms numerically comprise 70-80% of both snails' diets. Additionally, snails and other soft sediment feeders are capable of limiting diatom or detritus resources (Fenchel 1975, Curtis and Hurd 1981, Bertness 1984, Levinton 1985, Olafsson 1986, Lopez and Levinton 1987). Given the high overlap of resource use, the two snails in this system may compete exploitatively. Exploitative com- petition has been demonstrated in several aquatic snails (e.g., Fenchel and Kofoed 1976, Schmitt 1985, 1996, Osenberg 1989, Skilleter and Underwood 1993). Fur- ther, intraspecific competition has been documented among C. californica (Lafferty 1993a).
The simplest model of exploitative competition il- lustrates the key characteristics involved. The dynam- ics of a resident species and its resources can be de- termined by the Lotka-Volterra equations:
dR/dt = rR - lNR
dN1Idt = ctle,RN1 - mlN
(1)
(2)
where r is the intrinsic rate of increase of the biological resource, R is the density of the resource, N1 is the population density of consumer species 1, (xl is the per capita consumer consumption rate, El is the per capita efficiency of converting resource into new consumers, and ml is the density-independent death rate of con- sumer 1. At equilibrium:
R* = mllalsl (3)
where R* is the equilibrium value of the resource when only species 1 is present. A second species, N2, can invade only if it can increase from small numbers when the resource density is R*, i.e.,
dN21dt = a282R* N2 - mN2 > 0
or, after rearranging,
R* > m2/t2E2.
Invasion therefore requires:
ml/(Xl11 > m2/(t282.
(4)
(5)
(6)
The invasion criterion (Eq. 6) emphasizes that spe- cies 2 can win by having a lower death rate (m2) or a higher conversion efficiency (s2), even if the per capita feeding rates (a) are the same. The study described here indicates that in fact Batillaria has advantages in both parameters over Cerithidea.
Although exploitative competition has been studied for decades (e.g., Gause 1932, Lack 1945, MacArthur 1958, Cody 1968, Brown and Davidson 1977, Peterson 1982, Holt et al. 1994), the two components of ex-
1226 JAMES E. BYERS
This content downloaded from 169.229.32.137 on Thu, 8 May 2014 23:07:41 PMAll use subject to JSTOR Terms and Conditions

SUPERIOR COMPETITIVE ABILITY AIDS INVASION
ploitative competition-the consumer's per capita con- sumption rate (or) and its conversion efficiency (s)- are nearly always combined into a single, density-de- pendent relationship (Eisenberg 1966, Brown 1982, Kerfoot et al. 1985, Schmitt 1985). Separation of the two components, however, allows for a more thorough, mechanistic understanding of competitive relation- ships, helping us to better understand species interac- tions and allowing us to make more robust predictions (Tilman 1987, Osenberg 1989, Murdoch et al. 1996, Schmitt 1996).
This study examines the role of exploitative com- petition in the outcome of Cerithidea-Batillaria inter- actions by (a) quantifying for each snail species its effects on and responses to the food resource, (b) gen- erating predictions of the outcome of-competitive in- teractions by combining these relationships into math- ematical functions, and (c) comparing the predictions with experimental measurements of species' responses to interspecific densities. If the direct measurements from step c accurately match the predictions of step b, then exploitative competition between the snails is cor- roborated. Partitioning exploitative competition into its component parts-consumer effects on, and responses to resource levels-should provide insight into which species and size classes are competitively dominant, how superiority is achieved (i.e., via a higher feeding rate or higher efficiency in resource use), and whether trade-offs exist that may allow coexistence.
METHODS
Along the California coast, several embayments exist where either Batillaria or Cerithidea dominates, but few sites exist where both species are in high abun- dance. The experiments reported here were performed in Bolinas Lagoon, California, 20 km north of San Francisco Bay in the summers of 1995-1997. I chose this site because the salt marsh area at its southern end contains similar densities of Batillaria attramentaria and Cerithidea californica (McDermott 1996), sug- gesting that this bay would be ideal for quantifying the invasion of Batillaria and testing the role of compe- tition in invasion success. I measured densities and sizes of the snails from mean high tide level to mean low tide level along five transects that ran perpendic- ular to a primary channel (the principal passage through which water enters the marsh from the lagoon). In order to create an array of enclosure areas in which to ma- nipulate snail density, I arranged a row of pens parallel to the channel on the gently sloping, unvegetated chan- nel bank. The pens were sited along a height contour that had roughly equal densities of both species of snail (Cerithidea: 19 ? 0.85 snails/0.1 m2 (mean ? SE); Ba- tillaria: 24.4 +- 5.62 snails/0.1 m2) and similar mean sizes (Cerithidea: 21.2 ? 0.8 mm (mean ? SE); Batil- laria: 17.2 + 0.59 mm). Pens were constructed of 2- mm clear Vexar mesh (Nalle Plastics, Austin, Texas) formed into cylinders 35 cm in diameter, which I in-
serted 8 cm into the mud substrate of the marsh. Each pen enclosed -0.1 m2 of natural marsh bottom and protruded 0.42 m above the mud surface. The pens had open tops to reduce effects of shading on diatom growth. I removed snails from the pens and rubbed each mud bottom by hand to ensure that all snails had been removed and to homogenize any potential initial spatial variability in epipelic diatom abundance be- tween pens. The pens were left undisturbed for three days before initiating the experiment.
During this time, I collected snails and sorted them by species into two size classes, 8-10 mm (immature) and 18-20 mm (mature). Both species typically reach maturity at 13-15 mm (Whitlatch 1974, Lafferty 1993b). I measured length from apex to anterior tip of aperture, width at aperture, and wet mass of a large subset of the snails used in the experiment. Each of the measured snails was also marked with Testor's enamel. All snails were kept in containers with marsh water until the start of the experiment, and snails were not kept out of the marsh more than two days. Although parasitized snails were present in typically low num- bers in the experiment (Table 1), they should not have affected the performance of the other snails or the re- sponse of the microalgal resource since (1) the trem- atode parasites are not transmissible from snail to snail and (2) infected snails have been shown to have the same effect on the resource as uninfected snails (Laf- ferty 1993a).
To examine intraspecific effects on resources and the corresponding growth responses of the snails to various diatom densities, I created treatments of 0, 12, 23, 35, 46, 69, or 92 individuals from a single size class of either B. attramentaria or C. californica in 1995. These levels represented 0, 0.5x ambient, 1.0X ambient, 1.5x ambient, 2x ambient, 3x ambient, and 4X am- bient intraspecific densities, respectively. In 1997, treatment densities were 0, 0.5X ambient, 1.OX am- bient, 2x ambient, and 4X ambient with large snails only (Table 2). To measure the growth of snails in the experiments, each group of snails added to the pens included 10 measured and marked snails. During the experiments I monitored the pens every day, particu- larly during and immediately after high tides, to keep snails off the sides of the enclosures. (Snails are only capable of climbing vertical surfaces during high tides.)
I ran similar experiments in 1996 to examine tem- poral variation in resource use and growth responses, with the exception that I modified the design to include tests of interspecific interactions. Field densities and sizes in 1996 were very similar to 1995 (Cerithidea: 18.4 ? 2.9 snails/0.1 m2, 21.9 ? 0.45 mm; Batillaria: 28.8 ? 5.51 snails/0.1 m2, 20.4 ? 0.73 mm). Therefore, I used the same total snail density as in 1995. I placed 0, 10, 20, 40, or 80 individuals of either B. attramen- taria or C. californica from the large size class into each pen. To quantify interspecific interactions, I also added 0, 2, 3, 6, or 12 measured and marked large snails
May 2000 1227
This content downloaded from 169.229.32.137 on Thu, 8 May 2014 23:07:41 PMAll use subject to JSTOR Terms and Conditions

Ecology, Vol. 81, No. 5
TABLE 2. Experimental design for each species; in 1995 the design was repeated for each size class as well.
Treatment variable Year (snails/replications) OX 0.5X lx 1.5X 2X 3X 4X
Intraspecific experiments 1995 (37 d) No. snails 0 12 23 35 46 69 92
No. Batillaria reps.t 4 4 3 3 3 3 3 No. Cerithidea reps.: 4 4 3 3 3 3 3
1997 (60 d) No. Batillaria reps. 3 4 4 .-. 4 ... 4 No. Cerithidea reps. 3 4 4 ... 4 ... 4
Interspecific experiment 1996 (39 d) Total snails 0 12 23 46 92
(No. primary)/(no. sec- ... (10/2) (20/3) (40/6) (80/12) ondary)
Secondary snails as per- ... 16.7% 13% 13% 13% centage of total density
No. Batillaria reps w/sec- 4 9 6 3 2 ondary Cerithidea
Extra intraspecific Batil- ... 8 6 4 4 laria pens
Cerithidea reps w/second- 4 9 6 3 2 ary Batillaria
Extra intraspecific Cerith- 8 6 4 4 idea pens
Notes: "Treatments" category relates experimental density levels to mean ambient intraspecific densities found in the marsh. For 1996, "primary" refers to the individuals of the species chosen to be numerically dominant in each pen and for which consumer-resource information was measured. "Secondary" refers to the number of snails of the species different from the primary species added to the enclosure pen. In 1996, the extra intraspecific pens listed are the replicates that were part of a separate experiment to test effects of large snails on small secondary snails, utilized in the present study to help quantify consumer-resource interactions of large snails.
t Number of replications with Batillaria. t Number of replications with Cerithidea.
of the second species to the five respective intraspecific density treatments (Table 2). The number of heteros- pecifics in a cage was thus between 13% and 16.7% of the total snails in each pen. The more abundant species in each pen was termed the "primary" species, while the less abundant species was termed the "secondary" species. I intentionally kept the number of secondary snails added to each pen low so that their presence would have minimal impact on the consumer-resource interactions of the primary snail species and its re- source (Mittelbach 1988). The design therefore focused on quantifying the impact of the abundant snail on the rarer one. Replication was unbalanced to keep the total number of secondary snails similar at each density treatment level (Table 2). In parallel, as part of a sep- arate experiment I initiated treatments that used large snails as the primary snails and small snails as the secondary snail additions to explore size specific in- terspecific interactions. These treatments were used in the present study as additional replicates for quanti- fying the intraspecific consumer-resource interactions of large snails (see following sections).
Effects of snails on resource
While I purposely limited the duration of the ex- periments so that snail mortality would not significantly influence results, effects of snails on food abundance might vary through the experiment as a consequence of changes in snail densities; therefore, I replaced any
dead snails in the pens. Mortality levels, however, were quite low (Table 1).
To measure the final density of diatoms in pens after exposure to snail grazing, I took sediment cores from the bottoms of all pens on the day before the end of the experiment. Using modified plastic syringes (di- ameter = 1 cm) I extracted four sediment cores to a depth of 6 mm from the same relative position in the bottom of each pen. I pooled all cores from each pen in a single scintillation vial, and immediately preserved the samples in 6% Lugol's solution in sterilized sea- water. In the laboratory, I shook sediment samples on a Vortex mixer (Fisher Scientific, Pittsburg, Pennsyl- vania) for 1 min to suspend uniformly all sediment particles and immediately pipetted 250 pL of the mix- ture. I diluted this subsample in deionized water and shook it on the mixer again, then immediately extracted a 350-R.L subsample and plated it onto an 18 mm di- ameter cover slip. Slips were covered with a box and allowed to dry overnight. The following day I stained the slides with a drop of Lugol's solution, which turns chloroplasts green (and thus distinguishes live cells from dead at the time of collection), and viewed them under a light microscope at 400x. I counted all live diatoms along a haphazardly selected transect across the diameter of each cover slip, using a digitizing pad to tally every species of diatom encountered and to measure the heights and widths of all diatoms. Using data on the height, width, and geometry of each species,
JAMES E. BYERS 1228
This content downloaded from 169.229.32.137 on Thu, 8 May 2014 23:07:41 PMAll use subject to JSTOR Terms and Conditions
SUPERIOR COMPETITIVE ABILITY AIDS INVASION
I calculated total surface area of all diatom cells for each of 2-3 replicate cover slips. I used the average of these replicates to estimate the total surface area of diatom cells per area of sediment surface sampled. For the 1996 analyses, five pens of each species were cho- sen at random at each density level (including pens from the experiment designed to measure effects of large snails on small secondary snail additions) in order to keep regression analyses balanced. In 1995, with the exception of the 1.5 ambient density pens for small snails and the few pens that were lost, all pens were cored, as replicates were balanced at each density. I log-transformed diatom abundance and used two-way ANOVA to test for statistical differences in the effects of species and snail density on diatom abundance.
To determine if microalgal density stabilized early in the experiment, in 1997 I sampled diatoms every 5 d from six pens (three from each snail species) of the highest (4X ambient) and lowest (0.5X ambient) snail density levels used during the three experimental years. These extremes of grazing pressure should represent the shortest and longest times needed for the resource to stabilize. I ran this experiment 3 wk longer (for a total of 60 d) than in the two previous years in order to increase the likelihood that stable levels of the re- source were reached.
To measure potential cage effects on diatoms I hap- hazardly took 12 cores of 1 cm diameter (pooled into three vials of four cores each) of ambient marsh sed- iment at the end of the experiment in 1996 at the same tidal height as the experimental cages. I used ANOVA to compare these samples to cores taken from cages of 2 X ambient density treatment. (Since density treatment levels were determined based on intraspecific densities, the 2x level most closely matched ambient total snail density). The test showed no significant differences in diatom abundance inside vs. outside 2X cages (im2 diatom surface area/jxm2 sediment surface area, with 95% confidence interval; Inside = 2.81 ? 0.35; Outside = 2.34 ? 0.65; F, 14 = 1.78, P > 0.204). However, power was low (1 - 3 < 0.3). Thus, despite no de- tectable statistical effect of the pens, they cannot con- clusively be dismissed as having no effect on final di- atom abundance. However, even if the cages had an effect, their influence trended toward increasing diatom levels, a tendency that would lead to an underestima- tion of the intensity of competition compared to am- bient conditions.
Effects of food resource on snails
At the end of the experiments, snails were sieved from the pen bottoms and frozen for later dissection. I measured the focal snails' final shell dimensions and dissected them to determine their sex and prevalence of parasitic infection. I then extracted the tissue and dried it for 4 h at 70?C to obtain a dry tissue mass. At the beginning of the experiments, I had estimated initial dry tissue mass of each marked snail using empirically
determined relationships between basal shell diameter and dry tissue mass. These relationships were calcu- lated by haphazardly selecting snails of both species over a range of sizes, measuring their external shell dimensions, removing the tissue from the shells, drying the tissue, and weighing it. For each species I regressed dry tissue mass against shell width (both R2 > 0.97). I calculated the relative growth of each snail species using the formula: (final dry tissue mass - estimated initial dry tissue mass)/(estimated initial dry tissue mass). While change in dry tissue mass is a highly sensitive measure of growth and potentially most im- portant for fitness considerations, I also examined changes in other growth metrics-length, width, total body wet mass-to ensure that species-specific differ- ences in growth form or differential allocation between shell and tissue did not lead to any discrepancies in results that could alter conclusions about relative growth rates. I excluded parasitized snails (typically a low percentage of total numbers, see Table 1) from final analyses because the trematode parasites infecting these snails have been shown to substantially alter growth rates (Sousa 1983, Lafferty 1993a).
To determine the relative growth of each size and species of snail as a function of the final density of diatoms, I regressed the average relative growth rate for all marked snails within a pen against final diatom abundance using data from the same pens used in the previous analyses. I expected growth to have the same shape as a Type II functional response, minus main- tenance. Therefore, to express the growth increment of a specified size class of species i, AGi, as a function of the final diatom level, F, I fit the saturating function:
AGi = (ai F)(bi + F) - i. (7)
The parameters ai and bi, and the constant ci, which was constrained to a minimum value of 0 (since snail growth rate should not be positive in the absence of food), were calculated by fitting the equation to em- pirical data. Data were fit using a nonlinear general model fitting function of Systat (Systat 1992). I also log-transformed diatom abundance and tested differ- ences between the snails' growth responses to resource levels via ANCOVA using species as the independent variable and resource level as the covariate.
To test for potential effects of caging on snail growth, I marked and took wet masses of several hundred snails of both species and size classes in 1995 and 1996. I placed these snails in the marsh in the immediate area surrounding the experimental pens. At the end of the experiment I collected all marked snails that I could find (approximately one-third were recovered) and air dried and weighed them. The change in the average per capita wet masses of these snails was well within the variation of wet mass growth seen in enclosure pens of equivalent snail densities (Fig. 1). Therefore, pens
May 2000 1229
This content downloaded from 169.229.32.137 on Thu, 8 May 2014 23:07:41 PMAll use subject to JSTOR Terms and Conditions

Ecology, Vol. 81, No. 5
0.20- 1995 * control o penned
0.15- (21)
X 0.20- 1996
o
C,
c 0.15- ), (6
C
-- 0.15 -
0 0.10- (
0 .0 Lg. Lg. Sm. Sm.
Batillaria Cerithidea Batillaria Cerithidea
FIG. 1. Average change in per capita total wet mass (shell and tissue) for free-ranging control snails and snails in en- closure pens with densities equivalent to ambient marsh den- sities. Because experimental treatment levels were deter- mined based on density measurements in the marsh of each species irrespective of the other, the 2X intraspecific treat- ment level most closely matched ambient total snail density. The number above the control snail columns indicates the snails in that category at the end of experiment. Variance calculations for control snails were not possible as snails were measured collectively and were not individually identifiable. For penned snails, the figure presents the mean of average snail growth in each pen (?95% confidence intervals). For small snails in 1995, the penned-snail responses are reported from enclosures of 92 small individuals/0.1 m2, a biomass roughly equivalent to ambient snail biomass in the marsh. For small snails in 1996 the penned-snail responses are re- ported from density enclosures (N = 8 for each species) of 54 small individuals/0.1 m2, the highest enclosure density of small snails available for comparison; the total biomass of these cages was, therefore, somewhat less than ambient lev- els.
appeared to have had little influence on snail growth rates.
Intraspecific effects on growth
To evaluate the effects of intraspecific competition on the relative growth rates of both species in all three years, I expressed snail tissue growth (examined above) as a function of intraspecific density. In addition, I examined species-specific differences in the effect of density on growth rates with two-way ANOVA using species and snail density as the independent variables. Some relationships of the effect of snail density on growth were nonlinear. Linear models fit these rela- tionships well when the reciprocal of density was re- gressed against growth rates. For consistency, all re- lationships of snail density on growth were transformed
using the reciprocal of snail density. All enclosure pens were included in these analyses.
Testing predictions of competition's effect on snail growth
Quantification of snail effects on, and responses to, resources obtained from the single-species experiments allowed me to predict how interspecific exploitative competition affected the growth rate of large snails. I predicted the effect of species 1 on the relative growth of dry tissue mass of species 2, and vice versa, by substituting the equation describing the effect of the density of species 1 on food availability into the equa- tion describing the response of species 2 to food den- sity. Specifically, the predicted effect of a given density of snail species j, Dj, on the growth increment of species i, AGi, via the effect of Dj on diatom density, F, was calculated by substituting into Eq. 7 values for F de- rived from:
F = gj exp(hDj) (8)
where coefficients g and h were calculated by fitting the equation to empirical data. After generating the two predicted relationships for each snail's effect upon the other, I then compared the predictions to the growth of the secondary heterospecific individuals in the 1996 experiments, which provided direct measurements of the effect of each species on the growth rate of the other. To ascertain the accuracy of the predictions to the empirical results I calculated coefficients of deter- mination (R2) for the relationships of the observed val- ues to the prediction lines.
RESULTS
Effects of snails on resource
Examination of the time series data on diatom den- sities in the 1997 intraspecific enclosure experiment confirmed that food resources rapidly achieved abun- dances roughly equal to final values within 3-4 d of the initiation of the experiment (Fig. 2). The initial increase in diatom abundance during the 3 d before the start of the experiment reflects the recovery of the di- atoms from the initial homogenization of the mud sur- face by hand in the absence of snail grazing. After a 15-20 d overshoot of what became the final density, which reached a maximum of 30% above final values in the high grazer treatments and 40% in the low grazer treatments, the diatom abundance came to within 10% (high grazer treatment) and 15% (low grazer treatment) of the final diatom abundance for the remainder of the experiment. Overall, the resource levels were within 20% of the final value for >70% of the experiment duration at both high and low grazing intensities. Thus, final diatom abundance measured in these experiments can be viewed as the density of resource to which the snails responded throughout most of the experiment.
The snail species were basically interchangeable in
1230 JAMES E. BYERS
This content downloaded from 169.229.32.137 on Thu, 8 May 2014 23:07:41 PMAll use subject to JSTOR Terms and Conditions

SUPERIOR COMPETITIVE ABILITY AIDS INVASION
4.0
3.6 3.2 2.8 2.4
2.0 1.6
E 1.2 , 0.8
: 0.4
0 c
Q0 c 4.0 E o 3.6
3.2 2.8 2.4
2.0 1.6 1.2 0.8
Low grazer density
--- i -------------
1 8 15 22 29 36 43 50 57 63
High grazer density
+ + ------+ + I.
-+ ....................................
0.4
1 t 8 15 22 29 36 43 50 57 63
Elapsed time (d)
FIG. 2. Mean diatom abundance (with 95% confidence intervals) in intraspecific snail enclosure experiments through time in 1997. Diatom abundance is expressed as diatom sur- face area (Lxm2)/sediment surface area (bbm2). Because anal- yses of snails on food resources showed little or no difference between species, I pooled data from both species treatments for a given density level. The top graph depicts values for the lowest grazer density treatment (12 snails/0.1 m2). The bottom graph shows values for the highest grazer density treatment (92 snails/0.1 m2). Dashed lines represent the bounds for values within 20% of final diatom abundance. The arrow represents the date the experiment was initiated, i.e., the snails were added. Data on day 1 (A) represent the diatom abundance immediately after the substrate was rubbed by hand in order to indicate the effectiveness of this technique at removing and homogenizing diatom abundances.
their effect on food density. Rates of resource deple- tion, i.e., species x density interaction, were not dif- ferent in either year or size class (Table 3). In 1995, the effect of species of both size classes on diatom abundance was statistically significant (Fig. 3, Table 3); however, the differences in overall diatom abun- dance were small (intercepts of log linearized data: large Batillaria = 1.46, large Cerithidea = 1.36; small Batillaria = 1.50, small Cerithidea = 1.46). In 1996, the snail species did not differ in their effect on the absolute diatom abundance (Table 3, Fig. 4).
Effects of food resource on snails
Relative growth rates of the two size classes of both species increased with increasing food densities (Figs. 5 and 6 ). For both years and both size classes, B. attramentaria grew significantly more than C. califor- nica at any given diatom density (ANCOVA: small snails 1995: F1,26 = 19.62, P < 0.00018; large snails 1995: F1,33 = 17.4, P < 0.00022, large snails 1996: F1,39 = 22.5, P < 0.00003). This higher efficiency in converting resources to tissue growth was not merely a result of differential allocation between shell vs. tis- sue, as B. attramentaria's growth surpassed that of C. californica for nearly all growth measurements taken (shell length, shell width, and wet mass) (Appendix).
Large C. californica lost tissue mass at very low diatom abundance values. The density of resource that exactly balanced basal metabolic demands for large C. californica was 3.0 plm2 diatom surface area/p.m2 sed- iment surface area in 1995 (Fig. 5) and 1.4 pm2 diatom surface area/p.m2 sediment surface area in 1996 (Fig. 6). Resource densities were never low enough in either year for B. attramentaria to exhibit zero or negative growth.
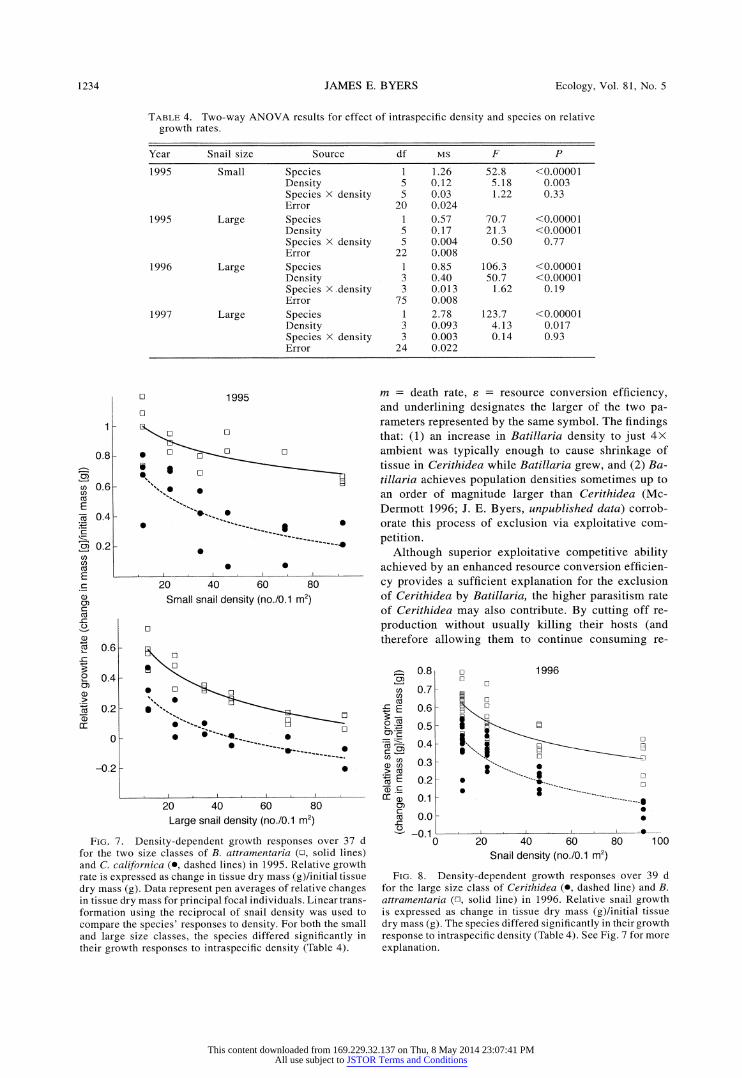
Intraspecific effects on growth
Intraspecific density had a significant effect on the relative growth of both snails in all three years (Table 4). Growth of both species declined exponentially as a function of snail density in the pens (Figs. 7, 8, and 9), indicating both intraspecific and intra-size class
TABLE 3. Two-way ANOVA results for effect of intraspecific density and species on log- normalized diatom abundances.
Year Snail size Source df MS F P
1995 Small Species 1 0.14 8.26 0.011 Density 4 0.064 3.80 0.022 Species X density 4 0.038 2.26 0.11 Error 24 0.017
1995 Large Species 1 0.068 5.64 0.027 Density 5 0.104 8.63 0.00012 Species X density 5 0.010 0.84 0.54 Error 22 0.012
1996 Large Species 1 0.028 0.64 0.43 Density 3 0.90 20.5 <0.00001 Species x density 3 0.046 1.04 0.39 Error 32 0.044
May 2000 1231
-
This content downloaded from 169.229.32.137 on Thu, 8 May 2014 23:07:41 PMAll use subject to JSTOR Terms and Conditions

Ecology, Vol. 81, No. 5
5-
4
3 -
" 1
q) 0 C:
0
5 CZ Q 4
3
2
1
Small snails
? 0
* * B **
-
l I I I I lIl l 20 40 60 80
Large snails
0
? ? "D--(0 o o i
- .--
.
**] 0 .
20 40 60 Snail density (no./0.1 m2)
80
FIG. 3. Effects of density of large and small B. attra- mentaria (0, solid lines) and C. californica (*, dashed lines) on the final density of diatoms after 37 d in 1995. Diatom abundance is expressed as diatom surface area (p.m2)/sedi- ment surface area (i.m2). Negative exponential models were fit to the data. Relationships were significant; equations (with final diatom abundance = F) are as follows: small B. attra- mentaria (R2 = 0.33), F = 4.46e-0o0024xsnaildensity; small C. cal- ifornica (R2 = 0.40), F = 4.29e-0o0044xsnaildensity; large B. attra- mentaria (R2 = 0.57), F = 4.30e-o0045xsnail density; large C. cal- ifornica (R2 = 0.63), F = 3.9e-0.0043xsnail density
competition. The species-specific growth response to density differed significantly (Table 4). Because each snail species depressed the resources to similar levels (Figs. 3 and 4), but Batillaria grew more at any given resource level than Cerithidea (Figs. 5 and 6), B. at- tramentaria consequently grew more at any given snail density (Table 4, Figs. 7 and 8). At high densities C. californica's tissue mass shrank during the course of the experiment.
Predictions of the effect of competition on snail growth
The field experiments described above quantified the species- and size-specific effects of snails on food den- sity, as well as snail growth responses to particular food levels. Because relationships of snail effects on food and snail responses to food varied between the two years examined, presumably due to differences in di- atom quality or productivity, predictions and tests of
predictions needed to come from within the same year. Data from 1996 experiments, therefore, were used to generate and test predictions, because in this year I directly quantified inter- as well as intraspecific com- petitive effects. Data from 1995, however, demonstrate the consistency of the qualitative relationships between each species/size class and its resources.
Predictions of interspecific competitive effects on growth generated from the equations describing the effects of each species on resource levels and their growth responses to resource levels corresponded well to empirical measures of competitive effects (Fig. 10). These curves were generated by substituting the effect of Cerithidea density on food levels (diatom abundance = 4.191 e-00092Xdensity) into Batillaria's response to dif- ferent food densities [Growth = (1.17 X diatom abun- dance)/(4.33 + diatom abundance)] (Fig. 10OA), as well as substituting the effect of Batillaria density on food density (diatom abundance = 4.13le-0.0077xdensity) into Cerithidea's response to food density [Growth = (1.54 X diatom abundance)/(2.51 + diatom abundance) - 0.55] (Fig. O1B). Empirically quantified growth mea- surements are compared with the predicted lines in Fig. 10. The predicted relationships accounted for 64% of the variation in Cerithidea's effect on Batillaria, and 75% of the variation in Batillaria's effect on Cerithi- dea.
DISCUSSION
Combining the independently measured components of exploitative competition, consumer effects on and responses to resource levels, correctly predicted the directly measured outcomes of individual-level effects of interspecific interactions between the snails. The
I5 E
E4
a) O c 3
a 2 E
._C 1 Cl)
0
O 0
0 I
0~~~~
0* .....--~~~~~~~~--``
0
20 40 60 Snail density (no./0.1 m2)
80 100
FIG. 4. Effects of large B. attramentaria (0, solid line) and C. californica (0, dashed line) densities on the abundance of diatoms after 39 d in 1996. Diatom abundance is expressed as diatom surface area (txm2)/sediment surface area (VLm2). Negative exponential models were fit to the curves. Regres- sion lines for the snails are significant. Equations (with final diatom abundance = F) are as follows: B. attramentaria (R2 = 0.67), F = 4.13e-00??77xsaildensity; C. californica (R2 = 0.62), F = 4.1 9e-0.0092xsnail density
1232 JAMES E. BYERS
0
I
This content downloaded from 169.229.32.137 on Thu, 8 May 2014 23:07:41 PMAll use subject to JSTOR Terms and Conditions

SUPERIOR COMPETITIVE ABILITY AIDS INVASION
Small snails n
[1
LI
0 0 @0?~
> 3 t 4
Large snails
0
o .
0
.
.
3 4
Diatom abundance (pm2 /tm2)
5
1976, Rothhaupt 1988, Wootton 1994b), and such ac- curacy in the quantitative prediction of indirect effects on individuals has seldom, if ever, been obtained.
The results of the analyses of the component parts of exploitative competition illuminate the specific mechanism responsible for the superior competitive ability of the exotic snail. In the experiments, the snails differed little (1995) or not at all (1996) in their feed- ing, and hence in the level to which a fixed density of snails suppressed the resource. The marked difference between the snails was a superior growth response by Batillaria at any given level of resource. This higher conversion efficiency was apparent in both years that consumer-resource relationships were measured and at all resource levels by both size classes of these snails. Moreover, larger body size should translate into higher fecundity (Levitan 1989, Forbes and Lopez 1990,
ED France 1992, Carroll and Quiring 1993). Thus, the pop- ulation-level consequence of Batillaria's higher con- version efficiency should be that the invading Batillaria population eventually achieves a higher density than Cerithidea. As a result the Batillaria population should drive the resource below the equilibrium density set by Cerithidea (R1*), thereby causing Cerithidea to decline and be replaced by Batillaria. The exclusion process should be accelerated by the higher mortality rate of Cerithidea. In sum, using the invasion criterion (Eq. 6):
FIG. 5. Relative change in tissue dry mass of B. attra- mentaria (L, solid lines) and C. californica (*, dashed lines) of both size classes in 1995 at different diatom abundance levels over 37 d. Diatom abundance is expressed as diatom surface area ([xm2)/sediment surface area (tm2); relative growth rate is expressed as change in tissue dry mass (g)/ initial tissue dry mass (g). Saturating functions [relative growth = (a X diatom abundance)/(b + diatom abundance) - c] were fit to the data. Equations for the lines (with AG = relative tissue growth and F = final diatom abundance) are as follows: small B. attramentaria (R2 - 0.33), AGBS = (4.06 X F)/(14.97 + F); small C. californica (R2 = 0.44), AGcs =
(3.67 X F)/(1.6 + F) - 2.07; large B. attramentaria (R2 =
0.55), AGBL = (4.92 X F)/(12.0 + F) - 0.80; large C. cal- ifornica (R2 = 0.77), LAGcL = (4.43 X F)/(1.33 + F) - 3.064. The arrows on the x-axes mark the average ambient diatom abundance at the end of the experiment.
predicted competitive effects in this community were not only qualitatively correct in terms of trends and rank order of snail growth between species, but also highly accurate quantitatively. I was able to predict 65- 75% of the variance in growth over a substantial range of density of each snail species from data on the growth rate of each species in relation to food density plus data on the effect of each species on food density. This accuracy was obtained while predicting the outcome of exploitative competition, which is an inherently indi- rect effect because it involves the effect of one species on a second mediated through a third (the resource). Previous attempts to quantify predictions of biotic re- sponses to indirect interactions have been rare (Tilman
ml/a1cle > ml2/x2s2
where Cerithidea = species 1, Batillaria = species 2,
cn 0
s .
oC
a) c
CO .
0.8
0.7
0.6
0.5
0.4
0.3
0.2
0.1
0
-0.1
. o I L
E- I l I ..---""
'I"" . 0 *
,
2 t 3 4 5
Diatom abundance (gTm2/m2)
FIG. 6. Relative change in tissue dry mass of the large size class of B. attramentaria (l, solid line) and C. californica (*, dashed line) in 1996 at different diatom abundance levels over 39 d. Diatom abundance is expressed as diatom surface area (tLm2)/sediment surface area (pJm2); relative growth rate is expressed as change in tissue dry mass (g)/initial tissue dry mass (g). Again, the saturating functions [relative growth = (a X diatom abundance)/(b + diatom abundance) - c] were fit to the data. Equations for the lines are B. attramen- taria (R2 = 0.29), AGBL = (1.17 X F)/(4.33 + F); C. cali- fornica (R2 = 0.54), AGcL = (1.54 X F)/(2.51 + F) - 0.55. The arrow on the x-axis marks the average ambient diatom abundance at the end of the experiment.
1.2
1.0-
' 0.8
cn 03 U 0.6 E
: 0.4
CD 7 0.2 (n E 0 .C 2 a)
.c 0.8
C 0.6
B 0.4 0
a) . 0.2
a) rr 0
-0.2 -
2
May 2000 1233
-
-
-
-
-
I a I I
This content downloaded from 169.229.32.137 on Thu, 8 May 2014 23:07:41 PMAll use subject to JSTOR Terms and Conditions
Ecology, Vol. 81, No. 5
TABLE 4. Two-way ANOVA results for effect of intraspecific density and species on relative growth rates.
Year Snail size Source df MS F P
1995 Small Species 1 1.26 52.8 <0.00001 Density 5 0.12 5.18 0.003 Species X density 5 0.03 1.22 0.33 Error 20 0.024
1995 Large Species 1 0.57 70.7 <0.00001 Density 5 0.17 21.3 <0.00001 Species X density 5 0.004 0.50 0.77 Error 22 0.008
1996 Large Species 1 0.85 106.3 <0.00001 Density 3 0.40 50.7 <0.00001 Species X.density 3 0.013 1.62 0.19 Error 75 0.008
1997 Large Species 1 2.78 123.7 <0.00001 Density 3 0.093 4.13 0.017 Species X density 3 0.003 0.14 0.93 Error 24 0.022
10
0.8
0.6-
0.4-
0.2-
o 1995
, o * ol FL l
2* -
"e * *
" *"., $
* ---
20 40 60 80 Small snail density (no./0.1 m2)
0.6-
0.4-
0.2 -
0
* LI
0 0~~~B E
* 0
-0.2 - 0
20 40 60 80 Large snail density (no./0.1 m2)
FIG. 7. Density-dependent growth responses over 37 d for the two size classes of B. attramentaria (n, solid lines) and C. californica (O, dashed lines) in 1995. Relative growth rate is expressed as change in tissue dry mass (g)/initial tissue dry mass (g). Data represent pen averages of relative changes in tissue dry mass for principal focal individuals. Linear trans- formation using the reciprocal of snail density was used to compare the species' responses to density. For both the small and large size classes, the species differed significantly in their growth responses to intraspecific density (Table 4).
m = death rate, e = resource conversion efficiency, and underlining designates the larger of the two pa- rameters represented by the same symbol. The findings that: (1) an increase in Batillaria density to just 4X ambient was typically enough to cause shrinkage of tissue in Cerithidea while Batillaria grew, and (2) Ba- tillaria achieves population densities sometimes up to an order of magnitude larger than Cerithidea (Mc- Dermott 1996; J. E. Byers, unpublished data) corrob- orate this process of exclusion via exploitative com- petition.
Although superior exploitative competitive ability achieved by an enhanced resource conversion efficien- cy provides a sufficient explanation for the exclusion of Cerithidea by Batillaria, the higher parasitism rate of Cerithidea may also contribute. By cutting off re- production without usually killing their hosts (and therefore allowing them to continue consuming re-
0o) (/)
5-
o w O> e
0) C" c-
0.8
0.7
0.6
0.5
0.4
0.3
0.2
0.1
n D] 1996
D
El Dl
El
0 0
0.0 -
-0.1 0
I
0
20 40 60 80 100 Snail density (no./0.1 m2)
FIG. 8. Density-dependent growth responses over 39 d for the large size class of Cerithidea (*, dashed line) and B. attramentaria (n, solid line) in 1996. Relative snail growth is expressed as change in tissue dry mass (g)/initial tissue dry mass (g). The species differed significantly in their growth response to intraspecific density (Table 4). See Fig. 7 for more explanation.
0)
E
C c
0)
0U
E
Q)
c- C)
a)
._-
a)
1234 JAMES E. BYERS
This content downloaded from 169.229.32.137 on Thu, 8 May 2014 23:07:41 PMAll use subject to JSTOR Terms and Conditions

SUPERIOR COMPETITIVE ABILITY AIDS INVASION
(o 1 CO
=- E 3- 0.8 O ._
4-.
- 0.6 C .00
(D 0.4 ._ E
a.). 0.2 cc <D
C5 0 o
1997
L []
l E3
S
*i-- 0 *
20 40 60 Snail density (no./0.1 m2)
I
--I 80
FIG. 9. Density-dependent growth responses over 60 d for the large size class of Cerithidea (*, dashed line) and B. attramentaria (0, solid line) in 1997. Relative snail growth is expressed as change in tissue dry mass (g)/initial tissue dry mass (g). The species differed significantly in their growth response to intraspecific density (Table 4). See Fig. 7 for more explanation.
sources), parasitic castrators reduce the average s in a
population. The larger reduction of s in Cerithidea than Batillaria should increase Batillaria's relative advan- tage and further foster its successful invasion.
Two principal factors that might prevent exclusion, trade-offs in competitive ability and immigration, ap- pear absent in this system. No trade-offs in the snails'
competitive ability were apparent as Batillaria grew more than Cerithidea at all resource levels in all years. Trade-offs have been demonstrated to be an essential factor in species persistence in the classic work on species coexistence (Hutchinson 1961, MacArthur and Levins 1967, Wilbur 1972, Armstrong and McGehee
1976, Tilman 1982, 1990, Warner and Chesson 1985). Recent theoretical and empirical work on Tegula spp. (marine benthic grazing snails) revealed that trade-offs in the snails' ability to affect and respond to the algal resource at different levels (area intensive vs. area ex- tensive grazing sensu Schmitt 1996) is a key factor
promoting coexistence between these otherwise highly similar species (Schmitt 1996, Wilson et al. 1999).
Immigration provides a second potential reason that empirical studies of exploitative competition between marine organisms in the field have not always con- firmed the expectation of local exclusion of inferior competitors (e.g., Peterson 1982, Branch 1984, Un- derwood 1992, Schmitt 1996). Unlike most marine or- ganisms, both of these mud snails produce nonplank- tonic, dispersal-limited young (Whitlatch and Obrebski 1980, Race 1981, McDermott 1996), such that local- ized differences in body growth directly translate into differences in local input of newborns. Within a closed
system where progeny are predominantly offspring of the local population, the influences of local, density- dependent processes, such as the effect of competition on individual growth, are directly related to local re-
cruitment/fecundity. Thus, in closed systems compet- itive effects have quicker and more direct impacts on local populations than typically found in open systems. As the Cerithidea-Batillaria system examined here is both closed and lacking in competitive trade-offs, ex- clusion of the inferior native competitor is unlikely to be prevented.
While the experiments described here quantify rates of resource use and conversion of resource and snail density for only 5 /2-8 12 weeks at a time, the findings from these time periods are relevant to annualized rates for three primary reasons. First, the snail species are dormant for all of late fall through winter months (No- vember-March) (Whitlatch 1974, McCloy 1979, Race 1981, Sousa 1983). Secondly, McDermott (1996) con-
0.7 A
n
a 0.6 , E CO -F
B 5 0.5
I 0.4
c .
Co
' 0.2
- 0.6 CD
(| 0.5 - E
+s 0.4 0 ._
.a 0.3 xn
; E 0.2 .zc 0E 0.2 Q) n
g-. 0.1 Co 0~
0 0
) 20 40 60 80 Cerithidea density (no./0.1 m2)
100
B
+4
100 20 40 60 80
Batillaria density (no./0.1 m2)
FIG. 10. Predicted relative growth of each snail species across a density gradient of heterospecific competitors (solid lines). Relative growth rate is expressed as change in tissue dry mass (g)/initial tissue dry mass (g). Functions were de- rived for large snails in 1996 from mathematical relationships describing the effect of each snail on the resource (Fig. 5) and the growth response of each snail to various resource densities (Fig. 7). Symbols (A, A) represent direct measure- ments of relative snail growth at each density of heterospecific competitor (?+ 1 SE). (A) Effects of C. californica density on B. attramentaria growth rates. The R2 value of the fit of the observed points to the prediction line is 0.64. (B) Effects of B. attramentaria density on C. californica growth rates. The R2 value of the fit of the observed points to the prediction line is 0.75.
May 2000 1235
I -
i-
i -
II -
I -
I
This content downloaded from 169.229.32.137 on Thu, 8 May 2014 23:07:41 PMAll use subject to JSTOR Terms and Conditions
Ecology, Vol. 81, No. 5
ducted similar studies on snail density effects on growth in 21-25 mm Batillaria and Cerithidea in Bol- inas Lagoon. His experiment spanned 71 d (22 July- 30 Sept 1995) and provide measurements of compet- itive effects on snail growth 55-60 d later in the year than my experiments. Using ambient and 2x ambient densities he found the difference in absolute growth of Batillaria to be - 2X greater than Cerithidea. Likewise, his results indicate a substantial advantage to Batillaria through a mortality rate nearly eight times less that of Cerithidea (Cerithidea 12.1% vs. Batillaria 1.6%). Fi- nally, the results presented here incorporate three years of interannual variation. In all years, (1) Cerithidea and Batillaria affected their food resource to an almost identical degree, (2) Batillaria responded to food levels with a higher resource conversion efficiency, (3) Ba- tillaria's superior resource conversion held for all lev- els of resource, i.e., trade-offs in the ability of Batil- laria to exploit the resource as resource levels varied were not apparent, and (4) intraspecific density had a much greater effect on growth rates of Cerithidea than Batillaria. The consistency of the results despite var- iable conditions that undoubtedly existed between these years underscores their robustness in describing interactions applicable to a time period longer than each individual experiment.
Role of competition in species invasion
Many studies that have attempted to document the mechanisms responsible for the success of introduced species have emphasized the role of "predator-free space" (e.g., Debach 1974, Goeden and Louda 1976, Kuris and Norton 1985, Pimm 1987, Meng and Orsi 1991). The role of competitive ability enabling inva- sions has received much less attention. Certainly, the well-developed body of theory on competitive exclu- sion has not, for the most part, been incorporated into empirical studies of nonindigenous species invasion. Elton (1958) suggested that empty niches, i.e., the lack of competition, within some communities facilitated establishment of invading species. Several years later, this hypothesis shaped a large part of island biogeog- raphy theory, and the ease of insular invasions was often attributed to the lack of competition (MacArthur and Wilson 1967, Simberloff and Wilson 1970, Dia- mond 1975). Additionally, nonequilibrium theory em- phasized the role that disturbances played in keeping populations from attaining equilibrium levels, thereby reducing the role of competition in community inter- actions, which aided the invasion/establishment of competitively inferior species (Paine 1966, Wiens 1977, Connell 1978, Huston 1979, Sousa 1979). Recent work has suggested that not all unsaturated commu- nities are more invasible than saturated communities (Herbolde and Moyle 1986, Crawley 1987), and con- troversy over the vulnerability of islands to invasions has grown (Lake and O'Dowd 1991, Simberloff 1995).
Ambiguity regarding the role of competition in in-
vasions may result from difficulties in demonstrating competition unequivocally. Lodge (1993) concludes from his review of biological invasions that the two leading causes of failed exotic establishment are in- appropriate climate and predation. He also states, how- ever, that the effects of competition, disease, and other factors are likely underestimated since they are more difficult to measure. If superior competitive abilities are responsible for successful species invasions, it may be very difficult to catch exotic-native interactions be- fore complete exclusion has occurred (Murdoch et al. 1996). Studies of animal invasions that have attributed the success of an exotic species to superior competitive abilities often exhibit shortcomings. Many of these studies are frequently supported by observational rath- er than experimentally derived evidence (Nevo et al. 1972, Crowell 1973, Porter et al. 1988, Doncaster 1992, Douglas et al. 1994, Caron et al. 1996). For example, overlap in resource use between an exotic and a native species is often considered ample evidence that com- petitive ability is important to the establishment of the exotic species.
In conclusion, the approach applied here confirms a potentially important pathway of interaction between a native and an introduced species that has seldom been examined experimentally. In this system, although oth- er mechanisms may have important roles, exploitative competition appears to provide a substantial, and cer- tainly sufficient, explanation of the exotic species' suc- cess at invasion. The specific mechanism of Batillaria's success is not through superior exploitation of the re- source, as is often the mechanism assumed or examined in competitive displacement studies (Human and Gor- don 1996, Petren and Case 1996, De Biseau et al. 1997, Ducobu et al. 1998), but rather through superior con- version of the resource (as in Murdoch et al. 1996). Future studies of exotic invasions should not auto- matically assume the primacy of "predator-free space" as the driving force behind exotic species' success, but consider other potentially important mechanisms, such as superior competitive ability, as important forces as well.
ACKNOWLEDGMENTS
Thanks to the O'Connors for their tremendous hospitality at Bolinas field site. Field work was made possible by the gallant (and muddy) efforts of M. Andreni, B. Bezy, D. Con- lin, B. Ihrig, S. McDermott, and W. Rimer. Lab work was greatly aided by R. Hudson and L. Kromer. S. Gaines, B. Menge, B. Murdoch, R. Schmitt, and two anonymous re- viewers provided extremely valuable input on earlier drafts. Additional thanks to R. Bolser, T. Byers, S. Cooper, K. Laf- ferty, H. Lenihan, W. McClintock, S. Navarrete, E. Noonburg, A. Sarnelle, J. Shima, E. Solomon, P. Taylor, E. Wieters, and H. J. Yoo for comments and discussions on the manuscript. Research was conducted under National Marine Sanctuary Permits GFNMS-04-96 and 01-97 and was funded by an NSF Graduate Research Fellowship.
LITERATURE CITED
Abbott, D. P., and E. C. Haderlie. 1980. Prosobranchia: ma- rine snails. Pages 230-307 in R. H. Morris, D. P. Abbott,
1236 JAMES E. BYERS
This content downloaded from 169.229.32.137 on Thu, 8 May 2014 23:07:41 PMAll use subject to JSTOR Terms and Conditions

SUPERIOR COMPETITIVE ABILITY AIDS INVASION
and E. C. Haderlie, editors. Intertidal invertebrates of Cal- ifornia. Stanford University Press, Stanford, California, USA.
Armstrong, R. A., and R. McGehee. 1976. Coexistence of two competitors on one resource. Journal of Theoretical Biology 56:499-502.
Bertness, M. D. 1984. Habitat and community modification by an introduced herbivorous snail. Ecology 65:370-381.
Bonnot, P. 1935. The California oyster industry. California Fish and Game 21:65-80.
Branch, G. M. 1984. Competition between marine organisms: ecological and evolutionary implications. Oceanography and Marine Biology Annual Reviews 22:429-593.
Brown, J. H., and D. W. Davidson. 1977. Competition be- tween seed-eating rodents and ants in desert ecosystems. Science 196:880-882.
Brown, K. M. 1982. Resource overlap and competition in pond snails: and experimental analysis. Ecology 63:412- 422.
Byers, J. E. 2000. The distribution of an introduced mollusc and its role in the long-term demise of a native confamilial species. Biological Invasions, in press.
Carlton, J. T. 1975. Extinct and endangered populations of the endemic mudsnail Cerithidea californica in Northern California. Bulletin of the American Malacological Union 41:65-66.
Carlton, J. T. 1992. Introduced marine and estuarine mollusks of North America: an end-of-the-20th-century perspective. Journal of Shellfish Research 11:489-505.
Carlton, J. T., and J. B. Geller. 1993. Ecological roulette: the global transport of nonindigenous marine organisms. Sci- ence 261:78-82.
Caron, A., G. Desrosiers, and C. Retiere. 1996. Comparison of spatial overlap between the polychaetes Nereis virens and Nephtys caeca in two intertidal estuarine environments. Marine Biology 124:537-550.
Carroll, A. L., and D. T. Quiring. 1993. Interactions between size and temperature influence fecundity and longevity of a tortricid moth, Zeiraphera canadensis. Oecologia 93:233- 241.
Cody, M. L. 1968. On the methods of resource division in grassland bird communities. American Naturalist 102:107- 147.
Cohen, A. N., and J. T. Carlton. 1998. Accelerating invasion rate in a highly invaded estuary. Science 279(5350):555- 558.
Connell, J. H. 1978. Diversity in tropical rain forests and coral reefs. Science 199:1302-1310.
Crawley, M. J. 1987. What makes a community invasible? Pages 429-453 in A. J. Gray, M. J. Crawley, and P. J. Edwards, editors. Colonization, succession, and stability. Blackwell Scientific, Oxford, UK.
Crowell, K. L. 1973. Experimental zoogeography: introduc- tions of mice to small islands. American Naturalist 107: 535-558.
Curtis, L. A., and L. E. Hurd. 1981. Nutrient procurement strategy of a deposit-feeding estuarine neogastropod, Ily- anassa obsoleta. Estuarine Coastal Shelf Science 13:277- 285.
Debach, P. 1974. Biological control by natural enemies. Cam- bridge University Press, London, UK.
De Biseau, J-C., Y. Quinet, L. Deffernez, and J. M. Pasteels. 1997. Explosive food recruitment as a competitive strategy in the ant Myrmica sabuleti (Hymenoptera, Formicidae). Insectes Sociaux 44:59-73.
Diamond, J. M. 1975. Assembly of species communities. Pages 342-444 in M. L. Cody and J. M. Diamond, editors. Ecology and evolution of communities. Harvard University Press, Cambridge, Massachusetts, USA.
Dickson, G. D. 1936. A study of the factors controlling the
distribution and behavior of the California horn shell, Cer- ithidea californica. B.S. thesis. Bodega Marine Laboratory, Bodega Bay, California, USA.
Doncaster, C. P. 1992. Testing the role of intraguild predation in regulating hedgehog populations. Proceedings of the Royal Society of London Series B Biological Sciences 249: 113-117.
Douglas, M. E., P. C. Marsh, and W. L. Minckley. 1994. Indigenous fishes of western North America and the hy- pothesis of competitive displacement: Meda fulgida (Cy- prinidae) as a case study. Copeia 1994:9-19.
Drake, J. A., H. A. Mooney, F. di Castri, R. H. Groves, F J. Kruger, M. Rejmanek, and M. Williamson. 1989. Ecology of biological invasions: a global perspective. John Wiley and Sons, Chichester, UK.
Driscoll, A. L. 1972. Structure and function of the alimentary tract of Batillaria zonalis and Cerithidea californica, style bearing mesogastropods. Marine Biology 58:219-225.
Ducobu, H., J. Huisman, R. R. Jonker, and L. R. Mur. 1998. Competition between a prochlorophyte and a cyanobacte- rium under various phosphorus regimes: comparison with the Droop model. Journal of Phycology 34:467-476.
Eisenberg, R. M. 1966. The regulation of density in a natural population of the pond snail, Lymnaea elodes. Ecology 47: 889-906.
Elton, C. 1958. The ecology of invasions by animals and plants. Methuen, London, UK.
Fenchel, T. 1975. Factors determining the distribution pat- terns of mud snails (Hydrobiidae). Oecologia 20:1-17.
Fenchel, T., and L. H. Kofoed. 1976. Evidence for exploit- ative interspecific competition in mud snails (Hydrobiidae). Oikos 27:367-376.
Forbes, V. E., and G. R. Lopez. 1990. The role of sediment type in growth and fecundity of mud snails (Hydrobiidae). Oecologia 83:53-61.
France, R. L. 1992. Biogeographical variation in size-specific fecundity of the amphipod Hyalella azteca. Crustaceana 62: 240-248.
Gause, G. F. 1932. Experimental studies on the struggle for existence. Journal of Experimental Biology 9:389-402.
Goeden, R. D., and S. M. Louda. 1976. Biotic interference with insects imported for weed control. Annual Review of Entomology 21:325-342.
Grosholz, E. D., and G. M. Ruiz. 1996. Predicting the impact of introduced marine species: lessons from the multiple invasions of the European green crab Carcinus maenas. Biological Conservation 78:59-66.
Herbold, B., and P. Moyle. 1986. Introduced species and vacant niches. American Naturalist 125:751-760.
Holt, R. D., J. Grover, and D. Tilman. 1994. Simple rules for interspecific dominance in systems with exploitative and apparent competition. American Naturalist 144:741- 771.
Huffaker, C. B. 1971. The phenomenon of predation and its roles in nature. Pages 327-343 in P. J. den Boer and G. R. Gradwell, editors. Dynamics of populations. Center for Ag- ricultural Publications and Documentation, Wageningen, The Netherlands.
Human, K. G., and D. M. Gordon. 1996. Exploitation and interference competition between the invasive Argentine ant, Linepithema humile, and native ant species. Oecologia 105:405-412.
Huston, M. A. 1979. A general hypothesis of species diver- sity. American Naturalist 113:81-101.
Hutchinson, G. E. 1961. The paradox of the plankton. Amer- ican Naturalist 95:137-145.
Kerfoot, W. C., W. R. DeMott, and C. Levitan. 1985. Non- linearities in competitive interactions: component variables or system response? Ecology 66:959-965.
Kuris, A. M., and S. P. Norton. 1985. Evolutionary impor-
May 2000 1237
This content downloaded from 169.229.32.137 on Thu, 8 May 2014 23:07:41 PMAll use subject to JSTOR Terms and Conditions

Ecology, Vol. 81, No. 5
tance of overspecialization: insect parasitoids as an ex- ample. American Naturalist 126:387-391.
Lack, D. 1945. The ecology of closely related species with special reference to cormorant (Phalacrocorax carbo) and shag (P. aristotelis). Journal of Animal Ecology 14:12-16.
Lafferty, K. D. 1993a. Effects of parasitic castration on growth, reproduction and population dynamics of the ma- rine snail Cerithidea californica. Marine Ecology Progress Series 96:229-237.
Lafferty, K. D. 1993b. The marine snail, Cerithidea califor- nica, matures at smaller sizes where parasitism is high. Oikos 68:3-11.
Lafferty, K. D., and A. M. Kuris. 1996. Biological control of marine pests. Ecology 77:1989-2000.
Lake, P. S., and D. J. O'Dowd. 1991. Red crabs in rain forest, Christmas Island: biotic resistance to invasion by an exotic snail. Oikos 62:25-29.
Lawton, J. H., and K. C. Brown. 1986. The population and community ecology of invading insects. Philosophical Transactions of the Royal Society of London B 314:607- 617.
Levinton, J. S. 1985. Complex interactions of a deposit feeder with its resources: roles of density, a competitor, and de- trital addition in the growth and survival of the mudsnail Hydrobia totteni. Marine Ecology Progress Series 22:31- 40.
Levitan, D. R. 1989. Density dependent size regulation in Diadema antillarum: effects on fecundity and survivorship. Ecology 70:1414-1424.
Lodge, D. M. 1993. Biological invasions: lessons for ecol- ogy. Trends in Ecology and Evolution 8:133-137.
Lopez, G. R., and J. S. Levinton. 1987. Ecology of deposit- feeding animals in marine sediments. Quarterly Review of Biology 62:235-260.
MacArthur, R. H. 1958. Population ecology of some warblers of northeastern coniferous forests. Ecology 39:599-619.
MacArthur, R. H., and R. Levins. 1967. The limiting simi- larity, convergence, and divergence of coexisting species. American Naturalist 101:377-385.
MacArthur, R. H., and E. 0. Wilson. 1967. The theory of island biogeography. Princeton University Press, Princeton, New Jersey, USA.
McCloy, M. J. 1979. Population regulation in the deposit feeding mesogastropod Cerithidea californica as it occurs in a San Diego salt marsh. Thesis. San Diego State Uni- versity, San Diego, California, USA.
McDermott, S. 1996. Parasites, density, and disturbance: fac- tors influencing coexistence of Cerithidea californica and Batillaria attramentaria. Thesis. Moss Landing Marine Laboratory, California State University, Fresno, California, USA.
McLean, J. H. 1960. Batillaria cumingi, introduced cerithid in Elkhorn Slough. Veliger 2:61-63.
Meng, L., and J. J. Orsi. 1991. Selective predation by larval striped bass on native and introduced copepods. Transac- tions of the American Fisheries Society 120:187-192.
Mills, E. L., J. H. Leach, J. T. Carlton, and C. L. Secor. 1993. Exotic species in the Great Lakes: a history of biotic crises and anthropogenic introductions. Journal of Great Lakes Research 19:1-54.
Mittelbach, G. G. 1988. Competition among refuging sun- fishes and effects of fish density on littoral zone inverte- brates. 69:614-623.
Murdoch, W. W., C. J. Briggs, and R. M. Nisbet. 1996. Com- petitive displacement and biological control in parasitoids: a model. American Naturalist 148:807-826.
Nevo, E., G. Gorman, M. Soule, S. Y. Yang, R. Clover, and V. Jovanovic. 1972. Competitive exclusion between Insular Lacerta species (Sauria, Lacertidae). Oecologia 10:183- 190.
Olafsson, E. B. 1986. Density dependence in suspension- feeding and deposit-feeding populations of the bivalve Ma- coma balthica: a field experiment. Journal of Animal Ecol- ogy 55:517-526.
Osenberg, C. W. 1989. Resource limitation, competition, and the influence of life history in a fresh water snail com- munity. Oecologia 79:512-519.
Paine, R. T. 1966. Food web complexity and species diver- sity. American Naturalist 100:65-75.
Peterson, C. H. 1982. The importance of predation and intra- and interspecific competition in the population biology of two infaunal suspension-feeding bivalves, Protothaca staminea and Chione undatella. Ecological Monographs 52: 437-475.
Petren, K., and T. J. Case. 1996. An experimental demon- stration of exploitation competition in an ongoing invasion. Ecology 77:118-132.
Pimm, S. L. 1987. Determining the effects of introduced species. Trends in Ecology and Evolution 2:106-108.
Porter, S. D., B. Van Eimeren, and L. E. Gilbert. 1988. In- vasion of red imported fire ants (Hymenoptera: Formici- dae): microgeography of competitive replacement. Annals of the Entomological Society of America 81:913-918.
Race, M. S. 1981. Field ecology and natural history of Cer- ithidea californica (Gastropoda: Prosobranchia) in San Francisco Bay. Veliger 24:18-27.
Race, M. S. 1982. Competitive displacement and predation between introduced and native mud snails. Oecologia 54: 337-347.
Rothhaupt, K. 0. 1988. Mechanistic resource competition theory applied to laboratory experiments with zooplankton. Nature 333:660-662.
Ruesink, J. L., I. M. Parker, M. J. Groom, and P. M. Kareiva. 1995. Reducing the risks of nonindigenous species intro- duction. BioScience 45:465-477.
Schmitt, R. J. 1985. Competitive interactions of two mobile prey species in a patchy environment. Ecology 66:950- 958.
Schmitt, R. J. 1996. Exploitation competition in mobile graz- ers: tradeoffs in use of a limited resource. Ecology 77:408- 425.
Simberloff, D. 1995. Why,do introduced species appear to devastate islands more than mainland areas? Pacific Sci- ence 49:87-97.
Simberloff, D. S., and E. 0. Wilson. 1970. Experimental zoogeography of islands: a two-year record of colonization. Ecology 51:934-937.
Skilleter, G. A., and A. J. Underwood. 1993. Intra- and inter- specific competition for food in infaunal coral reef gastro- pods. Journal of Experimental Marine Biology and Ecology 173:29-55.
Sousa, W. P. 1979. Disturbance in marine intertidal boulder fields: the nonequilbrium maintenance of species diversity. Ecology 60:1225-1239.
Sousa, W. P. 1983. Host life history and the effect of parasitic castration on growth: a field study of Cerithidea californica (Gastropoda: Prosobranchia) and its trematode parasites. Journal of Experimental Marine Biology and Ecology 73: 273-296.
SYSTAT 1992. Systat statistics manual, version 5.2. SYS- TAT, Evanston, Illinois, USA.
Tilman, D. 1976. Ecological competition between algae: ex- perimental confirmation of resource-based competition the- ory. Science 192:463-465.
Tilman, D. 1982. Resource competition and community structure. Princeton University Press, Princeton, New Jer- sey, USA.
Tilman, D. 1987. The importance of the mechanisms of in- terspecific competition. American Naturalist 129:769-774.
1238 JAMES E. BYERS
This content downloaded from 169.229.32.137 on Thu, 8 May 2014 23:07:41 PMAll use subject to JSTOR Terms and Conditions

SUPERIOR COMPETITIVE ABILITY AIDS INVASION
Tilman, D. 1990. Constraints and tradeoffs: toward a predictive theory of competition and succession. Oikos 58:3-15.
Trowbridge, C. D. 1995. Establishment of green alga Codium fragile ssp. tomentosoides on New Zealand rocky shores: current distribution and invertebrate grazers. Journal of Ecology 83:949-965.
Underwood, A. J. 1992. Competition and marine plant-an- imal interactions. Pages 443-475 in J. H. Price, editor. Plant-animal interactions in the marine benthos. Claren- don, Oxford, UK.
Warner, R. R., and P. L. Chesson. 1985. Coexistence mediated by recruitment fluctuations: a field guide to the storage effect. American Naturalist 125:769-787.
Wells, J. D., and G. Henderson. 1993. Fire ant predation on native and introduced subterranean termites in the labo- ratory: effect of high soldier number in Coptotermes for- mosanus. Ecological Entomology 18:270-274.
Whitlatch, R. B. 1972. The ecological life history and feeding biology of Batillaria zonalis. Thesis. Pacific Marine Sta- tion, University of the Pacific, Dillion Beach, California, USA.
Whitlatch, R. B. 1974. Studies on the population ecology of the salt marsh gastropod Batillaria zonalis. Veliger 17:47-55.
Whitlatch, R. B., and S. Obrebski. 1980. Feeding selectivity
and coexistence in two deposit feeding gastropods. Marine Biology 58:219-225.
Wiens, J. A. 1977. On competition and variable environ- ments. American Scientist 65:590-597.
Wilbur, H. M. 1972. Competition, predation, and the structure of the Ambystoma-Rana sylvatica community. Ecology 53: 3-21.
Wilson, C. G. 1989. Post-dispersal seed predation of an ex- otic weed, Mimosa pigra L., in the Northern Territory. Aus- tralian Journal of Ecology 14:235-240.
Wilson, W. G., C. W. Osenberg, R. J. Schmitt, and R. Nisbet. 1999. Complementary foraging behavior allows coexis- tence of two grazers. Ecology 80:2358-2372.
Wootton, J. T. 1994a. Predicting direct and indirect effects: an integrated approach using experiments and path anal- ysis. Ecology 75:151-165.
Wootton, J. T. 1994b. The nature and consequences of in- direct effects in ecological communities. Annual Review of Ecology and Systematics 25:433-466.
Yamada, S. B. 1982. Growth and longevity of the mud snail Batillaria attramentaria. Marine Biology 67:187-192.
Yamada, S. B., and C. S. Sankurathri. 1977. Direct devel- opment in the intertidal gastropod Batillaria zonalis. Ve- liger 20:179.
APPENDIX
A table reporting average relative changes of different per capita metrics of growth of both sizes and both species of snail for all years is available in ESAs Electronic Data Archive: Ecological Archives E081-013.
May 2000 1239
This content downloaded from 169.229.32.137 on Thu, 8 May 2014 23:07:41 PMAll use subject to JSTOR Terms and Conditions