competition and product diferentiation. biosimilars …
TRANSCRIPT

1
COMPETITION AND PRODUCT DIFERENTIATION.
BIOSIMILARS´ ENTRY VERSUS BIOLOGICAL DRUGS
MANUEL GARCIA-GOÑI
Universidad Complutense de Madrid. [email protected]
DAVID CANTARERO-PRIETO Universidad de Cantabria. [email protected]
FELIX LOBO ALEU
Universidad Carlos III de Madrid. [email protected]
17-19 Junio 2015. Granada. XXXV Jornadas AES “Salud, Bienestar y Cohesión Social: hacia un enfoque transversal de las políticas”

2
3. An economic framework for analysing biosimilars versus biological products
The structure of the paper
4. Discussion and Conclusion
1. Introduction
2. A first look at the data

3
1. INTRODUCTION
Starting point of biologic drugs had remarkable effects on public health but any new step is difficult
Problem: biological drugs are not accessible to all patients need due to high costs and financing difficulties especially since 2008 crisis. This is so even if patients’ health and welfare should be the highest priority
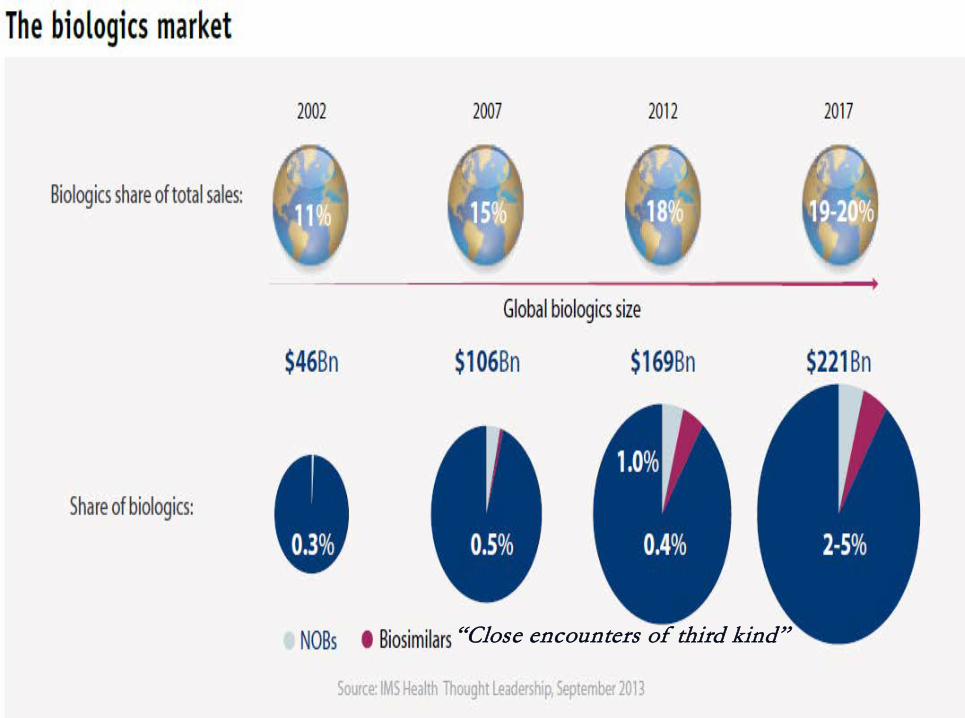
The relevance of this analysis stems from growing health spending in these products. Inside OECD pharmaceutical expenditure, % of biological drugs are increasing and expected to be 20% in 2017 (oncology, nephrology, rheumatology, etc. as suggests IMS Institute for Healthcare Informatics)

4
1. INTRODUCTION
Growth biologics market is influenced by use of monoclonal antibodies (degenerative and tumor diseases)
Biosimilars share and its competence degree is small (not less than 0.5 %) although it is increasing (Farfan et al., 2014)
Pharmaeconomics as drug economic evaluation (most efficient technology) has been growing: how much do you pay for a fixed health gain or return ? (Cutler, 2014)
It is important to disentangle this idea: generate savings and find efficient alternatives in medicines for healthcare systems

5
1. INTRODUCTION
Basic: clinical guidelines, best practices, protocols by consensus in groups of scientific societies. Nevertheless, it causes problems to doctors if they pretend to order last generation drugs difficult to achieve (Van de Vooren et al., 2015)
Even more diseases (rheumatism, cancer, ... ) with these medications could become in more chronic and long-run spending
To control pharmaceutical expenditure: if you treat older patients it could be possible to decrease the price of a drug to “reasonable" level (which are?) as you can "pay" (in Spanish Regional Health Services if we focus on top 10 drugs in cost terms there were 6 of it up to 48,000 euros in cancer disease) and to be "negotiated" (sharing risk?, maximum expenditure ceiling ... but not for sick patients?). The question is to take into account the drug values
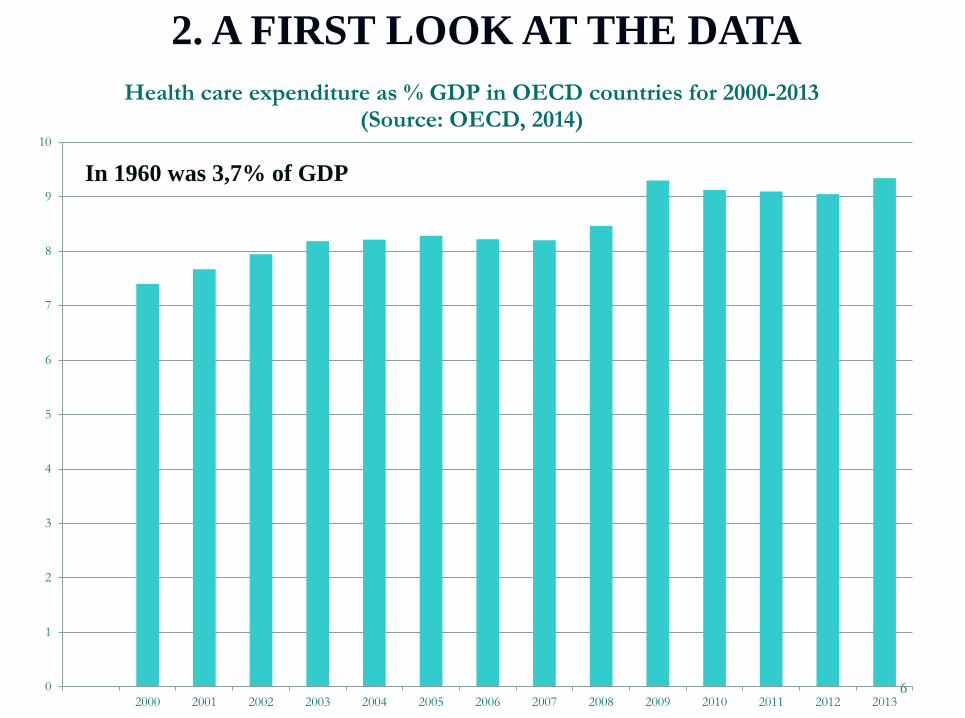
6 0
1
2
3
4
5
6
7
8
9
10
2000 2001 2002 2003 2004 2005 2006 2007 2008 2009 2010 2011 2012 2013
Health care expenditure as % GDP in OECD countries for 2000-2013 (Source: OECD, 2014)
2. A FIRST LOOK AT THE DATA
In 1960 was 3,7% of GDP

7
Pharmaceutical expenditure (as a percentage of total expenditure on health) Percentage 2006 2007 2008 2009 2010 2011 2012
Australia 14,3 14,3 14,6 14,7 15,4 14,7 ..
Austria 12,9 13,1 13,1 11,9 11,8 11,7 11,5
Belgium 18,9 18,6 18,1 18,1 17,9 17,1 16,6
Canada 17,4 17,2 17,0 17,0 16,6 17,1 ..
Chile 13,0 12,3 12,4 11,6 13,2 13,1 13,0
Czech Republic 22,8 21,5 20,4 21,5 19,9 20,0 21,1
Denmark 8,3 8,5 8,0 7,3 7,4 6,8 6,3
Estonia 23,5 21,4 20,7 23,5 21,8 21,5 21,5
Finland 14,7 14,8 14,8 14,2 13,9 13,4 13,3
France 16,7 16,7 16,5 16,2 16,0 15,6 15,2
Germany 14,7 15,0 15,0 14,9 14,7 14,1 13,9
Greece 22,7 24,8 .. 27,8 28,3 26,8 24,9
Hungary 31,0 30,6 31,1 32,5 32,9 34,2 31,8
Iceland 14,2 13,5 14,6 15,7 15,8 15,4 14,5
Ireland 17,1 16,9 16,8 16,7 17,9 17,5 17,1
Israel (1) 12,8 13,1 12,9 13,5 13,2 .. ..
Italy 19,6 19,2 18,1 17,5 16,9 16,6 16,0
Japan 19,5 19,9 19,7 20,7 20,3 20,8 ..
Korea 23,9 22,7 22,5 22,0 21,5 21,3 19,8
Luxembourg 8,8 9,7 9,3 9,3 9,0 9,0 8,7
Mexico 3,5 5,2 5,5 5,0 5,5 6,6 6,6
Netherlands 10,3 10,5 9,9 9,7 9,4 9,3 ..
New Zealand 11,3 10,4 9,7 9,5 9,5 9,4 ..
Norw ay 8,7 8,0 7,5 7,3 7,4 6,9 6,7
Poland 27,2 24,8 23,0 22,9 22,7 22,5 20,9
Portugal 21,2 21,0 20,3 19,4 18,5 17,9 ..
Slovak Republic 29,7 27,9 27,6 26,6 27,5 27,4 25,4
Slovenia 19,9 19,2 18,0 18,4 19,1 18,9 19,2
Spain 19,1 18,6 18,3 18,2 18,3 17,4 ..
Sw eden 13,4 13,1 12,9 12,7 12,5 12,0 11,6
Sw itzerland 10,4 10,3 10,1 10,1 9,7 9,4 9,2
United Kingdom 12,3 12,0 11,5 .. .. .. ..
United States 12,6 12,6 12,3 12,4 12,0 11,9 11,5
8
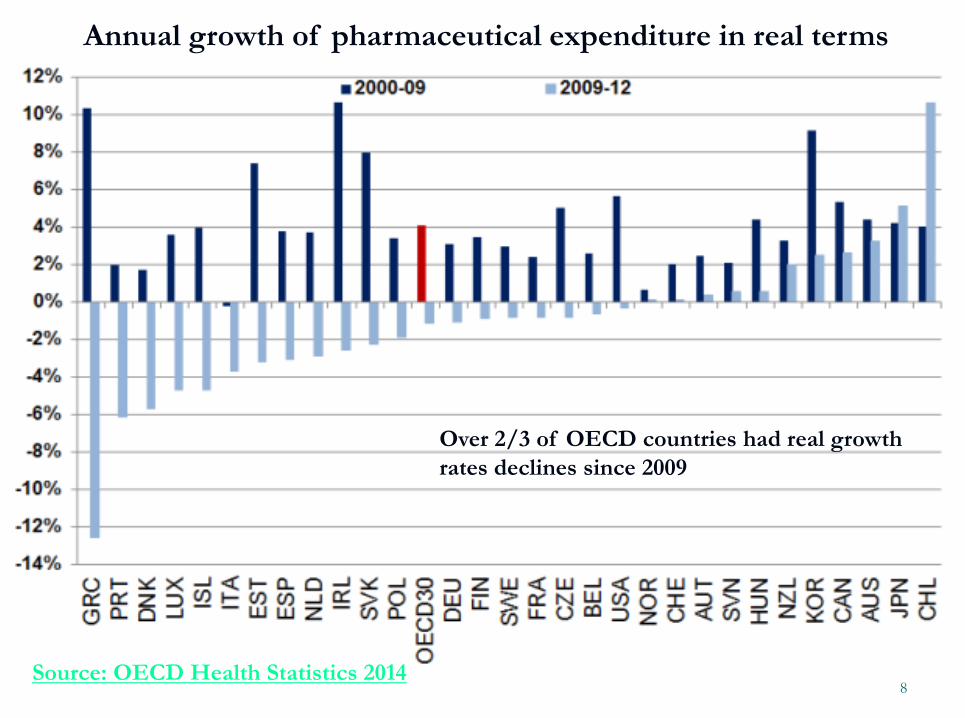
Annual growth of pharmaceutical expenditure in real terms
Over 2/3 of OECD countries had real growth rates declines since 2009
Source: OECD Health Statistics 2014


11
3. AN ECONOMIC FRAMEWORK FOR ANALYSING BIOSIMILARS VERSUS
BILOGICAL PRODUCTS
Summarizing literature and introduce our approach to model biosimilars market
Grabowski et al. (2007) models biosimilar markets as monopolistic competition but price decrease is not as greater than in the generics.
Chauhan, Towse and Mestre (2008) in a duopoly model with differentation, show that price depends on elasticity demand. Moreover, as Hidalgo (2014)
Empirical evidence: Price falls lower than we expected (Rovira, Espin, García and Olry, 2011) and no independent data in order to validate results
Our proposed theoretical model is useful to assess the impact

12
3. AN ECONOMIC FRAMEWORK FOR ANALYSING BIOSIMILARS VERSUS BILOGICAL PRODUCTS:
OUR PROPOSED MODEL
Bertrand competition with homogeneous products (branded and generics)
• Branded and generics are considered as the same
• So, they are equally affected by prices Profit maximization program
• Cost functions might be or not the same
• 2 companies compete in prices
STEP 1: inverse demand function
STEP 2
STEP 3 Solution • If MC are equal for both companies • No profits, market equally shared, and
social welfare is maximized
13
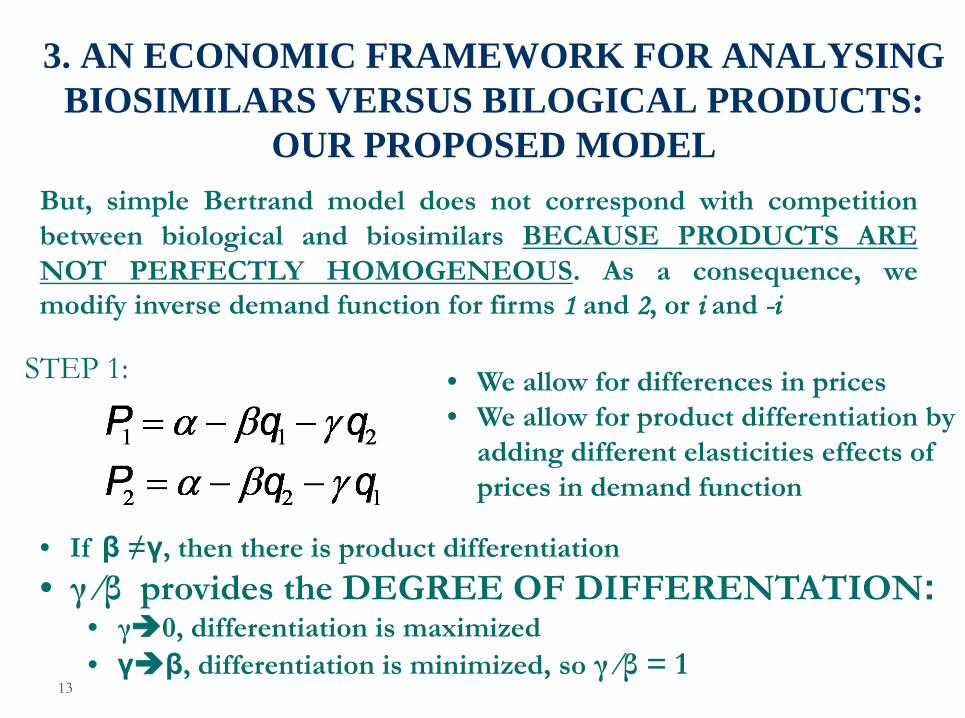
3. AN ECONOMIC FRAMEWORK FOR ANALYSING BIOSIMILARS VERSUS BILOGICAL PRODUCTS:
OUR PROPOSED MODEL
• We allow for differences in prices • We allow for product differentiation by
adding different elasticities effects of prices in demand function
But, simple Bertrand model does not correspond with competition between biological and biosimilars BECAUSE PRODUCTS ARE NOT PERFECTLY HOMOGENEOUS. As a consequence, we modify inverse demand function for firms 1 and 2, or i and -i
STEP 1:
• If β ≠γ, then there is product differentiation • γ ⁄β provides the DEGREE OF DIFFERENTATION:
• γ0, differentiation is maximized • γβ, differentiation is minimized, so γ ⁄β = 1

14
3. AN ECONOMIC FRAMEWORK FOR ANALYSING BIOSIMILARS VERSUS BILOGICAL PRODUCTS:
OUR PROPOSED MODEL
• Still Bertrand competition and companies choose prices
• We assume constant marginal costs:
STEP 2: Profit maximization program for firm i and -i
We use:
So that, the program becomes:

15
3. AN ECONOMIC FRAMEWORK FOR ANALYSING BIOSIMILARS VERSUS BILOGICAL PRODUCTS:
OUR PROPOSED MODEL
STEP 3: Following first order conditions, reaction functions are:
And Nash equilibrium, rearranging terms is:

16
3. AN ECONOMIC FRAMEWORK FOR ANALYSING BIOSIMILARS VERSUS BILOGICAL PRODUCTS:
OUR PROPOSED MODEL
STEP 3:
Finally, we calculate the profit for firm i at equilibrium
17
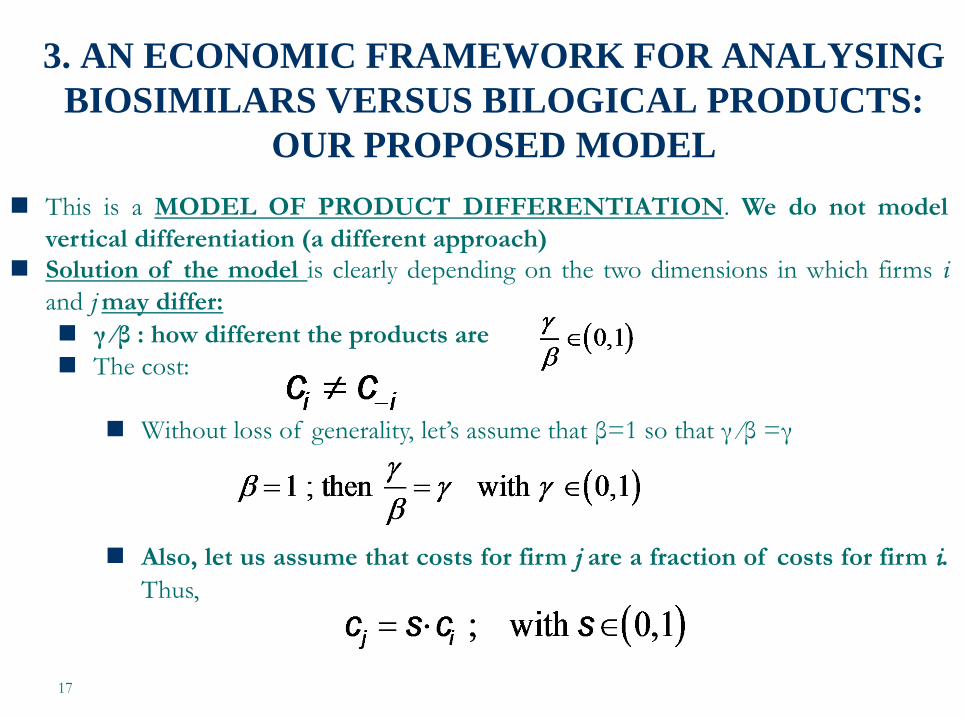
3. AN ECONOMIC FRAMEWORK FOR ANALYSING BIOSIMILARS VERSUS BILOGICAL PRODUCTS:
OUR PROPOSED MODEL This is a MODEL OF PRODUCT DIFFERENTIATION. We do not model
vertical differentiation (a different approach) Solution of the model is clearly depending on the two dimensions in which firms i
and j may differ: γ ⁄β : how different the products are The cost:
Without loss of generality, let’s assume that β=1 so that γ ⁄β =γ
Also, let us assume that costs for firm j are a fraction of costs for firm i.
Thus,
18
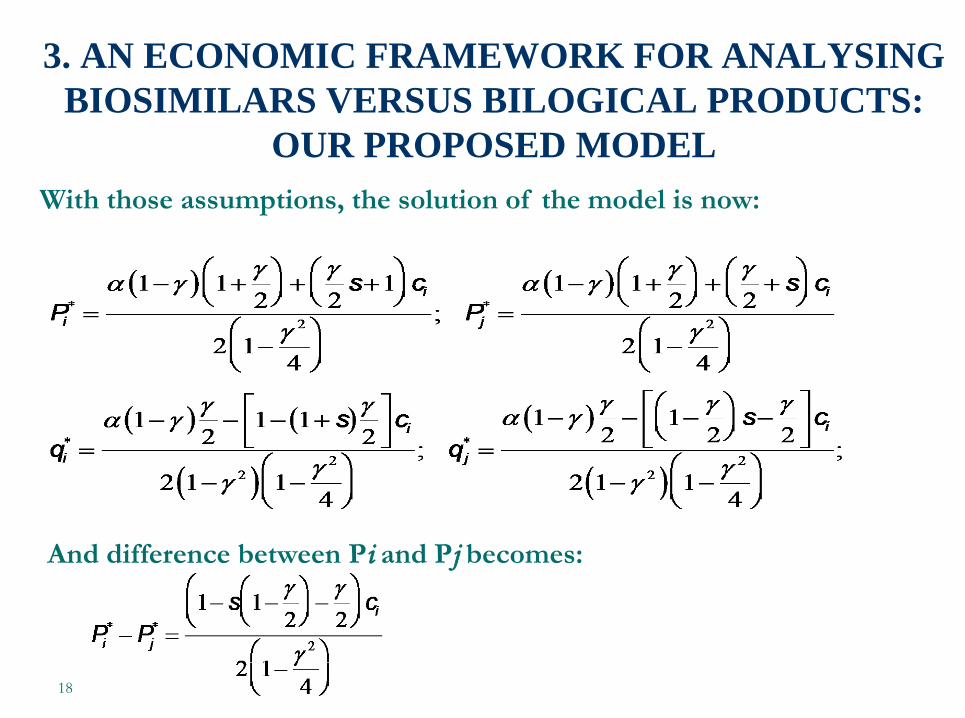
3. AN ECONOMIC FRAMEWORK FOR ANALYSING BIOSIMILARS VERSUS BILOGICAL PRODUCTS:
OUR PROPOSED MODEL With those assumptions, the solution of the model is now:
And difference between Pi and Pj becomes:
19
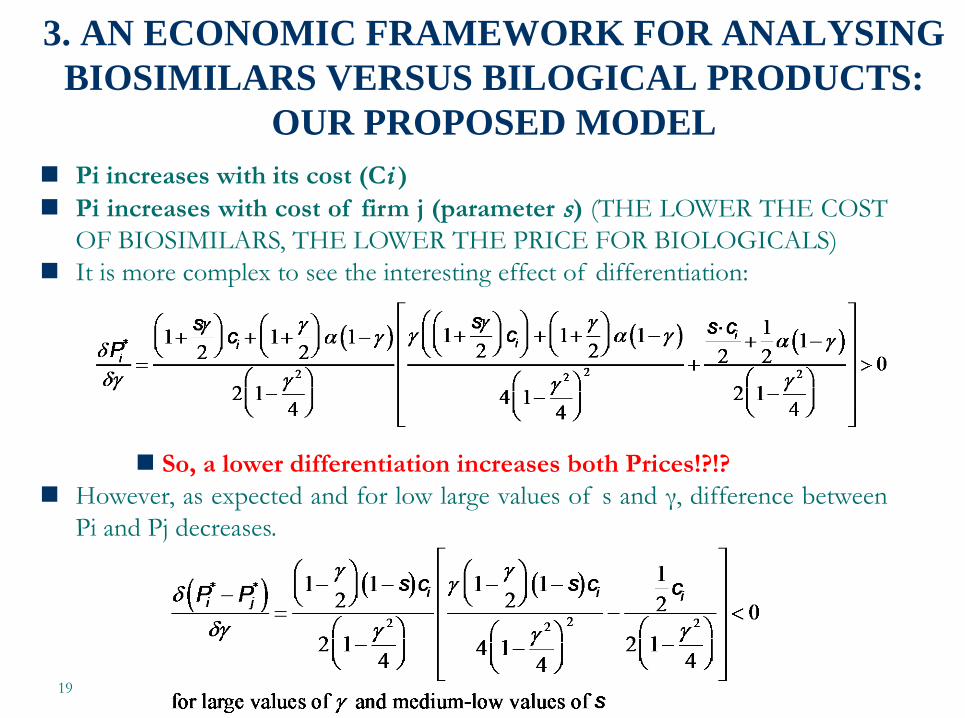
3. AN ECONOMIC FRAMEWORK FOR ANALYSING BIOSIMILARS VERSUS BILOGICAL PRODUCTS:
OUR PROPOSED MODEL Pi increases with its cost (Ci ) Pi increases with cost of firm j (parameter s) (THE LOWER THE COST
OF BIOSIMILARS, THE LOWER THE PRICE FOR BIOLOGICALS) It is more complex to see the interesting effect of differentiation:
So, a lower differentiation increases both Prices!?!?
However, as expected and for low large values of s and γ, difference between Pi and Pj decreases.

20
3. AN ECONOMIC FRAMEWORK FOR ANALYSING BIOSIMILARS VERSUS BILOGICAL PRODUCTS:
OUR PROPOSED MODEL A final scenario analyzed corresponds to the realistic case in
which biosimilar cost is a function of degree of differentiation. Interpretation: the lower the differentiation (the closest to the
biological product), the more expensive to produce and market access.
In the model, is included as follows:
The simplest case would be when θ=1 and as a consequence, γ=s

21
3. AN ECONOMIC FRAMEWORK FOR ANALYSING BIOSIMILARS VERSUS BILOGICAL PRODUCTS:
OUR PROPOSED MODEL The new solution of the model is:
And difference between Pi and Pj becomes:
22
3. AN ECONOMIC FRAMEWORK FOR ANALYSING BIOSIMILARS VERSUS BILOGICAL PRODUCTS:
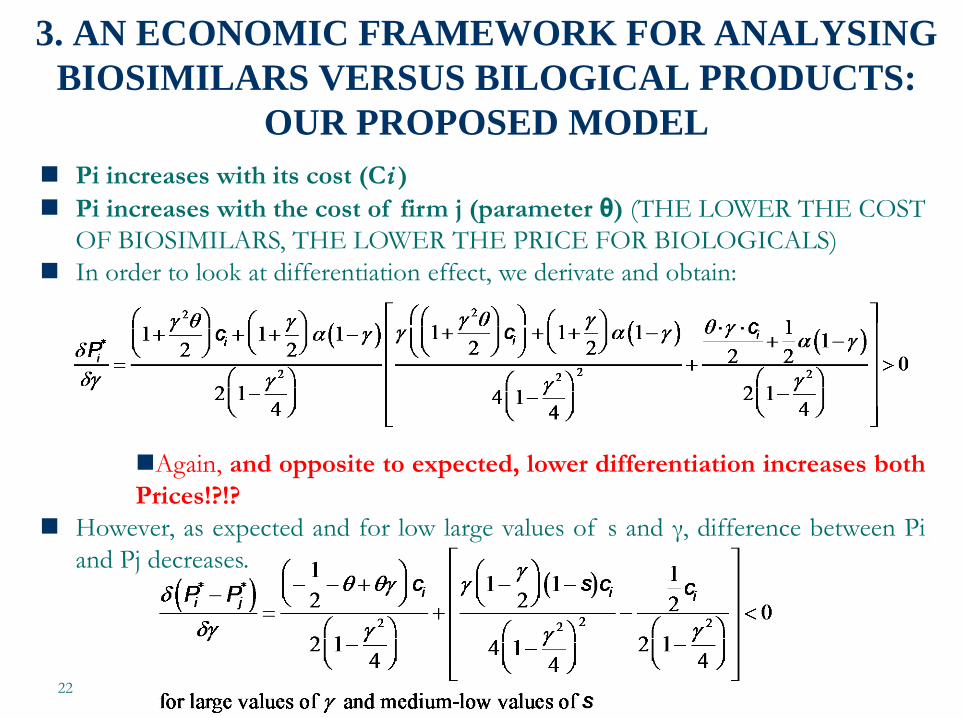
OUR PROPOSED MODEL Pi increases with its cost (Ci ) Pi increases with the cost of firm j (parameter θ) (THE LOWER THE COST
OF BIOSIMILARS, THE LOWER THE PRICE FOR BIOLOGICALS) In order to look at differentiation effect, we derivate and obtain:
Again, and opposite to expected, lower differentiation increases both Prices!?!?
However, as expected and for low large values of s and γ, difference between Pi and Pj decreases.

23
Biologics add value to health systems and health marginal efficiency
gains but their cost is expensive Expiration of patents on these products has created a possibility for
biosimilars market that some people would see as "new generics market“ but they are small (0.5% of total) and heterogeneous depending on country
Can we encourage biosimilars market to reduce pharmaceutical expenditure? Problems: Generics are exact copies. Biosimilars are similar but not identical (no
interchangeability property is fulfilled) Biosimilar production costs are greater than generic ones due to lower
number of companies expected EMA or FDA approval even if there will be fast, it remains more
expensive (safety and efficacy) than in the case of generics Using International Non property Name (INN) is more complicated
than with generics and is still fighting “legal actions"
4. DISCUSSION AND CONCLUSIONS
24
4. DISCUSSION AND CONCLUSIONS Factors to consider in future models: Dynamic modelling&sensitivity analysis: Grabowski et al. model and our proposed theoretical framework are “comparative static” models. They do not take into account interaction between competitors. We will consider product attributes as dependent in part upon firm strategy Evolution and learning regulation Acceptability of biosimilars by clinicians Track pricing and reimbursement policies INCENTIVES both demand and supply side: Who buys? At
what price? (hospital, doctor, patient, central purchasing?) What influences the decision of a clinical (their relationship with the industry and clinical trials? or the compliance ... and the idea of keeping fixed chronic patients treatments)? Marketing need to make the products will be acknowledged