competition analysis and identifying the switchable consumers · and identifying the switchable...
TRANSCRIPT

Competition Analysis and Identifying the Switchable ConsumersMarco Vriens, Ph.D.Chief Research Officer, Ipsos MarketQuest
Alessandro Martins Alves, D.Sc.Director, Ipsos Global Modeling Unit, Brazil
pointofview

The business problems
Almost any CMO, at some point or another, will face one of the following four business problem scenarios:
1. Imagine you are the CMO of a big Fortune 500 company and have more than 50% market share. Yet, something is nagging you. There is this small brand that has something that you don’t. Do they have it in them to un-seat your brand? How can you defend your market share?
2. Alternatively, you are the CMO of a small company up against a few powerful and reputable firms. How do you survive, let alone grow? The business question is not only “How can I win market share?”, but also, “How can I win market share efficiently, even if my marketing budget isn’t as large as my competitors?”
3. Your brand is competing in a crowded market (think cars, credit cards, fast food chains, car insurance, kitchen appliances, beer, pet food, etc.). In these markets your insights need to go further, you need to understand your direct competition so you can adequately position yourself against them. You need to understand which customers are at risk of defecting to each competitor, and from which competitors are you going to attract most likely customers from?
4. Lastly, when you have lots of heterogeneous customers: some are going to be more valuable than others. You need to keep your most valuable customers. Likewise, you need to understand which new customers are going to be easiest to acquire.
The above four business questions can be answered with an integrated framework of analytics that we refer to as competition models and the switchable consumer.
Copyright© 2015 Ipsos. All rights reserved. 2
Compet i t i on Ana l ys is and Ident i f y ing the Sw i tchab le Consumers

How to win market share: compete models
Let’s start with the first question: how can we win or defend market share? The insights needed to tackle this marketing challenge come from what is referred to as compete models. A compete model1 has the following components:
• A measure of a consumer’s preferred choice over an alternative choice. For example:
o Some consumers prefer Bank of America over Wells Fargo
o Some IT professionals prefer Linux over Windows
o Some mothers prefer Graco over Britax
o Some people prefer Coors over Miller, and
o Some eat more Mars bars than Hershey’s bars
• The competing brand alternatives can be compared on a set of measures.
We first applied this approach in the enterprise software market, where we were interested in understanding if a juggernaut brand (more than 70% market share) would have to take a small entry brand (less than 3% market share) seriously. It turned out they would. In the first step of the compete model, consumer brand preference choices were modeled as a function of about 15 brand perceptions (using a logit model). Each of the two brands were rated on 15 perceptions, yielding a total initial set of 30 potential driver variables (15 for each of the brands). The result of this modeling exercise was that we found about six significant perception drivers. Next we did simulations: we simulated the impact on market share if one competitor could catch up with another competitor on each of the six perception drivers. The results were astounding in two ways:
1. The key driver, with the biggest surprising impact was a perception no one had suspected to have a significant impact, let alone the largest impact.
2. Surprisingly, the results showed that the juggernaut brand stood to lose 25% market share. On top of that, we identified a trend that showed that the performance of the small brand on the key driver would automatically catch up.
1. See Gensch, D. (1984), “Targeting the Switchable Consumer”, Marketing Science, 3, 1, 41-54.
Copyright© 2015 Ipsos. All rights reserved. 3
Compet i t i on Ana l ys is and Ident i f y ing the Sw i tchab le Consumers
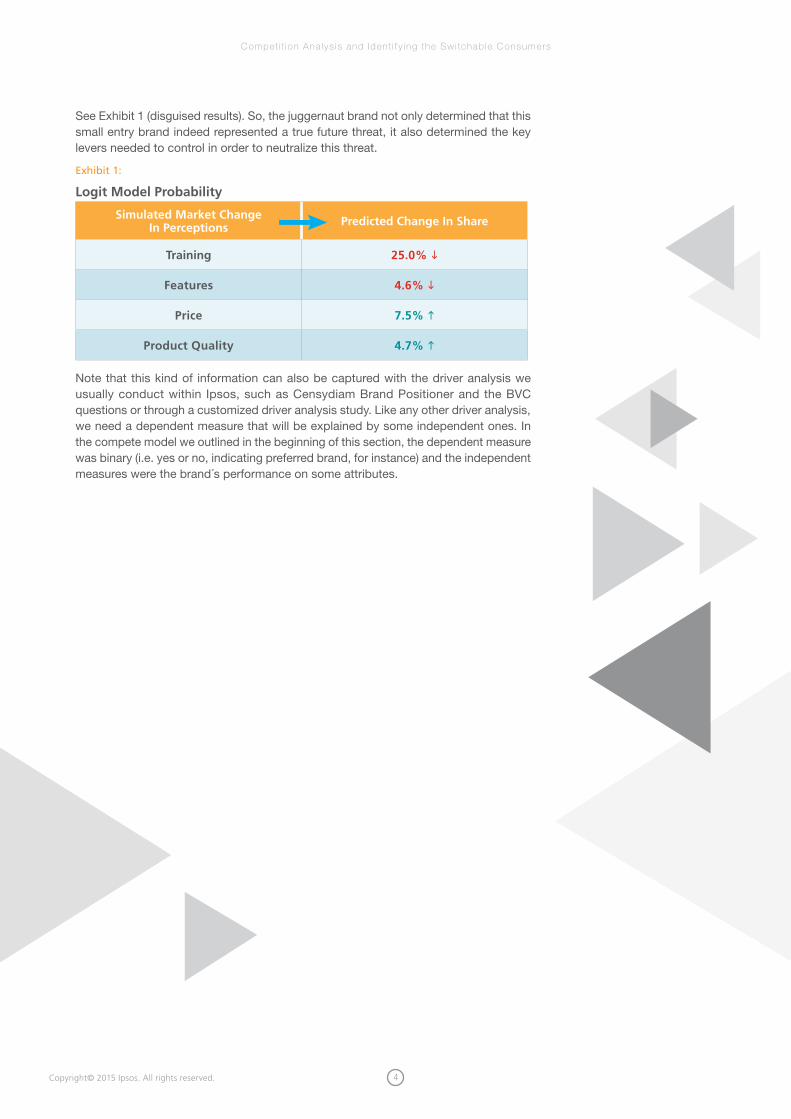
See Exhibit 1 (disguised results). So, the juggernaut brand not only determined that this small entry brand indeed represented a true future threat, it also determined the key levers needed to control in order to neutralize this threat.
Exhibit 1:
Logit Model Probability
Simulated Market Change In Perceptions Predicted Change In Share
Training 25.0% i
Features 4.6% i
Price 7.5% h
Product Quality 4.7% h
Note that this kind of information can also be captured with the driver analysis we usually conduct within Ipsos, such as Censydiam Brand Positioner and the BVC questions or through a customized driver analysis study. Like any other driver analysis, we need a dependent measure that will be explained by some independent ones. In the compete model we outlined in the beginning of this section, the dependent measure was binary (i.e. yes or no, indicating preferred brand, for instance) and the independent measures were the brand´s performance on some attributes.
Copyright© 2015 Ipsos. All rights reserved. 4
Compet i t i on Ana l ys is and Ident i f y ing the Sw i tchab le Consumers
How to win market share efficiently: The switchable consumer
The next business question is how can we win this market share efficiently? The solution to this approach is nicely illustrated in the ABB Electric case study2. ABB found itself in a declining market where they were up against three major competitors. Given that they were a small company, they had to work efficiently. In an initial survey consumers ranked and rated large sets of attributes. This data was first submitted to a factor analysis to identify the key underlying dimensions. Subsequently, they selected one attribute for each dimension that heavily represented that dimension. In this way they ended up with ten fairly independent attributes. Consumers also indicated their preferred suppliers. With this data a compete model (logit model) was estimated that indicated the key drivers. This first part is very similar to the “How to win market share scenario” in section 1.
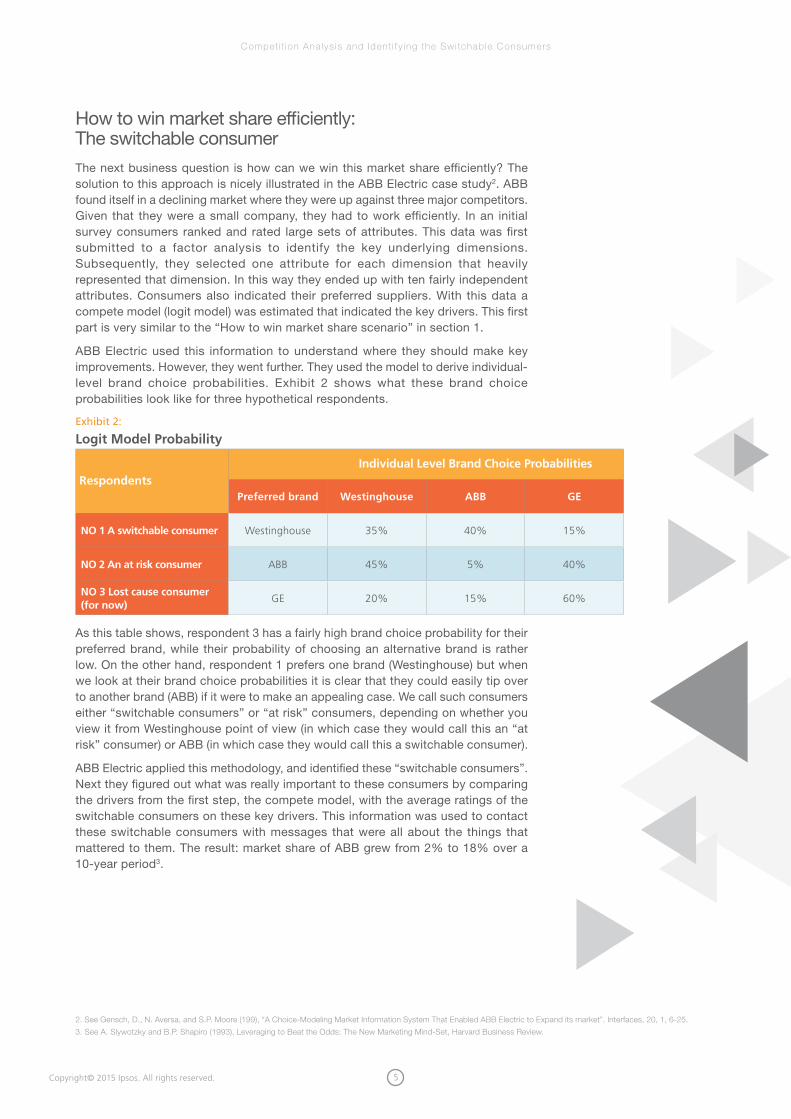
ABB Electric used this information to understand where they should make key improvements. However, they went further. They used the model to derive individual-level brand choice probabilities. Exhibit 2 shows what these brand choice probabilities look like for three hypothetical respondents.
Exhibit 2:
Logit Model Probability
RespondentsIndividual Level Brand Choice Probabilities
Preferred brand Westinghouse ABB GE
NO 1 A switchable consumer Westinghouse 35% 40% 15%
NO 2 An at risk consumer ABB 45% 5% 40%
NO 3 Lost cause consumer (for now)
GE 20% 15% 60%
As this table shows, respondent 3 has a fairly high brand choice probability for their preferred brand, while their probability of choosing an alternative brand is rather low. On the other hand, respondent 1 prefers one brand (Westinghouse) but when we look at their brand choice probabilities it is clear that they could easily tip over to another brand (ABB) if it were to make an appealing case. We call such consumers either “switchable consumers” or “at risk” consumers, depending on whether you view it from Westinghouse point of view (in which case they would call this an “at risk” consumer) or ABB (in which case they would call this a switchable consumer).
ABB Electric applied this methodology, and identified these “switchable consumers”. Next they figured out what was really important to these consumers by comparing the drivers from the first step, the compete model, with the average ratings of the switchable consumers on these key drivers. This information was used to contact these switchable consumers with messages that were all about the things that mattered to them. The result: market share of ABB grew from 2% to 18% over a 10-year period3.
2. See Gensch, D., N. Aversa, and S.P. Moore (199), “A Choice-Modeling Market Information System That Enabled ABB Electric to Expand its market”. Interfaces, 20, 1, 6-25.
3. See A. Slywotzky and B.P. Shapiro (1993), Leveraging to Beat the Odds: The New Marketing Mind-Set, Harvard Business Review.
Copyright© 2015 Ipsos. All rights reserved. 5
Compet i t i on Ana l ys is and Ident i f y ing the Sw i tchab le Consumers
How to understand competition: A loyalty segmentation case study
The following example is from a disguised project done by Ipsos in 2015, which illustrates business problems three and four. In this example, a well-known food chain would like to understand their customers better, especially consumers who said they went to this food chain most often. The compete model was applied to explain the “most often brand”. In addition, respondents gave their opinion on a large set of brand attributes of food chains (only those they usually go to or consider going to). This large set of attributes was factor analyzed and reduced to 32 factor-drivers. These drivers were modeled against the “most often brand” using the logit model (similar to the model discussed in section 2). The result of this modeling exercise were 16 significant factor-drivers.
Applying the estimates of the logit model, we calculated the probability for each brand to be the “most often brand” and classified each brand as:
1. Loyal consumers: if the predicted information for the “most often brand” is much higher than all other probabilities the consumer had.
2. At Risk consumers: if the predicted probability for the stated “most often brand” is either not the highest predicted probability or if it has a similar predicted probability compared to the other brands consumer rated.
3. The Switchable consumer: if the stated “most often brand” is at risk, and there is another brand that has the potential to replace it.
Exhibit 3 shows these various groups.
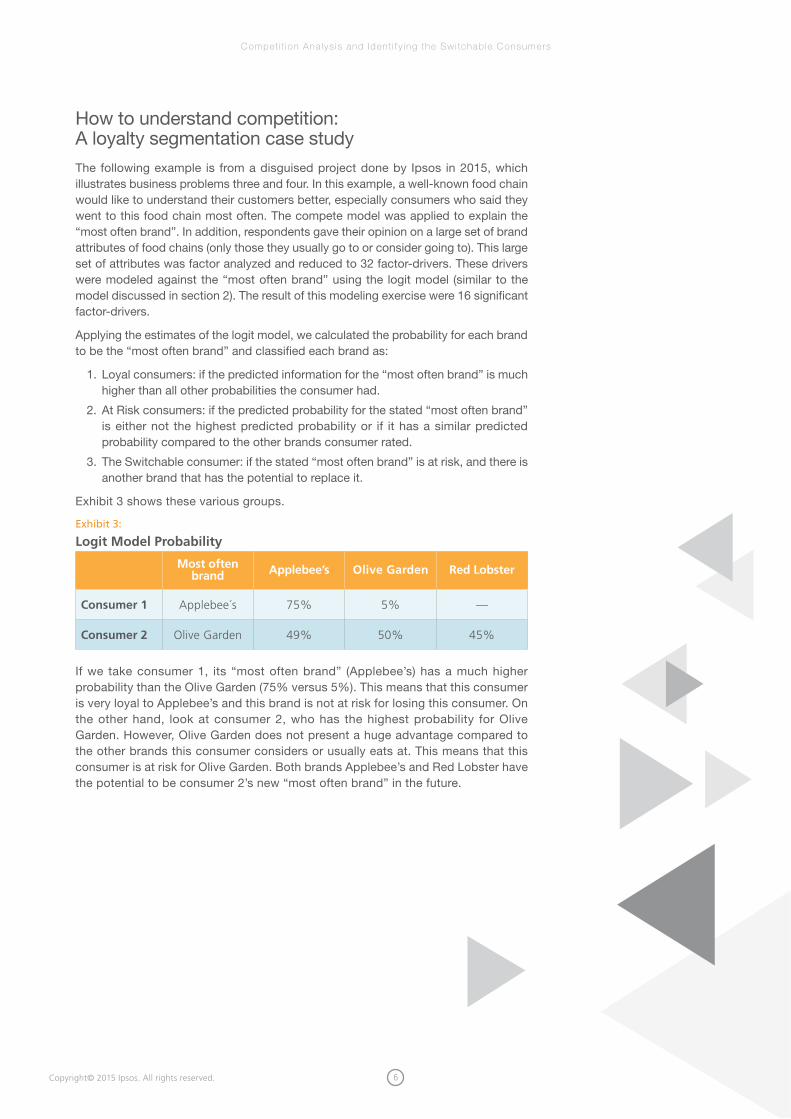
Exhibit 3:
Logit Model Probability
Most often brand Applebee’s Olive Garden Red Lobster
Consumer 1 Applebee´s 75% 5% —
Consumer 2 Olive Garden 49% 50% 45%
If we take consumer 1, its “most often brand” (Applebee’s) has a much higher probability than the Olive Garden (75% versus 5%). This means that this consumer is very loyal to Applebee’s and this brand is not at risk for losing this consumer. On the other hand, look at consumer 2, who has the highest probability for Olive Garden. However, Olive Garden does not present a huge advantage compared to the other brands this consumer considers or usually eats at. This means that this consumer is at risk for Olive Garden. Both brands Applebee’s and Red Lobster have the potential to be consumer 2’s new “most often brand” in the future.
Copyright© 2015 Ipsos. All rights reserved. 6
Compet i t i on Ana l ys is and Ident i f y ing the Sw i tchab le Consumers

Based on this classification, we were able to classify brands as loyal, at risk and potential. These percentages can be seen in exhibit 4.
Exhibit 4:
Brand Classification from the Logit Model
Restaurant Chain Loyal At Risk Brand Potential
Applebee’s 36% 64% 21%
Olive Garden 41% 59% 23%
Red Lobster 45% 55% 26%
TGI Fridays 59% 41% 26%
Old Country Buffett 31% 69% 22%
Chili’s 45% 55% 26%
As we can see, TGI Fridays has more loyal consumers than Applebee´s and it also appears as the brand with the higher percentage of switchable consumers amongst the fast food chains.
Another important analysis involves understanding what potential brands can replace a client brand that is at risk. As we can see at exhibit 5, whenever Red Lobster is at risk, TGI Fridays is the brand with the higher potential. If Old Country Buffett is at risk, Chili’s is the chain with the highest potential to replace it.
Exhibit 5:
Potential Brands for the brands at risk
Brand At Risk
Potential i Applebee’s Olive Garden Red Lobster TGI Fridays Old Country
Buffett Chili’s
Applebee’s 15% 25% 26% 25% 22%
Olive Garden 14% 15% 29% 10% 23%
Red Lobster 34% 22% 42% 25% 28%
TGI Fridays 59% 58% 74% 35% 59%
Old Country Buffett 11% 11% 7% 7% 18%
Chili’s 36% 32% 18% 29% 40%
In addition, we can also evaluate when a specific brand has potential, which brand is at risk.
Copyright© 2015 Ipsos. All rights reserved. 7
Compet i t i on Ana l ys is and Ident i f y ing the Sw i tchab le Consumers

Since we classified consumers on these profiles, we can also cross tabulate the whole questionnaire by these loyalty segments. One interesting finding was the frequency of consumption for the different profiles for Olive Garden. See exhibit 6.
Exhibit 6:
Olive Garden frequency of consumption
Total MOB(*) Loyal At Risk Switchable
Once a Month 30% 26% 20% 31% 21%
Twice a Month 30% 33% 42% 26% 30%
3 Times a Month 12% 9% 8% 10% 13%
4 Times a Month / Every Week 22% 29% 27% 30% 26%
Between 5 and 10 Times a Month 5% 3% 3% 3% 8%
Between 11 and 20 Times a Month 0% 0% 0% 0% 2%
More than 20 Times a Month 1% 1% 0% 1% 0%
Average (Monthly) 2.65 2.63 2.59 2.66 3.11
(*) Most Often Brand Users
The exhibit shows that as the frequency of eating at a chain goes up, the percentage of at risk consumers goes down. That makes intuitive sense. However, the table shows one exception: those who eat there about four times per month. This seems to be an outlier and it would be valuable for the client to find out what is going on with this group, as this is a high-net profit group, with a relatively big proportion of consumers to defect.
Copyright© 2015 Ipsos. All rights reserved. 8
Compet i t i on Ana l ys is and Ident i f y ing the Sw i tchab le Consumers

If we can identify the important drivers for these potential consumers, we will be able to increase client sales since potential consumers are heavy users of food compared to at risk consumers for this food chain. Since we collected the attribute performance for the fast food chains consumers consider “to use /usually use”, we were able to profile the brand performance on the drivers. See exhibit 7.
Exhibit 7:
Brand Classification from the Logit Model
The most interesting finding was the differences on the most important driver (socialization). This is the most important attribute and it is also core for this category.
Another new learning was that Olive Garden has very solid positioning due to the fact that its positioning does not vary much by the different user profiles we identified. A key finding to consider is Olive Garden´s positioning on the most important driver by these profiles. As we can see, the loyal consumers presented a higher gap for the positioning on this driver (compared to the other profiles), because of this, the “at risk” consumers presented a low performance and the potential ones presented a good performance. It means that this driver has to be improved by this chain. Because of the top driver, there is also an opportunity to work on the driver ‘reliability’. We noticed that the most loyal consumers do think that Olive Garden is really strong on this driver. By improving these two drivers, Olive Garden will be able to:
a. Avoid losing the “at risk” consumers
b. Convert to potential customers into “most often brand” users
-40
-20
0
20
40
60
80
100
120
140
160
Socialization Status/prestige Indulgence Reliability Smart Choice
(0 =
mar
ket
aver
age)
Total Olive Garden Mob Loyal At Risk Switchable
Copyright© 2015 Ipsos. All rights reserved. 9
Compet i t i on Ana l ys is and Ident i f y ing the Sw i tchab le Consumers

Versatile applications of the compete and the switchable consumer modelsOver the past few years we have successfully applied the compete models and switchable consumer analysis on credit card services, banking services, consumer products, and fast moving consumer goods, and we have found this to be a very versatile approach that can be applied as a targeted segmentation approach but can also be applied in many other situations such as:
1. Brand management. This approach calculates the switchable consumers and the at risk consumers. If we calculate what percentage of each of these categories fall in these segments, that gives us a measure of net expected short-term brand growth potential. Exhibit 8 – where we use banks as an example – shows a hypothetical result. For two of the three brands this potential is positive but for the third brand this number is negative: i.e. the stand to lose market share if they don’t act.
See exhibit 8 for an example.
Exhibit 8:
Short-term brand growth potential
Bank of America Wells Fargo ING
Switchable to Brand 14% 3% 8%
At Risk to defect brand 9% 1% 14%
Short-Term Brand Growth Potential 5% 2% -6%
CONCLUSION:
Bank of America is likely to grow, ING is likely to loose market share
2. Concept testing and discrete choice conjoint. This approach can be nicely applied to concept testing. Imagine if we could know how our concept does with the switchable consumer. We could more effectively market our new product. Alternatively, what if we could identify the optimal combination of features for the switchable consumer segment?
3. Funnel analysis
A third area where we can apply the switchable consumer analysis is the context of understanding movements through the funnel. In one study we found that the percentage of consumers who were aware of the brand but were switchable to consider the brand was only 50% whereas the % switchable consumers from consideration to preference was 80%. Clearly, from a marketing communication perspective, it would pay off to direct marketing towards consumers who were already considering the brand versus trying to reach everybody.
Copyright© 2015 Ipsos. All rights reserved. 10
Compet i t i on Ana l ys is and Ident i f y ing the Sw i tchab le Consumers

Concluding remarksThe switchable consumer methodology is a powerful analysis and general framework that can successfully work for a variety of marketing problems. In one approach we get four strategic outcomes:
1. Drivers of brand choice
2. The identification of those consumers most likely to switch
3. An identification of the brands that are going to be your most likely competitors, and an early warning system that can tell you where your brand is currently headed
4. Tying these insights to individual customer level information, such as “how profitable is this customer to your business”
Of course, for each of the components discussed other approaches exist – and the merits of each approach can be assessed based on the specifics of the survey, data and study at hand.
One question we sometimes get is, “Can’t we just ask respondents to rank in order the brands they would consider?” The brand could then focus on those respondents who rank their brand in say, the top two or top three. However, this approach lacks the ability to differentiate between respondents who are very set in their choices versus those who are reasonably undecided. See Exhibit 9.
Exhibit 9:
Ranking Brands versus Switchable Consumer
CONSUMER 1 CONSUMER 2
BRAND Brand ranking Brand probability Brand Ranking Brand probability
A 1 78% 1 48%
B 2 5% 2 34%
C 3 8% 3 15%
D 4 9% 4 7%
It shows that both consumers prefer brand A. However, it also shows there is a huge difference between consumer 1 and consumer 2. Consumer 1 is clearly committed to brand A, whereas consumer 2 is not. A second drawback is that the degree to which respondents are tied to their preferred brand is immediately linked to drivers that tell us how to get them more tied to a brand.
Marco Vriens, Ph.D.Chief Research Officer Ipsos MarketQuest [email protected]
Alessandro Martins Alves, D.Sc.Director Ipsos Global Modeling Unit, [email protected]
Copyright© 2015 Ipsos. All rights reserved. 11
Compet i t i on Ana l ys is and Ident i f y ing the Sw i tchab le Consumers

ABOUT IPSOSIpsos is an independent market research company controlled and managed by research professionals. Founded in France in 1975, Ipsos has grown into a worldwide research group with a strong presence in all key markets. Ipsos ranks third in the global research industry.
At Ipsos we are passionately curious about people, markets, brands and society. We make our changing world easier and faster to navigate and inspire clients to make smarter decisions. We deliver with security, speed, simplicity and substance. We are Game Changers.
With offices in 87 countries, Ipsos delivers insightful expertise across six research specializations: advertising, customer loyalty, marketing, media, public affairs research, and survey management.
Ipsos researchers assess market potential and interpret market trends. They develop and build brands. They help clients build long-term relationships with their customers. They test advertising and study audience responses to various media and they measure public opinion around the globe.
Visit www.ipsos.com to learn more about Ipsos’ offerings and capabilities
Copyright© 2015 Ipsos. All rights reserved. 12 1 5 - 0 6 - 0 5
Compet i t i on Ana l ys is and Ident i f y ing the Sw i tchab le Consumers