compensation and benefits trends africa … · compensation and benefits trends africa and middle...
TRANSCRIPT

COMPENSATION AND BENEFITS TRENDSAFRICA AND MIDDLE EAST
Brad BieraManaging Consultant, Marsh Africa
Joe BarberSenior Associate, Mercer UAE

1MERCER
Contents
• Introduction
• Compensation and Benefit trends in Africa and the GCC
• The Case for Flexible Benefits – Supporting transformation of the Compensation Mix
Appendix– Overview of the GCC region– Compensation and Benefit trends for the GCC– Emerging trends and Future Outlook in the GCC– Overview of the Economic trends in Sub Sharan Africa – Compensation and Benefit trends in Sub Sharan Africa– Common Themes and Future Opportunitites
2MERCER
• Is the market really changing?
• Conventional and unconventional wisdom
• EMEA and the ME(N)A economy
Perspective

3MERCER
“The ‘environment’ is where we live; and development is what we all do in attempting to improve our lot within that abode. The two are inseparable.”
Our Common FutureGEO 4 – United Nations Environment Programme

4MERCER
Points to ponder – 35 000 foot view
• Common Language for Compensation and Benefits (Redruth)
• Moral Hazards of economic prosperity– Access to non renewable resources and related strategies– Eurozone paradox (impacts of revised purchase power and status)– Infrastructure investment– Rapid hyper inflation of compensation and benefts

5MERCER
Who is at risk
6MERCER
Points to ponder – 35 000 foot view
• Road to Nationalisation – “State of Africa” / “Arab Spring”– Importation of skills– Growth of insurance markets– Lead indicators – white goods, cars, houses and medical inflation– Employment Equity – BEE/Saudirisation– Resource taxation
• Variable / fixed compensation models and the evolution of TCTC (African Sustainability report 2004)

7MERCER

8MERCER
Points to ponder – 35 000 foot view
• Maturation of market– Skills shift to national resourcing / resource scarcity / impact on quality /
parity of benefits– Regulators and formalised pension structures– (de risking of social exposure through structured social taxation and
compulsory savings)– Broader compensation strategies

Compensation and Benefit Trends in Africa and the GCC

10MERCER
Common Themes
Developing compensation and benefit strategies that appeal to a broad employee demographic
Nationalisation programs within the private sector
Increasing levels of legislation to protect foreign employees
Pay increases of between 3% and 8% can be expected in 2012 dependent upon city / country
Re-design and review of cash allowances
There is a clear move to reduce fixed employment costs and increase “at risk” pay through short and long term incentives, moving towards rewarding individual performance

11MERCER
Compensation Trends in the GCCRemuneration mix 2011
0%
10%
20%
30%
40%
50%
60%
70%
80%
90%
100%
UAE KSA QR OM KW
BenefitsLong-term incentivesShort-term incentivesGuaranteed allowancesBase salary
Total Remuneration Mix (all functions & levels)• In the UAE, LTIs have
a stronger representation in the pay mix this year.
• The pay mix for KSA shows that base salary has a larger ratio in 2011.
• Base pay constitutes a higher percentage of the pay mix in Oman and Kuwait in 2011 compared to last year, while the ratio of benefits and STIs was higher in 2010 in both countries.

12MERCER
Compensation Mix – SSA (TRS Countries only)
1207 March 2012
49%54% 56% 58% 59% 57% 56%
53%
20%19%
19% 17% 16%15%
14%14%
4%5%
6% 7% 8%8%
8% 13%
27%23% 20% 18% 18% 20% 22% 21%
0%
10%
20%
30%
40%
50%
60%
70%
80%
90%
100%
S1 (PC 40 - 41) S2 (PC 42 - 44) S3 (PC 45) S4 (PC 46 - 49) S5 (PC 50 - 52) S6 (PC 53 - 56) S7 (PC 57 - 58) S8 (PC 60 - 64)
Basic Salary Other Guaranteed Cash Non-Guaranteed Bonus (Variable) Employment Benefits

13MERCER
Emerging Definition and the Scope of Total Rewards
Compensation
Base pay
Guaranteed “bonuses”
Short term incentives
Long term incentives
Financial allowances
Financial recognition programs
Deferred compensation
Development & Career
Performance management
Learning and development
Career opportunity and paths
Tuition reimbursement
Mobility opportunities
Benefits
Retirement
Savings and other wealth creation programs
Medical / Dental / Vision / Prescription Drug, etc.
Life insurance
Short and long term disability
Accident coverage
Job-related perquisites
Work Lifestyle
Time off
Wellness programs
Dependent care
Workplace flexibility
Commuter programs
Workplace facilities and perquisites
Experiential rewards
Non-financial and status recognition

14MERCER
Future Opportunities
Re-define the provision of cash allowances
Manage healthcare benefits on a regional basis
Evaluate the feasibility for expatriate retirement benefits
Developing long term and short term disability provisions
Reviewing the case for Flexible Benefits

The Case for Flexible BenefitsSupporting transformation of the Compensation Mix

MERCER
Key drivers of flexible benefitsGlobal and regional themes
Global perspective• The cost of insured benefits are constantly rising• Shift to total compensation philosophies and defined contribution strategies
• Workforces are more demographically diverse• Focus on employee empowerment and communication• Promote internal employee equity but especially for benefits harmonisation in M&A• EU placing greater emphasis on employment diversity and employee choice. Trade
unions beginning to debate merits of flex
Middle East perspective• High and escalating costs of insured benefits, especially medical• High levels of western expatriates with experience of / preferences for flexible benefits • Western multinationals with flexible benefits plans around the world, especially Pharma
and Hi-Tech / IT• Higher disposable income and allowances culture – ready made flexible benefits
spending account
• High inter-regional employee mobility

17MERCER
Key drivers of flexible benefitsBusiness case / reasons why / return on investment
Better attraction and retentionIncreased employee satisfactionIncreased awareness of total rewardImproved self-service behaviours Reduced HR effortImproved recruitment efficiencyIncreased flexible workingBetter targeting of rewardSimplification / harmonisation of terms
Reduction in benefit costsIncreased control of volatility in benefit costsIncreased risk-sharing with employeesReduced tax and social security payments
What can flex, in itself, achieve?
What can be achievedthrough flex?

18MERCER
Key drivers of flexible benefitsWhat to consider: Four perspectives
What are the key metrics that we will use to measure the flex plan’s effectiveness and return on investment (ROI)?
How should the flex plan be designed and delivered in order to maximize ROI for the company?
Can the flex plan be designed at an affordable and sustainable cost
If not, how should the design be modified to be financially viable?
What type of plan design best differentiates the company from competing employment opportunities?
How do employees place value on different elements of plan design?
What are the labour and related rewards environments in which the company competes?
How do they influence the optimal design of the flex plan and therefore restrict the company’s flex goalS?
EMPLOYER PERSPECTIVE
COST PERSPECTIVE
EXTERNAL PERSPECTIVE
EMPLOYEE PERSPECTIVE
Overview of the GCC region

20MERCER
Regional Overview and Economic TrendsFocus on the Gulf Cooperation Council (GCC) countries
• GCC countries:– Bahrain– Kuwait– Oman– Qatar– Saudi Arabia– UAE (seven emirates
including Abu Dhabi; Dubai)

21MERCER
Regional Overview and Economic TrendsAll countries are experiencing rapid population growth• Population growth of 3.4% across GCC over past ten years driven by immigration
• Economist Intelligence Unit forecast population to grow by 33% by 2020
• Young population with over 50% aged 20 or below
• Expatriates represent majority of workforce in all except Saudi Arabia and Oman
0
5
10
15
20
25
30
35
Bahrain Kuwait Oman Qatar SaudiArabia
UAE
Population (in millions)
Source: Economist Intelligence Unit
0%
10%
20%
30%
40%
50%
60%
70%
80%
90%
UAE Qatar Kuwait Bahrain Saudi Oman
Expatriate workforce as % of total (2009)
Source: Nationalisation surveys
2000
2010
2020 forecast

22MERCER
Regional Economic & Business Trends
• 2012 average GDP forecast for the region 3.3%
• UAE tried to blunt the financial crisis by increasing spending and boosting liquidity in the Banking sector
• Crisis hit Dubai the hardest, as it was heavily exposed to the depressed real estate prices
• Long term challenges:- Dependence on oil- Large expatriate workforce- Growing inflation pressures
• Strategic plans focus on diversification and creating opportunities for nationals through improved education and increased employment ofnationals in the private sector
• The economy is expected to continue a slow rebound
23MERCER
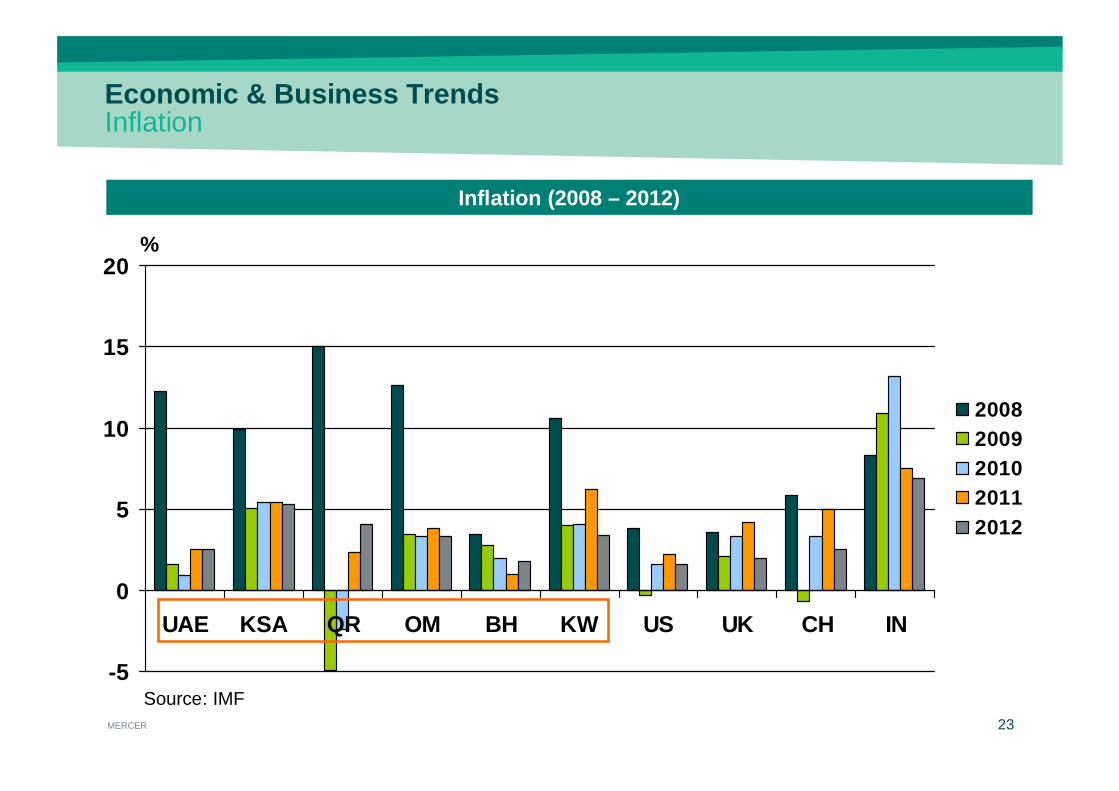
Economic & Business TrendsInflation
-5
0
5
10
15
20
UAE KSA QR OM BH KW US UK CH IN
20082009201020112012
%
Inflation (2008 – 2012)
Source: IMF

24MERCER
Economic & Business TrendsCost of Living
164146--Doha6
181
176
152
144
139
55
50
2010
COST of Living Ranking
8
7
5
4
3
2
1
GCC
109
-
77
90
82
20
26
2009
185126Jeddah
184-Muscat
94
119
112
52
65
2008
159
135
-
81
61
2011
Kuwait
Riyadh
Manama
Dubai
Abu Dhabi
City
Cost of Living: lower across the GCC compared to 2010, most expensive city is Abu Dhabi
Source: 2011 Mercer Cost of Living Survey

Compensation and Benefit Trends in the GCC

26MERCER
2011 Actual Salary Increases & 2012 ForecastsIndustry Specific
Companies from the consumer goods,services and durable sectors provide increases above the market.
0.0
2.0
4.0
6.0
8.0
2011 actual 6.6 5.2 5.1 4.5 4.2 6.02012 forecast 6.6 5.4 5.3 6.2 4.8 6.1
Consumer goods Services Durable High-tech Energy Others
2011 actual salary increases & 2012 forecasts – by industry
Companies from the high-tech and energy sector provide increases slightly below the overall market level.
The consumer goods and high-tech sectorsforecast the highest increases for 2012.
%

27MERCER
Guaranteed Cash Allowances
0 50,000 100,000 150,000 200,000 250,000 300,000 350,000 400,000
Para-professionals
Professionals
Management
ExecutivesHousing
National
Transportation
Utilities
Meal/LuncheonVoucher
Fuel
Furniture
Shift
AED
Guaranteed allowances by career stream
28MERCER
Employee BenefitsIntroduction and comments
• In the five years prior to 2010 a steady increase of benefit levels was evident particularly in the areas of medical, death and disability
• The economic climate has not, broadly speaking, changed the prevalence or level of benefits being offered, although employers are:– looking for alternatives to cash as differentiators in their employment
brand – looking to manage increasing medical costs– showing an increasing interest in employee engagement and retention
- Retirement savings plans- Flexible benefit plans

29MERCER
90%94%
86%
93%
100%
93%
0%
17%
34%
52%
69%
86%
103%
UAE Saudi Arabia Qatar Bahrain Oman Kuwait
% Prevalence of medical benefits
Regional Employee Benefits High prevalence of medical benefits
• Mandatory cover for expats and families– Introduced in KSA in 2006– Introduced in Abu Dhabi in 2007– Certain Dubai free zones in 2008– Expected across Dubai in 2011– Debated in Qatar and Bahrain
• Mandatory model requires core level of benefits under approved plans with limitations on co-pays / deductibles
• Uncertainty over legislative requirements has resulted in rich benefit provisions
• High prevalence of diabetes and obesity together with high benefit levels is driving premium escalation
• Need for employers to manage healthcare costs proactively going forward

30MERCER
Medical careWidespread provision of private health benefits to employees
• Legislation in place in KSA and Abu Dhabi requiring employer sponsored medical insurance for employees (expats and Nationals in KSA) and their dependants
• Legislation planned to make medical insurance compulsory in Qatar. The timing of the introduction is uncertain
0%
10%
20%
30%
40%
50%
60%
70%
80%
90%
100%
Cover for employee'sfamily
Premium sharing forfamily cover
Fully insured
UA
E
Qatar
KS
A KS
A
KS
AQatar
UA
E
UA
E
Qatar

31MERCER
Medical carePrevalence of benefits within medical plans
0%
10%
20%
30%
40%
50%
60%
70%
80%
90%
100%
Dental Maternity Vaccines Pre-existingconditions
Emergencyout of area
cover
Vision
UAE Qatar KSA
• Dental and vision cover are becoming more prevalent
• Prevalence of cover for vaccines has remained stable
Data for Management Level Employees

32MERCER
Supplemental death and disability benefits
65%
75%
64%
79%
87%
82%
59%
40%
82%
22%27%
15%
0%
10%
20%
30%
40%
50%
60%
70%
80%
90%
Death benefits Accidental death cover Long term disability Short term disability
UAE Saudi Arabia Qatar
• Lump sum death and permanent disability benefits are most commonly provided through fully insured plans insured
• Provision of supplemental short term disability benefits varies widely as do the funding mechanisms

33MERCER
End of service benefitsAn integral part of the region’s rewards framework
Built on basic or gross salary depending on the country
Broadly one month’s salary per year of service
Originally designed as severance protection
Increasingly cited as an alternative to a retirement benefit
Reductions in benefit for voluntary employee termination
Varied practices in relation to funding and accounting for EOSB

34MERCER
End of service benefitsOrganizations providing enhanced end of service benefits
42%
41%
43%
40%
41%
41%
42%
42%
43%
43%
Enhanced EOSB
UAEQatar
KSA
• Approximately 40% of organisations enhance EOSB above statutory minimum
• Broadly equal numbers of companies enhance salary or service component of EOSB
• Formal funding policies increasing across the Gulf
31%
36%
30%
27%
28%
29%
30%
31%
32%
33%
34%
35%
36%
Funded EOSB
UAE
QatarKSAU
AE U
AEQ
atar
Qatar
KS
A
KS
A

35MERCER
Other key benefitsPrevalence of other benefits
0%
10%
20%
30%
40%
50%
60%
70%
80%
90%
100%
Share PurchasePlans
Loans Annual Air Fares FurnitureAllowance
Mobile Phones ClubSubscription
UAE Qatar KSA
• Organizations continue to review benefits for locally contracted staff with a view to curtailing or removing benefits usually associated with expatriate assignees or seconded personnel
• There is also a trend to reduce expatriate benefits as the UAE is no longer seen as a hardship posting

Overview of Africa – Economic trends

37MERCER
Regional Overview and Economic TrendsAfrica countries
GDP Growth Forecasts 2012:
• Immense natural resources
• Large investments in people
• Region dominated by West Africa (oil-based economies)
• East Africa to be the fastest growing region

38MERCER
Regional Overview and Economic TrendsAll countries are experiencing rapid population growth
• Population growth of over 8% across Sub-saharan African Region
• Surging external demand (from China & India) hungry for oil & mineral resources
• A drive towards “consumerisation” (demand for modern goods and services)– Telecommunications and banking are key industries in this area
Source: Economist Intelligence Unit
Sub-saharan African population:

39MERCER
Economic & Business TrendsInflation: Sub-saharan & North Africa
Inflation:
Source: Economist Intelligence Unit

40MERCER
Economic & Business Trends Cost of Living
Tunis
Cape Town
Johannesburg
Victoria
Niamey
Libreville
N’Djamena
Luanda
1316
COST of Living Ranking
8
7
5
4
3
2
1
Africa Ranking
207
158
25
23
12
3
1
World RankingCity
Cost of Living: Cities across Africa, most expensive for expats is Luanda
Source: 2011 Mercer Cost of Living Survey

Compensation and Benefit trends in Africa

42MERCER 4207 March 2012
Annual Increases – SSA
0.0%2.0%4.0%6.0%8.0%
10.0%12.0%14.0%16.0%18.0%
Rw
and
aM
adag
Tanz
Mo
zU
gand
aK
enya
Bu
run
di
Ethio
pia
Gab
on
Cam
Co
ngo
Eq G
uin
eaB
otsw
ana
DR
CM
alawi
ZimZam
bia
An
gola
Senegal
CD
IM
aliTo
goB
urkin
a FLib
eriaB
enin
Nigeria
Sierra LG
han
aG
uin
ea
2011 Actual 2012 Forecast 2012 Revised Forecast

43MERCER 4307 March 2012
Provision of Medical Care – SSA
0%
20%
40%
60%
80%
100%
EQ G
uin
ea
Zamb
ia
Libe
ria
Bu
run
di
Mo
z
Sierra L
Mali
Gu
ine
a
Ethio
pia
Bo
tswan
a
Sen
egal
An
gola
Ke
nya
Nige
ria
Gh
ana
Zim
Tanz
Gab
on
Malaw
i
Cam
Ug
and
a
Be
nin
Bu
rkina F
CD
I
Co
ngo
DR
C
Mad
ag
Rw
and
a
To
go
Provide Medical Care Average SS Africa

44MERCER 4407 March 2012
Average Company Medical Expenses – SSA (TRS Countries only)
$ 0
$ 500
$ 1 000
$ 1 500
$ 2 000
$ 2 500
$ 3 000
Malaw
i
Gh
ana
Rw
an
da
Gu
ine
a
Tanz
Mali
Sen
eg
al
DR
C
Zamb
ia
Ke
nya
Bo
tswan
a
Cam
Nige
ria
Mo
z
Zim
Gab
on
CD
I
Co
ngo
An
gola
Be
nin
Ug
and
a
Average Company Medical Expenses p.a. Average SS Africa

45MERCER 4507 March 2012
Private Retirement Provision – SSA
0%10%20%30%40%50%60%70%80%90%
100%
DR
C
Mo
z
Ta
nz
Bu
rkin
a F
Gu
ine
a
Ma
li
Ga
bo
n
Co
ng
o
Be
nin
Sie
rra L
CD
I
Rw
an
da
Ug
an
da
Ma
da
g
To
go
Za
mb
ia
Se
ne
ga
l
Gh
an
a
Libe
ria
Bu
run
di
Ma
law
i
Bo
tswa
na
Eth
iop
ia
Ke
ny
a
Nig
eria
An
go
la
Ca
m
Provide Private Retirement Average SS Africa

46MERCER 4607 March 2012
Total Contribution ( % of Basic Pay to Private Retirement ) – SSA (TRS Countries only)
0%2%4%6%8%
10%12%14%16%18%20%
Tan
z
Rw
an
da
An
gola
Mali
CD
I
Se
ne
ga
l
Be
nin
Co
ng
o
Ga
bo
n
Mo
z
Ke
ny
a
DR
C
Ug
and
a
Ca
m
Zam
bia
Gh
an
a
Nig
eria
Ma
lawi
Bo
tswa
na
Gu
ine
a
Zim
Total Contribution (% of Basic Pay to Private Retirement) Average SS Africa

47MERCER 4707 March 2012
Provide of Company Cars – SSA
0%
10%
20%
30%
40%
50%
60%
70%
80%
90%
100%
Ken
ya
Ug
an
da
Bo
tswa
na
Ta
nz
Be
nin
Ca
m
Gh
an
a
Mo
z
Nig
eria
Zam
bia
Ma
li
Gu
ine
a
Liberia
Co
ng
o
DR
C
Rw
an
da
To
go
An
go
la
Ga
bo
n
Sen
egal
Bu
rkina
F
CD
I
Ma
law
i
Zim
Sierra L
Ma
da
g
Eth
iop
ia
EQ
Gu
ine
a
Bu
run
di
Provide Company Cars Average SS Africa

48MERCER 4807 March 2012
Pay Car Allowance – SSA (TRS Countries only)
0%
5%
10%
15%
20%
25%
30%
35%
40%
CDI
Congo
Guin
ea
Mali
Rw
anda
Gabon
DRC
Benin
Zim
Senegal
Botsw
ana
Tanz
Moz
Ghana
Cam
Nigeria
Malaw
i
Zambia
Kenya
Uganda
Pay Car Allowance Average SS Africa

49MERCER 4907 March 2012
Average Company Car Benefit per annum – SSA (TRS Countries only)
$ 0
$ 5 000
$ 10 000
$ 15 000
$ 20 000
$ 25 000
$ 30 000
$ 35 000
$ 40 000
Tan
z
DR
C
Gu
inea
Ug
and
a
Bo
tswan
a
Gh
an
a
Nig
eria
Ken
ya
Mali
Zim
Sen
ega
l
An
gola
Ben
in
Zam
bia
Co
ng
o
Gab
on
CD
I
Cam
Rw
and
a
Ma
law
i
Mo
z
Average Company Car Benefit p.a. Average SS Africa

50MERCER 5007 March 2012
Car Allowance Value – SSA (TRS Countries only)
$ 0.00
$ 5 000.00
$ 10 000.00
$ 15 000.00
$ 20 000.00
$ 25 000.00
$ 30 000.00
$ 35 000.00
Gu
ine
a
Gh
an
a
Ga
bo
n
Rw
an
da
An
go
la
Ta
nz
Ma
li
Be
nin
Co
ng
o
Nig
eria
Ug
an
da
Bo
tswa
na
Ken
ya
Se
ne
ga
l
Zim
CD
I
Ca
m
DR
C
Zam
bia
Ma
law
i
Mo
z
Car Allowance Value p.a. Average SS Africa

Mercer (Polska) Sp. z o.o. Al. Jerozolimskie 94, 00-807 Warszawa zarejestrowana w S dzie Rejonowym dla m.st. Warszawy w Warszawie XII Wydzia Gospodarczy KRS: 0000043554, NIP: 525-21-41-429, REGON: 016094276 Wysoko kapita u zak adowego: 400 000,00z , kapita wp acony w ca ci