comparisons of operating envelopes for contaminated soil stabilised/solidified with different...
TRANSCRIPT
RESEARCH ARTICLE
Comparisons of operating envelopes for contaminated soilstabilised/solidified with different cementitious binders
Reginald B. Kogbara & Abir Al-Tabbaa &
Julia A. Stegemann
Received: 1 August 2013 /Accepted: 22 October 2013 /Published online: 16 November 2013# Springer-Verlag Berlin Heidelberg 2013
Abstract This work initiated the development of operatingenvelopes for stabilised/solidified contaminated soils. Theoperating envelopes define the range of operating variablesfor acceptable performance of the treated soils. The studyemployed a soil spiked with 3,000 mg/kg each of Cd, Cu,Pb, Ni and Zn, and 10,000 mg/kg of diesel. The binders usedfor treatment involved Portland cement (CEMI), pulverisedfuel ash (PFA), ground granulated blast furnace slag (GGBS)and hydrated lime (hlime). The specific binder formulationswere CEMI, CEMI/PFA=1:4, CEMI/GGBS=1:9 and hlime/GGBS=1:4. The water contents employed ranged from 13 %to 21 % (dry weight), while binder dosages ranged from 5 %to 20% (w/w). We monitored the stabilised/solidified soils forup to 84 days using different performance tests. The testsinclude unconfined compressive strength (UCS), hydraulicconductivity, acid neutralisation capacity (ANC) and pH-dependent leachability of contaminants. The water contentrange resulted in adequate workability of the mixes but hadno significant effect on leachability of contaminants. Weproduced design charts, representing operating envelopes,from the results generated. The charts establish relationshipsbetween water content, binder dosage and UCS; and binderdosage, leachant pH and leachability of contaminants. The
work also highlights the strengths and weaknesses of thedifferent binder formulations.
Keywords Binder dosage . Leaching .Metals . Stabilization/solidification .Water content
Introduction
Stabilisation/solidification (S/S) is an established remediationtechnology that employs cementitious binders for treatment ofcontaminated soils and other hazardous wastes. The technologyinvolves chemical fixation and physical encapsulation of con-taminants in cementitious matrices. S/S is primarily used for theimmobilisation of metals and, to a lesser extent for organiccontaminants as organics interfere with cement hydration andstructural formation (LaGrega et al. 2001; Spence and Shi2005). S/S treatment design usually satisfies certain criteria,depending on the end use of the treated material. Contaminantleachability in the granular leaching test is the most importantperformance criteria. This is because the test simulates contam-inant migration from the stabilised/solidified soil in the event ofits eventual breakdown. Two other key performance parameterscommonly used in assessing S/S treatment efficiency are un-confined compressive strength (UCS) and hydraulic conductiv-ity. The UCS is an indication of the ability of a monolithic S/Smaterial to resist mechanical stresses. It relates to the progressof hydration reactions in an S/S product, as well as the durabil-ity of a monolithic S/S material. The hydraulic conductivitydetermines the potential for the transport of leachate bearingcontaminants to move through the S/S treated material intounderlying strata and eventually into groundwater (Bone et al.2004; Perera et al. 2005).
Several variables govern the performance of stabilised/solidified contaminated soils. These include soil type andproperties, contaminant type, speciation and concentration,
Reponsible editor: Zhihong Xu
R. B. Kogbara :A. Al-TabbaaDepartment of Engineering, University of Cambridge, TrumpingtonStreet, Cambridge CB2 1PZ, UK
R. B. Kogbara (*)Present address: Mechanical Engineering Program, Texas A&MUniversity at Qatar, PO Box 23874, Education City, Doha, Qatare-mail: [email protected]
J. A. StegemannDepartment of Civil, Environmental and Geomatic Engineering,Chadwick Building, University College London, London WC1E6BT, UK
Environ Sci Pollut Res (2014) 21:3395–3414DOI 10.1007/s11356-013-2276-7

curing environment, binder type and dosage. The multiplicityof variables involved complicates the optimisation of S/Streatment process design. In chemical processing, a range ofoperating policies is determined during the design stage,which ensures plant performance meets certain targets. Anoperating envelope is the union of such operating policies. Theaim of operating envelopes is to understand how variability inany of the operating variables affects the overall process(Samsatli et al. 2001). Similarly, since S/S treatment processesinvolves significant variability, it is important to develop operat-ing envelopes for stabilised/solidified contaminated soils. Suchoperating envelopes define the limits of operating variables thatresult in acceptable performance. This would enhance the appli-cability of S/S technology for treatment of a wide range ofcontaminated soils. The observation that specific waste typesexhibit systematic properties that allow discernment of distincttrends for different waste types provides the impetus for thiswork. For instance, leaching trends in widely different classesof waste materials demonstrated similar characteristics (van derSloot et al. 1996). The leachability of particular contaminantswas controlled by a limited number of parameters: pH, redoxpotential and complexation (van der Sloot et al. 1996).
The water and binder proportions added to the contaminat-ed soil during S/S treatment are the primary operating vari-ables (Stegemann and Zhou 2008; Kogbara et al. 2011).However, acidic influences in the environment reduce theinitial highly alkaline pH of the stabilised/solidified soil overtime. Such acidic influences include rainwater (pH ~5.6),landfill leachate, acid sulphate soils, etc. Thus, the pH of thestabilised/solidified soil is reduced to levels that favour metalsolubility and hence, leaching of metals. Therefore, the envi-ronment of a stabilised/solidified contaminated soil deter-mines the leachability of contaminants. Consequently, thiswork identifies the pH of the leaching fluid (leachant) as a(secondary) operating variable. This is because the leachantsimulates acidic water conditions in the environment.
In the light of the above, this work attempted to developoperating envelopes for treatment of a mixed contaminated soil.It is thought that operating envelopes developed for a given soiltype will be applicable to other soils with similar characteristics.Hence, different cementitious binders incorporating generic S/Sbinder materials were utilised in this study. Such materialsinclude Portland cement (CEMI), pulverised fuel ash (PFA),ground granulated blast furnace slag (GGBS) and hydrated lime(hlime). The different binder materials bring about certainadvantages to blended cements. For example, PFA grouts leadto reduced hydraulic conductivity, increasing compressivestrength and durability (UKQAA 2006). GGBS provides en-hanced durability, high resistance to chloride penetration andresistance to sulphate attack as well as improved sustainability(Higgins 2005). While lime-based S/S processes are able toaccommodate large quantities of organics as well as commoninorganic sludges (Conner and Hoeffner 1998).
There is a paucity of literature on studies deploying differ-ent binder blends for S/S treatment of a mixed contaminatedsoil. Thus, information on granular leachability of soils treatedby different binders systems under different pH conditions israre in the literature. Furthermore, very few studies too havecompared the strength and hydraulic conductivity of contam-inated soils treated by blends of the aforementioned genericbinder materials. These are necessary for informed decisionson recycling options (e.g., as sub-base course in road pave-ment) for contaminated soil treated by one binder or another.Therefore, this work seeks to fill in such gaps in the literature.The aim of the study was to compare the effectiveness, or thestrengths and weaknesses, of different binder blends for S/Streatment of a mixed contaminated soil. Specifically, the studyevaluates the range of binder dosage and water content thatleads to acceptable strength, hydraulic conductivity andleaching performance of different binder systems.
Materials and methods
Contaminated soil
It was the aim of the study to utilise a real site soil contaminatedwith metals and organics. This is because many contaminatedsoils are characterised by the concomitant presence of metalsand organics. However, the site soil found, contained very lowlevels of metals and total petroleum hydrocarbons (TPH). Thesource site of the soil was a service station in Birmingham, UK.The soil was clayey silty sandy gravel comprising 65 % gravel,29 % sand, 2.8 % silt and 3.2 % clay. It had a natural watercontent of ~12 % and very low (0.22 %, dry weight) organiccarbon content. The pH of the spiked contaminated soil (9.83)was very alkaline. Such high pH in soil is probably caused bythe association between sodium and carbonate species in thesoil (Brautigan 2010). It is important to point out that such ahigh soil pH would influence the leachability of contaminants.However, since one third of the world's soils are alkaline(Guerinot 2007), it is necessary to understand the leachingbehaviour of such soils.
In the light of the above, we spiked the soil with five metals(Cd, Cu, Pb, Ni and Zn) and diesel. We employed small batchesof ~3 kg for the spiking. The aimwas to increase the contaminantlevels to relatively high values for monitoring during the courseof the study. The concentration of each metal spiked was 3,000 mg/kg, while the concentration of diesel used was 10,000 mg/kg. The metals used were reagent grade chemical com-pounds, all supplied by Fisher Scientific. The contaminant levelswere chosen to represent the upper range of concentrations foundin contaminated soils (Kabata-Pendias and Mukherjee 2007).
Table 1 shows the total concentration of contaminants in thespiked soil. We understand that in reality, a contaminated sitesoil may not contain many metals at such high concentrations
3396 Environ Sci Pollut Res (2014) 21:3395–3414

as used here. Most contaminated sites may have two to three ofthe metals at similar concentrations and others at much lowerconcentrations. However, we employed high concentrations ofthe metals to represent some sort of 'worst-case scenario' ofelevated metal concentrations in contaminated soil.
Cementitious binders
The binders used for S/S treatment of the contaminated soilinvolved mixtures of CEMI, PFA, GGBS and hlime. Lafarge,UK supplied the CEMI, while UK Quality Ash Association(UKQAA) supplied the PFA. UK Cementitious Slag MakersAssociation (UKCSMA) and Tarmac Buxton Lime and Ce-ment (UK), supplied the GGBS and hlime, respectively. Table 2shows the physico-chemical properties of the binder materials.The specific binder formulations used were: CEMI, CEMI/
PFA=1:4, CEMI/GGBS=1:9 and hlime/GGBS=1:4. CEMI isthe most commonly used binder in S/S treatment. Hence, itserved as a control for assessment of the relative performance ofthe other binders. The binder mix proportions were the same asthose used in parallel studies on S/S of metal filter cakes(Stegemann and Zhou 2008). The screening and optimisationstage in the parallel studies showed good leachability results forthe blends. The mix proportions were also consistent withrelevant literature (Wild et al. 1996; Arora and Aydilek 2005;Oner and Akyuz 2007). Further, the choice of higher replace-ment levels of PFA and GGBS would ensure maximum re-useof industrial by-products for economic considerations.
Preparation of stabilised/solidified soil samples
The spiked contaminated soil was prepared by first mixing thesoil with diesel thoroughly. Addition of solutions of the me-tallic compounds made with de-ionised water followed there-after. Further mixing continued until the mix was homoge-nous. The spiked contaminated soil was then stored in a sealedcontainer for about 2 h. Analyses of leachability of contami-nants from soil samples followed thereafter. We then mixedbinder materials together in the appropriate proportions, andde-ionised water added to form a paste. The binders were thenapplied to the contaminated soil in 5 %, 10 % and 20 %dosages (dry weight), and mixed thoroughly.
Stabilised/solidified products were prepared using thedensity-moisture content relationship determined in the
Table 1 Amount of contaminants in the spiked contaminated soil
Contaminant Compound Contaminant concentration (mg/kg)
Cadmium Cd(NO3)2⋅4H2O 3,500±150a
Copper CuSO4⋅5H2O 3,200±230
Lead PbNO3 3,700±210
Nickel Ni(NO3)2⋅6H2O 3,600±150
Zinc ZnCl2 4,200±290
TPH Diesel 6,300±1500
a Results represent mean±standard deviation of three replicates
Table 2 Physico-chemical prop-erties of binder materials (fromMaterials data sheets)
LOI loss on ignition, NS notspecifieda The pH was determined in a1:10 binder material: deionisedwater suspension
Constituent/parameter CEMI PFA GGBS hlime
Bulk density (kg/m3) 1,300–1,450 1,100–1,700 1,200 470–520
Specific gravity 3.15 1.80–2.40 2.90 2.30–2.40
Specific surface area (m2/kg) 400 3,430 350 1,529
Granulometry/mean particle size (μm) – < 600 5–30 63–125
Colour Gray Gray Off-white White
pHa 12.80 10.22 11.79 12.85
CaO (%) 63.6 1–5 40 –
Ca(OH)2 (%) – – – 96.9
SiO2 (%) 13.9 45–51 35 –
MgO (%) 0.6 1–4 8 –
Mg(OH)2 (%) – – – 0.5
Al2O3 (%) 10.2 27–32 13 –
CaCO3 (%) – – – 1.4
CaSO4 (%) – – – 0.03
Fe2O3 (%) 2.7 7–11 – –
K2O (%) 0.9 1–5 – –
TiO2 (%) 0.1 0.8–1.1 – –
SO3 (%) 6.9 0.3–1.3 – –
Cl (%) 0.02 0.05–0.15 – –
LOI 2.15 NS – –
Environ Sci Pollut Res (2014) 21:3395–3414 3397

standard (2.5 kg rammer) Proctor compaction test (BSIBS1377: Part 4 1990). A few trials showed the range of watercontents that would be amenable to compaction. Thereafter,the contaminated soil–binder mixes were compacted at four tofive different water contents ranging from 13 % to 21 % (dryweight). The determination of water content did not includethe liquid content due to diesel. Hence, the optimum water/solid (w/s) ratio and the optimummoisture content (OMC) aresynonymous in this work. The compacted mix was broken upafter each stage and cast into cylindrical moulds, 50 mmdiameter and 100 mm high. The samples were stored at95 % relative humidity and 20 °C.
Testing methodologies
Assessment of S/S treatment efficiency involved UCS, hy-draulic conductivity, and acid neutralisation capacity (ANC)and pH-dependent granular leachability. The tests followedthe procedures described in relevant literature (Stegemann andCôté 1991; ASTM D1633-00 2000; ASTM D5084-03 2003).The ANC test was determined using 0, 1 and 2 meq/g HNO3
additions. The choice of only three acid additions was forconsistency with parallel studies on S/S of metal filter cakes(Stegemann and Zhou 2008). The ANC test on the untreatedcontaminated soil also included two more acid and base(NaOH) additions. This was meant to cover the full pH rangeand help assess metal immobilisation in a given pH zone.
Curing of the stabilised/solidified soils lasted 7, 28, 49 or84 days before testing. Testing started with low (5 %) binderdosage mixes with assessment of contaminant leachabilityuntil most granular leaching criteria were satisfied. Hence,the highest (20 %) binder dosage employed had fewer testing.
Details of the testing methods are contained in previous relat-ed works (Kogbara and Al-Tabbaa 2011; Kogbara et al. 2011,2012, 2013).
Statistical analysis and contour map plotting
Normality of data was determined using the Kolmogorov–Smirnov test. One- and two-way ANOVA were then used totest for statistically significant differences in performanceparameters due to differences in operating variables.
We plotted contour maps from the experimental resultsusing Origin 8.6 software (OriginLab Corporation, Northamp-ton, USA). The contour maps are in the form of design chartsand do represent operating envelopes for selected perfor-mance parameters. The contour plots for UCS were generatedfrom matrices based on moulding water content, binder dos-age and 28-day UCS data, for a given binder system. Whilecontour plots for leachability/leachate pH were generatedusing binder dosage, leachant pH and contaminantleachability/leachate pH data from different water contentsand curing ages. The contour matrices were determined usingthe software's gridding method (mainly kriging correlation),which best fits the data points.
Results and discussions
This section compares the effectiveness and the operatingenvelopes of the four different binders employed. The initialtesting employed 7- and 28-day-old samples of mixes treatedwith 5 % and 10 % dosage of the different binders. Theseindicated the best mechanical and leaching performance
1.65
1.70
1.75
1.80
1.85
1.90
1.95
0.10 0.12 0.14 0.16 0.18 0.20 0.22
Dry
den
sity
(Mg/
m3 )
Water/Solid (g/g)
5% CEMI 10% CEMI 20% CEMI5% CEMI-PFA 10% CEMI-PFA 20% CEMI-PFA5% CEMI-GGBS 10% CEMI-GGBS 20% CEMI-GGBS5% hlime-GGBS 10% hlime-GGBS 20% hlime-GGBS
Fig. 1 Compaction behaviour ofdifferent soil–binder mixes
3398 Environ Sci Pollut Res (2014) 21:3395–3414

around the OMC. Consequently, testing at 49 and 84 daysemployed only OMC mixes. Moreover, further testing con-tinued with only the OMC mix for samples with 20 % binderdosage. Where applicable, we compared the mechanical per-formance in terms of w/s ratio and binder dosage on 3-D plots.In such plots, one can read the performance parameters byfollowing the vertical lines to the base of their respective axes.
Compaction behaviour
Figure 1 shows the compaction characteristics of the differentcontaminated soil–grout mixes. Generally, water contents rang-ing from 13 % to 21 % (dry weight) resulted in adequateworkability of the soil–binder systems. The compaction charac-teristics of the four binder systems were similar. The OMC of
most of the soil–binder mixes varied within a 2 % range (i.e.,water contents of about 15 % to 17 %) depending on the binderdosage. Themaximum dry density ranged from 1.73 to 1.87Mg/m3, depending on the binder dosage. The results demonstrate thatsoil contamination and binder addition up to 20 % dosage doesnot alter the compaction behaviour significantly.
UCS comparison
Strength behaviour of the binders
Figure 2a compares the different mixes in terms of their 28-dayUCS on a 3-D plot. Figure 2b shows the strength development ofOMCmixes over time. Generally, the 28-day UCS behaviour ofCEMI–PFA, CEMI–GGBS and hlime–GGBS mixes was
0
400
800
1200
1600
2000
2400
0 28 56 84
UC
S (k
Pa)
Curing age (days)
5% CEMI 10% CEMI5% CEMI-PFA 10% CEMI-PFA5% CEMI-GGBS 10% CEMI-GGBS5% hlime-GGBS 10% hlime-GGBS
a
b
Fig. 2 UCS of different soil–binder mixes a at 28 days bin OMC mixes at differentcuring ages
Environ Sci Pollut Res (2014) 21:3395–3414 3399
similar. While that of CEMI-treated soil was markedly differentas its performance was superior. CEMI–PFA mixes generallyshowed the lowest strengths as the strength of CEMI–PFAbinderlargely depends on the cement content. Moreover, the presenceof the hydrocarbon contaminant generally leads to decreasedstrength in S/S treated soils (Trussell and Spence 1994). Thestrength gain over time of all binders except CEMI was similar(p=0.16) in 5% dosagemixes. However, theywere significantlydifferent (p=0.04) in 10 % dosage mixes (Fig. 2b).
CEMI–GGBS and hlime–GGBS mixes showed appreciablestrength gain over time, especially with 10% binder dosage. TheUCS of GGBS-based binders increases over time and could evenbe higher than that of CEMI at the same binder dosage over time,depending on the mix formulation (Higgins 2005; Oner andAkyuz 2007). This is because the pozzolanic reaction involvedin GGBS-based binders is slow and the formation of calciumhydroxide requires time (Oner and Akyuz 2007). However, theresults in Fig. 2b differed from the above position, especially forlime–GGBS mixes for which the mix formulation for optimumstrength (Higgins 2005) was used. CEMI-treated contaminatedsoil showed much higher strengths than soils treated with theGGBS-based binders throughout the 84-day study period(Fig. 2b). This difference in strength behaviour is probably dueto the interactive effects of contaminants, especially in the pres-ence of large amounts of hydrocabons. The results corroborateJegandan (2010) on superior performance of CEMI in soil withhigh organic content.
Table 3 shows the 49-day UCS before and after immersion inwater of the OMC mixes of the four binders. The GGBS-basedbinders were least affected by immersion in water. There was just3 % to 4% reduction in UCS of hlime–GGBSmixes. Moreover,the UCS of 5 % CEMI–GGBS dosage mixes increased afterimmersion in water. The transformation of the amorphous alu-minosilicate network structure of the GGBS-based binders into acrystalline one may account for this behaviour. Some of thecrystals have a faujasite structure, which appears to act as rein-forcement in the binder matrix (Shi and Fernandez-Jimenez2006). Thus, the results support previous reports that alkali-
activated cements have a much better resistance to corrosiveenvironments (e.g., water, and acidic and sulphate solutions) thanCEMI (Shi and Fernandez-Jimenez 2006).
Design chart representing operating envelopes for UCS
Figure 3 shows design charts based on contour plots illustrat-ing operating envelopes for 28-day UCS of the differentmixes. Each graph consists of the contour plots for twobinders, grouped according to the 'base materials' — CEMIand GGBS. This facilitates direct comparisons between thebinders, while ensuring that the graphs are not too congested.Solid, dash or dotted black and gray lines distinguish the UCSlevels of the different binders on the plots. There are alsoconstructions in the graphs to show how the charts work.
One common performance threshold for defining the op-erating envelope(s) for 28-day UCS is the 1 MPa criterion forlandfill disposal (Environment Agency 2006). Another per-formance threshold is the Environment Canada 440 kPa cri-terion for controlled utilisation (Stegemann and Côté 1996).The construction with solid black lines in Fig. 3a shows howto use the chart. Assuming we want an S/S product with aUCS of 1 MPa from a similar type of contaminated soil. TheminimumCEMI dosage that would be required is ~7.5%. Thew/s ratio would range from 0.17 to 0.19 (Fig. 3a). If a low w/sratio is used, the CEMI dosage required will significantlyincrease. Figure 3 indicates that greater than 20 % dosage isrequired for the other three binders to achieve the aforemen-tioned threshold. However, all soil–binder systems satisfiedthe 440-kPa UCS criterion with ≥10 % dosage. Nevertheless,this depended on the choice of water contents. Generally,water contents at the OMC and 2–4 % wet of OMC wasrequired to satisfy the criterion. For instance, 10 % CEMI–PFA dosage can achieve the criterion with a w/s of ~0.2 (i.e.,OMC+4) (Fig. 3a). Similarly, 10% CEMI–GGBS dosage canachieve it with a w/s of ~0.17 (i.e., OMC) (Fig. 3b).
The above implies that except CEMI, none of the otherbinders would meet strength requirements for sub-base course
Table 3 The 49-day UCS of the different soil–binder mixes before and after immersion in water
Binder Binder dosage (%) UCS before immersion (kPa) UCS after immersion (kPa) UCS reduction (%)
CEMI 5 330 280 15
10 1,990 990 50
CEMI/PFA=1:4 5 n.d. n.d. n.d.
10 110 66 40
hlime/GGBS=1:4 5 142 137 4
10 412 400 3
CEMI/GGBS=1:9 5 134 184 −27 (increase)10 760 647 15
n .d . not determined as samples crumbled due to insufficient hydration
3400 Environ Sci Pollut Res (2014) 21:3395–3414

in road pavements with up to 20% dosage. One recommendedminimum UCS requirement for sub-base course in rigid pave-ments is 200 psi (i.e., 1.38 MPa) at 7 days for CEMI and28 days for the other binder materials (UFC 2004). It iscommon knowledge that UCS increases with binder dosage.Hence, higher dosages of the different binders can make thetreated soils recyclable for construction applications.
Furthermore, the relatively low water contents used here wasadequate for workability of the soil–binder mixtures under labo-ratory conditions. However, it is likely that they may not work inthe field. Moreover, field scenario would involve weathered
contamination as opposed to fresh contamination used here. Soilswith weathered petroleum hydrocarbons are more likely to havehigher UCS than soils with fresh hydrocarbons (Al-Sanad andIsmael 1997). Hence, these results provide a conservative esti-mate of the UCS values under usual field conditions.
Hydraulic conductivity
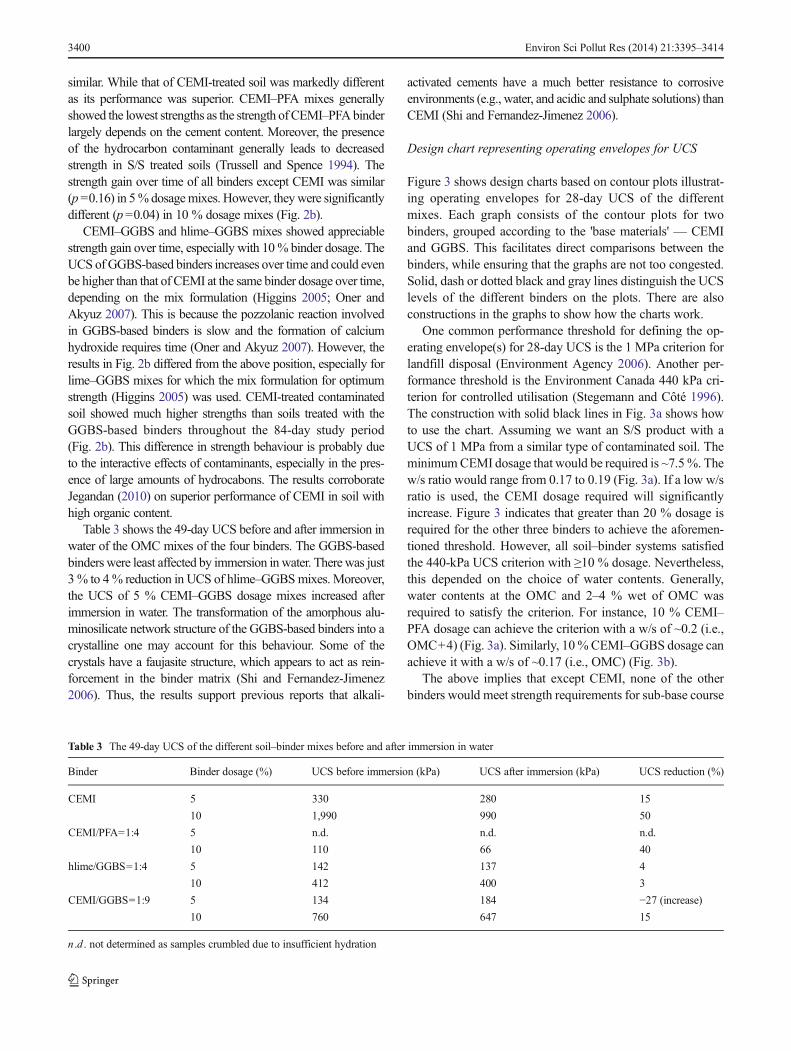
Figure 4 shows the hydraulic conductivity of the differentmixes at 28 days. The figure also shows the hydraulic con-ductivity of OMC mixes at 28 and 84 days. The 5 % dosage
Fig. 3 a Design chart for 28-day UCS; b example of howthe chart works
Environ Sci Pollut Res (2014) 21:3395–3414 3401
CEMI–PFA and CEMI–GGBS OMC mixes crumbled overtime due to insufficient hydration. Hence, the hydraulic con-ductivity of the mixes was not tested. Thus, Fig. 4 does notshow data on the saidmixes. The hydraulic conductivity of thethree CEMI-containing binders was generally similar. How-ever, the hydraulic conductivity of hlime–GGBS mixes wasmarkedly different from those of the CEMI-containingbinders. It was generally higher and increased with increasingbinder dosage (Fig. 4a).
The increase in hydraulic conductivity with binderdosage in hlime–GGBS mixes may be associated withthe presence of lime. However, increasing steel slag
content, which is similar to GGBS, was reported toincrease the permeability of lateritic soil and it waslinked with the free lime content of the slag(Akinwumi et al. 2012). The reaction of lime with soilparticles, especially clays, leads to agglomeration andflocculation of clay particles with a consequent reduc-tion in the plasticity. The resultant soil structure be-comes an open matrix. This in turn leads to increase inhydraulic conductivity. However, the above differsfrom a previous observation that lime addition reducedthe hydraulic conductivity of poorly graded river sandbut increased that of sandy silty clay (El-Rawi and
Fig. 4 Hydraulic conductivity ofdifferent soil–binder mixes a at28 days b in OMC mixes atdifferent curing ages
3402 Environ Sci Pollut Res (2014) 21:3395–3414

Awad 1981). The exact reason for this behaviour isunclear as there is little information on the effect oflime–GGBS addition on sandy and gravelly soils.Thus, more work is required in this area to elucidate
the effect of the binder on hydraulic conductivity indifferent soil types.
Hydraulic conductivity values were generally at the mini-mum around the OMC. As expected, increase in binder dos-
Table 4 ANC of the differentbinders and leachant pH at 0, 1and 2 meq/g HNO3 addition
Binder/leachant pH Difference in pH units between 0 and 2 meq/g
0 meq/g 1 meq/g 2 meq/g
CEMI 12.80 12.66 12.53 0.27
CEMI/PFA=1:4 12.78 12.40 10.95 1.83
hlime/GGBS=1:4 12.94 12.71 12.59 0.35
CEMI/GGBS=1:9 12.61 11.51 11.02 1.59
Leachant 7.20 1.20 0.85 not applicable
Fig. 5 Leachability in the treatedsoils at 28 days for a Cd and b Cu
Environ Sci Pollut Res (2014) 21:3395–3414 3403

age generally led to decrease in hydraulic conductivity exceptfor hlime–GGBS mixes. The hydraulic conductivity of allmixes except CEMI–PFA mixes slightly increased above their28-day values at 84 days (Fig. 4b). A similar observation hasbeen reported (Al-Tabbaa and Evans 2000). The different be-haviour of the 10 % CEMI–PFA mix was probably due toreduction in interconnectivity of the pores by products of on-going pozzolanic reactions (Kogbara et al. 2013).
There is no design chart for hydraulic conductivity due topaucity of data points. Nevertheless, the most common perfor-mance threshold for hydraulic conductivity is the 10−9 m/s limitfor in-ground treatment. Another performance threshold is the10−8 m/s Environment Canada proposed limit for landfill dis-posal scenarios (Stegemann and Côté 1996). None of the mixessatisfied the 10−9 m/s criterion with 20 % binder dosage. Thus,
higher binder dosages would be required to meet that criterion.The binders satisfied the 10−8 m/s criterion for landfill disposalwith up to 20 % dosage at certain water contents. However,hlime–GGBS mixes were an exception to this (Fig. 4).
Granular leachability of contaminants
ANC and leaching trends
This section focuses on comparisons between the differentsoil–binder systems. Discussion on the leaching behaviourand chemistry of the contaminants is phenomenological. Thisis because they were essentially the same as described inprevious related works (Kogbara and Al-Tabbaa 2011;Kogbara et al. 2011) for all soil–binder systems. Table 4
Fig. 6 Leachability in the treatedsoils at 28 days for a Pb and b Ni
3404 Environ Sci Pollut Res (2014) 21:3395–3414

compares the ANC or buffering capacity of the four binders.The buffering capacity is the ability to neutralise acidic influ-ences and maintain chemical durability. It was in the order,hlime–GGBS>CEMI>CEMI–GGBS>CEMI–PFA. The or-der of the buffering capacities is due to the natural pH of thebinder materials (see Table 2).
Figures 5, 6 and 7 show the 28-day leachability of the sixcontaminants, in OMC mixes of different soil–binder mixes.The figures also show the initial leachability of the untreatedspiked contaminated soil at different pH values. Eachstabilised/solidified product has three points on the graphs.From right to left, these represent the leachate pH values at 0,1 and 2 meq/g HNO3 additions. The smooth curves in themetal leachability graphs are the theoretical solubility profiles
of the metal hydroxides (Stegemann 2005). The solubilityprofiles come from data in the MINTEQ database— a chem-ical equilibrium model for predicting metal speciation andsolubility. The range of water contents considered had nosignificant effect on leachability of contaminants. Hence,Figs. 5–7 shows the contaminant leachability in only OMCmixes of different soil–binder systems.
The leaching behaviour of all five metals was largely pH-controlled in all binders. Metal leachability depended on theleachate pH attained by a given mix. The leachate pH in turndepended on the binder dosage used. This corroborates vander Sloot et al. (1996) on similarity of leaching trends indifferent classes of materials. Generally, metal leachability inall binders increased with decreasing pH and decreased with
Fig. 7 Leachability in the treatedsoils at 28 days for a Zn and bTPH
Environ Sci Pollut Res (2014) 21:3395–3414 3405

increasing binder dosage. However, there were some excep-tions. These occurred when the pH fell in the zone for in-creased leachability of some metals above their minimumsolubility values. This is obvious for Cu in CEMI S/S soil(Fig. 5b). The same goes for Pb and Zn in CEMI and hlime–GGBS S/S soil (Figs. 6a and 7a). This corroborates Akhteret al. (1990) on problems encountered with CEMI for Pbstabilisation. As opposed to CEMI, which presents problemswith Pb stabilisation, CEMI–PFA tends to widen the immo-bilisation pH range. This is due to its fly ash content, which
forms pozzolanic products that either adsorb Pb on to freshsurfaces or incorporate Pb by means of chemical inclusions.Additional pozzolanic product formation with increasing cur-ing age further increases the amount of non-extractable Pb(Dermatas et al. 2006). Generally, CEMI and hlime–GGBSbinders showed better immobilisation capacities for Cd, Niand Zn. CEMI–PFA and CEMI–GGBS binders were betterfor Cu and Pb immobilisation.
The speciation of the metals was similar in all binder systems.The leaching behaviour of Cd, Cu, Pb and Zn generally followed
Fig. 8 Leachate pH design chartfor mixes based on a CEMI, andb GGBS
3406 Environ Sci Pollut Res (2014) 21:3395–3414
the hydroxide profile of the metals in all binder systems. Theleaching behaviour of Ni suggests the existence of the metal inmore soluble phases other than the hydroxide. The leachability ofthe metal exceeded Ni(OH)2 solubility limits in most cases(Fig. 6b). It is likely that Ni existed as carbonate-complexes inthe cementitious systems (Christensen et al. 1996). Compared tothe untreated soil, the 20 % dosage mix of all binder systemsshowed the potential for chemical immobilisation of the metals.In some cases, the leachability of the metals was lower in suchmixes than in the untreated soil even at the same pH.
TPH leachability was similar in all binder systems. Binderdosage had no significant effect on it (Fig. 7b). Schifano et al.(2005) made a similar observation for contaminated soil treatedwith lime. All the same, S/S treatment with the binders reducedTPH leachability. Generally, the untreated soil leached out higherTPH concentrations than S/S treated soils. The lowest TPHconcentrations occurred in hlime–GGBS mixes (Fig. 7b). It islikely that the presence of lime contributed to the marginallybetter performance of hlime–GGBS mixes. Lime has beenshown to be very effective for macroencapsulation of
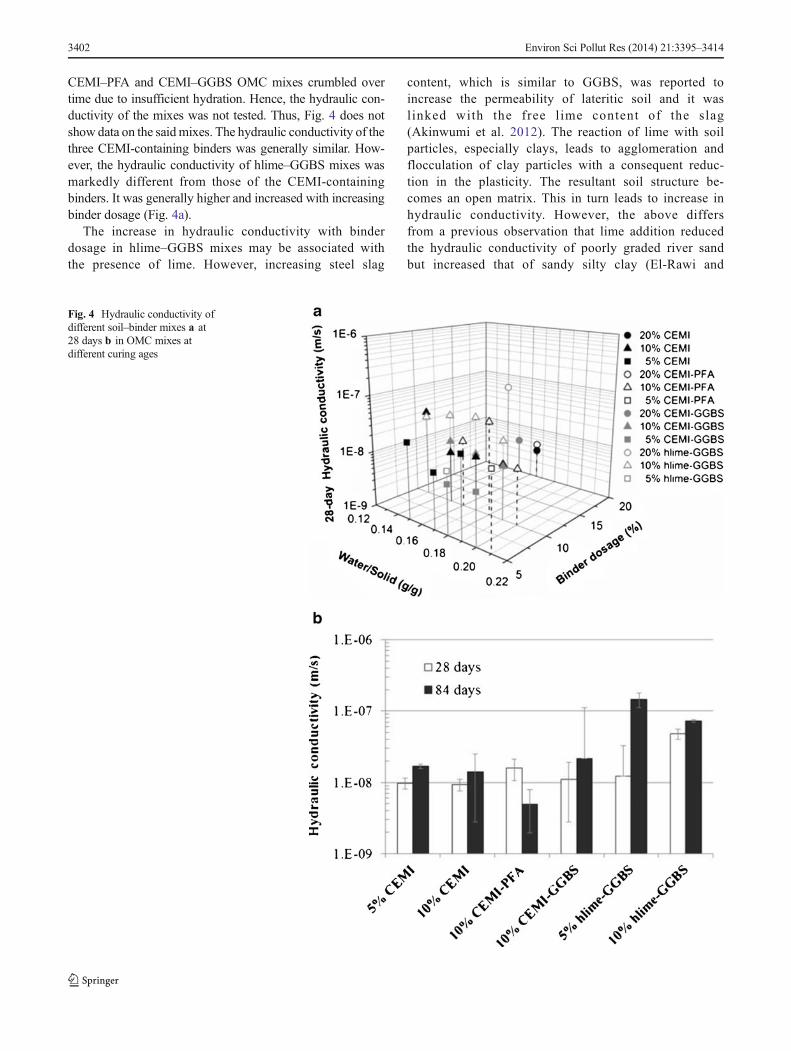
Fig. 9 Cd leachability designchart for mixes based on a CEMI,and b GGBS
Environ Sci Pollut Res (2014) 21:3395–3414 3407

hydrocarbon-contaminated soils (Adams 2004). Similarly, therewas no observable effect of pH on TPH leachability. Besidesbeing soluble in one another, petroleum hydrocarbons are gen-erally characterised by insolubility under different conditions insingle solvents. Hence, the pH of the leachant does not governTPH leachability. Nevertheless, increasing acidity apparentlyinfluenced TPH leachability in the treated soils as compared tothe untreated soil. Higher TPH concentrations were generallyleached out at 1 and 2 meq/g acid addition than with no acidaddition (Fig. 7b). In many cases, the solubility of an organic
contaminant depends on the pH of the environment in which it ispresent (Bone et al. 2004).
We did not include the leachability results in thedifferent soil–binder systems over time due to manu-script length. These are contained in related publications(Kogbara and Al-Tabbaa 2011; Kogbara et al. 2012,2013). The leaching behaviour observed over time issummarised as follows. The leachability of the metalsin the mixes was either stable or decreased by over halfan order of magnitude between 28 and 84 days of
Fig. 10 Cu leachability designchart for mixes based on a CEMI,and b GGBS
3408 Environ Sci Pollut Res (2014) 21:3395–3414

treatment. CEMI–GGBS mixes showed a unique leach-ability trend between 49 and 84 days. The leachateconcentrations of all metals decreased between bothcuring ages, and this corroborated the strength increaseobserved during the said period (Kogbara and Al-Tabbaa 2011). There was a general increase in TPHleachability over the 28-day values at 84 days in allbinder systems. However, the increase was quite signif-icant in CEMI–PFA mixes especially under acidic influ-ence, probably due to the hydrocarbon origin of PFA.
Hence, CEMI–PFA appears to be the least suitablebinder for reducing TPH leachability.
Design charts for leachate pH and leachabilityof contaminants
The effects of water content and curing age on contaminantleachability were not statistically significant. Hence, we com-bined contaminant leachability and leachate pH data from soil–binder mixes with different water contents and curing ages. We
Fig. 11 Pb leachability designchart for mixes based on a CEMI,and b GGBS
Environ Sci Pollut Res (2014) 21:3395–3414 3409

used the said data to produce the design charts here (Figs. 8–14). The design charts compare the leachate pH and leachabilityof the six contaminants studied, in the four soil–binder systems.The contour plots here have two graphs for each parameter/contaminant similar to those previously described for UCS. Thebinders are distinguished with the same lines used previously.Binder dosage and the leachate pH attained during leachingmainly determined contaminant leachability. The binder dosageand leachant pH controls the leachate pH. Hence, both param-eters are the independent operating variables for the
contaminant leachability design charts. The constructions inFigs. 8b and 9b show how the charts work. One can use theleachate pH and contaminant leachability charts together.
Given that, a natural leachant with pH around 5.6 contin-uously gets in contact with a 9 % CEMI–GGBS dosagestabilised/solidified product. Figure 8b (construction with sol-id gray lines) shows that its pH will decrease to around 10.2.Based on the same information, Fig. 9b shows that the Cdleachability would range from 0.01 to 10 mg/kg. Similarly,Fig. 8b also shows the effect of a leachant pH of 3.8 on an 8 %
Fig. 12 Ni leachability designchart for mixes based on a CEMI,and b GGBS
3410 Environ Sci Pollut Res (2014) 21:3395–3414

hlime–GGBS stabilised/solidified product. Its leachate pHdrops to around 9.4 (Fig. 8b, construction in dotted gray lines).The Cd leachability of the 8 % hlime–GGBS stabilised/solidified product would be around 10 mg/kg (Fig. 9b). Thesituation in the second example is similar to the effects ofprogressive carbonation on stabilised/solidified materials. Ab-sorption of CO2 causes decrease in pH of such materials to ~9(Arickx et al. 2010). The aforementioned leachant pH issimilar to the pH (3–4) of carbonic acid, which is involvedin carbonation. It is noteworthy that these examples relate to
leaching from granular forms of the stabilised/solidified ma-terials. This could occur in a worst-case scenario over a longtime when the stabilised/solidified soil breaks down.
There are no established performance thresholds for contam-inant leachability at specific pH values. Performance thresholdsfor contaminant leachability only exist for leachability at zeroacid addition. These are contained in a related publication(Kogbara andAl-Tabbaa 2011). The design charts are also usefulfor this purpose as a leachant pH ~7 corresponds to zero acidaddition. For instance, an applicable performance threshold is the
Fig. 13 Zn leachability designchart for mixes based on a CEMI,and b GGBS
Environ Sci Pollut Res (2014) 21:3395–3414 3411

granular leachabilitywaste acceptance criteria (WAC). TheWACfor Cd in stable non-reactive hazardous waste in non-hazardouslandfill is 1.0mg/kg.We can deduce fromFig. 9a that 5%CEMIdosage can easily satisfy the criterion.While ≥10%dosage of theother three binders would be required to satisfy the criterion.
Naturally, the acceptable binder dosage limit for leachabilityis the threshold at which leaching criteria for all metals aresatisfied. Consequently, about 20 % dosage is required for allbinders to satisfy themost stringent leaching criteria (see Figs. 9,
10, 11, 12, 13 and 14). The said criteria are the environmentalquality standard (EQS) for inland surface waters and the inertwaste landfill WAC. The available EQS in mg/kg are 0.04 forCd, 72 for Pb and 0.2 for Ni. The following are the WAC forinert waste landfill. The WAC for Cd, Cu, Pb, Ni and Zn are0.04, 2, 0.5, 0.4 and 4 mg/kg, respectively (Kogbara and Al-Tabbaa 2011). However, Pb content presents problems inbinders like CEMI and hlime–GGBS. This is because lowbinder dosage may satisfy certain leaching criteria, but higher
Fig. 14 TPH leachability designchart for mixes based on a CEMI,and b GGBS
3412 Environ Sci Pollut Res (2014) 21:3395–3414

dosage may not. This occurs where the pH attained by higherdosages of both binders corresponded to the zone for increasedPb leachability. Thus, both binders may not be very suitable forsimilar soils with high Pb concentrations. It is noteworthy thatsoils with weathered contamination are more likely to havelower contaminant leachability than freshly contaminatedsoils. Hence, the leaching results here may be higherestimates (perhaps the worst-case scenario) of thoseunder typical field conditions.
Design charts for soils would depend on the properties of agiven soil. All the same, the charts here can also provide likelyestimates of contaminant leachability in other stabilised/solidified soils. The following examples comparing resultsfrom similar situations in other studies illustrate this. Yilmazet al. (2003) used 10 % CEMI binder in treating fine miningwaste soil (27 % sand, 18 % clay, 55 % silt). The initialconcentrations of Cu (3,640 mg/kg) and Pb (4,380 mg/kg)were close to those here. The leachant pH used was 4.93 intoxicity characteristic leaching procedure (TCLP) tests. The28-day leachability of Cu and Pb were 6.2 and 7.8 mg/kg,respectively. These are similar to Cu and Pb leachabilityaround 4 and 10 mg/kg, respectively, for CEMI in Figs. 10aand 11a. Secondly, Moon et al. (2010) used 20 % CEMI–PFAbinder to treat Zn-contaminated soil (55 % sand, 33.8 % silt,10.3 % clay; natural pH 8.31). The binder formulation used(CEMI/PFA=1:3) is close to that used here. The initial Znconcentration was 4,973 mg/kg. The 28-day Zn leachabilityrecorded in TCLP tests with leachant pH, 2.88±0.05, was260 mg/kg. This is close to the Zn leachability range(~300 mg/kg) for CEMI–PFA in Fig. 13a.
Conclusions
This work considered the initial development of operatingenvelopes for S/S treatment of contaminated soil with differentbinders. It culminated in the production of design charts thatestablish relationships between operating variables and strengthand leaching performance. The study showed that with freshlycontaminated soils containing large amounts of hydrocarbons,stabilisation with CEMI results in a much higher UCS thanCEMI–PFA, CEMI–GGBS and hlime–GGBS. With up to20 % binder dosage, CEMI satisfies the strength criteria re-quired for different management scenarios. However, depend-ing on the extent of contamination, greater than 20 % dosage ofthe other three binders would be required to satisfy strengthcriteria for most management scenarios. Thus, economic con-siderations on the amount of binder materials required to satisfyset criteria would influence the choice of one binder overanother. Generally, water contents at the OMC and 2–4 % wetof OMC resulted in the highest UCS values.
Stabilisation with the cement-containing binders gave sim-ilar hydraulic conductivity values. However, hlime–GGBS
stabilisation led to much higher hydraulic conductivity. Thehydraulic conductivity increased with increasing binder dos-age. Hence, the binder may not be suitable for recyclingapplications requiring low hydraulic conductivity. Hydraulicconductivity values were generally at the minimum around theOMC. Greater than 20 % dosages of all four binders arerequired to give hydraulic conductivities <10−9 m/s. Thecement-containing binders would satisfy reuse applicationsrequiring 10−8 m/s hydraulic conductivity with up to 20 %dosage but hlime–GGBS mixes would not.
Water contents ranging from 13 % to 21 % (dry weight)had no significant effect on leachability of contaminants.About 20 % dosage of all four binders is required to satisfythe most stringent leaching criteria. However, this does notapply to Pb stabilisation with CEMI and hlime–GGBS as thebinders present problems with the contaminant. CEMI andhlime–GGBS binders showed better immobilisation capaci-ties for Cd, Ni and Zn. CEMI–PFA and CEMI–GGBS binderswere better for Cu and Pb immobilisation. All four bindersshowed similar performance for TPH immobilisation, al-though hlime–GGBS gave a marginally better performance.
The operating envelopes for the different parameters con-sidered in this work largely depend on the properties of thesoil used. Nevertheless, comparison with results from similarsituations in other studies shows that the design charts may beapplicable to other stabilised/solidified soils with similar char-acteristics. In particular, the charts can provide likely estimatesof contaminant leachability in other stabilised/solidified soils.The data utilised for the design charts were limited, whichmay reduce their reliability for certain values of operatingvariables. Further studies may improve the reliability of thedesign charts. Such studies may consider data from differentsoil types, contaminant concentrations, ranges of operatingvariables, and other performance parameters.
Acknowledgments This paper was written to support the ProCeSSproject, which was conducted by a consortium of five universities, ledby University College London, and 17 industrial partners, under the UKDIUS Technology Strategy Board (TP/3/WMM/6/I/15611). The projectwebsite is at http://www.cege.ucl.ac.uk/process
References
Adams RH (2004) Chemical–biological stabilisation of hydrocarbon-contaminated soil and drilling cuttings in tropical Mexico. LandContamination and Reclamation 12(4):349–361
Akhter H, Butler LG, Branz S, Cartledge FK, Tittlebaum ME (1990)Immobilization of As, Cd, Cr and Pb-containing soils by usingcement or pozzolanic fixing agents. J Hazard Mater 24:145–155
Akinwumi I, Adeyeri J, EjohwomuO (2012) Effects of steel slag additionon the plasticity, strength, and permeability of lateritic soil. In:Chong WKO, Gong J, Chang J, Siddiqui MK (eds) Internationalconference on sustainable design, engineering, and construction,
Environ Sci Pollut Res (2014) 21:3395–3414 3413

Fort Worth, TX, United States. Available: http://ascelibrary.org/doi/abs/10.1061/9780784412688.055, 2012. pp 457–464
Al-Sanad HA, Ismael NF (1997) Aging effects on oil-contaminatedKuwai t i sand . ASCE Journa l o f Geo techn ica l andGeoenvironmental Engineering 123(3):290–293
Al-Tabbaa A, Evans CW (2000) Pilot in situ auger mixing treatment of acontaminated site. Part 3. Time-related performance. Proceedings ofthe Institution of Civil Engineers. Geotech Eng 143:103–114
Arickx S, De Borger V, Van Gerven T, Vandecasteele C (2010) Effect ofcarbonation on the leaching of organic carbon and of copper fromMSWI bottom ash. Waste Manag 30:1296–1302
Arora S, Aydilek AH (2005) Class F fly-ash-amended soils as highwaybase materials. J Mater Civ Eng 17:640–649
ASTM D1633-00 (2000) Standard method for compressive strength ofmolded soil–cement cylinders. American Society for Testing ofMaterials, West Conshohocken, PA
ASTM D5084-03 (2003) Standard test methods for measurement ofhydraulic conductivity of saturated porous materials using a flexiblewall permeameter. American Society for Testing of Materials, WestConshohocken, PA
Bone BD, Barnard LH, Boardman DI, Carey PJ, Hills CD, Jones HM,MacLeod CL (2004) Review of scientific literature on the use ofstabilisation/solidification for the treatment of contaminated soil,solid waste and sludges. UK Environment Agency Science ReportSC980003/SR2, Bristol
Brautigan DJ (2010) Chemistry, phytotoxicity and remediation of alka-line soils. PhD thesis, The University of Adelaide, Australia.Available at: http://digital.library.adelaide.edu.au/dspace/bitstream/2440/69719/1/02whole.pdf. Accessed June 2012.,
BSI BS1377: Part 4 (1990) Methods of test for soils for civil engineeringpurposes: compaction-related tests. British Standards Institution,London.
Christensen TH, Lehmann N, Jackson T, Holm PE (1996) Cadmium andnickel distribution coefficients for sandy aquifer materials. J ContamHydrol 24:75–84
Conner JR,Hoeffner SL (1998)A critical reviewof stabilization/solidificationtechnology. Crit Rev Environ Sci Technol 28(4):397–462
Dermatas D, Menounou N, Meng XG (2006) Mechanisms of lead im-mobilization in treated soils. Land Contamination and Reclamation14(1):43–56
El-Rawi MN, Awad AAA (1981) Permeability of lime stabilized soils.Journal of Transportation Engineering Division ASCE 107:25–35
Environment Agency (2006) Guidance for waste destined for disposals inlandfills, Version 2, Interpretation of the Waste AcceptanceRequirements of the Landfill (England and Wales) Regulations(as amended). Environment Agency, Bristol
Guerinot ML (2007) It's elementary: enhancing Fe3+ reduction improvesrice yield. Proc Natl Acad Sci U S A 104(18):7311–7312
Higgins DD (2005) Soil stabilisation with ground granulated blastfurnaceslag. UK Cementitious Slag makers Association report. Available at:http://www.ecocem.ie/downloads/Soil_Stabilisation.pdf?PHPSESSID=5ec729224273596073a6071e4f56075d, (Accessed: December 2012).
Jegandan S (2010) Ground improvement with conventional and novelbinders. PhD thesis, Cambridge University, UK
Kabata-Pendias A, Mukherjee AB (2007) Trace elements from soil tohuman. Springer, Berlin
Kogbara RB, Al-Tabbaa A (2011) Mechanical and leaching behaviour ofslag–cement and lime-activated slag stabilised/solidified contami-nated soil. Sci Total Environ 409(11):2325–2335
Kogbara RB, Yi Y, Al-Tabbaa A (2011) Process envelopes forstabilisation/solidification of contaminated soil using lime–slagblend. Environ Sci Pollut Res 18(8):1286–1296
Kogbara RB, Al-Tabbaa A, Yi Y, Stegemann JA (2012) pH-dependentleaching behaviour and other performance properties of cement-treated mixed contaminated soil. J Environ Sci 24(9):1630–1638
Kogbara RB, Al Tabbaa A, Yi Y, Stegemann JA (2013) Cement-fly ashstabilisation/solidification of contaminated soil: performance prop-erties and initiation of operating envelopes. Appl Geochem 33:64–75
LaGrega MD, Buckingham PL, Evans JC, Management ER (2001)Hazardous waste management, 2nd edn. McGraw Hill, New York
Moon DH, Lee J-R, Grubb DG, Park J-H (2010) An assessment ofPortland cement, cement kiln dust and Class C fly ash for theimmobilization of Zn in contaminated soils. Environmental EarthSciences 61(8):1745–1750
Oner A, Akyuz S (2007) An experimental study on optimum usage ofGGBS for the compressive strength of concrete. Cem ConcrCompos 29:505–514
Perera ASR, Al-Tabbaa A, Reid JM, Stegemann JA (2005) State ofpractice report, UK stabilisation/solidification treatment and reme-diation: Part IV. Testing and performance criteria. In: Al-Tabbaa A,Stegemann JA (eds) Proceedings of the International conference onstabilisation/solidification treatment and remediation, Cambridge,2005. Taylor and Francis, London, pp 415–435
Samsatli NJ, Sharif M, Shah N, Papageorgiou LG (2001) Operationalenvelopes for batch processes. AIChE J 47:2277–2288
Schifano V, Macleod CL, Dudeney AWL, Dudeney R (2005)Remediation of soils contaminated with petroleum hydrocarbonsusing quicklime mixing. In: Al-Tabbaa A, Stegemann JA (eds)Proceedings of the International conference on stabilisation/solidification treatment and remediation, Cambridge. Taylor andFrancis, London, pp 69–78
Shi C, Fernandez-Jimenez A (2006) Stabilization/solidification of haz-ardous and radioactive wastes with alkali-activated cements. JHazard Mater B137:1656–1663
Spence RD, Shi C (eds) (2005) Stabilization and solidification ofhazardous, radioactive and mixed wastes. CRC Press, BocaRaton, FL
Stegemann JA (2005) Interactions between wastes and binders. In:Spence RD, Shi C (eds) Stabilization and solidification of hazard-ous, radioactive and mixed wastes. CRC Press, Boca Raton, FL, pp151–176
Stegemann JA, Côté PL (1991) Investigation of test methods for solidi-fied waste evaluation – cooperative program. Environment CanadaReport EPS 3/HA/8. Ottawa, Ontario, Canada
Stegemann JA, Côté PL (1996) A proposed protocol for evaluation ofsolidified wastes. Sci Total Environ 178:103–110
Stegemann JA, Zhou Q (2008) Development of process envelopes forcement-based stabilisation/solidification of metal treatmentfiltercakes. WIT Trans Ecol Environ 109:21–30
Trussell S, Spence RD (1994) A review of solidification/stabilisationinterferences. Waste Manag 14:507–519
UFC (2004) Soil stabilization for pavements. United Facilities Criteria (3-250-11), TM 5-822-14/AFJMAN 32/1019. Available: http://www.wbdg.org/ccb/DOD/UFC/ufc_3_250_11.pdf (AccessedMarch 2013).
UKQAA (2006) Pulverised fuel ash for grouting. United KingdomQuality Ash Association (UKQAA) Technical Data Sheet. <http://www.ukqaa.org.uk/> (accessed December 2010).
van der Sloot HA, Comansa RNJ, Hjelmarb O (1996) Similarities in theleaching behaviour of trace contaminants from waste, stabilizedwaste, construction materials and soils. Sci Total Environ 178:111–126
Wild S, Kinuthia JM, Robinson RB, Humphreys I (1996) Effects ofground granulated blastfurnace slag (GGBS) on strength and swell-ing properties of lime stabilized kaolinite in the presence of sul-phates. Clay Miner 31(3):423–433
Yilmaz O, Cokca OE, Unlu K (2003) Comparison of two leachingtests to assess the effectiveness of cement-based hazardouswaste solidification/stabilization. Turk J Eng Environ Sci 27:201–212
3414 Environ Sci Pollut Res (2014) 21:3395–3414