comparison of vascular response after sirolimus-eluting...
TRANSCRIPT

J A C C : C A R D I O V A S C U L A R I M A G I N G V O L . 1 , N O . 4 , 2 0 0 8
© 2 0 0 8 B Y T H E A M E R I C A N C O L L E G E O F C A R D I O L O G Y F O U N D A T I O N I S S N 1 9 3 6 - 8 7 8 X / 0 8 / $ 3 4 . 0 0
P U B L I S H E D B Y E L S E V I E R I N C . D O I : 1 0 . 1 0 1 6 / j . j c m g . 2 0 0 8 . 0 3 . 0 1 2
Comparison of Vascular Response AfterSirolimus-Eluting Stent ImplantationBetween Patients With Unstable andStable Angina PectorisA Serial Optical Coherence Tomography Study
Takashi Kubo, MD, PHD, Toshio Imanishi, MD, PHD, Hironori Kitabata, MD,Akio Kuroi, MD, Satoshi Ueno, MD, Takashi Yamano, MD, Takashi Tanimoto, MD,Yoshiki Matsuo, MD, PHD, Takashi Masho, MD, Shigeho Takarada, MD, PHD,Atsushi Tanaka, MD, PHD, Nobuo Nakamura, MD, Masato Mizukoshi, MD, PHD,Yoshiaki Tomobuchi, MD, PHD, Takashi Akasaka, MD, PHD
Wakayama, Japan
O B J E C T I V E S The aim of the present study was to compare lesion morphologies after sirolimus-
eluting stent (SES) implantation between patients with unstable angina pectoris (UAP) and stable angina
pectoris (SAP) with the use of optical coherence tomography (OCT).
B A C K G R O U N D The lesion morphologies before and after coronary stenting have been proposed as
important predictors of clinical outcome. The high resolution of OCT provides detailed information of
coronary vessel wall.
M E T H O D S We enrolled 55 patients (UAP: n � 24, SAP: n � 31), and examined lesion morphologies
by using OCT at pre- and post-SES implantation and 9 months’ follow-up.
R E S U L T S The incidence of plaque rupture (42% vs. 3%, p � 0.001), intracoronary thrombus (67% vs. 3%,
p � 0.001) and thin-capped fibroatheroma (cap thickness �65 �m; 46% vs. 3%, p � 0.001) at pre-
intervention was significantly greater in UAP than that in SAP. Although stent profiles and procedural
characteristics were not different between the 2 groups, inadequate stent apposition (67% vs. 32%, p �
0.038) and tissue protrusion (79% vs. 42%, p � 0.005) after percutaneous coronary intervention were
observed more frequently in patients with UAP. Plaque rupture was significantly increased after percutane-
ous coronary intervention in patients with UAP (42% to 75%, p � 0.018), and the persistence of core cavity
after plaque rupture (28% vs. 4%, p � 0.031) at 9 months’ follow-up was observed more frequently in UAP
patients compared with SAP patients. At 9 months’ follow-up, the incidence of inadequately apposed stent
(33% vs. 4%, p � 0.012) and partially uncovered stent by neointima (72% vs. 37%, p � 0.019) was significantly
greater in UAP patients than that in SAP patients. All patients took aspirin and ticlopidine during follow-up
period, and no patients had stent thrombosis or adverse coronary events.
C O N C L U S I O N S Serial OCT examinations demonstrated markedly different vascular response up
to 9 months after SES implantation between UAP and SAP patients. Although the inadequate lesion
morphologies after stenting were observed more frequently in UAP patients, these findings were not
associated with adverse outcomes in patients with antiplatelet therapy. (J Am Coll Cardiol Img 2008;
1:475–84) © 2008 by the American College of Cardiology Foundation
From the Department of Cardiovascular Medicine, Wakayama Medical University, Wakayama, Japan.
Manuscript received December 10, 2007; revised manuscript received February 14, 2008, accepted March 5, 2008.
PtrrlA
pcftih�
coccaewr�pbiOdwCca
bTpeMtcvpRf0iat1cm(LuOltcisdawrtdptnsqlwqmabcTmwstTb
A
A
A
I
O
t
P
i
S
S
T
fi
UAP � unstable angina pect
J A C C : C A R D I O V A S C U L A R I M A G I N G , V O L . 1 , N O . 4 , 2 0 0 8
J U L Y 2 0 0 8 : 4 7 5 – 8 4
Kubo et al.
OCT Assessment of Intracoronary Stenting
476
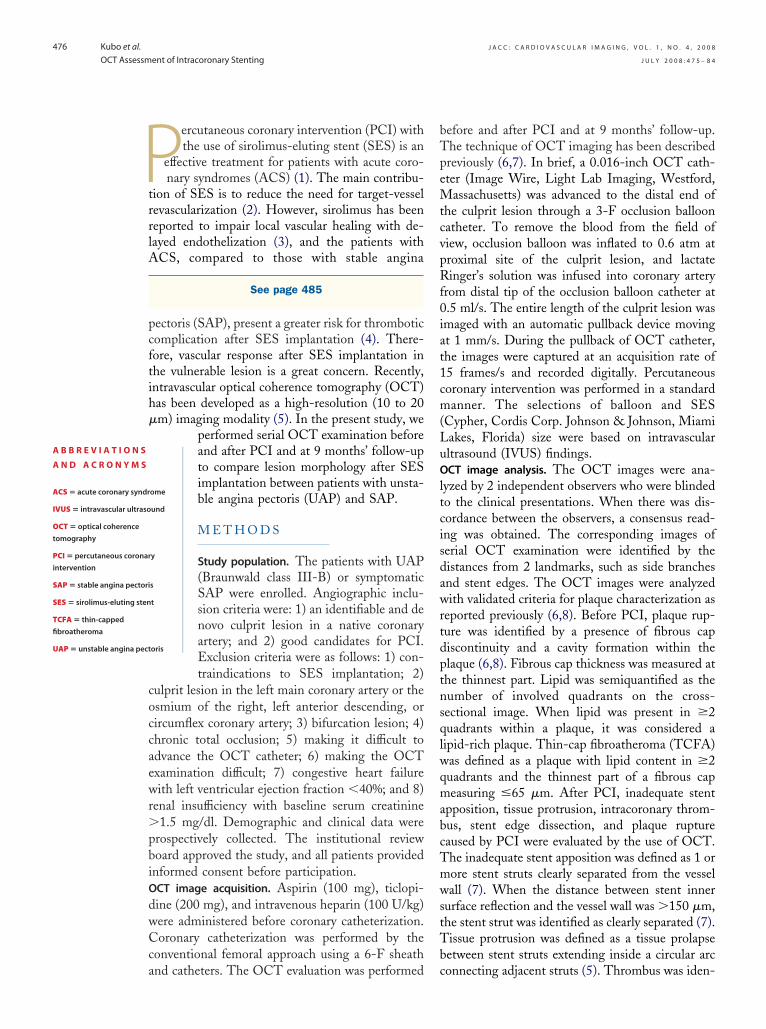
ercutaneous coronary intervention (PCI) withthe use of sirolimus-eluting stent (SES) is an
effective treatment for patients with acute coro-nary syndromes (ACS) (1). The main contribu-
ion of SES is to reduce the need for target-vesselevascularization (2). However, sirolimus has beeneported to impair local vascular healing with de-ayed endothelization (3), and the patients withCS, compared to those with stable angina
See page 485
ectoris (SAP), present a greater risk for thromboticomplication after SES implantation (4). There-ore, vascular response after SES implantation inhe vulnerable lesion is a great concern. Recently,ntravascular optical coherence tomography (OCT)as been developed as a high-resolution (10 to 20m) imaging modality (5). In the present study, we
performed serial OCT examination beforeand after PCI and at 9 months’ follow-upto compare lesion morphology after SESimplantation between patients with unsta-ble angina pectoris (UAP) and SAP.
M E T H O D S
Study population. The patients with UAP(Braunwald class III-B) or symptomaticSAP were enrolled. Angiographic inclu-sion criteria were: 1) an identifiable and denovo culprit lesion in a native coronaryartery; and 2) good candidates for PCI.Exclusion criteria were as follows: 1) con-traindications to SES implantation; 2)
ulprit lesion in the left main coronary artery or thesmium of the right, left anterior descending, orircumflex coronary artery; 3) bifurcation lesion; 4)hronic total occlusion; 5) making it difficult todvance the OCT catheter; 6) making the OCTxamination difficult; 7) congestive heart failureith left ventricular ejection fraction �40%; and 8)
enal insufficiency with baseline serum creatinine1.5 mg/dl. Demographic and clinical data were
rospectively collected. The institutional reviewoard approved the study, and all patients providednformed consent before participation.CT image acquisition. Aspirin (100 mg), ticlopi-ine (200 mg), and intravenous heparin (100 U/kg)ere administered before coronary catheterization.oronary catheterization was performed by the
onventional femoral approach using a 6-F sheath
ome
und
y
s
t
oris
nd catheters. The OCT evaluation was performed c
efore and after PCI and at 9 months’ follow-up.he technique of OCT imaging has been describedreviously (6,7). In brief, a 0.016-inch OCT cath-ter (Image Wire, Light Lab Imaging, Westford,
assachusetts) was advanced to the distal end ofhe culprit lesion through a 3-F occlusion balloonatheter. To remove the blood from the field ofiew, occlusion balloon was inflated to 0.6 atm atroximal site of the culprit lesion, and lactateinger’s solution was infused into coronary artery
rom distal tip of the occlusion balloon catheter at.5 ml/s. The entire length of the culprit lesion wasmaged with an automatic pullback device movingt 1 mm/s. During the pullback of OCT catheter,he images were captured at an acquisition rate of5 frames/s and recorded digitally. Percutaneousoronary intervention was performed in a standardanner. The selections of balloon and SES
Cypher, Cordis Corp. Johnson & Johnson, Miamiakes, Florida) size were based on intravascularltrasound (IVUS) findings.CT image analysis. The OCT images were ana-
yzed by 2 independent observers who were blindedo the clinical presentations. When there was dis-ordance between the observers, a consensus read-ng was obtained. The corresponding images oferial OCT examination were identified by theistances from 2 landmarks, such as side branchesnd stent edges. The OCT images were analyzedith validated criteria for plaque characterization as
eported previously (6,8). Before PCI, plaque rup-ure was identified by a presence of fibrous capiscontinuity and a cavity formation within thelaque (6,8). Fibrous cap thickness was measured athe thinnest part. Lipid was semiquantified as theumber of involved quadrants on the cross-ectional image. When lipid was present in �2uadrants within a plaque, it was considered aipid-rich plaque. Thin-cap fibroatheroma (TCFA)as defined as a plaque with lipid content in �2uadrants and the thinnest part of a fibrous capeasuring �65 �m. After PCI, inadequate stent
pposition, tissue protrusion, intracoronary throm-us, stent edge dissection, and plaque ruptureaused by PCI were evaluated by the use of OCT.he inadequate stent apposition was defined as 1 orore stent struts clearly separated from the vesselall (7). When the distance between stent inner
urface reflection and the vessel wall was �150 �m,he stent strut was identified as clearly separated (7).issue protrusion was defined as a tissue prolapseetween stent struts extending inside a circular arc
B B R E V I A T I O N S
N D A C R O N YM S
CS � acute coronary syndr
VUS � intravascular ultraso
CT � optical coherence
omography
CI � percutaneous coronar
ntervention
AP � stable angina pectori
ES � sirolimus-eluting sten
CFA � thin-capped
broatheroma
onnecting adjacent struts (5). Thrombus was iden-

ttsttd
wtscwm
ntFtwaewIsI4s
I �
J A C C : C A R D I O V A S C U L A R I M A G I N G , V O L . 1 , N O . 4 , 2 0 0 8
J U L Y 2 0 0 8 : 4 7 5 – 8 4
Kubo et al.
OCT Assessment of Intracoronary Stenting
477
ified as an intraluminal mass discontinuing fromhe surface of the vessel wall that had a signal-freehadow in the OCT image (9). Stent edge dissec-ion was defined as arterial disruption adjacent tohe stent where a flap of tissue could be clearlyifferentiated from the underlying plaque (5).Representative OCT images obtained after PCI
ere shown in Figure 1. At 9 months’ follow-up,he stent struts were assessed every 1 mm within thetented segment and classified into 1 of the 3ategories (Fig. 2) as reported previously (7): 1)ell-apposed to vessel wall with apparent neointi-al coverage; 2) well-apposed to vessel wall without
Figure 1. Representative OCT Images of Stented Lesions After P
(A-1) OCT-visualized inadequate stent strut apposition (arrows). (A-stent struts was observed in OCT image (arrow). (B-2) It was not evas intraluminal mass images with signal-free shadow by OCT (arrowat the site of stent edge was demonstrated by OCT (arrows). (D-2)intravascular ultrasound; OCT � optical coherence tomography; PC
Figure 2. Representative OCT Images of SES at 9 Months’ Follow
(A-1, A-2) OCT-visualized stent struts and neointimal hyperplasia clegories. (B-2) The strut was well-apposed to vessel wall and coverednot covered by neointima. (B-4) The struts were inadequately appo
coherence tomography; SES � sirolimus-eluting stent.eointimal coverage; and 3) inadequately apposedo the vessel wall without neointimal coverage.urthermore, residual ruptured plaque defined by
he persistence of core cavity in the stented segmentas evaluated (Fig. 3). The areas of stent, lumen,
nd neointimal hyperplasia were also measuredvery 1 mm within the stented segment; volumesere calculated with the use of Simpson’s rule.
nterobserver and intraobserver variabilities were as-essed by the evaluation of all images.VUS image analysis. IVUS (Atlantis SR Pro 2.5F,0-MHz, Boston Scientific, Natick, Massachu-etts) examination was performed with an auto-
nd Corresponding IVUS Images
was not shown clearly on IVUS. (B-1) Tissue protrusion betweent in the IVUS image. (C-1) Intracoronary thrombi were identifiedC-2) They were not detected by IVUS. (D-1) Coronary dissectiondocumented dissection (5 o’clock) and clot (2 o’clock). IVUS �
percutaneous coronary intervention.
p
. (B-1) Each stent strut was classified into one of the three cate-neointima. (B-3) The struts were well-apposed to vessel wall andto vessel wall and not covered by neointima. OCT � optical
CI a
2) Itidens). (IVUS
-U
arlybysed

mciawACsttilwQtCMNmllepiA1mCameSiou
tctwr
R
Suefie5tSmOeUPblpmcp(iopOs
rcuta
J A C C : C A R D I O V A S C U L A R I M A G I N G , V O L . 1 , N O . 4 , 2 0 0 8
J U L Y 2 0 0 8 : 4 7 5 – 8 4
Kubo et al.
OCT Assessment of Intracoronary Stenting
478
atic pullback device at a rate of 0.5 mm/s. Theorresponding images of OCT and IVUS weredentified by the distances from 2 landmarks, suchs side branches and stent edges. The IVUS analysisas performed according to the criteria of themerican College of Cardiology Clinical Expertonsensus document on IVUS (10). Inadequate
tent apposition, tissue protrusion, intracoronaryhrombus, and stent edge dissection were noted inhe qualitative analysis. Quantitative measurementsncluded vessel area, lumen area, plaque area, lesionength, and remodeling index. Positive remodelingas defined as a remodeling index �1.0.uantitative coronary angiographic analysis. Quanti-
ative coronary angiography was conducted with theardiovascular Measurement System (CMS-EDIS Medical Imaging System, Leiden, theetherlands). The reference diameter, minimal lu-inal diameter, and diameter stenosis were calcu-
ated by an independent operator. In addition, lateumen loss was calculated both in-stent and in thentire analysis segment, also including the 5-mmroximal and distal stent margins (also calledn-segment).ntiplatelet regimen and clinical follow-up. Aspirin00 mg/day and ticlopidine 200 mg/day were ad-inistrated in all patients during follow-up period.linical status was assessed at hospital discharge
nd every month after the procedure. The 9onths’ follow-up was an office visit together with
xercise electrocardiogram testing.tatistical analysis. Categorical data are presented asncidences and compared with chi-square statisticsr the Fisher exact test. The Fisher exact test was
Figure 3. Serial OCT Images of the Culprit Lesion in UAP Before
(A) OCT demonstrated the lipid-core (LC) with calcium (Ca) before PThe plaque was ruptured by PCI (*). Stent struts were not well-appobserved (9 o’clock). (C) At 9 months’ follow-up, OCT showed persistenneointimal coverage. OCT � optical coherence tomography; PCI � pe
sed if there was an expected cell value �5. Con- v
inuous variables are presented as mean � SD andompared with the use of an unpaired or paired test. Intraobserver and interobserver variabilitiesere measured by � test of concordance. All analysis
equired a p � 0.05 for statistical significance.
E S U L T S
tudy patients. A total of 70 patients were consec-tively enrolled in the study. Fifteen patients werexcluded because the OCT imaging was not per-ormed according to exclusion criteria (n � 12), themage quality precluded analysis (n � 2), or thequipment malfunctioned (n � 1). In the remaining5 patients with successful OCT imaging, 24 pa-ients presented with UAP, and 31 patients withAP. Mean follow-up period was 9.2 � 0.9onths. Ten patients refused the angiographic andCT follow-up. Therefore, the follow-up OCT
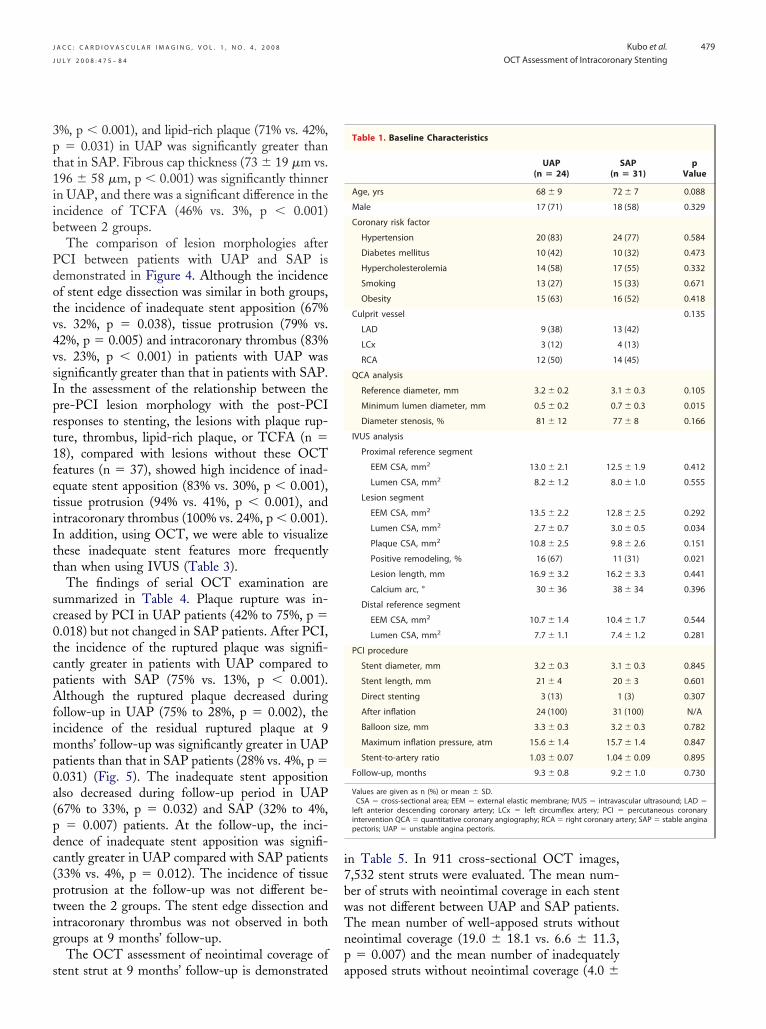
xamination was performed in 18 patients withAP and 27 patients with SAP.atient characteristics. Patient characteristics ataseline are demonstrated in Table 1. Minimumumen diameter (0.5 � 0.2 mm vs. 0.7 � 0.3 mm,
� 0.015) and minimum lumen area (2.7 � 0.7m2 vs. 3.0 � 0.5 mm2, p � 0.034) were signifi-
antly smaller in UAP patients compared with SAPatients. The incidence of positive remodeling67% vs. 31%, p � 0.021) was significantly greatern UAP patients. Coronary risk factors, distributionsf the culprit vessel, and PCI procedures were com-arable between the 2 groups.CT findings. The OCT findings before PCI are
hown in Table 2. Incidence of plaque rupture (42%
I, After PCI, and at 9 Months’ Follow-Up
Fibrous cap was disrupted (arrow) at the tiniest part (30 �m). (B)to the core cavity and vessel wall. Intracoronary thrombus wasf core cavity (**) and inadequately-apposed stent struts withoutneous coronary intervention; UAP � unstable angina pectoris.
PC
CI.osedce o
s. 3%, p � 0.001), intracoronary thrombus (67% vs.
3pt1iib
Pdotv4vsIprt1fetiItt
sc0tcpAfimp0a(pdc(ptig
s
i7bwTnp
J A C C : C A R D I O V A S C U L A R I M A G I N G , V O L . 1 , N O . 4 , 2 0 0 8
J U L Y 2 0 0 8 : 4 7 5 – 8 4
Kubo et al.
OCT Assessment of Intracoronary Stenting
479
%, p � 0.001), and lipid-rich plaque (71% vs. 42%,� 0.031) in UAP was significantly greater than
hat in SAP. Fibrous cap thickness (73 � 19 �m vs.96 � 58 �m, p � 0.001) was significantly thinnern UAP, and there was a significant difference in thencidence of TCFA (46% vs. 3%, p � 0.001)etween 2 groups.The comparison of lesion morphologies after
CI between patients with UAP and SAP isemonstrated in Figure 4. Although the incidencef stent edge dissection was similar in both groups,he incidence of inadequate stent apposition (67%s. 32%, p � 0.038), tissue protrusion (79% vs.2%, p � 0.005) and intracoronary thrombus (83%s. 23%, p � 0.001) in patients with UAP wasignificantly greater than that in patients with SAP.n the assessment of the relationship between there-PCI lesion morphology with the post-PCIesponses to stenting, the lesions with plaque rup-ure, thrombus, lipid-rich plaque, or TCFA (n �8), compared with lesions without these OCTeatures (n � 37), showed high incidence of inad-quate stent apposition (83% vs. 30%, p � 0.001),issue protrusion (94% vs. 41%, p � 0.001), andntracoronary thrombus (100% vs. 24%, p � 0.001).n addition, using OCT, we were able to visualizehese inadequate stent features more frequentlyhan when using IVUS (Table 3).
The findings of serial OCT examination areummarized in Table 4. Plaque rupture was in-reased by PCI in UAP patients (42% to 75%, p �.018) but not changed in SAP patients. After PCI,he incidence of the ruptured plaque was signifi-antly greater in patients with UAP compared toatients with SAP (75% vs. 13%, p � 0.001).lthough the ruptured plaque decreased during
ollow-up in UAP (75% to 28%, p � 0.002), thencidence of the residual ruptured plaque at 9
onths’ follow-up was significantly greater in UAPatients than that in SAP patients (28% vs. 4%, p �.031) (Fig. 5). The inadequate stent appositionlso decreased during follow-up period in UAP67% to 33%, p � 0.032) and SAP (32% to 4%,
� 0.007) patients. At the follow-up, the inci-ence of inadequate stent apposition was signifi-antly greater in UAP compared with SAP patients33% vs. 4%, p � 0.012). The incidence of tissuerotrusion at the follow-up was not different be-ween the 2 groups. The stent edge dissection andntracoronary thrombus was not observed in bothroups at 9 months’ follow-up.
The OCT assessment of neointimal coverage of
tent strut at 9 months’ follow-up is demonstrated an Table 5. In 911 cross-sectional OCT images,,532 stent struts were evaluated. The mean num-er of struts with neointimal coverage in each stentas not different between UAP and SAP patients.he mean number of well-apposed struts withouteointimal coverage (19.0 � 18.1 vs. 6.6 � 11.3,� 0.007) and the mean number of inadequately
Table 1. Baseline Characteristics
UAP(n � 24) (n
Age, yrs 68 � 9 72
Male 17 (71) 18
Coronary risk factor
Hypertension 20 (83) 24
Diabetes mellitus 10 (42) 10
Hypercholesterolemia 14 (58) 17
Smoking 13 (27) 15
Obesity 15 (63) 16
Culprit vessel
LAD 9 (38) 13
LCx 3 (12) 4
RCA 12 (50) 14
QCA analysis
Reference diameter, mm 3.2 � 0.2 3.1
Minimum lumen diameter, mm 0.5 � 0.2 0.7
Diameter stenosis, % 81 � 12 77
IVUS analysis
Proximal reference segment
EEM CSA, mm2 13.0 � 2.1 12.5
Lumen CSA, mm2 8.2 � 1.2 8.0
Lesion segment
EEM CSA, mm2 13.5 � 2.2 12.8
Lumen CSA, mm2 2.7 � 0.7 3.0
Plaque CSA, mm2 10.8 � 2.5 9.8
Positive remodeling, % 16 (67) 11
Lesion length, mm 16.9 � 3.2 16.2
Calcium arc, ° 30 � 36 38
Distal reference segment
EEM CSA, mm2 10.7 � 1.4 10.4
Lumen CSA, mm2 7.7 � 1.1 7.4
PCI procedure
Stent diameter, mm 3.2 � 0.3 3.1
Stent length, mm 21 � 4 20
Direct stenting 3 (13) 1
After inflation 24 (100) 31
Balloon size, mm 3.3 � 0.3 3.2
Maximum inflation pressure, atm 15.6 � 1.4 15.7
Stent-to-artery ratio 1.03 � 0.07 1.04
Follow-up, months 9.3 � 0.8 9.2
Values are given as n (%) or mean � SD.CSA � cross-sectional area; EEM � external elastic membrane; IVUS � intravaleft anterior descending coronary artery; LCx � left circumflex artery; PCI �intervention QCA � quantitative coronary angiography; RCA � right coronary arpectoris; UAP � unstable angina pectoris.
SAP� 31)
pValue
� 7 0.088
(58) 0.329
(77) 0.584
(32) 0.473
(55) 0.332
(33) 0.671
(52) 0.418
0.135
(42)
(13)
(45)
� 0.3 0.105
� 0.3 0.015
� 8 0.166
� 1.9 0.412
� 1.0 0.555
� 2.5 0.292
� 0.5 0.034
� 2.6 0.151
(31) 0.021
� 3.3 0.441
� 34 0.396
� 1.7 0.544
� 1.2 0.281
� 0.3 0.845
� 3 0.601
(3) 0.307
(100) N/A
� 0.3 0.782
� 1.4 0.847
� 0.09 0.895
� 1.0 0.730
scular ultrasound; LAD �percutaneous coronary
tery; SAP � stable angina
pposed struts without neointimal coverage (4.0 �

6gtu�nptfwUu(Sf
iFCcdtdpeFoaa�d000bIsip�rvip�r
D
TraarptabssPUmUoestion; SAP � stable ang
tions as in T
J A C C : C A R D I O V A S C U L A R I M A G I N G , V O L . 1 , N O . 4 , 2 0 0 8
J U L Y 2 0 0 8 : 4 7 5 – 8 4
Kubo et al.
OCT Assessment of Intracoronary Stenting
480
.7 vs. 0.2 � 1.2, p � 0.006) were significantlyreater in UAP patients compared with SAP pa-ients. In quantitative OCT analysis, percent vol-me of neointimal hyperplasia (10.9 � 3.0 vs. 13.8
4.5, p � 0.025) and percent mean area ofeointimal hyperplasia (10.9 � 3.0 vs. 13.6 � 4.1,� 0.029) were significantly smaller in UAP than
hose in SAP (Table 6). The incidence of SESeaturing full coverage of every strut by neointimaas significantly lower (28% vs. 63%, p � 0.019) inAP, and the incidence of SES containing partiallyncovered strut lesions was significantly greater72% vs. 37%, p � 0.019) in UAP compared withAP patients. The changes of the lesion findingsrom pre- to post-PCI to 9 months after SES
quate Stentposition
TissueProtrusion
Intracoronary Thrombus
Stent EdgeDissection
UAP
SAP
quate Stentposition
TissueProtrusion
Intracoronary Thrombus
Stent EdgeDissection
UAP
SAP
US Findings After PCI in UAP and SAP Patients
, although the incidence of stent edge dissection was not differ-SAP, the incidence of inadequate stent apposition (*p � 0.038),0.005) and intracoronary thrombus (‡p � 0.001) in UAP was sig-
that in SAP. (B) In the IVUS analysis, the incidence of inadequateenting was similar in both groups. IVUS � intravascular ultra-coherence tomography; PCI � percutaneous coronary interven-
CT Findings Before PCI in UAP and SAP Patients
UAP (n � 24) SAP (n � 31) p Value
ture 10 (42) 1 (3) �0.001
16 (67) 1 (3) �0.001
plaque 17 (71) 13 (42) 0.031
p thickness, �m 73 � 19 196 � 58 �0.001
11 (46) 1 (3) �0.001
iven as n (%) or mean � SD.tical coherence tomography; TCFA � thin-cap fibroatheroma; other abbrevia-able 1.
pina pectoris; UAP � unstable angina pectoris.
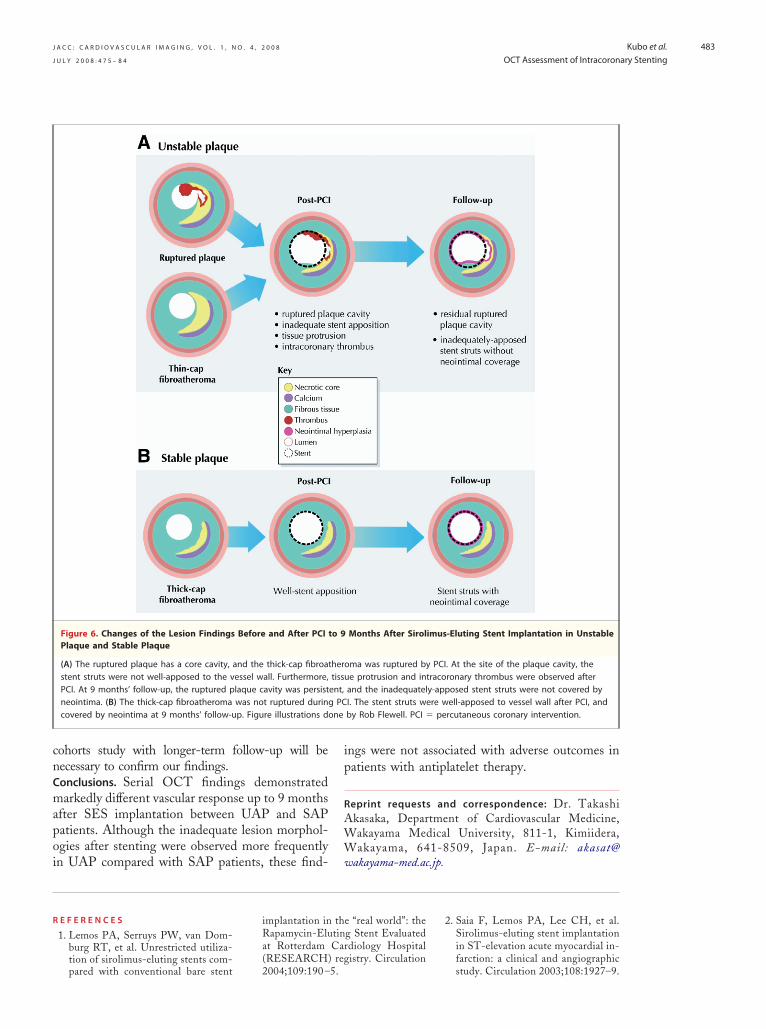
mplantation in UAP and SAP are diagramed inigure 6.linical and angiographical outcomes. PCI was suc-essful in all patients. No complications occurreduring OCT imaging. All patients took aspirin andiclopidine during the follow-up period, and theyid not have any adverse coronary events. None ofatients had an evidence of ischemia in the exerciselectrocardiogram testing at 9 months’ follow-up.urthermore, none of patients with follow-up cor-nary catheterization had angiographic restenosisnd target vessel revascularization. In the follow-upngiography, in-stent percent diameter stenosis (6.4
3.3% vs. 6.8 � 3.9%, p � 0.765), in-segment %iameter stenosis (7.2 � 2.8% vs. 7.4 � 3.6%, p �.813), in-stent late loss (0.13 � 0.33 vs. 0.14 �.32, p � 0.957) and in-segment late loss (0.15 �.35 vs. 0.14 � 0.34, p � 0.935) were not differentetween UAP and SAP patients.ntraobserver and interobserver variability. Intraob-erver variability yielded acceptable concordance fornadequate stent apposition (� � 0.90), tissuerotrusion (� � 0.92), intracoronary thrombus (�
0.94), stent edge dissection (� � 0.96), andesidual ruptured plaque (� � 0.92). Interobserverariability showed relatively lower concordance fornadequate stent apposition (� � 0.75), tissuerotrusion (� � 0.86), intracoronary thrombus (�
0.87), stent edge dissection (� � 0.89), andesidual ruptured plaque (� � 0.86).
I S C U S S I O N
his is the first OCT study to compare vascularesponses after SES implantation between UAPnd SAP patients. The major findings of ournalysis are as follows: 1) The incidence of plaqueupture, intracoronary thrombus, and TCFA inatients with UAP was significantly greater thanhat in patients with SAP. 2) Although the stentnd procedural characteristics were not differentetween the 2 groups, the incidence of inadequatetent apposition and tissue protrusion after PCI wasignificantly greater in patients with UAP. 3)laque rupture was significantly increased by PCI inAP patients, and the residual ruptured plaque at 9onths’ follow-up was observed more frequently inAP compared to SAP patients. 4) The incidencef inadequately-apposed stent and partially uncov-red stent by neointima at 9 months’ follow-up wasignificantly greater in UAP compared to SAP
(%)
InadeAp
0
20
40
60
80
100A
(%)
InadeAp
0
20
40
60
80
100B
Figure 4. OCT and IV
(A) In the OCT analysisent between UAP andtissue protrusion (†p �
nificantly higher thanlesion findings after stsound; OCT � optical
Table 2. O
Plaque rup
Thrombus
Lipid-rich
Fibrous ca
TCFA
Values are gOCT � op
atients. 5) These OCT findings were not associ-

aaIaisocpdOtw(owtapdaqmdAcmsaibbpiaBps2afiritoSctthddI
Abbreviations as in Tables 1 and 2.
Abbreviations as in Tables 1 and 2.
J A C C : C A R D I O V A S C U L A R I M A G I N G , V O L . 1 , N O . 4 , 2 0 0 8
J U L Y 2 0 0 8 : 4 7 5 – 8 4
Kubo et al.
OCT Assessment of Intracoronary Stenting
481
ted with adverse outcomes in patients with strictntiplatelet therapy during 9 months’ follow-up.dentification of vulnerable plaque by OCT. Vulner-ble plaques constitute direct precursor lesions giv-ng rise to coronary thrombosis. An autopsy studyuggested that plaque rupture accounted for �60%f all intracoronary thrombi associated with suddenardiac death (11). For plaque rupture, the mor-hology resembling vulnerable plaque has beenescribed as TCFA. Recently, we reported thatCT allowed us to detect the fibrous cap disrup-
ion in 73% of acute myocardial infarction, whichas similar to that in pathohistological examination
6). Jang et al. (8) demonstrated a greater prevalencef TCFA in patients with ACS (55%) comparedith SAP (18%). The present OCT study showed
hat the frequency of intracoronary thrombus waslso greater in UAP patients than that in SAPatients. These OCT findings supported our un-erstanding of the pathophysiology of coronaryrtery disease. Although OCT is limited in theuantification of lipid-core, it might be a usefulodality to evaluate the intrinsic features that
etermine plaque vulnerability in vivo.ssessment of coronary stenting with OCT. Intravas-ular ultrasound is the gold standard for the assess-ent of coronary intervention. Cheneau et al. (12)
howed that the post-intervention IVUS identifiedt least one of the abnormal findings, such asnadequate stent apposition, dissection, or throm-us, in 78% of patients with subacute stent throm-osis and identified multiple findings in 48% of theatients. Considering the high resolution of OCT,t is not surprising to observe an increased frequencynd detail in the detection of small stent features.ouma et al. (5) demonstrated that OCT, com-ared with IVUS, detected inadequate stent appo-ition (17% vs. 7%), tissue protrusion (69% vs.9%), and dissection (19% vs. 5%) more frequentlyfter stent implantation. However, these subtlendings by OCT may not be clinically relevantegardless of clinical presentation, lesion character-stics or stent type. The quantification or grading ofhe findings may be important to predict lesionutcomes after PCI.ES implantation in the vulnerable lesion. The pivotallinical registry demonstrated that the SES implan-ation were useful and safe in ACS (1). However,he ACS patients, compared to SAP patients, stillave a greater risk for in-stent thrombosis, and thisreaded complication remains a major cause ofeath and morbidity (4). On the basis of the reliable
VUS reports, the large ulceration of the ruptured(%)
Pre-PCI (UAP=24, SAP=31)
Post-PCI(UAP=24, SAP=31)
9-M follow-up(UAP=18, SAP=27)
0
20
40
UAP
60
80
100
SAP
Figure 5. Incidence of the Ruptured Plaque Assessed With OCT Before and After PCIand at 9 Months’ Follow-Up in UAP and SAP Patients
Ruptured plaque in UAP was increased by PCI (*p � 0.05), and decreased during 9months’ follow-up (†p � 0.005). In SAP, it was not changed after PCI and during follow-up. The incidence of the ruptured plaque was significantly greater in UAP than that in
Table 3. OCT and IVUS Findings for Corresponding Images After PCI
OCT (n � 55) IVUS (n � 55) p Value
Inadequate stent apposition 26 (47) 10 (18) �0.001
Tissue protrusion 32 (58) 11 (20) �0.001
Thrombus 27 (49) 5 (9) �0.001
Stent edge dissection 22 (40) 9 (16) 0.005
Values are given as n (%).
Table 4. Serial OCT Analysis
Before PCI After PCI9 Months’Follow-Up
UAP
No. of lesions 24 24 18
Plaque rupture 10 (42) 18 (75)* 5 (28)*
Thrombus 16 (67) 20 (83)* 0 (0)
Inadequate stent apposition — 16 (67)* 6 (33)*
Tissue protrusion — 19 (79)* 1 (6)
Stent edge dissection — 9 (38) 0 (0)
SAP
No. of lesions 31 31 27
Plaque rupture 1 (3) 4 (13) 1 (4)
Thrombus 1 (3) 7 (23) 0 (0)
Inadequate stent apposition — 10 (32) 1 (4)
Tissue protrusion — 13 (42) 2 (7)
Stent edge dissection — 13 (42) 0 (0)
Values are given as n (%). *p � 0.05 vs. SAP.
SAP before and after PCI and 9 months’ follow-up (‡p � 0.05).

ptrsto(gsonAtaTtesqpaaso
sthnptmcoooStpfwflTciwtO
J A C C : C A R D I O V A S C U L A R I M A G I N G , V O L . 1 , N O . 4 , 2 0 0 8
J U L Y 2 0 0 8 : 4 7 5 – 8 4
Kubo et al.
OCT Assessment of Intracoronary Stenting
482
laque might result in stent malapposition (12), andhe soft plaque composition was thought to be highisk for tissue protrusion (13). A pathohistologicaltudy also demonstrated that breaching and pene-ration of a necrotic core might lead to the exposuref thrombogenic lipid content to flowing blood14). Furthermore, the recent clinical studies sug-ested that SES could delay vascular healing. Mat-umoto et al. (7) showed by OCT that almost 10%f the individual stent struts were not covered byeointima at 6 months after SES implantation.wata et al. (15) demonstrated the presence of
hrombi and yellow plaques even as much as 2 yearsfter SES implantation by coronary angioscopy.hese features can potentially increase the risk of
hrombotic complications after SES implantation,specially in patients with ACS. The present OCTtudy demonstrated a greater incidence of inade-uate stented lesion findings in UAP patients com-ared with SAP patients after SES implantationnd 9 months’ follow-up. These findings were notssociated with adverse outcomes in patients withtrict antiplatelet therapy. However, the withdrawalf antiplatelet therapy has been reported to be a
Table 5. OCT Assessment for Neointimal Coverage of Stent Stru
UAP (n
No. of struts with neointimal coverage 145.2 �
No. struts without neointimal coverage
Well-apposed struts 19.0 �
Inadequately-apposed struts 4.0 �
Values are given as mean � SD.Abbreviations as in Tables 1 and 2.
Table 6. Quantitative OCT Analysis in Stented Segments After P
UAP (n
After PCI
Stent volume, mm3 224.4 �
Lumen volume, mm3 222.8 �
Mean stent area, mm2 10.5 �
Mean lumen area, mm2 10.4 �
9 month’s follow-up
Stent volume, mm3 209.7 �
Lumen volume, mm3 187.0 �
Intimal hyperplasia volume, mm3 22.6 �
% intimal hyperplasia volume, % 10.9 �
Mean stent area, mm2 10.0 �
Mean lumen area, mm2 8.9 �
Mean intimal hyperplasia area, mm2 1.1 �
% intimal hyperplasia area, % 10.9 �
Values are given as mean � SD.
Abbreviations as in Tables 1 and 2.ignificant risk factor for stent thrombosis in pa-ients with SES implantation (16). The poorlyealed sites of SES implantation may pose a sig-ificant risk for coronary thrombosis when anti-latelet therapy is abruptly discontinued. In addition,he vascular responses to SES versus bare-metal stentsay differ according to clinical presentation or lesion
haracteristics. However, because the present studynly included the lesions treated with SES, thesebservations can not be extrapolated to lesions in UAPr SAP patients treated with bare-metal stents.tudy limitations. There were several limitations inhe present study. First, an inherent limitation of theresent OCT system is need to remove the bloodrom the field of view for clear image acquisition,hich was achieved through lactate Ringer’s solutionushes during coronary occlusion by balloon catheter.herefore, it was not able to observe ostial lesions of
oronary artery. Second, a further limitation of OCTs the relatively shallow axial penetration. The vesselsith reference diameter of �4 mm were excluded in
his study. Third, the present study was a single-centerCT examination with a small sample size. Larger
t 9 Months’ Follow-Up in UAP and SAP Patients
8) SAP (n � 27) p Value
.5 160.0 � 35.1 0.189
.1 6.6 � 11.3 0.007
0.2 � 1.2 0.006
nd at 9 Months’ Follow-Up in UAP and SAP Patients
8) SAP (n �2 7) p Value
.4 199.4 � 48.7 0.121
.1 197.8 � 48.5 0.118
9.8 � 1.8 0.172
9.7 � 1.8 0.167
.2 189.3 � 44.5 0.184
.2 164.0 � 42.4 0.108
24.7 � 7.2 0.357
13.8 � 4.5 0.025
9.1 � 1.7 0.086
8.0 � 1.7 0.060
1.1 � 0.3 0.571
13.6 � 4.1 0.029
ts a
� 1
38
18
6.7
CI a
� 1
56
56
1.6
1.6
56
51
7.1
3.0
1.5
1.4
0.3
3.0
cnCmapoi
ip
R
AWW
R
ne
J A C C : C A R D I O V A S C U L A R I M A G I N G , V O L . 1 , N O . 4 , 2 0 0 8
J U L Y 2 0 0 8 : 4 7 5 – 8 4
Kubo et al.
OCT Assessment of Intracoronary Stenting
483
ohorts study with longer-term follow-up will beecessary to confirm our findings.onclusions. Serial OCT findings demonstratedarkedly different vascular response up to 9 months
fter SES implantation between UAP and SAPatients. Although the inadequate lesion morphol-gies after stenting were observed more frequently
Figure 6. Changes of the Lesion Findings Before and After PCIPlaque and Stable Plaque
(A) The ruptured plaque has a core cavity, and the thick-cap fibroatstent struts were not well-apposed to the vessel wall. Furthermore,PCI. At 9 months’ follow-up, the ruptured plaque cavity was persistneointima. (B) The thick-cap fibroatheroma was not ruptured duringcovered by neointima at 9 months’ follow-up. Figure illustrations do
tion of sirolimus-eluting stents com-pared with conventional bare stent 2004;109:190 –5.
ngs were not associated with adverse outcomes inatients with antiplatelet therapy.
eprint requests and correspondence: Dr. Takashikasaka, Department of Cardiovascular Medicine,akayama Medical University, 811-1, Kimiidera,akayama, 641-8509, Japan. E-mail: akasat@
Months After Sirolimus-Eluting Stent Implantation in Unstable
ma was ruptured by PCI. At the site of the plaque cavity, thee protrusion and intracoronary thrombus were observed afterand the inadequately-apposed stent struts were not covered byI. The stent struts were well-apposed to vessel wall after PCI, andby Rob Flewell. PCI � percutaneous coronary intervention.
n UAP compared with SAP patients, these find- wakayama-med.ac.jp.
E F E R E N C E S
1. Lemos PA, Serruys PW, van Dom-burg RT, et al. Unrestricted utiliza-
implantation in the “real world”: theRapamycin-Eluting Stent Evaluatedat Rotterdam Cardiology Hospital(RESEARCH) registry. Circulation
2. Saia F, Lemos PA, Lee CH, et al.Sirolimus-eluting stent implantationin ST-elevation acute myocardial in-farction: a clinical and angiographic
to 9
herotissuent,PC
study. Circulation 2003;108:1927–9.

1
1
1
1
Ka
J A C C : C A R D I O V A S C U L A R I M A G I N G , V O L . 1 , N O . 4 , 2 0 0 8
J U L Y 2 0 0 8 : 4 7 5 – 8 4
Kubo et al.
OCT Assessment of Intracoronary Stenting
484
3. Virmani R, Farb A, Kolodgie FD.Histopathologic alterations after en-dovascular radiation and antiprolifera-tive stents: similarities and differences.Herz 2002;27:1–6.
4. Urban P, Gershlick AH, Guagliumi G,et al. Safety of coronary sirolimus-elutingstents in daily clinical practice: one-yearfollow-up of the e-Cypher registry. Cir-culation 2006;113:1434–41.
5. Bouma BE, Tearney GJ, YabushitaH, et al. Evaluation of intracoronarystenting by intravascular optical co-herence tomography. Heart 2003;89;317–20.
6. Kubo T, Imanishi T, Takarada S, etal. Assessment of culprit lesion mor-phology in acute myocardial in-farction: ability of optical coherencetomography compared with intra-vascular ultrasound and coronary an-gioscopy. J Am Coll Cardiol 2007;50:933–9.
7. Matsumoto D, Shite J, Shinke T, et al.Neointimal coverage of sirolimus-eluting stents at 6-month follow-up:evaluated by optical coherence tomog-
raphy. Eur Heart J 2007;28:961–7.8. Jang IK, Tearney GJ, MacNeill B, etal. In vivo characterization of coronaryatherosclerotic plaque by use of opticalcoherence tomography. Circulation2005;111:1551–5.
9. Kume T, Akasaka T, Kawamoto T, etal. Assessment of coronary arterialthrombus by optical coherence to-mography. Am J Cardiol 2006;97:1713–7.
10. Mintz GS, Nissen SE, AndersonWD, et al. American College of Car-diology Clinical Expert ConsensusDocument on Standards for Acquisi-tion, Measurement and Reporting ofIntravascular Ultrasound Studies(IVUS). A report of the American Col-lege of Cardiology Task Force on Clin-ical Expert Consensus Documents.J Am Coll Cardiol 2001;37:1478–92.
11. Virmani R, Kolodgie FD, Burke AP,et al. Lessons from sudden coronarydeath: a comprehensive morphologicalclassification scheme for atheroscle-rotic lesions. Arterioscler ThrombVasc Biol 2000;20:1262–75.
12. Cheneau E, Leborgne L, Mintz GS,
et al. Predictors of subacute stent cthrombosis. results of a systematic in-travascular ultrasound study. Circulation 2003;108;43–7.
3. Dumoulin C, Cochelin B. Mechanicalbehavior modeling of balloon-expandable stents. J Biomech 2000;33:1461–70.
4. Farb A, Sangiorgi G, Carter AJ, et al.Pathology of acute and chronic coro-nary stenting in humans. Circulation1999;99:44–52.
5. Awata M, Kotani J, Uematsu M, et al.Serial angioscopic evidence of incom-plete neointimal coverage aftersirolimus-eluting stent implantation:comparison with bare-metal stents.Circulation 2007;116:910–6.
6. Iakovou I, Schmidt T, Bonizzoni E, etal. Incidence, predictors, and outcomeof thrombosis after successful implan-tation of drug-eluting stents. JAMA2005;293:2126–30.
ey Words: coronary imaging ycute coronary syndrome y
oronary intervention.