comparison of various models for transport of binary mixtures
TRANSCRIPT
Comparison of various models for transport of binary mixtures
through dense polymer membrane
P. Izaka,*, L. Bartovskab, K. Friessb, M. Sıpekb, P. Uchytila
aInstitute of Chemical Process Fundamentals, Rozvojova 135, 165 02 Prague 6, Czech RepublicbThe Institute of Chemical Technology in Prague, Technicka 5, 166 28 Prague 6, Czech Republic
Received 2 October 2002; received in revised form 31 January 2003; accepted 5 February 2003
Abstract
The main aim of this work is the application of various models describing the transport of a penetrant during pervaporation process in the
membrane and their comparison.
We experimentally determined sorption isotherms of pure components, diffusion coefficients, non-ideal sorption of liquid binary mixture
in a membrane and the density of the membrane versus concentration composition. All mentioned dependencies were mathematically
described and then introduced into a Flory–Rehner equations, UNIFAP model and modified Maxwell–Stefan equations. Models were used
for description of the transport of liquid binary mixtures (pentan-1-ol, hexan-1-ol with toluene) through the low-density polyethylene
membrane at 25 8C. Calculated pervaporation fluxes and separation diagrams were compared with the results of the experiments.
q 2003 Elsevier Science Ltd. All rights reserved.
Keywords: Modified Maxwell-Stefan equations; Flory–Rehner equations; UNIFAP model
1. Introduction and theory review
1.1. Flory–Rehner equation
The Flory–Huggins equation is valid only for free
polymer chains in dilute solutions [1]. However, in case of
solid polymers we deal with polymer network structures or
semicrystalline polymers, in which solvent take-up is
restricted by the resulting strain in the amorphous polymer
chains. Their ends join either in crosslinkages or in
crystallites.
Flory and Rehner [2] modified the Flory–Huggins
equation and introduced an entropy term for elastic
deformation of polymer chains in a rubber-like network
structure. They applied an earlier work of Kuhn [3], who
derived a distribution function for the distance between the
ends of a polymer molecule. They assumed that the chain
displacement length is dilated during swelling by a factor of
w21=3M ; while the extension of the polymer phase is isotropic.
Flory [4] furthermore accounted for the degree of interlink-
ing of the polymer chains and finally obtained the following
equation for activity ai of component i :
ln ai ¼ lnpi
p0i
!
¼ lnð1 2 wMÞ þ wM þ xiw2M þ
VmirM
Mc
� w1=3M 2
1
2wM
� �ð1Þ
where pi is partial pressure of component i in gaseous
mixture, p0i is the pressure of saturated vapors, wM
1 is
volume fraction of polymer, Vmi is molar volume of the
penetrant i, rM is the density of the swollen polymer, xi is
Flory–Huggins interaction parameter, Mc is molar mass of
polymer chain between two network nodes or between two
crystallic domains in polymer. Parameters xi and Mc are
0032-3861/03/$ - see front matter q 2003 Elsevier Science Ltd. All rights reserved.
PII: S0 03 2 -3 86 1 (0 3) 00 1 37 -X
Polymer 44 (2003) 2679–2687
www.elsevier.com/locate/polymer
* Corresponding author. Tel.: þ420-2-96780268; fax: þ420-2-
20920661.
E-mail address: [email protected] (P. Izak).
1 The excessive free volume was neglected in calculation of volume
fraction of polymer wM:

calculated by Newton‘s iterative method from experimen-
tally obtained vapor sorption isotherms of pure component i:
1.2. UNIFAP model
Today we have already a lot of contribution methods [5]
that allow predicting the solubility of organic compound in a
polymer without any experiment. One of the best methods
that are able to describe the transport properties in the
membrane is UNIFAP model [6]. This model is based on
modified UNIFAC model for solutions, in which contri-
bution approach and free-volume theory are connected.
The UNIFAC model by Fredenslund [7] is based on the
assumption that molecules in the mixture can be split up into
functional groups (parameters of which are tabulated) and
their properties depend on the local composition of the
functional groups and that their interactions. The activity of
the penetrant i ai can be described as a sum of the activities
of each individual contribution:
ln ai ¼ ln aci þ ln avo
i þ ln ainti þ ln ael
i ð2Þ
where upper indexes c, vo, int and el mean: combinatory,
free-volume, interaction and elastic contributions. The first
three terms on the right side of Eq. (2) are identical with
Nomenclature
A membrane area (m2)
ai activity of component i
c molar concentration (mol m23)
D diffusion coefficient (m2 s21)
D0 diffusion coefficient at zero concentration (m2 s21)�DiM average diffusion coefficient of a pure component i in the active layer of a membrane (m2 s21)
h change in length of the quartz spring (m)
J pervaporation flux (g m22 h21)
k constant of the spiral quartz balance (g m21)
L membrane thickness (m)
Mi molar mass of the component i (g mol21)
MCi molar mass of polymer chain between two network nodes in polymer (g mol21)
m mass of the swelled foil (kg)
mo mass of the dry polymer foil (kg)
mt mass uptake at time t (kg)
m1 mass uptake at equilibrium (kg)
pi partial pressure of component i in gaseous mixture (Pa)
p0i pressure of saturated vapors at temperature 25 8C (Pa)
Qe equilibrium swelling degree { ¼ ðm 2 moÞ=mo}
R universal gas constant (Pa m3 mol21 K21)
T absolute temperature (K)
Vmi molar volume of the component i (m3 mol21)
w1F weight fraction of the faster permeant 1 in the feed
w2P weight fraction of the slower permeant 2 in the permeate
w01 weight fractions of components 1 in a membrane
xoi mole fraction of the component i before sorption
xi mole fraction of the component i in the equilibrium bulk liquid
Dxi ¼ xoi 2 xi experimentally determined change of solution concentration caused by the sorption
Greek letters
a separation factor
dM thickness of the membrane (m)
mi chemical potential of component i
vj local velocities of the components (m s21)
rA density of an amorphous phase of the dry membrane (kg m23)
�rM mean density of the swollen membrane (kg m23)
Fj volume fraction of component j
f crystallinity of the membrane
xi Flory–Huggins interaction parameter
ViðxiÞ preferential sorption as a function of the bulk liquid composition
wM volume fraction of membrane
P. Izak et al. / Polymer 44 (2003) 2679–26872680
UNIFAC-FV model by Oishi and Prausnitz [8], the last term
includes the influence of the crystallinity of the polymer
material. It is assumed that the sorption takes place in an
amorphous region only. The resultant form of the modified
UNIFAP model used in that work for fitting the experimen-
tal values can be written [9,10]:
ln ai ¼ lnpi
p0i
!
¼ lnð1 2 wMÞ þ wM þ xw2M þ
rAMi
rMMc
� �w1=3
M ð3Þ
where rA is the density of an amorphous phase of the dry
membrane.
The pervaporation flux of component i can be then
calculated from activity of each component by Eq. (4):
Ji ¼ 2Diwi
d ln ai
dzð4Þ
1.3. Modified Maxwell–Stefan equations
The transport of components through a polymer during
pervaporation is affected by many collisions among
molecules. Therefore, it may be expected that the molecule
i will during its movement through polymer experience a
friction force resulting from combined interactions of all
locally surrounding molecules [1].
Accordingly, the friction coefficient depends on the size
and the shape of molecule i and on average frictional
property of the local mixture. Based on this principle, the
modified Maxwell–Stefan equation can be derived [1]:
dmi
dz¼Xn
j¼1
xjðvj 2 viÞRT
D0ji
ð5Þ
where mi is the chemical potential of component i; dmi=dz is
the gradient of the chemical potential of component i; xj
are the mole fractions of the components j ¼ 1; 2;…; n; vj
are the local velocities of the components j; RT =D0ji has the
meaning of a friction coefficient accounting for the
frictional effect exerted by component j on component i:
The modified Maxwell–Stefan approach is for three
components (binary liquid and membrane) in pervaporation
process well described by Heintz [11]. We can introduce
diffusive mass fluxes Ji ¼ rivi and weight fraction of
component i in a membrane w0i instead of molar fractions
xi in Eq. (5) and we can also assume Dij ¼ Dji: The
following approximation, which for two permeating com-
ponents through a membrane deals with difference
equations rather than differential equations, can then be
obtained [11]:
J1 ¼ �D1M
�D2M �w01 þ D12
D12 þ �w01�D2M þ �w0
2D1M
!�rM
Dw01
dM
þ �D1M
�D2M �w01
D12 þ �w01�D2M þ �w0
2D1M
!�rM
Dw02
dM
ð6aÞ
J2 ¼ �D2M
�D1M �w02 þ D12
D12 þ �w02�D1M þ �w0
1D2M
!�rM
Dw02
dM
þ �D2M
�D1M �w02
D12 þ �w02�D1M þ �w0
1D2M
!�rM
Dw01
dM
ð6bÞ
where �w0i ¼ ðw0
iF þ w0iPÞ=2; Dw0
i ¼ w0iF 2 w0
iP; w0iF (denotes
weight fraction of component i in feed in the membrane)
and w0iP weight fraction of component i in permeate in the
membrane which is in the case of �DiM, which is the average
diffusion coefficient of a pure component i in the active
layer of the membrane and is defined by:
�DiM ¼
ðw0iF
w0iP
DiMðw0iÞdw0
i
w0iF 2 w0
iP
ð7Þ
�rM is the average density of the polymer membrane and is
defined by:
�rM ¼
ðw0iF
w0iP
rMðw0iÞdw0
i
w0iF 2 w0
iP
ð8Þ
D12 can be adjusted to the experimental partial fluxes. The
permeate weight fraction w1P is given by Eq. (9):
w1P ¼J1
J1 þ J2
¼1
1 þ J2=J1
ð9Þ
In order to obtain consistent results for the permeate
composition (w1P;w2P) and partial pervaporation fluxes
from Eqs. (6a), (6b) and (9), Newton’s iteration process,
during which we optimize the adjustable parameter D12; has
to be repeated until w1P values fulfill Eq. (9).
To calculate partial fluxes of the permeating components
through dense membrane by a Flory–Rehner, UNIFAP
model and the modified Maxwell–Stefan equations, we
need to know concentration dependence of the diffusion
coefficients of pure component i in the membrane, weight
fraction of component i in the membrane w0iF from the
feed side, the thickness of the membrane dM and
concentration dependence of the membrane densityrM:
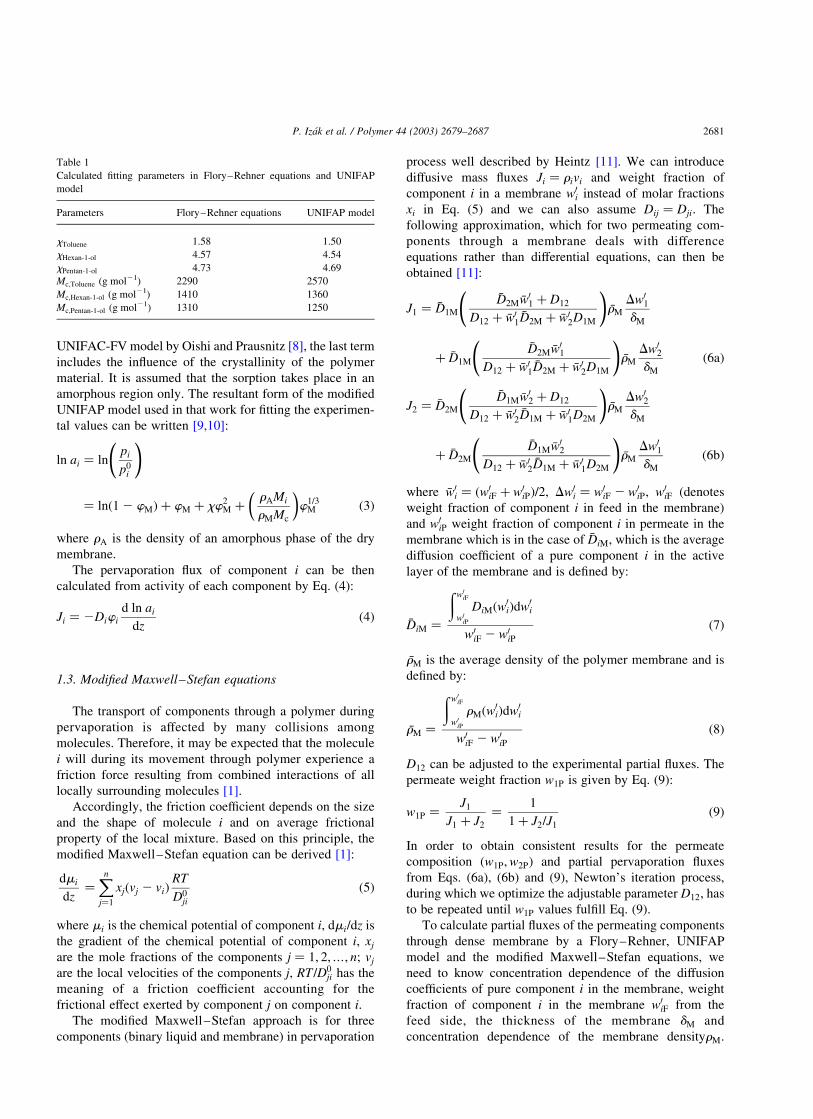
Table 1
Calculated fitting parameters in Flory–Rehner equations and UNIFAP
model
Parameters Flory–Rehner equations UNIFAP model
xToluene 1.58 1.50
xHexan-1-ol 4.57 4.54
xPentan-1-ol 4.73 4.69
Mc;Toluene (g mol21) 2290 2570
Mc;Hexan-1-ol (g mol21) 1410 1360
Mc;Pentan-1-ol (g mol21) 1310 1250
P. Izak et al. / Polymer 44 (2003) 2679–2687 2681
Partial pervaporation fluxes have to be determined exper-
imentally and then compared with calculated values. In the
modified Maxwell–Stefan equations these data are used for
iterative calculation of coupled diffusion coefficient Dij: In
case of Flory–Rehner and UNIFAP models two sets of
adjustable parameters ðxi;Mci;xj;McjÞ are iteratively calcu-
lated from sorption isotherms of pure components.
Then we can successfully solve Eqs. (1), (3), (4), (6a),
(6b) and (9) by Newton’s iterative method to fit experimen-
tally obtained data. All fitting parameters are in Tables 1
and 2.
2. Experimental
Two liquid binary mixtures (pentan-1-ol, hexan-1-ol
with toluene) and polyethylene membrane were measured at
25 8C.
2.1. Chemicals and the membrane
Pentan-1-ol, hexan-1-ol and toluene were analytical
grade and synthetic Zeolite type A4 was used for their
dehydration. Binary mixtures used for experiments were
prepared by weighting.
The membrane used for experiments is a high-
pressure, low-density, linear Polyethylene-Bralen FB2-
30 from Slovnaft Bratislava, Slovakia (denoted PE in the
text) in the form of foil (50 mm thick). Antistatic PE foil
has a melting index ITT ¼ (1.7–2.3)/600 s. Its density
ðr ¼ 919 ^ 2 kg m23Þ is determined with mercury pycn-
ometer. The density corresponds to the volume fraction
of crystalline phase, f ¼ 0:455 and glass transition
temperature Tg ¼ 2120 8C: Prior to experiments, the
foil is washed in distilled water, dried in the drying box
for 12 h at 60 8C and then kept in vacuum desiccator
over magnesium perchlorate.
2.2. Swelling of polymer membrane
We measured the extension of the polymer membrane
during swelling in liquid organic solutions [12]. Therefore a
special device was developed at the Department of Physical
Chemistry of the Institute of Chemical-Technology in
Prague [13,14].
The device is able to measure the extension of the
polymer membrane during swelling continuously, while the
membrane is immersed in liquid. The device has photo-
electric sensors that are rolling above the membrane in two
vertical directions (this is important especially for aniso-
tropic materials).
Experiments with swelling show that the density of
polyethylene membrane is concentration dependent. This
information can improve the accuracy of the results of all
used models.
From the results of our measurements we found out that
PE membrane during swelling in solvents extends in three
dimensions. Thus we were able to calculate the density of
the membrane that depends on the concentration of the feed
[12].
We described the dependence of the PE membrane
density on concentration of solvent with accuracy up to 2%
by polynomial equation of the second order ðrM ¼
r0M þ brM þ ar2
MÞ: The density of dry PE membrane (r0M)
was experimentally measured by mercury pycnometer.
2.3. Solubility measurements of binary liquid mixtures in PE
membrane
The application of all mentioned models for predicting
fluxes through PE membrane requires knowledge of
sorption isotherms. Sorption data (namely the preferential
sorption and the equilibrium swelling degree) were
determined by two different experiments.
Measurements of the preferential sorption in binary
liquid solutions over the whole concentration range at
constant temperature yield the isotherm of concentration
change (composite isotherm):
ViðxiÞ ¼No
mo
Dxi ð10Þ
where mo is the mass of dry polymer brought in contact with
No moles of binary solution, Dxi ¼ xoi 2 xi is the experi-
mentally determined change of solution concentration
caused by sorption, ViðxiÞ denotes the preferential sorption
as a function of the bulk liquid composition, xoi is the mole
fraction of the component i before sorption, xi is the mole
fraction of the component i after the equilibrium in bulk
liquid is reached.
The composition of the sorbed liquid in the membrane is
obtained by combining the data about preferential sorption
with the information about total amount of liquid sorbed by
the polymer, that are both gained from the liquid sorption
experiments:
xsi ¼
Qexi þViMj
Qe þViðMi 2 MjÞð11Þ
where Qe ¼ ðm 2 moÞ=mo is the equilibrium swelling
degree, mo is the mass of the dry polymer foil, m is the
mass of the swelled foil, Mi and Mj are the molar masses of
the components i and j; respectively.
The concentration of xoi and xi is determined by comparing
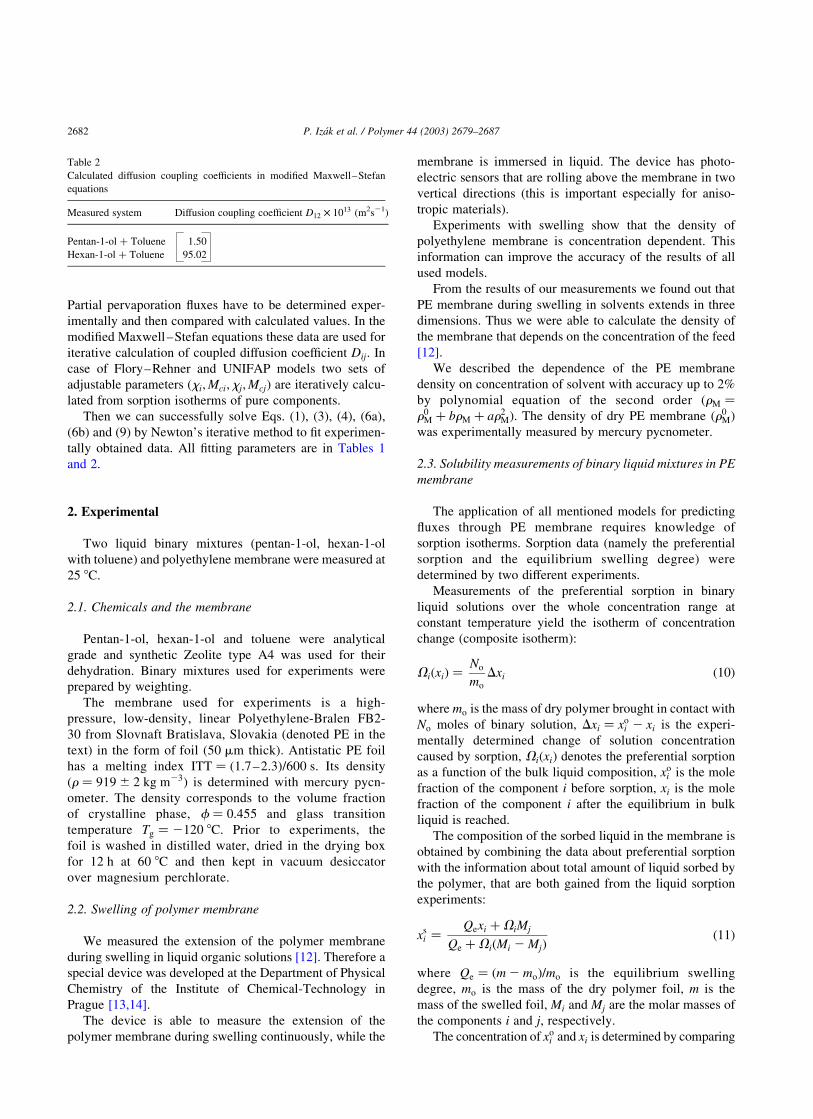
Table 2
Calculated diffusion coupling coefficients in modified Maxwell–Stefan
equations
Measured system Diffusion coupling coefficient D12 £ 1013 (m2s21)
Pentan-1-ol þ Toluene 1.50
Hexan-1-ol þ Toluene 95.02
P. Izak et al. / Polymer 44 (2003) 2679–26872682

the reading of the interferometer with the calibration curve,
constructed in the vicinity of each measuring point. The
interferometer is very convenient for this type of measure-
ment, because it is able to detect even a very small
concentration differences and the change in solution concen-
tration is obtained directly in a single measurement. For
practical purposes we recalculated mole fractions to weight
ones. The dependence of weight fractions of component i in a
membrane (w0i) on weight fractions of preferable component
(toluene) is in Figs. 1 and 2.
The amount of sorbed liquid is very small. Weighing of the
swelled sample, after it has been dried between two sheets of
filter paper, gave therefore entirely unreliable results. For that
reason a special gravimetric method must be used [15].
The foil is transferred into a tightly closed weighing
bottle inlaid by filter paper. The foil must be fixed in a
position, in which only its edges touch the paper (the
dimensions of the weighing bottle must correspond to the
dimensions of the foil sample). After 3 h, during which
the paper has drained off the excess liquid from the foil and
the equilibrium in the bottle is established, the full bottle is
weighed. The foil is then taken out quickly and the bottle
with the wet paper is weighed again. The difference
represents the weight of the swollen membrane. This
procedure is found to be reproducible within 2%.
2.4. Determination of diffusion coefficient by sorption
method
The solution of the second Fick’s law [16,17] for the
membrane of finite dimensions bounded by planes z ¼ dM=2
and z ¼ 2dM=2 (where dM is the membrane thickness) is
given by:
›ci
›t¼ Di
›2ci
›z2
!ð12Þ
under the initial and boundary conditions
2dM=2 , z , dM=2 t ¼ 0 c ¼ 0
z ¼ dM=2 t $ 0 c ¼ c1
z ¼ 2dM=2 t $ 0 c ¼ c1
leads to infinite series given by Eq. (13):
mt
m1
¼ 1 28
p2
Xn¼1
n¼0
�1
ð2n þ 1Þ2exp 2Di
ð2n þ 1Þ2p2t
d2M
!" #ð13Þ
Fig. 1. Sorption diagram of the ternary system pentan-1-ol þ toluene þ PE
membrane at 25 8C.
Fig. 2. Sorption diagram of the ternary system hexan-1-ol þ toluene þ PE
membrane at 25 8C. Fig. 3. Sorption isotherms of solvents in the PE membrane at 25 8C.
Fig. 4. Experimental data of the diffusion coefficient Di (Hittorf frame of
reference) as a function of the weight fraction of pure component i in the PE
membrane at 25 8C.
P. Izak et al. / Polymer 44 (2003) 2679–2687 2683
where mt is the mass uptake at time t; m1 is the mass uptake
at equilibrium.
If the ratio mt=m1 . 0:5 we can apply Eq. (14) for the
determination of Di with sufficient accuracy [16]:
ln 1 2mt
m1
� �¼ 2
p2Di
d2M
t þ ln8
p2
� �ð14Þ
The appropriate value of diffusion coefficient Di can be
calculated from the linear part of the curve which is
obtained by plotting lnð1 2 mt=m1Þ versus time. The
measured vapor sorption isotherms and dependence of
pure diffusion coefficient of pentan-1-ol, hexan-1-ol and
toluene in PE membrane at 25 8C are shown in Figs. 3 and 4.
2.5. Pervaporation experiments
Our pervaporation apparatus was designed to achieve a
rapid desorption of the permeates at the downstream surface
of the membrane in order to reduce their activities in the
subjacent layer of the operating barrier to a virtually zero
value. The pervaporation apparatus, constructed at the
Department of Physical–Chemistry of the Institute of
Chemical-Technology in Prague, allows sensitive measure-
ment of very small pervaporation fluxes by sorption method.
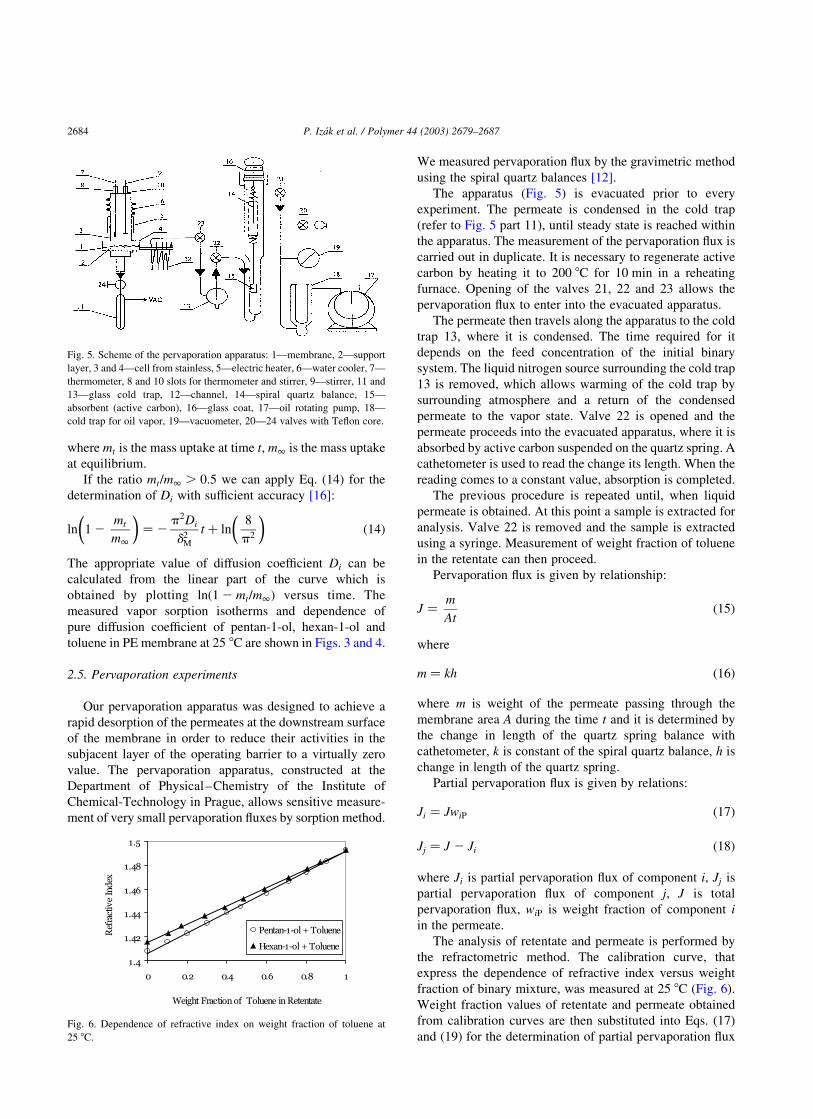
We measured pervaporation flux by the gravimetric method
using the spiral quartz balances [12].
The apparatus (Fig. 5) is evacuated prior to every
experiment. The permeate is condensed in the cold trap
(refer to Fig. 5 part 11), until steady state is reached within
the apparatus. The measurement of the pervaporation flux is
carried out in duplicate. It is necessary to regenerate active
carbon by heating it to 200 8C for 10 min in a reheating
furnace. Opening of the valves 21, 22 and 23 allows the
pervaporation flux to enter into the evacuated apparatus.
The permeate then travels along the apparatus to the cold
trap 13, where it is condensed. The time required for it
depends on the feed concentration of the initial binary
system. The liquid nitrogen source surrounding the cold trap
13 is removed, which allows warming of the cold trap by
surrounding atmosphere and a return of the condensed
permeate to the vapor state. Valve 22 is opened and the
permeate proceeds into the evacuated apparatus, where it is
absorbed by active carbon suspended on the quartz spring. A
cathetometer is used to read the change its length. When the
reading comes to a constant value, absorption is completed.
The previous procedure is repeated until, when liquid
permeate is obtained. At this point a sample is extracted for
analysis. Valve 22 is removed and the sample is extracted
using a syringe. Measurement of weight fraction of toluene
in the retentate can then proceed.
Pervaporation flux is given by relationship:
J ¼m
Atð15Þ
where
m ¼ kh ð16Þ
where m is weight of the permeate passing through the
membrane area A during the time t and it is determined by
the change in length of the quartz spring balance with
cathetometer, k is constant of the spiral quartz balance, h is
change in length of the quartz spring.
Partial pervaporation flux is given by relations:
Ji ¼ JwiP ð17Þ
Jj ¼ J 2 Ji ð18Þ
where Ji is partial pervaporation flux of component i; Jj is
partial pervaporation flux of component j; J is total
pervaporation flux, wiP is weight fraction of component i
in the permeate.
The analysis of retentate and permeate is performed by
the refractometric method. The calibration curve, that
express the dependence of refractive index versus weight
fraction of binary mixture, was measured at 25 8C (Fig. 6).
Weight fraction values of retentate and permeate obtained
from calibration curves are then substituted into Eqs. (17)
and (19) for the determination of partial pervaporation flux
Fig. 5. Scheme of the pervaporation apparatus: 1—membrane, 2—support
layer, 3 and 4—cell from stainless, 5—electric heater, 6—water cooler, 7—
thermometer, 8 and 10 slots for thermometer and stirrer, 9—stirrer, 11 and
13—glass cold trap, 12—channel, 14—spiral quartz balance, 15—
absorbent (active carbon), 16—glass coat, 17—oil rotating pump, 18—
cold trap for oil vapor, 19—vacuometer, 20—24 valves with Teflon core.
Fig. 6. Dependence of refractive index on weight fraction of toluene at
25 8C.
P. Izak et al. / Polymer 44 (2003) 2679–26872684
and separation factor of the membrane:
a12 ¼w1P=w2P
w1F=w2F
ð19Þ
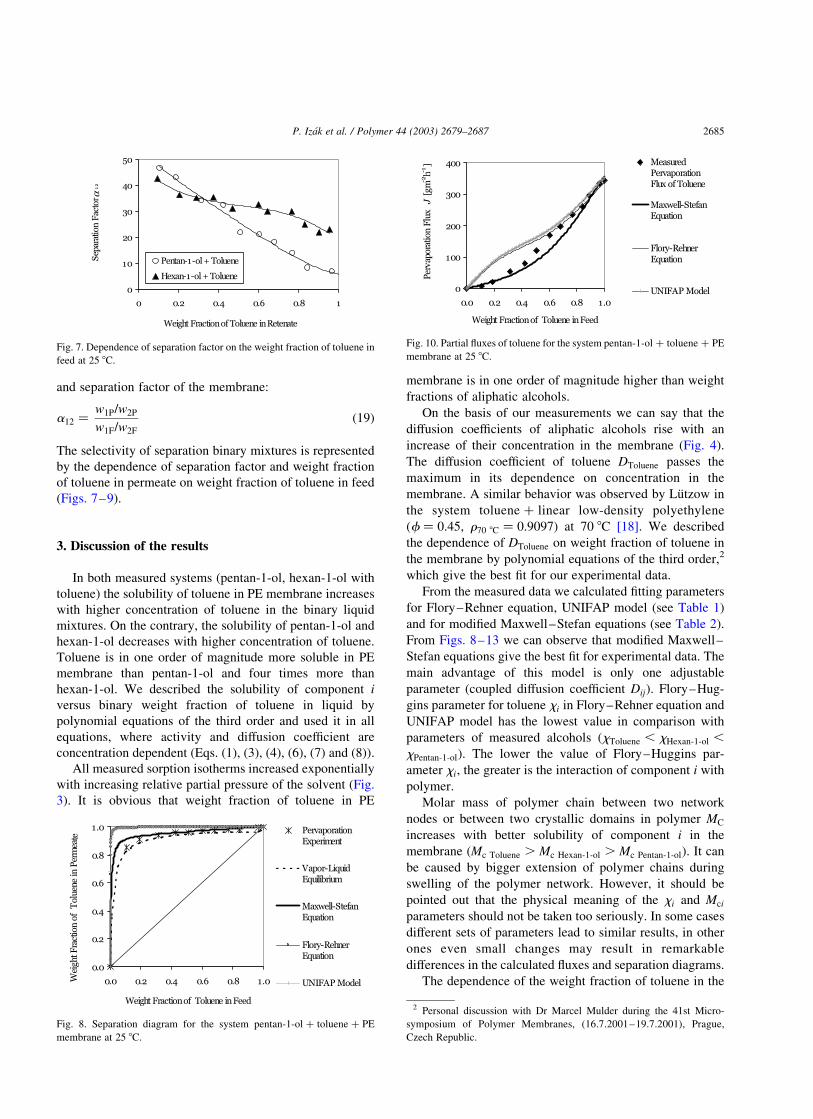
The selectivity of separation binary mixtures is represented
by the dependence of separation factor and weight fraction
of toluene in permeate on weight fraction of toluene in feed
(Figs. 7–9).
3. Discussion of the results
In both measured systems (pentan-1-ol, hexan-1-ol with
toluene) the solubility of toluene in PE membrane increases
with higher concentration of toluene in the binary liquid
mixtures. On the contrary, the solubility of pentan-1-ol and
hexan-1-ol decreases with higher concentration of toluene.
Toluene is in one order of magnitude more soluble in PE
membrane than pentan-1-ol and four times more than
hexan-1-ol. We described the solubility of component i
versus binary weight fraction of toluene in liquid by
polynomial equations of the third order and used it in all
equations, where activity and diffusion coefficient are
concentration dependent (Eqs. (1), (3), (4), (6), (7) and (8)).
All measured sorption isotherms increased exponentially
with increasing relative partial pressure of the solvent (Fig.
3). It is obvious that weight fraction of toluene in PE
membrane is in one order of magnitude higher than weight
fractions of aliphatic alcohols.
On the basis of our measurements we can say that the
diffusion coefficients of aliphatic alcohols rise with an
increase of their concentration in the membrane (Fig. 4).
The diffusion coefficient of toluene DToluene passes the
maximum in its dependence on concentration in the
membrane. A similar behavior was observed by Lutzow in
the system toluene þ linear low-density polyethylene
(f ¼ 0:45; r70 8C ¼ 0:9097) at 70 8C [18]. We described
the dependence of DToluene on weight fraction of toluene in
the membrane by polynomial equations of the third order,2
which give the best fit for our experimental data.
From the measured data we calculated fitting parameters
for Flory–Rehner equation, UNIFAP model (see Table 1)
and for modified Maxwell–Stefan equations (see Table 2).
From Figs. 8–13 we can observe that modified Maxwell–
Stefan equations give the best fit for experimental data. The
main advantage of this model is only one adjustable
parameter (coupled diffusion coefficient Dij). Flory–Hug-
gins parameter for toluene xi in Flory–Rehner equation and
UNIFAP model has the lowest value in comparison with
parameters of measured alcohols ðxToluene , xHexan-1-ol ,
xPentan-1-olÞ: The lower the value of Flory–Huggins par-
ameter xi; the greater is the interaction of component i with
polymer.
Molar mass of polymer chain between two network
nodes or between two crystallic domains in polymer MC
increases with better solubility of component i in the
membrane ðMc Toluene . Mc Hexan-1-ol . Mc Pentan-1-olÞ: It can
be caused by bigger extension of polymer chains during
swelling of the polymer network. However, it should be
pointed out that the physical meaning of the xi and Mci
parameters should not be taken too seriously. In some cases
different sets of parameters lead to similar results, in other
ones even small changes may result in remarkable
differences in the calculated fluxes and separation diagrams.
The dependence of the weight fraction of toluene in the
Fig. 7. Dependence of separation factor on the weight fraction of toluene in
feed at 25 8C.
Fig. 8. Separation diagram for the system pentan-1-ol þ toluene þ PE
membrane at 25 8C.
Fig. 10. Partial fluxes of toluene for the system pentan-1-ol þ toluene þ PE
membrane at 25 8C.
2 Personal discussion with Dr Marcel Mulder during the 41st Micro-
symposium of Polymer Membranes, (16.7.2001–19.7.2001), Prague,
Czech Republic.
P. Izak et al. / Polymer 44 (2003) 2679–2687 2685
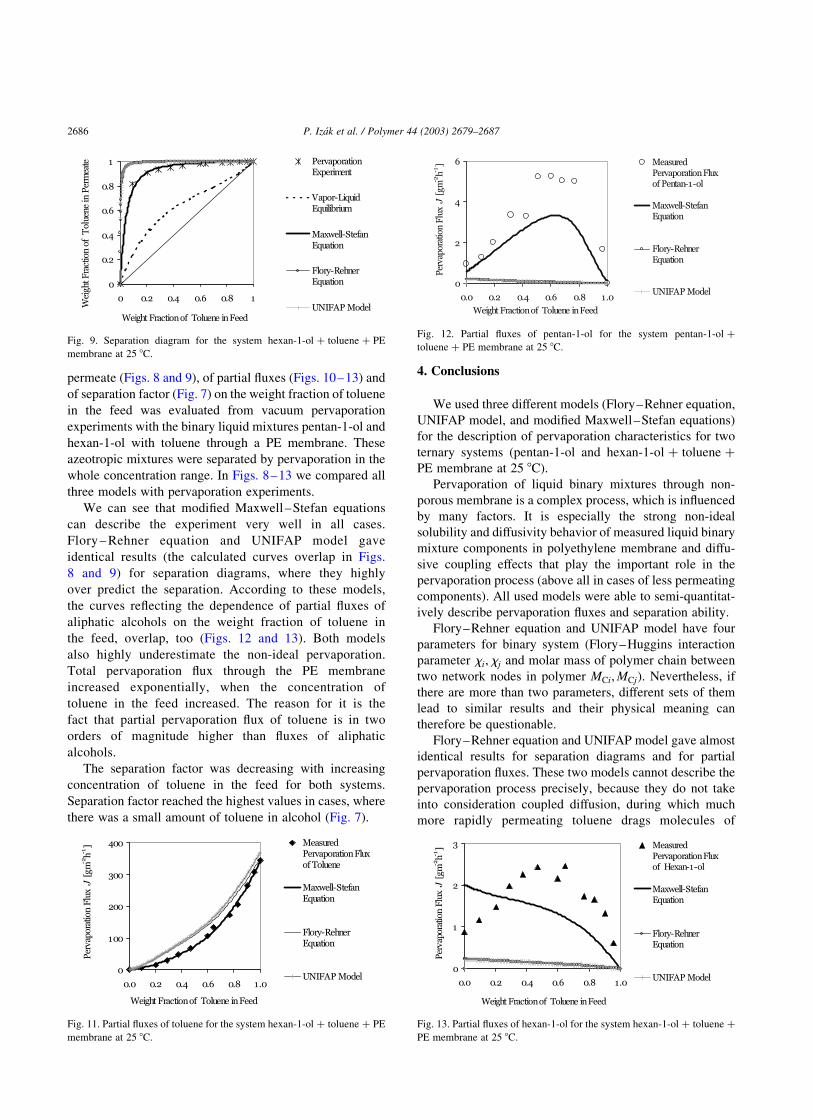
permeate (Figs. 8 and 9), of partial fluxes (Figs. 10–13) and
of separation factor (Fig. 7) on the weight fraction of toluene
in the feed was evaluated from vacuum pervaporation
experiments with the binary liquid mixtures pentan-1-ol and
hexan-1-ol with toluene through a PE membrane. These
azeotropic mixtures were separated by pervaporation in the
whole concentration range. In Figs. 8–13 we compared all
three models with pervaporation experiments.
We can see that modified Maxwell–Stefan equations
can describe the experiment very well in all cases.
Flory – Rehner equation and UNIFAP model gave
identical results (the calculated curves overlap in Figs.
8 and 9) for separation diagrams, where they highly
over predict the separation. According to these models,
the curves reflecting the dependence of partial fluxes of
aliphatic alcohols on the weight fraction of toluene in
the feed, overlap, too (Figs. 12 and 13). Both models
also highly underestimate the non-ideal pervaporation.
Total pervaporation flux through the PE membrane
increased exponentially, when the concentration of
toluene in the feed increased. The reason for it is the
fact that partial pervaporation flux of toluene is in two
orders of magnitude higher than fluxes of aliphatic
alcohols.
The separation factor was decreasing with increasing
concentration of toluene in the feed for both systems.
Separation factor reached the highest values in cases, where
there was a small amount of toluene in alcohol (Fig. 7).
4. Conclusions
We used three different models (Flory–Rehner equation,
UNIFAP model, and modified Maxwell–Stefan equations)
for the description of pervaporation characteristics for two
ternary systems (pentan-1-ol and hexan-1-ol þ toluene þ
PE membrane at 25 8C).
Pervaporation of liquid binary mixtures through non-
porous membrane is a complex process, which is influenced
by many factors. It is especially the strong non-ideal
solubility and diffusivity behavior of measured liquid binary
mixture components in polyethylene membrane and diffu-
sive coupling effects that play the important role in the
pervaporation process (above all in cases of less permeating
components). All used models were able to semi-quantitat-
ively describe pervaporation fluxes and separation ability.
Flory–Rehner equation and UNIFAP model have four
parameters for binary system (Flory–Huggins interaction
parameter xi;xj and molar mass of polymer chain between
two network nodes in polymer MCi;MCjÞ: Nevertheless, if
there are more than two parameters, different sets of them
lead to similar results and their physical meaning can
therefore be questionable.
Flory–Rehner equation and UNIFAP model gave almost
identical results for separation diagrams and for partial
pervaporation fluxes. These two models cannot describe the
pervaporation process precisely, because they do not take
into consideration coupled diffusion, during which much
more rapidly permeating toluene drags molecules of
Fig. 11. Partial fluxes of toluene for the system hexan-1-ol þ toluene þ PE
membrane at 25 8C.
Fig. 12. Partial fluxes of pentan-1-ol for the system pentan-1-ol þ
toluene þ PE membrane at 25 8C.
Fig. 13. Partial fluxes of hexan-1-ol for the system hexan-1-ol þ toluene þ
PE membrane at 25 8C.
Fig. 9. Separation diagram for the system hexan-1-ol þ toluene þ PE
membrane at 25 8C.
P. Izak et al. / Polymer 44 (2003) 2679–26872686

pentan-1-ol or hexan-1-ol that otherwise would be many
times slower.
On the basis of our results and experience for very
precise description of pervaporation processes, during
which coupled diffusion may occur (usually one component
permeating much faster than other ones) we recommend the
use of modified Maxwell–Stefan equations. Their advan-
tage is also in the use of only one adjustable parameter
(coupled diffusion coefficient Dij). However, from the
technological point of view, Flory–Rehner equation and
UNIFAP model should be sufficient in situations, when it is
necessary to know dominant pervaporation flux and when
the pervaporation data are unknown.
Acknowledgements
The financial support of the Grant Agency of the Czech
Republic (Grants No. 23400008 and 104010945) are
gratefully acknowledged. Special thanks to MSc. Jaroslava
Machkova for collaboration in pervaporation experiments
and to Mgr. Ivana Dvorakova for support and big help.
References
[1] Bitter JGA. Transport mechanism in membrane separation processes.
Edited Koninklijke Shell Laboratorium. Postbus, Amsterdam, The
Netherlands.
[2] Flory PJ, Rehner J. J Chem Phys 1943;11:512.
[3] Kuhn W. Kolloid-ZZ Polym 1934;68(1):1.
[4] Flory PJ. J Chem Phys 1950;18:108.
[5] Goydan R, Reid RC, Tseng HS. Estimation of the solubilities of
organic compounds in polymers by group-contribution methods. Ind
Engng Chem Res 1989;28:445.
[6] Saure R, Schlunder EU. Sorption isotherms for methanol, benzene and
ethanol on polyvinyl acetate. Chem Engng Proc 1995;34:305.
[7] Fredenslund A, Gmeling J, Prausnitz JM. Group-contribution
estimation of activity coefficients in non-ideal liquid mixtures.
AIChE J 1975;21:1086.
[8] Oishi T, Prausnitz JM. Estimation of solvent activities in polymer
solution using a group contribution method. Ind Engng Chem Process
Des Dev 1978;17:333.
[9] Castro EF, Gonzo EE, Gottifredi JC. The analysis of sorption data of
organic vapors in polymeric membranes through novel theories.
J Membr Sci 1996;113:57–64.
[10] Vicente MS, Gottifredi JC. Estimation of solvent activities in polymer
solution using a group contribution method. Sep Purif Tech 2001;22–
23:671–9.
[11] Heintz A, Stephan W. A generalized solution-diffusion model of the
pervaporation process through composite membranes Part II.
Concentration polarization, coupled diffusion of the porous support
layer. J Membr Sci 1994;89:153–69.
[12] Izak P, Bartovska L, Friess K, Sıpek M, Uchytil P. Description of
binary liquid mixtures transport through non-porous membrane by
modified Maxwell–Stefan equations. J Membr Sci 2003;5540:1–17.
[13] Bartovsky T, Siskova M. Sorption properties of polymeric membrane
materials, 36. Mikrosymposium “HIGH-SWELLING GELS”, Praha,
10.7.1995–14.7.1995.
[14] Bartovska L, Bartovsky T, Siskova M. Solubility in systems
Polymeric foil—mixtures of organic solvents. 49. Sjezd chemickuch
spolecnostı, Bratislava, 4.9.1995–7.9.1995.
[15] Bartovska L, Siskova M. Pozivilova O. Sorption properties of
polymeric Pervaporation Membranes. 12th International Congress
CHISA’96, Prague 25.8.1996–30.8.1996.
[16] Crank J, Park GS. Diffusion in polymers. London: Academia Press;
1968.
[17] Crank J. The mathematics of diffusion, Second edition. Oxford:
Claredon Press; 1975.
[18] Lutzow N, Tihminlioglu A, Danner RP, Duda JL, De Haan A, Warnier
G, Zielinski JM. Diffusion of toluene and n-heptane in polyethylenes
of different crystallinity. Polymer 1999;40:2797–803.
P. Izak et al. / Polymer 44 (2003) 2679–2687 2687