comparison of vacuum and centrifuge-based …
TRANSCRIPT

COMPARISON OF VACUUM AND CENTRIFUGE-BASED TECHNIQUES FOR
EVALUATING SOLUTE TRANSPORT PROCESSES UNDER UNSATURATED
CONDITIONS
by
JESSICA MARIA HUTCHISON
(Under the Direction of David E. Radcliffe)
ABSTRACT
Most subsurface contamination passes through the unsaturated zone before reaching an aquifer; however, many transport studies are conducted under saturated conditions that may not approximate the natural system. Chromate migration was measured in sediment from the Savannah River Site, SC under different water contents using vacuum and centrifuge techniques to obtain a steady-state flow regime. Leaching solutions contained 0.5 or 1.0 mM Cr(VI) and tritium in artificial groundwater. Breakthrough curves were modeled using CXTFIT assuming equilibrium conditions. Dispersion, as indicated by Peclet number, increased with decreasing water content. Retardation increased with decreasing water content with no trend evident when Kd was calculated from R. Average Kd of all Cr(VI) experiments was 0.551 mL⋅g-1, similar to Kd derived from batch equilibration (0.599 mL⋅g-1). Though results in both systems were similar, experiment duration in the vacuum system was 4 to 23 times longer than in the centrifuge system at comparable water contents. INDEX WORDS: Hexavalent chromium, Solute transport, Unsaturated soil,
Adsorption, Dispersion, Unsaturated flow apparatus

COMPARISON OF VACUUM AND CENTRIFUGE-BASED TECHNIQUES FOR
EVALUATING SOLUTE TRANSPORT PROCESSES UNDER UNSATURATED
CONDITIONS
by
JESSICA MARIA HUTCHISON
B. S., North Carolina State University, 2000
A Thesis Submitted to the Graduate Faculty of The University of Georgia in
Partial Fulfillment of the Requirements for the Degree
MASTER OF SCIENCE
ATHENS, GA
2002

2002
Jessica Maria Hutchison
All Rights Reserved

COMPARISON OF VACUUM AND CENTRIFUGE-BASED TECHNIQUES FOR
EVALUATING SOLUTE TRANSPORT PROCESSES UNDER UNSATURATED
CONDITIONS
by
JESSICA MARIA HUTCHISON
Major Professor: David E. Radcliffe
Committee: John C. Seaman Larry T. West
Electronic Version Approved:
Maureen Grasso Dean of the Graduate School The University of Georgia December 2002

iv
DEDICATION
I would like to dedicate this thesis to my parents, Bob and Kim Hutchison.
It is their love, perseverance, and support that have always inspired me. I love
you both very much. Thanks for everything you do.

v
ACKNOWLEDGEMENTS
I would like to thank John Seaman who has acted as my major professor
and has always given me unwavering support and invaluable advice. It is a rare
thing to find a professor who drops everything to help you with a problem.
Thanks for always making my research a priority. I would also like to thank
David Radcliffe for acting as my on-campus major professor. Your willing and
enthusiastic comments on my research were always appreciated. Thanks to
Larry West for serving on my advisory committee and adding important
perspective and recommendations on project development.
Jane Logan, Jennifer McIntosh and Angel Kelsey-Wall offered wonderful
lab support and friendship through the tedious hours of many column
experiments. Momin Uddin shared skilled insight into the workings of the UV-Vis
and always brought a cheerful presence to the lab. Thanks Marianne Guerin and
Julian Singer for consultation on thesis data and Machelle Wilson for statistical
advice. Thanks to the wonderful secretaries in the Soil Science Department at
UGA: Vivienne Sturgill and Henrietta Tucker.
Last but not least, I would like to thank all my family and friends who made
it possible for me to secure my sanity through all this, though some would
question that I started with any. Thanks for sitting patiently while I vented about
strange things like soil physics and helping me to destress through all the bumps
and trials along the way.

vi
TABLE OF CONTENTS
Page
ACKNOWLEDGEMENTS..................................................................................... v
LIST OF TABLES ...............................................................................................viii
LIST OF FIGURES ............................................................................................... x
CHAPTER
1 INTRODUCTION AND LITERATURE REVIEW........................................1
Rationale................................................................................................1
Transport equation.................................................................................1
Variation in solute transport parameters ................................................8
Methods and equipment used to evaluate solute transport..................13
Tracers.................................................................................................18
Modeling ..............................................................................................20
Objectives ............................................................................................21
Notation ...............................................................................................22
References...........................................................................................22
2 SOLUTE TRANSPORT IN VARIABLY-SATURATED SOIL ...................29
Abstract................................................................................................30
Introduction ..........................................................................................31
Materials and methods.........................................................................35
Results and discussion ........................................................................43

vii
Summary and conclusions...................................................................57
Notation ...............................................................................................58
References...........................................................................................58
3 CONCLUSIONS......................................................................................84
APPENDICES.....................................................................................................86

viii
LIST OF TABLES
Page
Table 1: Review of studies evaluating changes in transport parameters
with water content.................................................................................62
Table 2: Definitions of transport parameters and the effect of the variation of
water content ........................................................................................63
Table 3: Physical and chemical characteristics of Tobacco Road sand used in
column and batch studies .....................................................................64
Table 4: Bromide transport parameters determined by direct measurement or
from solute breakthrough curves evaluated using the equilibrium and
nonequilibrium transport models ...........................................................65
Table 5: Tritium transport parameters for vacuum system, derived by direct
measurement or from solute breakthrough curves evaluated using the
equilibrium transport model...................................................................66
Table 6: Tritium transport parameters for the UFA (centrifuge system), 0.5 mM
Cr(VI) tracer solution, determined using the equilibrium transport
model ....................................................................................................67
Table 7: Tritium transport parameters for the UFA (centrifuge system), 1.0 mM
Cr(VI) tracer solution, determined using the equilibrium transport
model ....................................................................................................68
Table 8: Cr(VI) transport parameters for vacuum system, derived by direct

ix
measurement or from solute breakthrough curves evaluated using the
equilibrium transport model...................................................................69
Table 9: Cr(VI) transport parameters for the UFA (centrifuge system), 0.5 mM
Cr(VI) tracer solution, determined using the equilibrium transport
model ....................................................................................................70
Table 10: Cr(VI) transport parameters for the UFA (centrifuge system), 1.0 mM
Cr(VI) tracer solution determined using the equilibrium transport
model ..................................................................................................71
Table 11: Amount of Cr(VI) sorbed by soil during the course of the
experiment ..........................................................................................72

x
LIST OF FIGURES
Page
Figure 1: Unsaturated hydraulic conductivity curves for sandy loam soil
obtained using the UFA with artificial groundwater (AGW) and
calcium chloride leaching solutions......................................................73
Figure 2: Diagram of the Wierenga column setup for unsaturated flow ..............74
Figure 3: Diagram of the Unsaturated Flow Apparatus components ..................75
Figure 4: Cr(VI) sorption isotherm on loamy sand soil at a soil:solution ratio
of 1:6 by mass, equilibrated for 24 hours .............................................76
Figure 5: Bromide breakthrough curves for four levels of column saturation. .....77
Figure 6: Volumetric and gravimetric water content with column length for
vacuum column experiment under 50 cbars of vacuum pressure........78
Figure 7: Retardation in unsaturated media determined using centrifuge-based
(UFA) and vacuum-based column systems .........................................79
Figure 8: Log of Peclet number with volumetric water content for vacuum and
UFA tritium column data ......................................................................80
Figure 9: Log of dispersivity with water content for tritium data from vacuum and
centrifuge column experiments, determined from D fit with equilibrium
model ...................................................................................................81

xi
Figure 10: Retardation factor (graph A) and distribution coefficient
(graph B) with volumetric water content for UFA and vacuum
column systems at 0.5 mM and 1.0 mM Cr(VI) concentration
levels..................................................................................................82
Figure 11: Amount of Cr(VI) sorbed by soil in UFA and vacuum column
experiments with volumetric water content (graph A) and retention
time of solute in soil column (graph B) ...............................................83

1
CHAPTER 1
INTRODUCTION AND LITERATURE REVIEW
Rationale
Studies evaluating solute transport processes in the vadose zone yield
important information for situations in which chemical wastes are disposed of at
or below the land surface. Despite the fact that virtually all subsurface
contamination must pass through the unsaturated vadose zone before reaching
an aquifer, most studies have only focused on processes occurring under
saturated conditions (Thomas and Swoboda, 1970; Passioura and Rose, 1971;
Nkedi-Kizza et al., 1983; Powers et al., 1992; Jardine et al., 1999). This is
partially due to the difficulty in maintaining steady-state flow and moisture content
necessary for the controlled study of solute transport processes under
unsaturated conditions. Furthermore, measurements made under saturated
conditions may not approximate the conditions of the natural system under which
solute transport occurs.
Transport equation
The convective-dispersive equation (CDE) (Lapidus and Amundson, 1952)
was developed in an attempt to quantify solute transport processes for one-
dimensional steady-state flow of a non-reactive solute in a homogeneous soil
column and is described by the equation:
zCv
zCD
tC
∂∂−
∂∂=
∂∂
2
2
[1]

2
where C is the concentration (M L-3), D is the hydrodynamic dispersion coefficient
(L2 T-1), v is the average pore-water velocity (L T-1), z is distance, and t is time.
In order for this equation to be valid, it is assumed that all the fluid participates in
the transport process and no interaction occurs between the solute and the soil
matrix.
Dispersion
The hydrodynamic dispersion coefficient (D) has been shown to be
uniquely related to the product of the average pore-water velocity (v) and the
aggregate size (Passioura, 1971; Passioura and Rose, 1971) and results from
the non-uniformity of flow velocity in the soil’s conducting pores. This causes
mixing to occur within the soil pores and results in the deviation of solute
breakthrough curves (BTCs) from piston flow. Hydrodynamic dispersion is
expressed as (Bear, 1969):
ea DvD +⋅= λ [2]
where λ and a are constants, λ is referred to as dispersivity (L) and is a
characteristic property of the porous media, a is taken as a value between 1 and
2 (Freeze and Cherry, 1979), and De is the effective molecular diffusion
coefficient through the media. The product λ⋅va in Equation [2] is referred to as
mechanical dispersion. This is caused by kinematic and dynamic mechanisms
(Sahimi et al., 1983). The kinematic mechanism results from a variation in the
length of the streamlines that traverse the length of the column, while the
dynamic mechanism results from a variation in the speed of fluid movement from
one streamline to the next.

3
The second term on the right-hand side of Equation [2], De, is defined as
(Shackelford, 1991):
0DDe ⋅= τ [3]
where D0 is the molecular diffusion coefficient in free solution and τ is the
tortuosity factor (L⋅Le-1)2, where L is the column length and Le is the actual flow
path length through the soil column. As the soil is desaturated, the actual length
of the flow path (Le) increases, causing the tortuosity factor to decrease. This
causes the effective molecular diffusion coefficient (De) to be smaller in media
with more tortuous flow paths. Burdine (1953) experimentally derived a
relationship that relates the tortuosity factor for unsaturated media (τS) to the
degree of saturation (S). This relationship is given as:
21 eSs S+= =ττ [4]
where τS = 1 is the tortuosity factor when the media is fully saturated and Se is the
effective saturation [Se = (S-Sr)⋅(1-Sr)-1, where Sr is the residual saturation of the
media, i.e. the minimum saturation that can be attained by dewatering a soil
under increasing suction].
At high pore-water velocities, the contribution of molecular diffusion (De) to
dispersion (D) is negligible and, therefore, often ignored in the calculation of
hydrodynamic dispersion.
In addition to the effects of dispersion, longitudinal spreading of solutes in
porous media may also be due to the existence of physical or chemical
nonequilibrium processes during solute transport. This spreading should not be
included in the dispersion coefficient if it is to be referred to as the hydrodynamic

4
dispersion coefficient. These nonequilibrium processes, in part, are the result of
physical or chemical nonuniformity and sometimes cannot be independently
measured or separated from the effects of other processes occurring within the
media.
For comparison between systems, a dimensionless dispersion parameter,
known as the Peclet number (P) is calculated as:
D
LvP ⋅= [5]
where v is the average pore water velocity (Darcy flow velocity divided by
volumetric water content), L is the column length, and D is the hydrodynamic
dispersion coefficient. The Peclet number can be interpreted as the ratio of the
characteristic times for hydrodynamic dispersion (L2⋅D-1) and convection (L⋅v-1)
and is solely dependent on the medium, provided the contribution to mixing by
molecular diffusion is insignificant (Nkedi-Kizza et al., 1983). Another parameter
calculated from D is the dispersivity (λ), which is defined as the hydrodynamic
dispersion coefficient (D) divided by the average pore water velocity (v).
Equation [1] is limited to describing solutes that exhibit conservative, or
nonreacting, behavior. Reactive solutes can either be adsorbed by the soil
(Hamaker, 1975) or electrostatically excluded from a fraction of the saturated
pore space (McMahon and Thomas, 1974). Equation [1] also does not account
for the fact that part of the soil solution may be stagnant and not participate in the
flow process (Krupp et al., 1972; Gupta et al., 1973). Changes to Equation [1] to
account for these phenomena include the retardation coefficient and the mobile-
immobile water theory discussed in the text to follow.

5
Retardation
In addition to dispersion, the divergence of BTCs from piston flow can also
result from the interaction of the solute with the media. There are two types of
experiments designed to evaluate the chemical interactions of these solutes:
batch equilibration and dynamic column tests. The distribution coefficient (Kd) is
a specific type of batch equilibration study and is defined as:
CmxKd
)/(= [6]
where x is the mass of the adsorbed solute, m is the mass of the sorbent, and C
is the solute concentration. The distribution coefficient (Kd) can also be
estimated as the slope of the adsorption isotherm at the origin (Langmuir, 1997).
In dynamic column studies, one observes the retardation factor (R) for a
given solute, defined as the ratio of the solution velocity to that of the solute. For
linear, equilibrium adsorption R can be related to Kd through the expression
(Bouwer, 1991):
θρ d
bsp
gw KVV
R +== 1 [7]
where Vgw is the velocity of the carrier fluid, Vsp is the velocity of the solute
species, ρb is the dry bulk density, and θ is the water content. This expression is
used when converting a Kd measurement derived from batch experiments to R
values expected for a column experiment. However, retardation coefficients
observed in column studies often differ from values determined by batch
equilibration.

6
If the solute is nonreactive, i.e. Kd = 0, then R = 1 for that species and the
solute will travel with the water at the same transport velocity (Hillel, 1980).
Therefore, a solute exhibiting exclusion will have an R < 1 and a solute that is
retained by the media will have an R > 1.
Retardation factors affect the calculation of parameters in the CDE.
When including a term for reactive solutes the expression becomes:
zCv
zCD
tCR
∂∂−
∂∂=
∂∂
2
2 [8]
to include the retardation factor (R). Non-reactive tracers are used to estimate
the physical transport parameters under the assumption that no chemical
reactions occur between the solute and porous medium (Seaman et al., 1995).
With R = 1, the CDE is calibrated using the BTC of the tracer to determine the
transport parameters v and D (Parker and van Genuchten, 1984). The sorbing
solute BTC is then fit with the CDE using the calibrated D and v values from the
conservative tracer to find its appropriate R value.
Mobile-immobile water
In addition to complications resulting from sorption and exclusion,
researchers have shown nonsigmoid and asymmetrical BTCs, which have been
referred to as “tailing,” and contradict predictions from Equation [1] (Nielsen and
Biggar, 1961; Krupp and Elrick, 1968; Gaudet et al., 1977; De Smedt and
Wierenga, 1984).
Tailing has been observed under several conditions. Nielsen and Biggar
(1961) noted considerable tailing with decreasing water content at approximately
the same flow velocity. They attributed this effect to the fact that under

7
unsaturated conditions, the larger pores have drained and are eliminated for
transport, thus increasing the portion of water which does not readily move within
the soil, often referred to as dead, stagnant, or immobile water (Turner, 1958;
Deans, 1963; Coats and Smith, 1964). Immobile water can exist as liquid films
around soil particles, in dead-end pores, or in isolated regions associated with
desaturation (Nielsen et al., 1986). Evidence of the presence of immobile
regions of water can be inferred from the tailing and asymmetry of solute BTCs
(Bond and Wierenga, 1990).
Another situation under which tailing has been observed is with
aggregated media (Nkedi-Kizza et al., 1983). This effect has been noticed in
soils even under saturated conditions and results from the fact that aggregates
contain micropores in which displacement is dependent upon diffusion, since
convection in these smaller pores is usually negligible. This results in slow and
incomplete mixing and produces a BTC that exhibits tailing. In large aggregates,
the amount of immobile water is greater, while the diffusion pathway becomes
larger, resulting in BTCs with more extensive tailing (Biggar and Nielsen, 1962;
Green et al., 1972; McMahon and Thomas, 1974). The magnitude of such a
phenomenon depends on aggregate dimensions and the relative fluid velocities
within and around the aggregates (Smiles et al., 1981).
Solute migration through materials with immobile water can be described
by a “two-region” model, where advective transport is limited to the mobile water
domain and transport between the mobile and immobile domains is diffusion-
limited. Besides v, D, and R, the fraction of mobile water (β) and the mass

8
transfer coefficient (ω) parameters are fit to the BTCs. The fraction of mobile
water ranges between 0 and 1 and is defined as:
θθβ m= [9]
where θm is the mobile fraction of the volumetric water content. Therefore, in
situations where β = 1, the system is at physical equilibrium and would be well-
described using the conventional CDE. As β decreases, the solute BTCs
become more skewed and may exhibit early breakthrough and tailing. The mass
transfer coefficient (ω) includes an exchange rate coefficient and is defined as:
wJL⋅= γω [10]
where γ is the exchange rate coefficient between the mobile and immobile water
regions, L is the column length, and Jw is the volumetric water flux. When ω is
large, solute BTCs are relatively symmetrical even if there is a significant amount
of immobile water in the system and are well described using the conventional
CDE. Physical equilibrium conditions exist due to the rapid exchange between
regions of mobile and immobile water. Also, at small water fluxes, solute
residence times are often sufficient to ensure complete mixing between mobile
and immobile water regions, such that all the water in the system appears mobile
when estimated from solute BTCs (Nkedi-Kizza et al., 1983).
Variation in solute transport parameters
Differences in moisture content can influence solute migration by limiting
diffusion and decreasing the pore space available for transport. Due to capillary
forces, small pores tend to remain water-filled, while larger pores drain readily.

9
This increases the fraction of immobile water and may increase dispersion
(Nielsen and Biggar, 1961; Gaudet et al., 1977; De Smedt and Wierenga, 1984;
Maciejewski, 1993). In addition, the degree of saturation may also influence the
availability of surface sites for reaction with the transported solutes, influencing
the apparent retardation. Therefore, it is important to study the effect of moisture
content on various parameters used in predicting solute transport.
Dispersion
Hydrodynamic dispersion is accountable for the divergence of
breakthrough curves (BTCs) from ideal piston flow (Hillel, 1980). Application of
the capillary tube model of Aris (1956) would predict, for a given average pore-
water velocity, the dynamic part of mechanical dispersion would decrease as the
media is desaturated. This results from the reduction in the possible range of
pore sizes as the larger pores are emptied, but this concept may be more
applicable to structured soils. Also, assumptions made from the capillary tube
model are limited in their application to soils since capillary tubes do not intersect
each other and cannot account for the increase in the tortuosity of the solute flow
path with desaturation (Maraqa et al., 1997). However, the data of James and
Rubin (1986) agree with the predictions of the capillary tube model, showing a
value for dispersivity in an unsaturated column to be three times smaller than in
the saturated case. However, preliminary column tritium data for sandy soil
suggest an increase in hydrodynamic dispersion with decreasing saturation
(Seaman et al., 2002). Results from other researchers have also shown an
increase in dispersion with decreasing saturation (Biggar and Nielsen, 1976; Yule

10
and Gardner, 1978; De Smedt and Wierenga, 1979, 1984; De Smedt et al., 1986;
Maraqa et al., 1997; Fesch et al., 1998; Jin et al., 2000; Gamerdinger and
Kaplan, 2001). De Smedt and Wierenga (1984) observed that porous media at
90% saturation or above displayed identical dispersive behavior to fully saturated
materials.
De Smedt and Wierenga (1979) assumed that hydrodynamic dispersion
retains the same value, at a given pore water velocity, regardless of the
saturation of the media. They attributed the increase in dispersion of their
unsaturated experiments to the existence of a physical nonequilibrium situation
created by solute exchange between mobile and immobile water regions. Yule
and Gardner (1978), however, reported symmetrical BTCs with what appears to
be mechanical dispersion in unsaturated media that is higher than under
saturated conditions. They speculated that this occurred because of a wider
variation in the pore water velocity distribution when the soil is desaturated.
Maraqa et al. (1997) found dispersivity for tritium under unsaturated conditions to
be higher than the value for saturated media, while De Smedt et al. (1986) found
dispersivity to be 78 times greater for unsaturated sand as opposed to saturated
sand. An experiment with the non-reactive tracer, thiourea, yielded an increase
in dispersivity (0.1 cm to 1.3 cm) with decreasing volumetric water content (0.319
to 0.168) (Fesch et al., 1998). They attributed this to the air-filled pore space
increasing the tortuosity of the solute flow path through the column. Jin et al.
(2000) found an increase in the dispersion coefficient from 0.91 to 21.78 cm2⋅hr-1
for bromide in Ottawa sand with a decrease in saturation from 100 to 21.4%,
11
respectively. Although not explicitly stated in Porro et al. (2000), it can be
inferred from Peclet numbers calculated from their data, that hydrodynamic
dispersion increased with decreasing saturation for crushed basalt.
Magesan et al. (1995) found that dispersivity was higher for intact soil
columns with weaker structure. They indicated that dispersivity may also be a
useful length scale for the assessment of soil structure.
Retardation
One of the many concerns surrounding the use of distribution coefficients
is the effect of soil moisture content. Batch studies for determining distribution
coefficients are often conducted at solid:liquid ratios much lower than those
found under natural conditions and may underestimate sorption due to the solids
effect (Celorie et al., 1989). A decrease in the distribution coefficient with an
increase in solids concentration has been observed for phenol on kaolinite and
strontium on crushed basalt (Celorie et al., 1989; Porro et al., 2000). This effect
may be due to the fact that, as the solid:liquid ratio increases, the effective
surface area accessible to solutes decreases due to particle-particle interactions.
However, the solids effect may also be explained by the inability to separate the
liquid and solid phases as the solid:liquid ratio increases. Therefore, an apparent
decrease in the distribution coefficient is observed, resulting from the analysis of
solute bound to suspended colloids in the sample present in the "liquid" phase.
Lindenmeier et al. (1995) found that Kd for U and Sr decreased 70% and
54%, respectively, with a decrease in saturation from 100% to about 28%.
Uranium sorption has been shown to decrease with decreasing water content,

12
due to rate-limited adsorption effects and faster local flow velocities present
through the mobile water regions (Gamerdinger et al., 2001a; Gamerdinger et al.,
2001b). Fesch et al. (1998) found an increase in retardation with decreasing
water content for an organic reactive tracer. They attributed this increase to the
relative increase of the number of sorption sites per water volume as the media is
desaturated.
Mobile-immobile water
The CDE may not accurately describe the physical processes that occur in
aggregated materials (Biggar and Nielsen, 1962; Green et al., 1972; van
Genuchten and Wierenga, 1977) and unsaturated media (Nielsen and Biggar,
1961; Gupta et al., 1973; Gaudet et al., 1977; De Smedt et al., 1986). A
discussion of the impact of aggregation on saturated flow is given in Passioura
(1971) and Passioura and Rose (1971), but the effects of aggregation and
immobile water are still an issue of dispute in unsaturated soils. Gaudet et al.
(1977) found a 4-40% increase in the relative amount of stagnant water with a
decrease in water content from 71-55%. A decrease in water content increases
the fraction of air-filled macro-pores, resulting in the creation of additional dead-
end or blind pores which rely on diffusion to attain equilibrium with the displacing
solution (Fatt et al., 1960; Gupta et al., 1973).
Tailing, an indication of the presence of immobile water, has been
reported to become more pronounced with an increase in pore water velocity
(Biggar and Nielsen, 1962; Skopp and Warrick, 1974; Nkedi-Kizza et al., 1983).
This could be due to the fact that with larger fluxes, the residence time of the

13
solute in the column is small, not allowing sufficient mixing to occur between the
mobile and immobile water regions. With smaller fluxes, the residence time is
greater, allowing complete mixing and the appearance that all the water in the
column is mobile (Nkedi-Kizza et al., 1983).
Methods and equipment used to evaluate solute transport
Two types of experiments are designed to evaluate the chemical
interactions of solutes and media: batch equilibration and dynamic column tests.
Batch tests are often implemented because they are relatively simple and fast
compared to conducting conventional column tests, even though column
experiments more closely approximate the solid:liquid ratio observed in natural
systems.
Column methods are effective tools for investigating solute transport
mechanisms in porous media. Most conventional column studies have been
performed under saturated conditions for measurement of hydraulic conductivity
and solute transport processes. Transport parameters measured under
saturated conditions are often extrapolated to unsaturated systems under the
assumption that processes controlling retardation are consistent. A significant
limitation of using conventional column methods is the time required in evaluating
fine-textured soils with low hydraulic conductivities (Celorie et al., 1989).
An alternative to conventional saturated systems is the use of columns
under vacuum to maintain unsaturated steady-state flow, as in the commonly
used Wierenga system. This technique utilizes tensiometers installed at both
ends of the column to monitor matric potential due to the vacuum that is applied

14
at the bottom of the column. The vacuum is controlled with a pressure regulator
until the tension along the column has equalized (van Genuchten and Wierenga,
1986). Disadvantages to using this technique include the inability to achieve a
constant moisture content below 50% of saturation, the long experimental time
required for a single breakthrough experiment, and the potential for mechanical
failure due to laboratory power outages during the extended testing period
(Lindenmeier et al., 1995).
Centrifuge techniques have also been employed to simulate unsaturated
flow through geologic materials and have the advantage of being able to obtain
stable, low water contents in a relatively short period of time, even for fine-
grained materials (Gamerdinger and Kaplan, 2000). These techniques use
centrifugal force and inlet flow rates to achieve reproducible steady-state
unsaturated flow conditions (Nimmo and Mello, 1991). In the centrifuge, soil
columns are spun at high rotational speeds that increase the gravitational effects
and simulate an in situ confining stress (Celorie et al., 1989).
The centrifuge technique, initially described by Nimmo et al., (1987; 1992),
was modified by researchers at Pacific Northwest National Laboratory (PNNL)
(Conca and Wright, 1992) to include an ultracentrifuge, rotor, and rotating seal,
which made it possible to add a treatment solution simultaneously to two soil
columns at a controlled rate while the rotor was spinning. The modified
centrifuge is referred to as an unsaturated flow apparatus or UFA (model L8-
UFA, Beckman Coulter, Inc., Fullerton, CA).

15
Centrifuge systems have been widely used in geosciences with limited
application to evaluating flow and transport processes (Celorie et al., 1989;
Gamerdinger and Kaplan, 2000). Centrifugal force has been used to measure
the hydraulic conductivity of fine-textured materials (Nimmo et al., 1987; Nimmo
and Akstin, 1988; Nimmo and Mello, 1991; Nimmo et al., 1992; Khaleel et al.,
1995), aquifer recharge rates (Nimmo et al., 1994), sorption equilibrium
distribution coefficients (Celorie et al., 1989), and other steady-state hydraulic
properties. This method has also been employed in obtaining unsaturated
hydraulic conductivity measurements (Nimmo et al., 1987; Nimmo et al., 1992;
Khaleel et al., 1995) as well as saturated hydraulic conductivity measurements
for low permeability materials (Nimmo and Mello, 1991). The UFA centrifuge
system can be used to easily simulate moisture conditions as low as 25% of
saturation (Lindenmeier et al., 1995).
Centrifugation techniques have been implemented in determining
distribution coefficients in fine-grained soils at solids concentrations
representative of those occurring in natural systems, avoiding the “solids effect”
complication observed when using batch equilibration methods (Celorie et al.,
1989). In addition, hydraulic conductivity measurements with this technique have
been made as low as 1.1 x 10⁻¹¹ m⋅s-1 at 0.068 m3⋅m-3 water content for a sandy
soil (Nimmo et al., 1992).
Possible problems and disadvantages associated with centrifuge column
methods are maintaining stable water content along the length of the column,
physical compaction problems due to the centrifugal forces, and disruption of

16
solute transport processes during necessary stoppage for collection of effluent
samples.
Water content has been reported as stable throughout the soil column in
centrifuge experiments except for the final segment at the outflow, in contact with
the water-absorbent filter paper (Gamerdinger and Kaplan, 2000).
Soil compaction has been noted when using centrifugation techniques
(Khaleel et al., 1995), but has mainly been limited to fine-textured sediments
(Nimmo et al., 1994; Gamerdinger and Kaplan, 2000; Gamerdinger et al.,
2001b). Soil compaction due to the centrifuge technique has been observed to
effect the transport of sorbing solutes (Gamerdinger et al., 2001a), but not non-
sorbing solutes (Gamerdinger and Kaplan, 2000).
Gamerdinger and Kaplan (2000) compared BTCs generated with
centrifuge techniques to conventional saturated columns for non-sorbing solutes.
They found little difference in solute transport behavior, indicating that stopping
the centrifuge for effluent sampling had little effect because minimal water
redistribution occurred within the unsaturated soil in the absence of the
centrifugal force. Changes in the behavior of sorbing solutes, however, can be
attributed to the increased reaction time when flow is interrupted (Gamerdinger et
al., 2001a; Gamerdinger et al., 2001b).
It has also been of concern whether the CDE is appropriate for columns of
short length such as those used in the UFA. However, Magesan et al. (1995)
found that chloride breakthrough in columns 3.7 cm long and 7.3 cm in diameter
were adequately described by the CDE. Based on this finding, the BTCs

17
generated with the 5-cm long UFA columns in this study should be adequately
described by the CDE.
Since few studies have focused on unsaturated solute transport, the
Wierenga and the UFA systems present an opportunity to examine transport
parameters under a range of moisture contents. Limited data have been
obtained comparing unsaturated transport in these two systems (Lindenmeier et
al., 1995).
Effect of sample preparation
Variation in solute sorption as a function of water content may be
indicative of the physical distribution of reactive mineral surfaces within the
column. McMahon and Thomas (1974) found that physical disruption in
repacked soil columns significantly affected migration and retardation of tracers
compared to undisturbed columns. Sample preparation and treatment has been
shown to alter bromide retardation due to the exposure of fresh mineral surfaces
resulting from particle abrasion and fracturing during sample collection or
changes in particle surface chemistry from the drying of soils prior to use in
columns (Boggs and Adams, 1992; Seaman et al., 1995). The disruption of a
soil by air-drying and sieving caused a slight decrease in the apparent dispersion
coefficient compared to undisturbed loam soil cores (Cassel et al., 1974).
The degree of saturation in each column may affect the number and type
of surfaces that are available for sorption. Desaturation of the media may restrict
solute movement to a smaller number of available surfaces, while different types
of sorption surfaces (phyllosilicate clay, iron oxides, etc.) may "dehydrate" and

18
become unavailable for sorption at different water contents. Also, while iron
oxides and kaolinite (1:1 layer phyllosilicate mineral) may exhibit positively
charged surfaces that attract anions under conditions of low pH, 2:1 phyllosilicate
mineral surfaces remain largely negatively charged at low pH due to isomorphic
substitution and may produce anion exclusion (Hanes, 1971). Therefore, the
treatment and disruption of mineral surfaces in packed columns may affect the
competing processes of adsorption and anion exclusion.
Tracers
Tracers such as bromide (Br-), chloride (Cl-) and fluorobenzoates (FBA),
are still used as nonreactive tracers in laboratory experiments (Stollenwerk and
Grove, 1985; Gamerdinger and Kaplan, 2000; Porro et al., 2000; Al-Jabri et al.,
2002) despite evidence of significant anion retardation in oxide-rich materials
(McMahon and Thomas, 1974; Boggs and Adams, 1992; Seaman et al., 1995;
Seaman et al., 1996; Seaman, 1998) and anion exclusion in other materials
(Corey et al., 1963; Thomas and Swoboda, 1970; James and Rubin, 1986;
Wierenga and van Genuchten, 1989; Goncalves et al., 2001). Therefore,
incorrect assumption of conservative tracer behavior (R = 1), can lead to
misinterpretation of chemical sorption of the solute to the matrix and can have a
significant impact on calculated hydrodynamic dispersion.
Anion exclusion has been found to increase with decreasing water content
(James and Rubin, 1986). Biggar and Nielsen (1962) observed an early
breakthrough in tritium and chloride curves with a decrease in water content from
saturation to 98% of saturation. A competing process to the increase in anion

19
exclusion with decreasing water content would be the effect of the increased
ionic strength of the soil solution as the soil becomes desaturated. This
decreases the size of the double layer and acts to decrease the anion exclusion
effects (de Haan, 1965; Thomas and Swoboda, 1970). James and Rubin (1986)
found that the ratio of the solute velocity over the average water velocity
increased significantly with lower water contents. The anion velocity has been
shown to be 37% (Thomas and Swoboda, 1970) and 45% (McMahon and
Thomas, 1974) greater than the average water velocity under saturated
conditions. If the findings of James and Rubin (1986) apply to these studies, the
average anion velocity in the unsaturated soil could be twice that of the average
water velocity. Therefore, basing arrival time of anionic pollutants on average
water velocity could be off by a factor of two.
Tritium (3H) has been used as a conservative tracer to simulate water
movement in soils (Biggar and Nielsen, 1962; Corey et al., 1963; James and
Rubin, 1986; Boggs and Adams, 1992; Grindrod et al., 1996) since, when
present in soil solution, it is primarily incorporated in water molecules, being
negligibly affected by chemical interactions with the soil (Corey and Horton,
1968). However, tritium BTCs have been shown to exhibit tailing and retardation
in sandstone, attributed to exchange with crystal-lattice hydroxyls (Wierenga et
al., 1975).
Chromium exists in two oxidation states in soils: III (Cr3+ cation and CrO2-
anion) and VI (Cr2O72- and CrO4
2-) (Bartlett and Kimble, 1976), with the trivalent
oxidation state being the more stable form. Of the two forms in nature, the

20
trivalent form is relatively benign and the hexavalent form is relatively toxic. The
Environmental Protection Agency’s Maximum Contamination Level for chromium
in drinking water is 0.1 ppm, but does not distinguish between oxidation states.
Chromate [Cr(VI)] is adsorbed by soil colloids such as Fe and Al oxides
(Davis and Leckie, 1980; Honeyman, 1984; Zachara et al., 1987), kaolinite
(Griffin et al., 1977; Zachara et al., 1988), and to a lesser extent montmorillonite
(Honeyman, 1984; Rai et al., 1988) via surface complexation. Chromate sorption
increases with decreasing pH and is affected by anion competition with species
such as sulfate, dissolved inorganic C (Leckie et al., 1980; Zachara et al., 1987;
Zachara et al., 1988), and phosphate (Aide and Cummings, 1997). Maximum
adsorption by boehmite, an Al-oxyhydroxide mineral, was observed at pH 4.5 in
batch equilibration studies (Aide and Cummings, 1997).
Modeling
Modeling transport processes is essential to estimating the risk or fate of
solutes present in the vadose zone. However, a major limiting factor in modeling
these contaminants is estimating physical and chemical parameters controlling
transport processes occurring under variably-saturated conditions (Kool et al.,
1987). Goncalves et al. (2001) developed pedotransfer functions (PTFs) which
predict solute transport parameters from basic soil data, including particle size,
bulk density, pH, porosity, water retention parameters, and saturated hydraulic
conductivity. They found that predictions of R and logω were not descriptive (r2 =
0.57 and 0.49), while more accurate predictions were reached for log D and β

21
values (r2 = 0.94 and 0.87), using water retention and saturated hydraulic
conductivity data.
Selection of the proper model is important when estimating transport
parameters if the derived terms are assumed to have any mechanistic
significance. If a model which assumes physical equilibrium (all water is mobile)
is used to describe solute transport through a porous medium with stagnant
water, the model simulation will yield small P and R values that will indicate a
negative adsorption (Nkedi-Kizza et al., 1983).
Fesch et al. (1998) used CXTFIT to examine the effects of moisture
content on sorbing organic compounds and found that a well parameterized
transport model calibrated under saturated conditions was able to describe rate-
limited advective-dispersive transport of reactive solutes under unsaturated
steady-state conditions. Further information on successful predictions of solute
movement would prove beneficial in the area of risk assessment.
Agreement between model simulations and experimental data is generally
taken as a verification of the conceptual processes which form the basis of the
model (Nkedi-Kizza et al., 1983).
Objectives
The objectives of this research are to (1) evaluate the impact of water
content on the hydrodynamic dispersion of a conservative tracer (tritium) under
unsaturated conditions using both the Wierenga and UFA column systems; (2)
evaluate the impact of water content on the sorption properties of tracers such as
bromide that are often assumed to be conservative; (3) evaluate the impact of

22
water content on the sorption properties of Cr(VI) under various water contents;
(4) implement modeling approaches to simulate various unsaturated solute
transport processes occurring during the study.
Notation
C solute concentration (M⋅L-3) D hydrodynamic dispersion coefficient (L2⋅T-1) De effective molecular diffusion coefficient (L2⋅T-1) Do effective molecular diffusion coefficient in free solution (L2⋅T-1) Jw volumetric water flux (L⋅T-1) Kd distribution coefficient (L3⋅M-1) L column length (L) Le actual flow path length through soil column (L) m mass of the sorbent (M) P Peclet number R retardation factor S degree of saturation Se effective saturation Sr residual saturation t time (T) v average pore water velocity (L⋅T-1) Vgw velocity of carrier fluid (L⋅T-1) Vsp velocity of solute (L⋅T-1) x mass of the adsorbed solute (M) z distance (L) β fraction of mobile water γ exchange rate coefficient (T-1) λ dispersivity (L) θ volumetric water content (L3⋅L-3) θm mobile volumetric water content (L3⋅L-3) ρb dry bulk density (M⋅L-3) τ tortuosity factor τS tortuosity factor for unsaturated media τS=1 tortuosity factor for saturated media ω mass transfer coefficient
References
Aide, M. T. and M. F. Cummings. 1997. The influence of pH and phosphorus on the adsorption of chromium (VI) on boehmite. Soil Sci. 162:599-603.

23
Al-Jabri, S. A., R. Horton and D. B. Jaynes. 2002. A point-source method for rapid simultaneous estimation of soil hydraulic and chemical transport properties. Soil Sci. Soc. Am. J. 66:12-18.
Aris, R. 1956. On the dispersion of a solute in a fluid flowing through a tube. Proc. R. Soc. A. 235:67-77.
Bartlett, R. J. and J. M. Kimble. 1976. Behavior of chromium in soils: II. Hexavalent forms. J. Environ. Qual. 5:383-386.
Bear, J. 1969. Hydrodynamic dispersion. In R. J. M. DeWiest(ed.) Flow through porous media. Academic Press, New York, 530 pp.
Biggar, J. W. and D. R. Nielsen. 1962. Miscible displacement: II. Behavior of tracers. Soil Sci. Soc. Am. Proc. 26:125-128.
Biggar, J. W. and D. R. Nielsen. 1976. Spatial variability of the leaching characteristics of a field soil. Water Resour. Res. 12:78-84.
Boggs, J. M. and E. E. Adams. 1992. Field study of dispersion in a heterogeneous aquifer 4. Investigation of adsorption and sampling bias. Water Resour. Res. 28:3325-3336.
Bond, W. J. and P. J. Wierenga. 1990. Immobile water during solute transport in unsaturated sand columns. Water Resour. Res. 26:2475-2481.
Bouwer, H. 1991. Simple derivation of the retardation equation and application of preferential flow and macrodispersion. Ground Water 29:41-46.
Burdine, N. T. 1953. Relative permeability calculations from pore size distribution data. Trans. AIME 198:71-77.
Cassel, D. K., T. H. Krueger, F. W. Schroer and E. B. Norum. 1974. Solute movement through disturbed and undisturbed soil cores. Soil Sci. Soc. Am. Proc. 38:36-40.
Celorie, J. A., S. L. Woods, T. S. Vinson and J. D. Istok. 1989. A comparison of sorption equilibrium distribution coefficients using batch and centrifugation methods. J. Environ. Qual. 18:307-313.
Coats, K. H. and B. D. Smith. 1964. Dead end pore volume and dispersion in porous media. Soc. Pet. Eng. J. 4:73-84.
Conca, J. L. and J. Wright. 1992. Hydrostratigraphy and recharge distributions from direct measurement of hydraulic conductivity using the UFA method. PNL-9424. Pacific Northwest Laboratory, Richmond, WA.
Corey, J. C., D. R. Nielsen and J. W. Biggar. 1963. Miscible displacement in saturated and unsaturated sandstone. Soil Sci. Soc. Am. Proc. 27:258-262.
Corey, J. C. and J. H. Horton. 1968. Movement of water tagged with 2H, 3H, and 18O through acidic kaolinitic soil. Soil Sci. Soc. Am. Proc. 32:471-475.
Davis, J. A. and J. O. Leckie. 1980. Surface ionization and complexation at the oxide/water interface: 3. Adsorption of anions. J. Colloid Interface Sci. 74:32-42.
de Haan, F. A. 1965. The interaction of certain inorganic anions with clays and soils. Agr. Res. Reports No. 655, 167 pp.
De Smedt, F. and P. J. Wierenga. 1979. Mass transfer in porous media with immobile water. J. Hydrol. 41:59-67.

24
De Smedt, F. and P. J. Wierenga. 1984. Solute transfer though columns of glass beads. Water Resour. Res. 20:225-232.
De Smedt, F., F. Wauters and J. Sevilla. 1986. Study of tracer movement through unsaturated sand. J. Hydrol. 85:169-181.
Deans, H. A. 1963. A mathematical model for dispersion in the direction of flow in porous media. Trans. AIME 225:49-52.
Fatt, I., R. G. Goodknight and W. A. Klikoff. 1960. Non-steady state fluid flow and diffusion in porous media containing dead end pore volume. J. Phys. Chem. 64:1162-1168.
Fesch, C., P. Lehmann, S. B. Haderlein, C. Hinz, R. P. Schwarzenbach and H. Fluhler. 1998. Effect of water content on solute transport in a porous medium containing reactive micro-aggregates. J. Cont. Hydrol. 33:211-230.
Freeze, R. A. and J. A. Cherry. 1979. Groundwater. Prentice-Hall, Englewood Cliffs, NJ.
Gamerdinger, A. P. and D. I. Kaplan. 2000. Application of a continuous-flow centrifugation method for solute transport in disturbed, unsaturated sediments and illustration of mobile-immobile water. Water Resour. Res. 36:1747-1755.
Gamerdinger, A. P. and D. I. Kaplan. 2001. Physical and chemical determinants of colloid transport and deposition in water-unsaturated sand and Yucca Mountain tuff material. Environ. Sci. Technol. 35:2497-2504.
Gamerdinger, A. P., D. I. Kaplan, D. M. Wellman and R. J. Serne. 2001a. Two-region flow and decreased sorption of uranium (VI) during transport in Hanford groundwater and unsaturated sands. Water Resour. Res. 37:3155-3162.
Gamerdinger, A. P., D. I. Kaplan, D. M. Wellman and R. J. Serne. 2001b. Two-region flow and rate-limited sorption of uranium (VI) during transport in an unsaturated silt loam. Water Resour. Res. 37:3147-3153.
Gaudet, J. P., H. Jegat, G. Vachaud and P. J. Wierenga. 1977. Solute transfer, with exchange between mobile and stagnant water, through unsaturated sand. Soil Sci. Soc. Am. J. 41:665-670.
Goncalves, M. C., F. J. Leij and M. G. Schaap. 2001. Pedotransfer functions for solute transport parameters of Portuguese soils. Eur. J. Soil Sci. 52:563-574.
Green, R. E., P. S. C. Rao and J. C. Corey. 1972. Solute transport in aggregated soil: Tracer zone shape in relation to pre-velocity distribution and adsorption. Proc. 2nd Symp. on Fundamentals of Transport Phenomena in Porous Media, Guelph, Ont., Aug. 7-11, IAHR-ISSS, 732-752.
Griffin, R. A., A. K. Au and R. R. Frost. 1977. Effect of pH on adsorption of chromate from landfill-leachate by clay minerals. J. Environ. Sci. Health 12:431-449.
Grindrod, P., M. S. Edwards, J. J. W. Higgo and G. M. Williams. 1996. Analysis of colloid and tracer breakthrough curves. J. Cont. Hydrol. 21:243-253.

25
Gupta, R. K., R. J. Millington and A. Klute. 1973. Hydrodynamic dispersion in unsaturated porous media I. Concentration distribution during dispersion. J. Ind. Soc. Soil Sci. 21:1-7.
Hamaker, J. W. 1975. The interpretation of soil leaching experiments. In R. Haque and V. H. Freed(ed.) Environmental dynamics of pesticides. Plenum Press, New York, 115-135.
Hanes, R. E. 1971. Chloride behavior in soils. Ph. D. dissertation, VA Polytech. Inst. and State Univ., Blacksburg, VA
Hillel, D. 1980. Fundamentals of soil physics. Academic Press, Inc., San Diego, CA.
Honeyman, B. D. 1984. Cation and anion adsorption at the oxide/solution interface in systems containing binary mixtures of adsorbents: An investigation of the concept of adsorptive additivity. Ph. D. dissertation, Stanford Univ., Stanford, CA (Diss. Abstr. 84-20552).
James, R. V. and J. Rubin. 1986. Transport of chloride ion in a water-unsaturated soil exhibiting anion exclusion. Soil Sci. Soc. Am. J. 50:1142-1149.
Jardine, P. M., S. E. Fendorf, M. A. Mayes, I. L. Larsen, S. C. Brooks and W. B. Bailey. 1999. Fate and transport of hexavalent chromium in undisturbed heterogeneous soil. Environ. Sci. Technol. 33:2939-2944.
Jin, Y., Y. Chu and Y. Li. 2000. Virus removal and transport in saturated and unsaturated sand columns. J. Cont. Hydrol. 43:111-128.
Khaleel, R., J. F. Relyea and J. L. Conca. 1995. Evaluation of van Genuchten-Mualem relationships to estimate unsaturated hydraulic conductivity at low water contents. Water Resour. Res. 31:2659-2668.
Kool, J. B., J. C. Parker and M. T. van Genuchten. 1987. Parameter estimation for unsaturated flow and transport models - A review. J. Hydrol. 91:255-293.
Krupp, H. K. and D. E. Elrick. 1968. Miscible displacement in an unsaturated glass beads medium. Water Resour. Res. 4:809-815.
Krupp, H. K., J. W. Biggar and D. R. Nielsen. 1972. Relative flow rates of salt and water through soil. Soil Sci. Soc. Am. Proc. 38:727-732.
Langmuir, D. 1997. Aqueous environmental geochemistry. Prentice-Hall, Upper Saddle River, NJ.
Lapidus, L. and N. R. Amundson. 1952. A descriptive theory of leaching. Mathematics of adsorptive beds. J. Phys. Chem. 56:984-988.
Leckie, J. O., M. M. Benjamin, K. Hayes, G. Kaufman and S. Altman. 1980. Adsorption/coprecipitation of trace elements from water with iron oxyhydroxide. EPRI-RP-910. Electric Power Res. Inst. Rept., Palo Alto, CA.
Lindenmeier, C. W., R. J. Serne, J. L. Conca, A. T. Wood and M. I. Wood. 1995. Solid waste and leach characteristics and contaminant-sediment interactions Volume 2: Contaminant transport under unsaturated moisture conditions. PNL-10722. Pacific Northwest Laboratory, Richland, WA.
Maciejewski, S. 1993. Numerical and experimental study of solute transport in unsaturated soils. J. Cont. Hydrol. 14:193-206.

26
Magesan, G. N., I. Vogeler, D. R. Scotter, B. E. Clothier and R. W. Tillman. 1995. Solute movement through two unsaturated soils. Aust. J. Soil Res. 33:585-596.
Maraqa, M. A., R. B. Wallace and T. C. Voice. 1997. Effects of degree of water saturation on dispersivity and immobile water in sandy soil columns. J. Cont. Hydrol. 25:199-218.
McMahon, M. A. and G. W. Thomas. 1974. Chloride and tritriated water flow in disturbed and undisturbed soil cores. Soil Sci. Soc. Am. Proc. 38:727-732.
Nielsen, D. R. and J. W. Biggar. 1961. Miscible displacement in soils: I. Experimental information. Soil Sci. Soc. Am. Proc. 25:1-5.
Nielsen, D. R., M. T. van Genuchten and J. W. Biggar. 1986. Water Resour. Res. 22:89-108.
Nimmo, J. R., J. Rubin and D. P. Hammermeister. 1987. Unsaturated flow in a centrifugal field: Measurement of hydraulic conductivity and testing of Darcy's Law. Water Resour. Res. 23:124-134.
Nimmo, J. R. and K. C. Akstin. 1988. Hydraulic conductivity of a sandy soil at low water content after compaction by various methods. Soil Sci. Soc. Am. J. 52:303-310.
Nimmo, J. R. and K. A. Mello. 1991. Centrifugal techniques for measuring saturated hydraulic conductivity. Water Resour. Res. 27:1263-1269.
Nimmo, J. R., K. C. Akstin and K. A. Mello. 1992. Improved apparatus for measuring hydraulic conductivity at low water content. Soil Sci. Soc. Am. J. 56:1758-1761.
Nimmo, J. R., D. A. Stonesstrom and K. C. Akstin. 1994. The feasibility of recharge rate determinations using the steady-state centrifuge method. Soil Sci. Soc. Am. J. 58:49-56.
Nkedi-Kizza, P., J. W. Biggar, M. T. van Genuchten, P. J. Wierenga, H. M. Selim, J. M. Davidson and D. R. Nielsen. 1983. Modeling tritium and chloride 36 transport through an aggregated oxisol. Water Resour. Res. 19:691-700.
Parker, J. C. and M. T. van Genuchten. 1984. Determining transport parameters from laboratory and field tracer experiments. Bull. 84-3. Va. Polytech Inst., Va. Agric. Exp. Stn., Blacksburg, VA.
Passioura, J. B. 1971. Hydrodynamic dispersion in aggregated media. Soil Sci. 111:339-344.
Passioura, J. B. and D. L. Rose. 1971. Hydrodynamic dispersion in aggregated media 2. Effects of velocity and aggregate size. Soil Sci. 111:345-351.
Porro, I., M. E. Newman and F. M. Dunnivant. 2000. Comparison of batch and column methods for determining strontium distribution coefficients for unsaturated transport in basalt. Environ. Sci. Technol. 34:1679-1686.
Powers, S. E., A. M. Abriola and J. Weber, W. B. 1992. An experimental investigation of nonaqueous phase liquid dissolution in saturated subsurface systems: Steady state mass transfer rates. Water Resour. Res. 28:2691-2705.
Rai, D., J. M. Zachara, L. E. Eary, C. C. Ainsworth, J. E. Amonette, C. E. Cowan, R. W. Szelmeczka, C. T. Resch, R. L. Schmidt, S. C. Smith and D. C.

27
Girvin. 1988. Chromium reactions in geologic materials. EA-5741. Electric Power Res. Inst. Rept., Palo Alto, CA.
Sahimi, M., H. T. Davis and L. E. Scriven. 1983. Dispersion in disordered porous media. Chem. Eng. Commun. 23:329-341.
Seaman, J. C., P. M. Bertsch and W. P. Miller. 1995. Ionic tracer movement through highly weathered sediments. J. Cont. Hydrol. 20:127-143.
Seaman, J. C., P. M. Bertsch, S. F. Korom and W. P. Miller. 1996. Physiochemical controls on nonconservative anion migration in coarse-textured alluvial sediments. Ground Water 34:778-783.
Seaman, J. C. 1998. Retardation of fluorobenzoate tracers in highly weathered soil and groundwater systems. Soil Sci. Soc. Am. J. 62:354-361.
Seaman, J. C., S. A. Aburime, J. M. Hutchison and J. Singer. 2002. Evaluating vadose transport processes using centrifugation methods. In National Conference on Environmental Science and Technology. Battelle Press Publishing, Greensboro, NC.
Shackelford, C. D. 1991. Laboratory diffusion testing for waste disposal - A review. J. Cont. Hydrol. 7:177-217.
Skopp, J. and A. W. Warrick. 1974. A two-phase model for the miscible displacement of reactive solutes in soils. Soil Sci. Soc. Am. J. 38:525-550.
Smiles, D. E., K. M. Perroux, S. J. Zegelin and P. A. C. Raats. 1981. Hydrodynamic dispersion during constant rate adsorption of water by soil. Soil Sci. Soc. Am. J. 45:453-458.
Stollenwerk, K. G. and D. B. Grove. 1985. Adsorption and desorption of hexavalent chromium in an alluvial aquifer near Telluride, Colorado. J. Environ. Qual. 14:150-155.
Thomas, G. W. and A. R. Swoboda. 1970. Anion exclusion effects on chloride movement in soils. Soil Sci. 110:163-166.
Turner, G. A. 1958. The flow structure in packed beds. Chem. Eng. Sci. 7:156-165.
van Genuchten, M. T. and P. J. Wierenga. 1977. Mass transfer studies in sorbing porous media: II. Experimental evaluation with tritium (3H2O). Soil Sci. Soc. Am. J. 41:272-277.
van Genuchten, M. T. and P. J. Wierenga. 1986. Solute dispersion coefficients and retardation factors. In Methods of Soil Analysis, Part I. Physical and mineralogical methods. American Society of Agronomy, Madison, WI, 1025-1054.
Wierenga, P. J., M. T. van Genuchten and F. W. Boyle. 1975. Transfer of boron and tritriated water through sandstone. J. Environ. Qual. 4:83-87.
Wierenga, P. J. and M. T. van Genuchten. 1989. Solute transport through small and large unsaturated soil columns. Ground Water 27:35-42.
Yule, D. F. and W. R. Gardner. 1978. Longitudinal and transverse dispersion coefficients in unsaturated Plainfield sand. Water Resour. Res. 14:582-588.
Zachara, J. M., D. C. Girvin, R. L. Schmidt and C. T. Resch. 1987. Chromate adsorption on amorphous iron oxyhydroxide in the presence of major groundwater ions. Environ. Sci. Technol. 21:589-594.

28
Zachara, J. M., C. E. Cowan, R. L. Schmidt and C. C. Ainsworth. 1988. Chromate adsorption by kaolinite. Clays Clay Miner. 36:317-326.

29
CHAPTER 2
SOLUTE TRANSPORT IN VARIABLY-SATURATED SOIL1
____________________________
1Hutchison, J. M., J. C. Seaman, S. A. Aburime, and D. E. Radcliffe. To be
submitted to Vadose Zone Journal.

30
Abstract
Most subsurface contamination passes through the unsaturated zone
before reaching an aquifer; however, many transport studies are conducted
under saturated conditions that may not approximate the natural system under
which solute transport occurs. Chromate migration was measured in sediment
obtained from the Savannah River Site, SC under different water contents using
vacuum and centrifuge techniques to obtain a steady-state flow regime.
Leaching solutions contained 0.5 or 1.0 mM Cr(VI) and tritium in artificial
groundwater. Breakthrough curves were modeled using CXTFIT assuming
equilibrium conditions. Evaluation of data using a "two-region" physical
nonequilibrium model confirmed that immobile water either did not exist or did not
play a significant role in solute transport. Dispersion increased with decreasing
water content and increasing pore water velocity, yielding a constant dispersivity
value of 4.2 cm. Retardation generally increased with decreasing water content
with no trend evident when Kd was calculated from R. The average Kd of all
Cr(VI) experiments was 0.551 mL⋅g-1, very similar to the Kd derived from batch
equilibration (0.599 mL⋅g-1). Though results in both systems were similar,
experiment duration in the vacuum system was 4 to 23 times longer than in the
centrifuge system at comparable water contents. The centrifuge system also
allowed column experiments to be run under a lower range in water content than
the vacuum column system.

31
Introduction
Studies evaluating solute transport processes in the vadose zone yield
important information for situations in which chemical wastes are disposed of at
or below the land surface. Despite the fact that virtually all subsurface
contamination must pass through the unsaturated vadose zone before reaching
an aquifer, most studies have only focused on processes occurring under
saturated conditions (Thomas and Swoboda, 1970; Passioura and Rose, 1971;
Nkedi-Kizza et al., 1983; Powers et al., 1992; Jardine et al., 1999). This is
partially due to the difficulty in maintaining steady-state flow and moisture content
necessary for the controlled study of solute transport processes under
unsaturated conditions. Furthermore, measurements made under saturated
conditions may not approximate the conditions of the natural system under which
solute transport occurs.
Differences in moisture content can influence solute migration by limiting
diffusion and decreasing the pore space available for transport. Due to capillary
forces, small pores tend to remain water-filled, while larger pores drain readily.
In addition, the degree of saturation may also influence the availability of surface
sites for reaction with the transported solutes, influencing the apparent
retardation. Therefore, it is important to study the effect of moisture content on
various parameters used in predicting solute transport.
The convective-dispersive equation (CDE) (Lapidus and Amundson, 1952)
was developed in an attempt to quantify solute transport processes for one-

32
dimensional steady-state flow in a homogeneous soil column and is described by
the equation:
zCv
zCD
tCR
∂∂−
∂∂=
∂∂
2
2
[1]
where R is the retardation factor, C is the concentration (M L-3), D is the
hydrodynamic dispersion coefficient (L2 T-1), v is the average pore-water velocity
(L T-1), z is distance, and t is time. In order for this equation to be valid, it is
assumed that all the fluid participates in the transport process.
Table 1 includes a summary of some studies evaluating the effect of
moisture content on various transport parameters. Table 2 lists transport
parameters, the equations pertaining to their use, and the documented changes
of that parameter with decreasing water content. These tables will be used to
discuss the effect of water content on solute transport parameters.
Dispersion has been shown to increase (Biggar and Nielsen, 1976; Yule
and Gardner, 1978; De Smedt and Wierenga, 1979, 1984; De Smedt et al., 1986;
Maraqa et al., 1997; Fesch et al., 1998; Jin et al., 2000; Gamerdinger and
Kaplan, 2001) or decrease (James and Rubin, 1986) with a decrease in water
content. An increase in dispersion with decreasing water content may be
attributed to the existence of physical nonequilibrium including regions of
immobile water, a wider variation in pore water velocities when the media is
desaturated, or the increase in air-filled pore space that increases the tortuosity
of the solute flow path with desaturation. James and Rubin (1986) comment that
a decrease in dispersion with decreasing water content could be the result of a

33
reduction in the possible range in pore sizes as the larger pores are emptied,
though this explanation may be more applicable to structured soils.
The retardation factor is often estimated from the distribution coefficient,
Kd, derived from batch equilibration studies through the equation:
θ
ρ db
KR += 1 [2]
where ρb is the dry bulk density and θ is the water content. However, retardation
coefficients observed in column studies often differ from values determined by
batch equilibration.
Lindenmeier et al. (1995) found that Kd for U and Sr decreased 70% and
54%, respectively, with a decrease in saturation from 100% to about 28%.
Uranium sorption has been shown to decrease with decreasing water content,
due to rate-limited adsorption effects and faster local flow velocities present
through the mobile water regions (Gamerdinger et al., 2001a; Gamerdinger et al.,
2001b). Fesch et al. (1998) found an increase in retardation with decreasing
water content for an organic reactive tracer. They attributed this increase to the
relative increase of the number of sorption sites per water volume as the media is
desaturated.
An alternative to conventional saturated systems is the use of columns
under vacuum to maintain unsaturated steady-state flow, as in the commonly
used Wierenga system. Disadvantages to using this technique include the
inability to achieve a constant moisture content below 50% of saturation, the long
experimental time required for a single breakthrough experiment, and the
potential for mechanical failure due to laboratory power outages during the

34
extended testing period (Lindenmeier et al., 1995). Centrifuge techniques have
also been employed to simulate unsaturated flow through geologic materials and
have the advantage of being able to obtain stable, low water contents in a
relatively short period of time, even for fine-grained materials (Gamerdinger and
Kaplan, 2000). The centrifuge technique, initially described by Nimmo et al.
(1987; 1992), was modified by researchers at Pacific Northwest National
Laboratory (PNNL) (Conca and Wright, 1992) and is referred to as an
unsaturated flow apparatus or UFA (model L8-UFA, Beckman Coulter, Inc.,
Fullerton, CA). Possible problems and disadvantages associated with centrifuge
column methods are maintaining stable water content along the length of the
column, physical compaction problems due to the centrifugal forces, and
disruption of solute transport processes during necessary stoppage for collection
of effluent samples. Limited data have been obtained comparing unsaturated
transport in these two systems (Lindenmeier et al., 1995). Since few studies
have focused on unsaturated solute transport, the Wierenga and the UFA
systems present an opportunity to examine transport parameters over a range of
moisture contents.
The objectives of this research are to (1) evaluate the impact of water
content on the hydrodynamic dispersion of a conservative tracer (tritium) under
unsaturated conditions using both the Wierenga and UFA column systems; (2)
evaluate the impact of water content on the sorption properties of tracers such as
bromide that are often assumed to be conservative; (3) evaluate the impact of
water content on the sorption properties of Cr(VI) under various water contents;

35
and (4) implement modeling approaches to simulate various unsaturated solute
transport processes occurring during the study.
Materials and methods
Soil
A coarse-textured, vadose zone sediment from the Tobacco Road
Formation, displaying characteristics typical of the Atlantic Coastal Plain, was
collected on the Department of Energy’s Savannah River Site (SRS) near Aiken,
SC (Table 3). Samples were air-dried and sieved prior to batch or column
experiments. Percent moisture of the air-dried soil was found to be less than 1%.
The material is coarse in texture (92.65 % sand) and has a citrate-dithionite-
bicarbonate extractable Fe content of 0.37g per 100g soil. Kaolinite was found to
be the primary clay mineral, but the clay fraction also contains quartz, goethite,
and trace amounts of mica, gibbsite, and hematite. The relationship between
hydraulic conductivity (K) and water content was determined for this soil using
the UFA (Figure 1).
Solutions
All solutions for adsorption isotherms and column studies were prepared
in artificial groundwater (AGW). The AGW, based on routine groundwater
monitoring data from the SRS (Strom and Kaback, 1992), contains the following
(mg⋅L-1): 1.00 Ca2+, 0.37 Mg2+, 0.21 K+, 1.40 Na+, and 0.73 SO42-. The
conservative tracer for all column studies was tritium, which has a diffusion
coefficient in water of 1.97 x 10⁻⁹ m2⋅s-1 at 20 °C (Mills and Harris, 1976).

36
Bromide and chromate solutions were prepared from reagent-grade KBr and
K2Cr2O7, respectively.
Batch sorption isotherm
Batch sorption isotherms were completed prior to column experiments to
determine the range over which Cr(VI) sorption was linear. Chromate
concentrations were then selected such that sorption was relatively moderate.
This would ensure that sorption would be high enough to be easily measured, but
not too high as to significantly lengthen experiment duration.
Five-gram samples of the soil were weighed into centrifuge tubes with four
treatment replicates. Thirty milliliters of solution containing 0.0, 0.5, 1.0, 1.5, or
2.0 mM of Cr(VI) was added to the appropriate tubes. As a control, equivalent
treatment levels were replicated in soil-free tubes to account for Cr(VI) losses in
the absence of the sorbing matrix. The tubes were placed on a reciprocating
shaker for about 18 hours. Previous studies on similar sediment materials
indicated that this was sufficient time to achieve equilibrium with respect to Cr(VI)
sorption (Seaman et al., 1999).
After equilibration, the tubes were centrifuged for 15 minutes at 15,000
rpm. The supernatant was then passed through a 0.22 µm pore size nylon
membrane filter prior to Cr(VI) analysis using the diphenylcarbazide method with
a detection limit of about 0.1 µM (Clesceri et al., 1989). Cr(VI) concentrations
were compared to the soil-free equivalents to determine sorption based on their
difference.

37
Vacuum-based transport experiments
The vacuum-based column experiments were conducted following the
procedure of van Genuchten and Wierenga (1986). The equipment was
obtained from Soil Measurement Systems, Tucson, AZ (Figure 2). The system
consists of a peristaltic pump, soil column, vacuum chamber, vacuum pump and
regulator, and a fraction collector. The columns were constructed of plexiglass
(30.5 cm in length by 2.5 cm internal diameter) with bolted flanges at both ends
and two tensiometers installed approximately 2.5 cm from each end. For
unsaturated experiments, the lower end of the column had a 1.2 µm pore size
membrane filter with a bubbling pressure of greater than 600 millibars while the
upper end of the column had a 30 µm pore size nylon membrane filter with a
bubbling pressure of 30 millibars. For saturated experiments, 30 µm pore size
nylon membrane filters were used at both ends of the column.
Columns were packed with air-dried soil by adding the soil in
approximately 1-cm increments and tapping lightly. Care was taken to avoid
obvious layering of the material or segregation of the soil by particle size. The
bulk density was calculated as the weight of solid added to the column per unit of
column volume.
Columns were saturated slowly from bottom to top with AGW at flow rates
less than or equal to 0.065 mL⋅min-1 to minimize the amount of entrapped air in
the column. Water content at saturation was determined by weighing the column
before and after saturation. Once saturated, the inlet solution line was switched
to the top of the column and the bottom of the column was secured to the

38
vacuum chamber. Artificial groundwater flow was established at the top of the
column with vacuum applied to the bottom of the column through the vacuum
chamber. The vacuum was then adjusted with a pressure regulator until a
desired stable water content was achieved. Column tensiometer data were
erratic and could be not used to indicate uniform water potential. Therefore,
water content was determined by weighing the column once an equilibrium value
was reached. The column was also weighed at the end of the experiment to
ensure the persistence of a stable water content. Since tensiometer data could
not to be used to ensure stable water distributions along the length of the
columns, two columns were segmented and sampled for water content at the
conclusion of the experiment. The flow rates and vacuum settings necessary to
achieve a given degree of saturation are summarized in Appendix A.
Once a uniform moisture distribution was achieved, the inlet solution was
switched to the tracer solution containing tritium and either chromate [Cr(VI)] or
bromide (Br). The two concentrations used for Cr(VI) were: 0.5 and 1.0 mM,
while 1.0 mM KBr was used for all bromide experiments. When possible, the
inlet solution was displaced through the column until the tracer concentration in
the effluent was equivalent to that in the inlet solution. At this point, the inlet
solution was switched back to AGW and leached through the column until
effluent tracer levels eventually fell below the detection limit.
One repacked column was used for all three unsaturated Br experiments,
but fresh sediment materials were used for each Cr(VI) experiment due to the
difficulty in leaching all the Cr(VI) from the column. This would have complicated

39
calculations of mass balance and sorption. Eight unsaturated Cr(VI) columns
were run on the vacuum column apparatus.
Centrifugation-based transport experiments
The second unsaturated column system employed was the Unsaturated
Flow Apparatus (UFA). The system is depicted in Figure 3 and described in
detail elsewhere (Conca and Wright, 1990; Khaleel et al., 1995; Gamerdinger
and Kaplan, 2000). It consists of two volumetric infusion pumps, AVI 200A (3M,
St. Paul, MN) and a Beckman J6-MI centrifuge (UFA Ventures, Richland, WA),
including a rotating seal, rotor, and column assembly. The column assembly
consists of the sample holder and the effluent collection cup. The packed soil
columns, contained in the sample holder, are 5 cm in length with an internal
diameter of 3.3 cm. The effluent cup is placed at the end of the sample holder
and serves to collect the column effluent during centrifugation. The rotating seal
is at the center of the rotor and is the conduit through which fluid is delivered by
the infusion pumps to the columns by two separate flow paths. This enables two
columns to be run simultaneously with different solutions. The column assembly
is connected to the rotor at the outflow of the rotating seal by a centrifuge bucket
that screws in place.
Columns were packed with air-dried soil, weighed, and saturated with
AGW before being placed in the centrifuge. Experiments were initiated when
steady-state water contents were reached based on the gravimetric analysis of
the packed columns. Columns had to be removed from the UFA for weighing

40
and sampling purposes. The flow rates and centrifuge speeds necessary to
achieve a given degree of saturation are summarized in Appendix B.
Inlet solutions were then switched to those containing tritium and Cr(VI).
Two concentrations of Cr(VI) were used: 0.5 and 1.0 mM. Flow was not initiated
until the centrifuge speed reached 75% of its maximum value. This ensured that
steady-state flow conditions were maintained. Whenever possible, the inlet
solution was displaced through the column until the effluent concentration
equaled that of the inlet solution. The column was then flushed with AGW by
switching solutions again until effluent tracer levels eventually fell below the
detection limit.
Since the effluent collection cups can only hold a certain volume,
centrifugation must be interrupted for sample collection at specified intervals.
According to Gammerdinger and Kaplan (2000), stopping centrifugation and flow
for sampling purposes does not adversely affect solute breakthrough or
calculation of retardation coefficients. They also reported water content as stable
throughout the soil column except for the final segment at the outflow, in contact
with the water-absorbent filter paper.
A new repacked soil column was used for each Cr(VI) experiment.
Twenty-two columns were run in the UFA [12 columns with 0.5 mM Cr(VI) and 10
with 1.0 mM Cr(VI)], four of which were replicates. No experiments were done in
the UFA using Br.

41
Residual Cr(VI) Extraction
Soil from the Cr(VI) columns was removed upon completion of each
experiment and allowed to air dry. The soil was then thoroughly mixed and
subsampled for extraction of residual Cr(VI). Five-gram samples of soil were
added to centrifuge tubes with fifteen milliliters of 10 mM KH2PO4 extracting
solution, adjusted to pH 10 (Bartlett and James, 1996). The samples were then
placed on a reciprocating shaker for 24 hours and centrifuged at 15,000 rpm for
15 minutes. The supernatant was filtered with a 0.22 µm pore size nylon filter
prior to analysis of Cr(VI) using the diphenycarbazide method, as cited above.
This was done for Cr(VI) columns from the vacuum and UFA experiments.
Saturated columns
Saturated experiments were conducted for both vacuum and UFA
systems, using columns of the same dimensions as those used for the
unsaturated experiments. These columns were saturated from bottom to top with
AGW to remove as much as the air from the column as possible. The columns
were then positioned horizontally, and the AGW replaced with the appropriate
tracer solution. For the saturated vacuum columns, measurements of pH and EC
were recorded as effluent emerged from the column.
Analysis of samples
Tritium analysis was performed by liquid scintillation counting using a
Packard 2550 TR/AB Liquid Scintillation Analyzer. Two milliliters of sample were
added to ten milliliters of scintillation cocktail (Packard Ultima Gold) and counted
for twenty minutes. Bromide concentrations were measured using an Accumet

42
bromide combination ion selective electrode. All samples were brought to a high
electrical conductivity before reading to ensure effects due to differences in salt
content would not interfere with measurements. Chromate concentrations were
determined using the diphenylcarbazide method and read using a Cary 500 Scan
UV-Vis NIR Spectrophotometer at a wavelength of 540 nm.
Modeling
Tritium, Br, and Cr(VI) BTCs were modeled using CXTFIT, a program in
the Stanmod software package (Version 2.0), developed by researchers at the
USDA Salinity Lab, Riverside, CA. This program is an extension and update of
earlier versions published over the years by van Genuchten (1979; 1981), Parker
and van Genuchten (1984), and Toride et al. (1995). Tritium curves did not
exhibit tailing to indicate the presence of regions of immobile water. However,
both the deterministic equilibrium and two-region physical nonequilibrium
convective-dispersive equation models were run on the data to ensure that
regions of immobile water present in the columns did not play a significant role in
solute transport. The models were run in the inverse mode for parameter
estimation.
For the equilibrium model, tritium curves were used to fit values of v and
D. Since tritium was run simultaneously with both Cr(VI) and Br, these v and D
values were then used to find appropriate R values for Cr(VI) and Br. When
using the nonequilibrium model, values of v, D, β, and ω were fit to tritium data
and these values were then used to determine R for Cr(VI) and Br data.

43
Results and discussion
Batch sorption isotherm
The results of the Cr(VI) sorption isotherm are shown in Figure 4. The
soil-free controls indicated that there was no loss of Cr(VI) to the container, and
the Cr(VI)-free controls indicated that the equilibrating solution was the only
source of Cr(VI). The amount of Cr(VI) sorbed was calculated as the difference
between the initial Cr(VI) concentration and the final equilibrium concentration.
The data are plotted as the amount of Cr(VI) sorbed vs. the equilibrium Cr(VI)
concentration. The isotherm appears fairly linear up to about 75 µg⋅mL-1 Cr(VI)
equilibrium concentration, where it begins to level off. A graph of the change in
pH with equilibrium Cr(VI) concentration is included in Appendix C. Many follow-
up studies were done to examine the sorption of Cr(VI) past the range of this
isotherm. However, there were difficulties in obtaining reproducible data. With
increasing equilibrium concentrations, the amount sorbed to the media was often
smaller than the variability between replicates. However, the isotherm shown in
Figure 4 encompasses the solute concentration range used in the column studies
[0.5 mM (26 µg⋅mL-1) and 1.0 mM (52 µg⋅mL-1) Cr(VI)]. Taking data over the
linear range and forcing a regression line through zero produces a Kd for this
isotherm of 0.599 mL⋅g-1 (R2 = 0.9992).
Br transport experiments
The Br transport experiments are summarized in Table 4. The
experiments are named to include the column method (V = vacuum, U = UFA),
tracer concentration (mM), and percent moisture saturation. Therefore, Br/V-1.0-

44
78 is a column run with 1.0 mM Br on the vacuum-based column system at a
saturation level of 78%. In discussing transport experiments, the terms "vacuum"
and "UFA" will refer to the vacuum-based and centrifuge-based column
experiments, respectively.
The bulk density (ρb), flow rate (Q), and volumetric water content (θ)
values in Table 4 were determined experimentally, while the average pore water
velocity (v), dispersion coefficient (D), and retardation factor (R) were results
from analyzing the breakthrough curve (BTC) with CXTFIT. Parameters were
slightly sensitive to input values. When fitting v and D values to the tritium BTCs,
initial estimates of v were calculated from experimental conditions using the
water flux and volumetric water content (v = Jw/θ). Initial estimates of D were
then obtained by multiplying v by 2. Changes in model results were noticed
when input values of v were changed more than a factor of about 4. Values of D
were less sensitive as long as appropriate values of v were used and could be
varied as much as a factor of 10 or more without changing the model results.
When fitting R using tritium-based v and D values, it was found that input
estimates of R values were less sensitive than the other parameters and could
be varied by a factor of 4 to 500 before changes in the model results occurred.
The Peclet number (P) was calculated as the pore water velocity times the
column length, divided by the dispersion coefficient. The dispersivity (λ) was
calculated as the dispersion coefficient (D) divided by the average pore water
velocity (v). The distribution coefficient (Kd) was calculated from the retardation
factor, bulk density, and volumetric water content from each column experiment.

45
All vacuum columns for Br could not be saturated more than about 78%
even though columns were saturated from bottom to top slowly overnight in an
attempt to minimize air in the soil. For the saturated Br experiment, the pH of the
column effluent changed from about 5.1 to 4.4 during the pulse of the Br tracer
solution. The pH returned to 5.1 when the tracer solution was changed back to
AGW (graph included in Appendix D).
The BTCs for the Br transport experiments are shown in Figure 5.
Breakthrough appears to be delayed as the column became desaturated with the
exception of the lowest water content, 63%. All experiments exceeded the
maximum breakthrough of 1.0 fraction, meaning the effluent appeared more
concentrated than the influent solution. This may be due to drift in the Br
electrode, although proper calibration procedures were followed throughout
measurement of samples.
From Table 4, it can be seen that D apparently decreases with decreasing
v. However, this relationship is not significant since the slope of the regression
line includes zero, though this relationship was tested as D vs. v (p = 0.101) and
Log (D) vs. v (p = 0.065) in an attempt to make the data more linear. The R and
calculated Kd increased with decreasing saturation and is significant (p = 0.015
for both relationships). This could be due to the decrease in saturation or the
decrease in Q and v as the media is desaturated, resulting in greater average
solute residence times. In fact, the average solute residence time increased with
decreasing saturation and ranged from 99 to 636 minutes.
46
Bromide transport parameters were also evaluated using the two-region,
nonequilibrium model to evaluate the possible role of immobile water in this
system, though no tailing was observed in tritium curves. Model results indicated
that the equilibrium model should be used in describing the data, since the
fraction of mobile water, as indicated by β, was 95% or above for all column
experiments. Also, transport parameters changed little using the nonequilibrium
model. The r2 for regression of observed vs. predicted data did not change more
than 1.2% from the equilibrium to the nonequilibrium model (Appendix E). A
supplementary table comparing transport parameters determined using both
models is included in Appendix F.
Differences in sorption parameters fit with the equilibrium model were
significant, but varied little over a range of water contents. It was concluded that
the retardation of Br in this system was too low to evaluate the impact of water
content on sorption reactions. Therefore, these experiments were discontinued
and Cr(VI) experiments were run on the vacuum and centrifuge column systems.
Chromate exhibits greater sorption than Br for this media (Seaman et al., 1999),
but not to the extent that the duration of the experiment would be lengthened
beyond reasonable means.
Cr(VI) transport experiments
General results of the vacuum and centrifuge-based Cr(VI) experiments
will be discussed first. Then, the results of the analysis of the tritium data for all
experiments (vacuum and UFA) will be discussed next as it pertains to the
physical transport properties of the media. Lastly, the results of the analysis of

47
Cr(VI) data for all experiments (vacuum and UFA) and both concentrations (0.5
and 1.0 mM) will be discussed in light of the chemical transport properties of the
media.
Vacuum-based transport experiments
As with the Br experiments, 100% saturation could not be achieved using
the vacuum columns even though columns were saturated from bottom to top
overnight with low flow rates. The lowest water content that could be obtained
using the vacuum apparatus was around 50% saturation. Experimental duration
ranged from 17 to 145 hours, depending on flow rate.
A graph of the water content distribution in the vacuum column, done
similar to the method of Maraqa et al. (1997), is shown as Figure 6. The water
content along the length of the column varied little when calculated on a
gravimetric basis. Volumetric water contents varied more and may have included
error since precise measurement of sample volumes was difficult when removing
and segmenting the column materials. The column was slightly drier at the lower
end which was connected to the vacuum source.
Centrifuge-based transport experiments (UFA)
Flow rates in the UFA columns varied little, as different degrees of water
saturation were obtained by adjusting the centrifugation speed. For one set of
columns, this failed to produce the desired water content so the flow rate was
reduced. Replicate columns were run simultaneously for four column
experiments and produced very similar BTCs (example graph included in
Appendix G).

48
The duration of the experiments for the centrifuge columns ranged from 3
to 12 hours and all columns were completed in one day. This is in contrast to the
vacuum experiments. The longest UFA experiment is shorter than the shortest
vacuum experiment. This represents an advantage of the UFA system over the
vacuum system. Another difference between the UFA and vacuum system was
the range of water content that was possible. Figure 7 shows the retardation
factor with water content from column experiments run on the vacuum and UFA
system. It is evident that the UFA has a much greater achievable range in water
content than the vacuum column system.
Physical transport parameters – tritium results
Tritium was treated as a conservative tracer to evaluate the physical
properties of the media. The results for the vacuum-based transport experiments
are summarized in Table 5. The experiments are named by the sorbing tracer
used with the tritium [Cr(VI) in this case], but the data in this section represent
the equilibrium model results for the tritium BTCs only. The sorption parameters
for the Cr(VI) data will be discussed in the next section.
Experiments Cr/V-0.5-75 and Cr/V-1.0-74 represent the saturated
columns. From Table 5, it does not appear that there is a linear dependence of
D on v, though the column with the lowest flow rate (lowest v) produced the
lowest D (Cr/V-0.5-56). Calculating P does not help reveal a relationship with
this data. The results of the centrifuge-based transport experiments are
presented in Tables 6 and 7. Tritium data from vacuum and UFA columns are
displayed together graphically.

49
Appendix H shows the variation in the dispersion coefficient, D, with the
average pore water velocity, v. A regression line through the data and forced
through zero (De Smedt et al., 1986; Maraqa et al., 1997) yields a slope of 4.227,
corresponding to the dispersivity in cm. This regression line has an r2 = 0.237,
but is significant (p = 0.002). This dispersivity value of 4.227 is comparable to
values for unsaturated sand of 1.354 cm (Maraqa et al., 1997) and 7.3 cm (De
Smedt et al., 1986).
In order to obtain a more linear expression of the data for statistical
analysis, the graph was transformed as the Log (D) with v (Appendix H). This
improved the r2 to 0.368 and produced a statistically significant relationship (p <
0.001) described by the equation:
96.036.1)( −⋅= vDLog [3]
Therefore, the data do not strongly support the assertion that the dispersion
coefficient is linearly related to the pore water velocity by a factor known as
dispersivity. The data are better described by including an exponential function.
It could not be ascertained whether this was a result of curve-fitting errors, as
both parameters were not directly measured from experimental conditions. The
relationship does not improve when separating data by column method (vacuum
vs. UFA).
The variation in dispersion as a result of changing water content was also
examined using the calculated Peclet number [P = (v⋅L)⋅D-1] to account for
differences in column length and pore water velocity. These results are shown in

50
Figure 8 as the log of the Peclet number versus the volumetric water content.
The relationship is significant (p < 0.001) with an equation of:
73.0)(59.7)( −= θPLog [4]
A possible explanation for the nonlinear plot of D vs. v is that the
dispersivity is changing with water content. The dispersivity (λ) was calculated
from the dispersion coefficient (λ = D⋅v-1). Dispersivity was then plotted with
water content to see if there was a change in the transport pathways of the
media with desaturation (Figure 9). The relationship is significant (p < 0.001)
when dispersivity is expressed in the log scale and the outlier (Cr/U-0.5-25) is
excluded. This plot indicates that dispersivity increases with decreasing water
content, though the r2 = 0.4731. This is consistent with results from other
research on packed soil columns that found dispersivity to increase with
decreasing water content (De Smedt et al., 1986; Fesch et al., 1998). De Smedt
et al. (1986) attributed this increase in dispersivty with decreasing water content
to the presence of immobile water, while Fesch et al. (1998) explained that the
increase in dispersivity could be the result of the increase in tortuosity of the
solute flow path as the media becomes desaturated.
To account for the possibility of immobile water in these systems, the two-
region physical nonequilibrium model was fit to all tritium data. In addition to D
and v, β and ω parameters were included. Tables comparing parameters fit with
both models are included in Appendix I-K. All the experiments for both vacuum
and centrifuge column systems had mobile water contents greater than 90%
except for columns Cr/V-0.5-75 (β = 0.8903), Cr/U-1.0-66 (β = 0.8842), and Cr/U-

51
0.5-32 (β = 0.3947). Column Cr/V-0.5-75 is a saturated column, so these results
are inconsistent with the assumption that immobile water increases with
decreasing saturation. The other columns with low β values represent water
contents in the middle range. These results were considered anomalies and it
was therefore concluded that the nonequilibrium model was not needed to
describe these data since it did not play a significant role in the transport of
solutes of this system. This would follow the criteria of Gamerdinger and Kaplan
(2000), who only used parameters determined with the nonequilibrium model if
the mobile water fraction, β, was less than 90%. The fit of the model parameters
to the solute BTCs was not significantly improved by using the nonequilibrium
model as opposed to the equilibrium model, as seen by a comparison of the r2
values (Appendix E).
Chemical transport parameters – Cr(VI) results
A main objective of this research was to determine whether a solute's
sorption parameters changed with degree of water saturation. For the saturated
Cr(VI) experiments, the pH of the column effluent changed from about 4.40 to
4.18 during the pulse of the Cr(VI) tracer solution. The pH leveled off at 4.55
when the tracer solution was changed back to AGW (graph included in Appendix
L). Graphs of saturated and unsaturated Cr(VI) vacuum and UFA BTCs are
included in Appendix M-Q (curves not all same size because experimental pulse
duration varied). However, the results in solute transport differences can best be
seen through the fitted parameters. Data were well-described using CXTFIT for
Cr(VI) curves in most cases (see Appendix R for graphs of observed versus

52
predicted data). Results for parameters fit with the equilibrium model are
included in Table 8 (vacuum) and Tables 9 and 10 (UFA, 0.5 and 1.0 mM).
For the vacuum data, retardation coefficients appear to increase slightly
with decreasing water content for the 1.0 mM tracer level, but calculated Kd
values show no similar trend. Retardation and Kd values were usually higher
with the 0.5 mM Cr(VI) columns than the 1.0 mM Cr(VI) columns, possibly
indicating that sorption behavior was inconsistent with the linear Kd assumption.
Figure 10 shows the retardation coefficients as a function of water
content, for both the vacuum and centrifuge experiments and both concentrations
of Cr(VI) solution. The distribution coefficient, Kd, determined from the batch
sorption isotherm, was used to calculate the expected retardation coefficient for
each experiment, using the relationship described by [2]. These values are
plotted with the column data in Figure 10 and labeled "Batch Kd". The vacuum
experiments appear to have no apparent trend with water content. The UFA
experiments show an increase in R with decreasing water content. For both the
UFA and vacuum column experiments, the 0.5 mM Cr(VI) experiments had
generally higher retardation factors as opposed to the 1.0 mM Cr(VI)
experiments, again possibly indicating nonlinear sorption. The calculated R
values from batch sorption isotherm Kd followed a trend similar to the UFA 0.5
mM data. At the lowest water contents, there is a significant difference in R
values calculated with the UFA system. This may be due to the fact that with
very low water contents, the water film present on the soil particles becomes
unstable and discontinuous, causing greater differences in solute transport. This

53
is also evidenced in the residual plot for the UFA 1.0 mM experiments (not
shown) which showed increasing variation in R with decreasing water content.
Statistical analysis revealed that the 0.5 mM and 1.0 mM UFA
experiments had a significant trend (p < 0.001, p = 0.024, respectively) of
increasing R with decreasing water content. The vacuum experiments did not
have a significant trend with water content for either 0.5 or 1.0 mM Cr(VI)
concentration levels (p = 0.536, 0.252, respectively), possibly due to the smaller
range in water content over which they were conducted (0.23-0.34). Also, the
retardation relationships for the UFA did not vary significantly from the vacuum
system measurements for both 0.5 and 1.0 mM levels. Since data for both
systems are similar and the UFA experiment durations were much shorter than
the vacuum experiments at comparable water contents, it would appear that
residence time had no significant effect on transport parameters over this range
in water content (0.07-0.41) and solute residence time (4-300 min.). It would
have been expected for the 0.5 mM curve to be different from the 1.0 mM curve,
but the variation in data did not allow for a significant difference between the
treatment levels. The general increasing trend of R with water content in these
two systems agrees with the relationship described by equation [2].
In the preceding section, a two-region nonequilibrium model was used to
determine if immobile water played a significant role in solute transport. The
conclusion was that immobile water would not need to be accounted for in
describing solute transport in this system since nearly all the mobile water
fractions were greater than 90%. However, to further indicate that this had no

54
effect on transport parameters, the parameters that were fit to the tritium data
with the nonequilibrium model (D, v, β, and ω) were used to fit R for the Cr(VI)
data. The values are not significantly different than those fit with the equilibrium
model as shown in Appendix S-U. A graph is also included that shows R from
the equilibrium model graphed against the R from the nonequilibrium model
(Appendix V). The slope of this relationship is very close to 1. This further
indicates that the data is sufficiently described using the equilibrium model and
that immobile water does not play a significant role in solute transport in this
system. A comparison of the r2 values for the determination of R in both the
equilibrium and nonequilibrium models is included in Appendix E.
To examine whether sorption was changing with water content, the Kd of
each column experiment was calculated from the R value, using bulk density and
water content measurements from each experiment. The results are shown in
Figure 10. The average of all Cr(VI) column experiment Kd values (0.5 and 1.0
mM) was 0.551 mL⋅g-1, similar to the batch sorption isotherm Kd value of 0.599
mL⋅g-1 (Figure 4). Also, there was no significant difference between Kd values
determined with the UFA and vacuum systems. Generally, the 0.5 mM data
points are higher than those of the 1.0 mM data, indicating a possible deviation
from the linear sorption. However, there does not appear to be a trend of Kd with
water content. This was verified with statistical analysis. Therefore, it appears
that Kd does not significantly vary with water content in this system. This differs
from the results of Lindenmeier et al. (1995) who found a decrease in Kd for U
and Sr with a decrease in saturation. They speculated that this could be due to

55
insufficient residence time or a decrease in the relative number of available
sorption sites per volume of soil as the water content is decreased. However, the
Kd for benzene has been shown to change little with water content when
changing soil:water ratios are accounted for (Maraqa et al., 1999). Comparisons
between the results of this study and those of other researchers are complicated
by the fact that different sorbing tracers, soils, and equipment are used in most
experiments. However, considering the limited number of studies evaluating
solute transport in unsaturated media, it is important to examine these
differences.
Though Lindenmeier et al. (1995) used vacuum and UFA systems similar
to those used in the present study with a relatively sandy soil, their results are
different than the relationships seen here. This may be due to the difference in
the properties of U and Sr versus Cr(VI) as it relates to the behavior of the
tracers with certain available sorption sites that may change with degree of water
saturation.
To examine the idea that sorption may be a function of residence time, the
conservative tracer, tritium, was used to calculate the amount of Cr(VI) that was
sorbed by the soil during the course of each experiment. This was accomplished
by using a mass balance calculation to find the difference between the tritium
and Cr(VI) BTCs. These values are displayed in Table 11. The average value
for all experiments was 22.2 mg Cr(VI) per kg soil. There is a significant (p <
0.001) positive linear relationship for the UFA 0.5 mM data between the amount
sorbed and the volumetric water content (Figure 11). However, this trend was

56
not significant for the UFA 1.0 mM or the vacuum column data (not shown in
graph). This would indicate that there was greater sorption when the soil was
more saturated. This could point to the process of desaturation limiting the
number of surfaces available for sorption. However, there was also a significant
positive linear relationship between the amount sorbed and the average retention
time for the 0.5 and 1.0 mM UFA data (p = 0.007 and 0.05, respectively) (Figure
11). The 0.5 and 1.0 mM treatment levels were not significantly different from
each other. The average retention time was calculated as the volume of water
present in the soil divided by the flow rate through the soil. The flow rate was
changed only once for the UFA column experiments. Therefore, with decreasing
saturation, the soil water decreases, thus decreasing the average retention time
of the solute in the soil. This indicates that the amount sorbed may be more a
function of kinetics as opposed to decreased availability of surface sites with
changing pathways of solute transport. However, this is inconsistent with earlier
retardation data (Figure 10) that showed similar values for UFA and vacuum
columns, though these systems have significantly different solute retention times.
Effluent recoveries of the Cr(VI) in the columns ranged from 53 to 111.4
%, mainly due to insufficient leaching with AGW to remove the sorbed fraction.
Average recovery was 81.4%. Therefore, an extraction procedure with 10 mM of
KH2PO4 was carried out on the soil after the column experiments were
completed. Average recovery after the extraction was 92.5%. A table with the
percent recovery values is included in Appendix W. There was no relationship
between the experimental recovery and any transport parameters.

57
Summary and conclusions
The objective of these solute transport experiments was to evaluate the
effect of water content on the dispersion and sorption properties of tritium,
bromide, and chromate in a sandy sediment characteristic of the Atlantic Coastal
Plain. Two methods were employed to create a steady-state unsaturated flow
regime within the packed soil columns: a vacuum-based Wierenga column
system and a centrifuge-based Unsaturated Flow Apparatus (UFA). It was found
that there was no significant difference in solute transport parameters derived
with these two systems. The experimental duration of the columns on the
vacuum-based system was 4 to 23 times longer than those run with the
centrifuge-based system at comparable water contents. The vacuum system
was only able to reach water contents as low as 50% of saturation, while the
UFA reached water contents as low as 16% of saturation. All UFA experiments
could be finished in one day, though the system has to be stopped for sampling
purposes at specified intervals.
Dispersion increased with pore water velocity and decreasing water
content (as indicated by Peclet number). However, these relationships were not
linear in nature. In general, retardation increased with decreasing water content,
but this relationship was only significant for the UFA data. However, calculation
of the distribution coefficient from the retardation factor indicated no trend with
water content. The average of all Cr(VI) column experiment Kd values, 0.551
mL⋅g-1, was similar to the batch sorption isotherm Kd value of 0.599 mL⋅g-1.

58
The total amount of Cr(VI) sorbed to the soil throughout the course of the
experiment increased with increasing water content. However, Cr(VI) sorption
also increased with the average solute retention time within the soil. It was
unclear whether Cr(VI) sorption was influenced by changing solute flow paths
with desaturation, or was a factor of average solute retention time.
Notation
C solute concentration (M⋅L-3) D hydrodynamic dispersion coefficient (L2⋅T-1) Jw water flux (L⋅T-1) Kd distribution coefficient (L3⋅M-1) P Peclet number Q volumetric flow rate (L3⋅T-1) R retardation factor t time (T) v average pore water velocity (L⋅T-1) z distance (L) β fraction of mobile water λ dispersivity (L) θ volumetric water content (L3⋅L-3) ρb dry bulk density (M⋅L-3) ω mass transfer coefficient
References
Bartlett, R. J. and B. R. James. 1996. In D. L. Sparks(ed.) Methods of soil analysis: Part III - Chemical methods. Soil Science Society of America, Madison, WI, 683-701.
Bear, J. 1969. Hydrodynamic dispersion. In R. J. M. DeWiest(ed.) Flow through porous media. Academic Press, New York, 530 pp.
Biggar, J. W. and D. R. Nielsen. 1976. Spatial variability of the leaching characteristics of a field soil. Water Resour. Res. 12:78-84.
Bouwer, H. 1991. Simple derivation of the retardation equation and application of preferential flow and macodispersion. Ground Water 29:41-46.
Clesceri, L. S., A. E. Greenberg and R. R. Trussell. 1989. Standard methods for the examination of water and wastewater. American Public Health Association, Washington, DC.
Conca, J. L. and J. Wright. 1990. Diffusion coefficients in gravel under unsaturated conditions. Water Resour. Res. 26:1055-1066.

59
Conca, J. L. and J. Wright. 1992. Hydrostratigraphy and recharge distributions from direct measurement of hydraulic conductivity using the UFA method. PNL-9424. Pacific Northwest Laboratory, Richmond, WA.
Corey, J. C., D. R. Nielsen and J. W. Biggar. 1963. Miscible displacement in saturated and unsaturated sandstone. Soil Sci. Soc. Am. Proc. 27:258-262.
De Smedt, F. and P. J. Wierenga. 1979. Mass transfer in porous media with immobile water. J. Hydrol. 41:59-67.
De Smedt, F. and P. J. Wierenga. 1984. Solute transfer though columns of glass beads. Water Resour. Res. 20:225-232.
De Smedt, F., F. Wauters and J. Sevilla. 1986. Study of tracer movement through unsaturated sand. J. Hydrol. 85:169-181.
Fesch, C., P. Lehmann, S. B. Haderlein, C. Hinz, R. P. Schwarzenbach and H. Fluhler. 1998. Effect of water content on solute transport in a porous medium containing reactive micro-aggregates. J. Cont. Hydrol. 33:211-
Gamerdinger, A. P. and D. I. Kaplan. 2000. Application of a continuous-flow centrifugation method for solute transport in disturbed, unsaturated sediments and illustration of mobile-immobile water. Water Resour. Res. 36:1747-1755.
Gamerdinger, A. P. and D. I. Kaplan. 2001. Physical and chemical determinants of colloid transport and deposition in water-unsaturated sand and Yucca Mountain tuff material. Environ. Sci. Technol. 35:2497-2504.
Gamerdinger, A. P., D. I. Kaplan, D. M. Wellman and R. J. Serne. 2001a. Two-region flow and decreased sorption of uranium (VI) during transport in Hanford groundwater and unsaturated sands. Water Resour. Res. 37:3155-3162.
Gamerdinger, A. P., D. I. Kaplan, D. M. Wellman and R. J. Serne. 2001b. Two-region flow and rate-limited sorption of uranium (VI) during transport in an unsaturated silt loam. Water Resour. Res. 37:3147-3153.
Jackson, M. L., C. H. Lin and L. W. Zelazny. 1986. Oxides, hydroxides, and aluminosolicates. In A. Klute(ed.) Methods of soil analysis: Part I - Physical and mineralogical methods. American Society of Agronomy, Madison, WI, 101-150.
James, R. V. and J. Rubin. 1986. Transport of chloride ion in a water-unsaturated soil exhibiting anion exclusion. Soil Sci. Soc. Am. J. 50:1142-1149.
Jardine, P. M., G. K. Jacobs and G. V. Wilson. 1993. Unsaturated transport processes in undisturbed heterogeneous porous media I. Inorganic contaminants. Soil Sci. Soc. Am. J. 57:945-953.
Jardine, P. M., S. E. Fendorf, M. A. Mayes, I. L. Larsen, S. C. Brooks and W. B. Bailey. 1999. Fate and transport of hexavalent chromium in undisturbed heterogeneous soil. Environ. Sci. Technol. 33:2939-2944.
Jin, Y., Y. Chu and Y. Li. 2000. Virus removal and transport in saturated and unsaturated sand columns. J. Cont. Hydrol. 43:111-128.
Khaleel, R., J. F. Relyea and J. L. Conca. 1995. Evaluation of van Genuchten-Mualem relationships to estimate unsaturated hydraulic conductivity at low water contents. Water Resour. Res. 31:2659-2668.

60
Lapidus, L. and N. R. Amundson. 1952. A descriptive theory of leaching. Mathematics of adsorptive beds. J. Phys. Chem. 56:984-988.
Lindenmeier, C. W., R. J. Serne, J. L. Conca, A. T. Wood and M. I. Wood. 1995. Solid waste and leach characteristics and contaminant-sediment interactions Volume 2: Contaminant transport under unsaturated moisture conditions. PNL-10722. Pacific Northwest Laboratory, Richland, WA.
Maraqa, M. A., R. B. Wallace and T. C. Voice. 1997. Effects of degree of water saturation on dispersivity and immobile water in sandy soil columns. J. Cont. Hydrol. 25:199-218.
Maraqa, M. A., R. B. Wallace and T. C. Voice. 1999. Effect of water saturation on retardation of ground-water contaminants. J. Environ. Eng. 697-704.
Miller, W. P. and D. M. Miller. 1987. A micro-pipette method for soil mechanical analysis. Commun. Soil Sci. Plant Anal. 18:1-15.
Mills, R. and K. R. Harris. 1976. The effect of isotopic substitution on diffusion in liquids. Chem. Soc. Rev. 5:215-231.
Nelson, D. W. 1982. Cation exchange capacity. In A. L. Page(ed.) Methods of soil analysis. Part II: Chemical and microbial properties. American Society of Agronomy, Madison, WI, pp. 149-157.
Nimmo, J. R., J. Rubin and D. P. Hammermeister. 1987. Unsaturated flow in a centrifugal field: Measurement of hydraulic conductivity and testing of Darcy's Law. Water Resour. Res. 23:124-134.
Nimmo, J. R., K. C. Akstin and K. A. Mello. 1992. Improved apparatus for measuring hydraulic conductivity at low water content. Soil Sci. Soc. Am. J. 56:1758-1761.
Nkedi-Kizza, P., J. W. Biggar, M. T. van Genuchten, P. J. Wierenga, H. M. Selim, J. M. Davidson and D. R. Nielsen. 1983. Modeling tritium and chloride 36 transport through an aggregated oxisol. Water Resour. Res. 19:691-700.
Parker, J. C. and M. T. van Genuchten. 1984. Determining transport parameters from laboratory and field tracer experiments. Bull. 84-3. Va. Polytech Inst., Va. Agric. Exp. Stn., Blacksburg, VA.
Passioura, J. B. 1971. Hydrodynamic dispersion in aggregated media. Soil Sci. 111:339-344.
Passioura, J. B. and D. L. Rose. 1971. Hydrodynamic dispersion in aggregated media 2. Effects of velocity and aggregate size. Soil Sci. 111:345-351.
Porro, I., M. E. Newman and F. M. Dunnivant. 2000. Comparison of batch and column methods for determining strontium distribution coefficients for unsaturated transport in basalt. Environ. Sci. Technol. 34:1679-1686.
Powers, S. E., A. M. Abriola and W. B. Weber, Jr. 1992. An experimental investigation of nonaqueous phase liquid dissolution in saturated subsurface systems: Steady state mass transfer rates. Water Resour. Res. 28:2691-2705.
Rhoades, J. D. 1982. Cation exchange capacity. In A. L. Page(ed.) Methods of soil analysis. Part II: Chemical and microbial properties. American Society of Agronomy, Madison, WI, pp. 149-157.

61
Seaman, J. C., P. M. Bertsch and L. Schwallie. 1999. In situ Cr(VI) reduction within coarse-textured, oxide-coated soil and aquifer systems using Fe (II) solutions. Environ. Sci. Technol. 33:938-944.
Strom, R. N. and D. S. Kaback. 1992. SRP baseline hydrogeologic investigation: Aquifer charcterization groundwater geochemistry of the Savannah River Site and vacinity (U). Westinghouse Savannah River Company, Environmental Sciences Section, Aiken, SC.
Thomas, G. W. and A. R. Swoboda. 1970. Anion exclusion effects on chloride movement in soils. Soil Sci. 110:163-166.
Thomas, G. W. 1982. Exchangeable cations. In A. L. Page(ed.) Methods of soil analysis. Part II: Chemical and microbial properties. American Society of Agronomy, Madison, WI, pp. 159-164.
Toride, N., F. J. Leij and M. T. van Genuchten. 1995. The CXTFIT code for estimating transport parameters from laboratory or field tracer experiments, version 2.1. Res. Rep. 137. U.S. Salinity Lab., Agric. Res. Serv., U.S. Dep. Agric., Riverside, CA.
van Genuchten, M. T. and R. W. Cleary. 1979. Movement of solutes in soil: Computer-simulated and laboratory results. In G. H. Bolt(ed.) Soil chemistry. Elsevier, Amsterdam, 349-386.
van Genuchten, M. T. 1981. Non-equilibrium transport parameters from miscible displacement experiments. Res. Rep. 1999. U.S. Salinity Lab., Agric. Res. Serv., U.S. Dep. Agric., Riverside, CA.
van Genuchten, M. T. and P. J. Wierenga. 1986. Solute dispersion coefficients and retardation factors. In Methods of soil analysis, Part I. Physical and mineralogical methods. American Society of Agronomy, Madison, WI, 1025-1054.
Yule, D. F. and W. R. Gardner. 1978. Longitudinal and transverse dispersion coefficients in unsaturated Plainfield sand. Water Resour. Res. 14:582-588.

62
Table 1. Review of studies evaluating changes in transport parameters with water contentHHHH
Investigator Tracer Material Column LxD Method Saturation Results (Maraqa et al., 1999)
3H, organic tracers
sand 30.2 x 5.45 vacuum 43-100% R increases with decreasing θ Explained by s:l ratio
(Maraqa et al., 1997)
3H sand 30.2 x 5.45 vacuum 43-100% D increases with decreasing θ and increasing v λunsat/λsat~1.9-2.8
(Gamerdinger and Kaplan, 2001)
Br sand tuff
6 x 4.5 centrifuge 5.4-79% D increases with decreasing θ
(Gamerdinger et al., 2001a)
U(VI) silt loam 6 x 4.5 centrifuge 38-90% R increase with decreasing v Kd decrease with decreasing θ Stopping centrifuge increased Kd
(De Smedt and Wierenga, 1979, 1984; Gamerdinger et al., 2001a)
36Cl glass beads
30 x 5.4 vacuum 20-100% D and IM increases with decreasing θ
(De Smedt et al., 1986)
3H sand 100 x 15.4 unsteady flow 15-100% λ increases with decreasing θ Explained by IM
(Porro et al., 2000)
Br Sr
basalt 25.4 x 2.77 vacuum 40-100% Kd not vary with θ Column Kd greater than batch D increases with decreasing θ
(James and Rubin, 1986)
3H Cl
sand 48.5 x 5 vacuum 41-100% λ decrease with decreasing θ
(Fesch et al., 1998)
organic tracers
coated sand
13.5 x 5.3 vacuum 45-86% λ, R increases with decreasing θ
(Corey et al., 1963) 3H Cl
sand-stone
varied vacuum 59-100% D increases with v and column length D varies little with θ
HAbbreviations: L, length; D, diameter; R, retardation factor; θ, volumetric water content; s:l, soil:liquid; D, dispersion coefficient; v, average pore water velocity; λ, dispersivity; unsat, unsaturated; sat, saturated; Kd, distribution coefficient; and IM, immobile water.

63
Table 2. Definitions of transport parameters and the effect of the variation of water contentHHHH
Symbol Name Definition Change with decreasing θθθθ References
D Dispersion coefficient
IeDvD +⋅= λ increases
decreases
little
(De Smedt and Wierenga, 1979, 1984; Maraqa et al., 1997; Porro et al., 2000; Gamerdinger and Kaplan, 2001) (Jardine et al., 1993)
(Corey et al., 1963)
λ Dispersivity &
vD=λ
increases
decreases
(De Smedt et al., 1986; Fesch et al., 1998)
(James and Rubin, 1986)
P Peclet number D
LvP ⋅=
decreases (Porro et al., 2000)
R Retardation factor
'
θρ db KR ⋅+= 1
increases
(Fesch et al., 1998; Maraqa et al., 1999)
Kd Distribution coefficient '
bd
RKρ
θ )1( −⋅= decreases
little
(Lindenmeier et al., 1995; Gamerdinger et al., 2001a) (Maraqa et al., 1999)
IM Immobile Water Portion of water excluded from
advective transport
increases
none
(Gaudet et al., 1977; De Smedt and Wierenga, 1984; De Smedt et al., 1986) (Maraqa et al., 1997)
HAbbreviations: θ, volumetric water content; v, average pore water velocity; De, effective molecular diffusion coefficient; L, column length; IM, immobile water, and ρb, bulk density. I(Bear, 1969) &(Passioura, 1971; Passioura and Rose, 1971) '(Bouwer, 1991)

64
Table 3. Physical and chemical characteristics of Tobacco Road sand used in column and batch studies Texture Sand
IParticle-size distribution (wt. %) &Soil mineralogy Sand (>53 µm) q>>>f 92.65 Silt (53-2 µm) q>>>k 2.55 Clay (<2 µm) k>>q>goe, mica, gibb, hem 4.80
'Water dispersible clay (wt.%) 0.056 #Bulk density disturbed (g⋅cm-3) 1.49 HHpH deionized water 5.10 HHpH AGW 5.00 HHpH KCl 4.21 IIEC (µS⋅cm-1) 4.29 &&Total organic carbon (g/100g) 0.09 ''BET surface area (m2⋅g-1) 2.506 ##Cation exchange capacity (meq/100g) 2.3
HHHTotal metals, g/100 g soil
Fe 0.48923 Cr 0.00018
Extractable Fe, g Fe/100 g soil
IIICDB Fe 0.37 &&&AO Fe 0.02 general soil classification of US Department of Agriculture
Ihydrometer analysis &determined by X-ray diffraction, q = quartz, f = feldspar, k = kaolinite, goe = goethite, gibb = gibbsite, hem = hematite 'micro-pipette method (Miller and Miller, 1987) #ASTM D853-83 HH1:2 soil:solution in deionized water, AGW, or 1 M KCl for 30 minutes II1:2 soil: solution in deionized water &&TOC, total organic carbon, dry combustion method (Nelson, 1982) ''by Micrometrics ASAP-2010 ##ammonium acetate method (Rhoades, 1982; Thomas, 1982)
EPA method 3051; Microwave assisted acid digestion IIIcitrate-dithionite-bicarbonate extraction (Jackson et al., 1986) &&&ammonium oxalate extraction (Jackson et al., 1986)

65
Table 4. Bromide transport parameters determined by direct measurement or from solute breakthrough curves evaluated using the equilibrium and nonequilibrium transport modelsHHHH
ExperimentIIII ρρρρb
(g⋅⋅⋅⋅cm-3) Q
(cm3⋅⋅⋅⋅min-1) θθθθ v
(cm⋅⋅⋅⋅min-1) D P λλλλ
((((cm)))) R Kd
(mL⋅⋅⋅⋅g-1) Br/V-1.0-78 1.47 0.694 0.35 0.4173 0.2182 58.3 0.5229 1.289 0.069
Br/V-1.0-73 1.47 0.475 0.33 0.3749 0.1348 84.8 0.3596 1.347 0.078
Br/V-1.0-68 1.47 0.190 0.31 0.1558 0.0641 74.2 0.4114 1.393 0.083
Br/V-1.0-63 1.47 0.069 0.29 0.0796 0.0719 33.8 0.9033 1.595 0.109
HAbbreviations are as follows: ρb, bulk density; Q, flow rate; θ, volumetric water content; v, average pore water velocity; D, hydrodynamic dispersion coefficient; P, Peclet number; λ, dispersivity; R, retardation factor; and Kd, distribution coefficient. IExperiments are identified by three components: column method (V = vacuum, U = UFA), tracer concentration (mM), and percent moisture saturation.

66
Table 5. Tritium transport parameters for vacuum system, derived by direct measurement or from solute breakthrough curves evaluated using the equilibrium transport modelHHHH
ExperimentIIII ρρρρb
(g⋅⋅⋅⋅cm-3) Q
(cm3⋅⋅⋅⋅min-1) θθθθ v
(cm⋅⋅⋅⋅min-1) D P λλλλ
(cm) Cr/V-0.5-75 1.44 0.813 0.34 0.5221 0.2331 68.3 0.4465
Cr/V-0.5-63 1.43 0.706 0.29 0.2808 1.4560 5.9 5.185
Cr/V-0.5-62 1.45 0.735 0.28 0.5317 0.5470 29.6 1.029
Cr/V-0.5-56 1.46 0.131 0.25 0.1097 0.0619 54.1 0.5643
Cr/V-0.5-54 1.45 0.700 0.24 0.4360 0.0688 193.4 0.1578
Cr/V-1.0-74 1.49 0.789 0.32 0.6318 0.2718 70.9 0.4302
Cr/V-1.0-64 1.50 0.671 0.28 0.4950 0.0940 160.6 0.1899
Cr/V-1.0-62 1.50 0.730 0.27 0.5256 0.2570 62.4 0.4890
Cr/V-1.0-58 1.48 0.664 0.25 0.5510 0.1664 101.0 0.3020
Cr/V-1.0-51 1.45 0.142 0.23 0.1198 0.1223 29.9 1.021
HAbbreviations are as follows: ρb, bulk density; Q, flow rate; θ, volumetric water content; v, average pore water velocity; D, hydrodynamic dispersion coefficient; P, Peclet number; and λ, dispersivity. IExperiments are identified by three components: column method (V = vacuum, U = UFA), tracer concentration (mM), and percent moisture saturation.

67
Table 6. Tritium transport parameters for the UFA (centrifuge system), 0.5 mM Cr(VI) tracer solution, determined using the equilibrium transport modelHHHH
ExperimentIIII ρρρρb (g⋅⋅⋅⋅cm-3)
Q (cm3⋅⋅⋅⋅min-1)
θθθθ v (cm⋅⋅⋅⋅min-1)
D P λλλλ (cm)
Cr/U-0.5-75 1.47 0.792 0.34 0.2033 0.0916 67.7 0.4506
Cr/U-0.5-70 1.57 0.810 0.29 0.3622 0.2264 8.0 0.6251
Cr/U-0.5-68 1.58 0.810 0.28 0.3401 0.2276 7.5 0.6814
Cr/U-0.5-57 1.54 0.810 0.24 0.6052 0.6514 4.6 1.076
Cr/U-0.5-51 1.55 0.500 0.21 0.2345 0.3335 3.5 1.422
Cr/U-0.5-45 1.56 0.810 0.19 0.5381 0.5166 5.2 0.9600
Cr/U-0.5-32 1.53 0.810 0.13 0.6720 1.007 3.3 1.499
Cr/U-0.5-31 1.52 0.810 0.13 0.5704 1.785 1.6 3.129
Cr/U-0.5-28 1.56 0.810 0.11 0.7020 1.188 3.0 1.692
Cr/U-0.5-25 1.57 0.810 0.10 0.0066 8.411 0.0039 1274
Cr/U-0.5-19 1.53 0.810 0.08 1.2040 10.78 0.6 8.953
Cr/U-0.5-18 1.50 0.810 0.08 0.9767 16.56 0.3 16.96
Cr/U-0.5-16 1.48 0.810 0.07 0.6786 2.37 1.4 3.492
HAbbreviations are as follows: ρb, bulk density; Q, flow rate; θ, volumetric water content; v, average pore water velocity; D, hydrodynamic dispersion coefficient; P, Peclet number; and λ, dispersivity. IExperiments are identified by three components: column method (V = vacuum, U = UFA), tracer concentration (mM), and percent moisture saturation.

68
Table 7. Tritium transport parameters for the UFA (centrifuge system), 1.0 mM Cr(VI) tracer solution, determined using the equilibrium transport modelHHHH
ExperimentIIII ρρρρb (g⋅⋅⋅⋅cm-3)
Q (cm3⋅⋅⋅⋅min-1)
θθθθ v (cm⋅⋅⋅⋅min-1)
D P λλλλ (cm)
Cr/U-1.0-94 1.47 0.792 0.41 0.1741 0.2617 20.3 1.503
Cr/U-1.0-66 1.57 0.810 0.27 0.3398 0.0101 167.9 0.0297
Cr/U-1.0-57a 1.56 0.500 0.23 0.2676 0.4168 3.2 1.556
Cr/U-1.0-57b 1.54 0.810 0.24 0.2707 0.1623 8.3 0.5996
Cr/U-1.0-44 1.58 0.810 0.18 0.5807 0.6764 4.3 1.165
Cr/U-1.0-33 1.57 0.810 0.14 0.6005 0.5527 5.4 0.9204
Cr/U-1.0-26a 1.53 0.810 0.11 0.6612 3.3190 1.0 5.020
Cr/U-1.0-26b 1.53 0.810 0.11 0.6460 3.0920 1.0 4.786
Cr/U-1.0-21 1.54 0.810 0.09 1.4420 4.282 1.7 2.969
Cr/U-1.0-19 1.49 0.810 0.08 0.6786 2.37 1.4 3.492
Cr/U-1.0-17 1.51 0.810 0.07 1.2840 5.816 1.1 4.530
HAbbreviations are as follows: ρb, bulk density; Q, flow rate; θ, volumetric water content; v, average pore water velocity; D, hydrodynamic dispersion coefficient; P, Peclet number; and λ, dispersivity. IExperiments are identified by three components: column method (V = vacuum, U = UFA), tracer concentration (mM), and percent moisture saturation.

69
Table 8. Cr(VI) transport parameters for vacuum system, derived by direct measurement or from solute breakthrough curves evaluated using the equilibrium transport modelHHHH
ExperimentIIII ρρρρb
(g⋅⋅⋅⋅cm-3) Q
(cm3⋅⋅⋅⋅min-1) θθθθ R Kd
(mL⋅⋅⋅⋅g-1) Cr/V-0.5-75 1.44 0.813 0.34 4.540 0.836
Cr/V-0.5-63 1.43 0.706 0.29 3.296 0.466
Cr/V-0.5-62 1.45 0.735 0.28 4.938 0.760
Cr/V-0.5-56 1.46 0.131 0.25 6.476 0.938
Cr/V-0.5-54 1.45 0.700 0.24 4.578 0.592
Cr/V-1.0-74 1.49 0.789 0.32 3.284 0.491
Cr/V-1.0-64 1.50 0.671 0.28 3.032 0.379
Cr/V-1.0-62 1.50 0.730 0.27 3.222 0.400
Cr/V-1.0-58 1.48 0.664 0.25 3.314 0.391
Cr/V-1.0-51 1.45 0.142 0.23 4.074 0.488
HAbbreviations are as follows: ρb, bulk density; Q, flow rate; θ, volumetric water content; R, retardation coefficient; and Kd, distribution coefficient. IExperiments are identified by three components: column method (V = vacuum, U = UFA), tracer concentration (mM), and percent moisture saturation.

70
Table 9. Cr(VI) transport parameters for the UFA (centrifuge system), 0.5 mM Cr(VI) tracer solution, determined using the equilibrium transport modelHHHH
ExperimentIIII ρρρρb (g⋅⋅⋅⋅cm-3)
Q (cm3⋅⋅⋅⋅min-1)
θθθθ R Kd (mL⋅⋅⋅⋅g-1)
Cr/U-0.5-75 1.47 0.792 0.34 3.439 0.564
Cr/U-0.5-70 1.57 0.810 0.29 5.303 0.795
Cr/U-0.5-68 1.58 0.810 0.28 5.096 0.726
Cr/U-0.5-57 1.54 0.810 0.24 8.496 1.168
Cr/U-0.5-51 1.55 0.500 0.21 6.283 0.716
Cr/U-0.5-45 1.56 0.810 0.19 7.063 0.738
Cr/U-0.5-32 1.53 0.810 0.13 8.000 0.595
Cr/U-0.5-31 1.52 0.810 0.13 8.813 0.668
Cr/U-0.5-28 1.56 0.810 0.11 8.819 0.551
Cr/U-0.5-25 1.57 0.810 0.10 9.940 0.569
Cr/U-0.5-19 1.53 0.810 0.08 15.33 0.749
Cr/U-0.5-18 1.50 0.810 0.08 12.16 0.595
Cr/U-0.5-16 1.48 0.810 0.07 2.787 0.085
HAbbreviations are as follows: ρb, bulk density; Q, flow rate; θ, volumetric water content; R, retardation coefficient; and Kd, distribution coefficient. IExperiments are identified by three components: column method (V = vacuum, U = UFA), tracer concentration (mM), and percent moisture saturation.

71
Table 10. Cr(VI) transport parameters for the UFA (centrifuge system), 1.0 mM Cr(VI) tracer solution determined using the equilibrium transport modelHHHH
ExperimentIIII ρρρρb (g⋅⋅⋅⋅cm-3)
Q (cm3⋅⋅⋅⋅min-1)
θθθθ R Kd (mL⋅⋅⋅⋅g-1)
Cr/U-1.0-94 1.47 0.792 0.41 2.308 0.365
Cr/U-1.0-66 1.57 0.810 0.27 2.989 0.342
Cr/U-1.0-57a 1.56 0.500 0.23 4.745 0.552
Cr/U-1.0-57b 1.54 0.810 0.24 2.964 0.306
Cr/U-1.0-44 1.58 0.810 0.18 4.409 0.388
Cr/U-1.0-33 1.57 0.810 0.14 4.664 0.327
Cr/U-1.0-26a 1.53 0.810 0.11 11.46 0.752
Cr/U-1.0-26b 1.53 0.810 0.11 7.122 0.440
Cr/U-1.0-21 1.54 0.810 0.09 12.07 0.647
Cr/U-1.0-19 1.49 0.810 0.08 2.858 0.100
Cr/U-1.0-17 1.51 0.810 0.07 6.399 0.250
HAbbreviations are as follows: ρb, bulk density; Q, flow rate; θ, volumetric water content; R, retardation coefficient; and Kd, distribution coefficient. IExperiments are identified by three components: column method (V = vacuum, U = UFA), tracer concentration (mM), and percent moisture saturation.

72
Table 11. Amount of Cr(VI) sorbed by soil during the course of the experiment
ExperimentHHHH Sorbed Cr(VI) (mg⋅⋅⋅⋅kg-1)
Cr/V-0.5-75 33.1 Cr/V-0.5-66 21.4 Cr/V-0.5-63 26.5 Cr/V-0.5-56 32.5 Cr/V-0.5-54 26.8 Cr/V-1.0-74 28.1 Cr/V-1.0-64 27.3 Cr/V-1.0-62 21.0 Cr/V-1.0-58 21.9 Cr/V-1.0-51 32.5 Cr/U-0.5-75 22.4 Cr/U-0.5-70 28.5 Cr/U-0.5-68 27.5 Cr/U-0.5-57 24.4 Cr/U-0.5-51 20.7 Cr/U-0.5-45 21.9 Cr/U-0.5-32 15.6 Cr/U-0.5-31 13.8 Cr/U-0.5-28 23.5 Cr/U-0.5-25 14.5 Cr/U-0.5-19 10.7 Cr/U-0.5-18 11.5 Cr/U-0.5-16 13.1 Cr/U-1.0-94 25.0 Cr/U-1.0-66 23.4 Cr/U-1.0-57a 29.6 Cr/U-1.0-57b 27.7 Cr/U-1.0-44 17.3 Cr/U-1.0-33 18.0 Cr/U-1.0-26a 15.8 Cr/U-1.0-26b 13.2 Cr/U-1.0-21 19.7 Cr/U-1.0-19 26.4 Cr/U-1.0-17 18.4
HExperiments are identified by three components: column method (V = vacuum, U = UFA), tracer concentration (mM), and percent moisture saturation.

73
Figure 1. Unsaturated hydraulic conductivity curves for sandy loam soil obtained using the UFA with artificial groundwater (AGW) and calcium chloride leaching solutions.
1.0E-10
1.0E-09
1.0E-08
1.0E-07
1.0E-06
1.0E-05
1.0E-04
1.0E-03
0.00 0.05 0.10 0.15 0.20 0.25 0.30
Volumetric water content (cm3/cm3)
K (c
m/s
)
AGWCaCl2

74
Figure 2. Diagram of the Wierenga column setup for unsaturated flow (redrawn from Jin et al., 2000).

75
Figure 3. Diagram of the Unsaturated Flow Apparatus components (Khaleel et al., 1995).

76
Figure 4. Cr(VI) sorption isotherm on loamy sand soil at a soil:solution ratio of 1:6 by mass, equilibrated for 24 hours.
y = 0.5992xR2 = 0.9992
0
10
20
30
40
50
0 20 40 60 80 100 120
Cr (VI) (µµµµg/mL)
Sorb
ed C
r (µ µµµg
/g)

77
Figure 5. Bromide breakthrough curves for four levels of column saturation. C/Co = the effluent Br over the influent Br concentration.
0.0
0.2
0.4
0.6
0.8
1.0
1.2
1.4
0 1 2 3 4 5
Pore volume
Efflu
ent B
r (C
/C0)
78%73%68%63%

78
Figure 6. Volumetric and gravimetric water content with column length for vacuum column experiment under 50 cbars of vacuum pressure. Solid and dotted lines represent the assumed volumetric and gravimetric water contents based on difference in weight of entire column when dry and moist.
0
5
10
15
20
25
30
0.00 0.10 0.20 0.30 0.40
Water content
Col
umn
leng
th (c
m)
volumetricgravimetric

79
Figure 7. Retardation in unsaturated media determined using centrifuge-based (UFA) and vacuum-based column systems.
0
4
8
12
16
0.00 0.10 0.20 0.30 0.40
θθθθ
R
UFAVacuum

80
Figure 8. Log of Peclet number with volumetric water content for vacuum and UFA tritium column data.
y = 7.59x - 0.73R2 = 0.5445
-3
-2
-1
0
1
2
3
0.0 0.1 0.2 0.3 0.4 0.5
θθθθ
Log
(Pec
let n
umbe
r)

81
Figure 9. Log of dispersivity with water content for tritium data from vacuum and centrifuge column experiments, determined from D fit with the equilibrium model.
y = -3.9997x + 0.8783R2 = 0.4731
-2.0
-1.5
-1.0
-0.5
0.0
0.5
1.0
1.5
0 0.1 0.2 0.3 0.4 0.5θθθθ
cm

82
Figure 10. Retardation factor (graph A) and distribution coefficienvolumetric water content for UFA and vacuum column systems atCr(VI) concentration levels. The batch Kd data in graph A are retarcalculated from the batch Kd sorption isotherm for each column eequation R = 1 + [(ρρρρb⋅⋅⋅⋅Kd)/θθθθ]. The solid line in graph B represents ththe dotted line represents the average of all column Kd values disp
0
3
6
9
12
15
18
0 0.1 0.2 0.3 0.4 0.5
θθθθ
R
UFA 0.5UFA 1.0Vacuum 0.5Vacuum 1.0Batch Kd
A
0.0
0.4
0.8
1.2
1.6
0 0.1 0.2 0.3
θθθθ
Kd
B
0.599 mL⋅g-1 0.551 mL⋅g-1t (graph B) with 0.5 mM and 1.0 mM dation factors xperiment using the e batch isotherm Kd and layed in the graph.
0.4 0.5

83
Figure 11. Amount of Cr(VI) sorbed by soil in UFA and vacuum column experiments with volumetric water content (graph A) and retention time of solute in soil column (graph B). Regression lines for the 0.5 mM (solid line) and 1.0 mM (dotted line) UFA data are shown.
R2 = 0.4998
R2 = 0.3877
0
10
20
30
40
0 5 10 15 20 25 30
Retention time (min)
Sorb
ed (m
g/kg
)
R2 = 0.6799
R2 = 0.2652
0
10
20
30
40
0 0.1 0.2 0.3 0.4 0.5
θθθθ
Sorb
ed (m
g/kg
)
B
A

84
CHAPTER 3
CONCLUSIONS
The objective of these solute transport experiments was to evaluate the
effect of water content on the dispersion and sorption properties of tritium,
bromide, and chromate in a sandy loam characteristic of the Atlantic Coastal
Plain. Two methods were employed to create a steady-state unsaturated flow
regime within the packed soil columns: a vacuum-based Wierenga column
system and a centrifuge-based Unsaturated Flow Apparatus (UFA) column
system. It was found that there was no significant difference in solute transport
derived with these two systems. The experimental duration of the columns on
the vacuum-based system were 4 to 23 times longer than those run with the
centrifuge-based system at comparable water contents. The vacuum system
was only able to reach water contents as low as 50% of saturation, while the
UFA reached water contents as low as 16% of saturation. All UFA experiments
could be finished in one day, though the system has to be stopped for sampling
purposes at specified intervals.
Dispersion, as indicated by the Peclet number, increased with flow rate
and decreasing water content. However, these relationships were not linear in
nature. In general, retardation increased with decreasing water content, but this
relationship was only significant for the UFA data. However, calculation of the
distribution coefficient from the retardation factor indicated no trend with water

85
content. The average of all Cr(VI) column experiment Kd values, 0.551 mL⋅g-1,
was similar to the batch sorption isotherm Kd value of 0.599 mL⋅g-1.
The total amount of Cr(VI) sorbed to the soil throughout the course of the
experiment increased with increasing water content. However, Cr(VI) sorption
also increased with the average solute retention time within the soil. It was
unclear whether Cr(VI) sorption was influenced by changing solute flow paths
with desaturation, or was a factor of average solute retention time.

86
APPENDIX A – Water contents for vacuum-based solute transport columns and the flow rates and vacuum pressures used to obtain those water contents.
Water content (θθθθ)
Flow rate (mL⋅⋅⋅⋅hr-1)
Vacuum pressure (cbar)
0.33 29 25
0.31 11 40
0.29 42 15
0.28 40 11
0.28 44 15
0.27 4 60
0.27 44 15
0.25 40 30
0.25 8 50
0.24 42 40
0.23 9 60

87
APPENDIX B – Water contents for the centrifuge-based solute transport columns (UFA) and the flow rates and centrifuge speeds used to obtain those water contents.
Water content (θθθθ)
Flow rate (mL⋅⋅⋅⋅hr-1)
Centrifuge speed (rpm)
0.29 50 300
0.28 50 300
0.27 50 300
0.24 50 300
0.23 30 500
0.21 30 500
0.21 50 600
0.19 50 600
0.18 50 600
0.14 50 1000
0.13 50 1000
0.13 50 1000
0.11 50 1500
0.10 50 1500
0.09 50 1500
0.08 50 1500
0.07 50 1500

88
APPENDIX C – Cr(VI) sorption isotherm pH with Cr(VI) equilibrium solution concentration.
4.6
4.7
4.8
4.9
5.0
5.1
5.2
5.3
0 20 40 60 80 100Cr(VI) (µµµµg/mL)
pH

89
APPENDIX D – pH change during saturated experiment using 1 mM KBr solution at 0.694 cm3⋅⋅⋅⋅min-1.
4.3
4.4
4.5
4.6
4.7
4.8
4.9
5.0
5.1
5.2
0 4 8 12 16Pore volume
pH
Switched back to AGW

90
APPENDIX E – R2 for regression values for parameters obtained using the equilibrium and nonequilibrium modelsH
ExperimentIIII Equilibrium model R2 Nonequilibrium model R2
D and v R D, v, ββββ, and ωωωω R Br/V-1.0-78 0.9699 0.9853 0.9816 0.9824 Br/V-1.0-73 0.9939 0.9422 0.9939 0.9422 Br/V-1.0-68 0.9852 0.9862 0.9947 0.9822 Br/V-1.0-63 0.8984 0.9110 0.8977 0.9059 Cr/V-0.5-75 0.9655 0.5960 0.9654 0.6096 Cr/V-0.5-63 0.5496 0.9422 0.5484 0.9314 Cr/V-0.5-62 0.9934 0.5236 0.9934 0.5264 Cr/V-0.5-56 0.9141 0.7366 0.9141 0.7380 Cr/V-0.5-54 0.9793 0.8698 0.9793 0.8705 Cr/V-1.0-74 0.8772 0.8792 0.8770 0.8832 Cr/V-1.0-64 0.9678 0.4959 0.9675 0.5324 Cr/V-1.0-62 0.9912 0.8403 0.9912 0.8403 Cr/V-1.0-58 0.9963 0.9042 0.9963 0.9042 Cr/V-1.0-51 0.8933 0.7158 0.8915 0.7044 Cr/U-0.5-75 0.9708 0.9720 0.9702 0.9707 Cr/U-0.5-70 0.9426 0.9269 0.9426 0.6288 Cr/U-0.5-68 0.9623 0.4963 0.9597 0.6409 Cr/U-0.5-57 0.9460 0.9356 0.9460 0.9343 Cr/U-0.5-51 0.9722 0.6973 0.9722 0.6979 Cr/U-0.5-45 0.9940 0.8468 0.9940 0.8505 Cr/U-0.5-32 0.9960 0.4673 0.9982 0.4616 Cr/U-0.5-31 0.9799 0.5542 0.9794 0.4341 Cr/U-0.5-28 0.9879 0.7917 0.9879 0.7916 Cr/U-0.5-25 0.9777 0.8889 0.9779 0.9104 Cr/U-0.5-19 0.9660 0.8948 0.9655 0.8980 Cr/U-0.5-18 0.9919 0.7575 0.9918 0.7608 Cr/U-0.5-16 0.9942 0.7575 0.9942 0.7624 Cr/U-1.0-94 0.9546 0.9948 0.9544 0.9938 Cr/U-1.0-66 0.9782 0.0635 0.9781 0.2429 Cr/U-1.0-57a 0.9561 0.7685 0.9560 0.7610 Cr/U-1.0-57b 0.8497 0.9870 0.8490 0.9876 Cr/U-1.0-44 0.9925 0.9517 0.9925 0.9513 Cr/U-1.0-33 0.9885 0.8040 0.9885 0.8027 Cr/U-1.0-26a 0.9942 0.4181 0.9942 0.4194 Cr/U-1.0-26b 0.9947 0.2460 0.9946 0.2654 Cr/U-1.0-21 0.9210 0.8624 0.9201 0.8760 Cr/U-1.0-19 0.9942 0.9438 0.9941 0.8591 Cr/U-1.0-17 0.9703 0.7637 0.9703 0.7705
HAbbreviations are as follows: D, hydrodynamic dispersion coefficient; v, average pore water velocity; R, retardation factor; β, fraction of mobile water; and ω, mass transfer coefficient. IExperiments are identified by three components: column method (V = vacuum, U = UFA), tracer concentration (mM), and percent moisture saturation.

91
APPENDIX F – Comparison of bromide transport parameters determined using equilibrium and nonequilibrium modelsHHHH
ExperimentIIII vEQ
(cm⋅⋅⋅⋅min-1) DEQ REQ vNON
(cm⋅⋅⋅⋅min-1) DNON RNON ββββ
Br/V-1.0-78 0.4173 0.2182 1.289 0.4310 0.1000 1.343 0.9500
Br/V-1.0-73 0.3749 0.1348 1.347 0.3753 0.1349 1.348 0.9999
Br/V-1.0-68 0.1558 0.0641 1.393 0.1550 0.0889 1.387 0.9999
Br/V-1.0-63 0.0796 0.0719 1.595 0.0790 0.0909 1.595 0.9928
HAbbreviations are as follows: v, average pore water velocity; D, hydrodynamic dispersion coefficient; R, retardation factor; β, fraction of mobile water, and subscripts EQ and NON refer to equilibrium and nonequilibrium models, respectively. IExperiments are identified by three components: column method (V = vacuum, U = UFA), tracer concentration (mM), and percent moisture saturation.

92
APPENDIX G – Simultaneous replicate (A and C) tritium and Cr(VI) breakthrough curves using the centrifuge-based solute transport column system (UFA). Results shown are for column Cr/U-1.0-66.
0.0
0.2
0.4
0.6
0.8
1.0
1.2
0 3 6 9 12 15
Pore volume
Efflu
ent (
C/C
o)
Cr-ACr-CTritium-ATritium-C
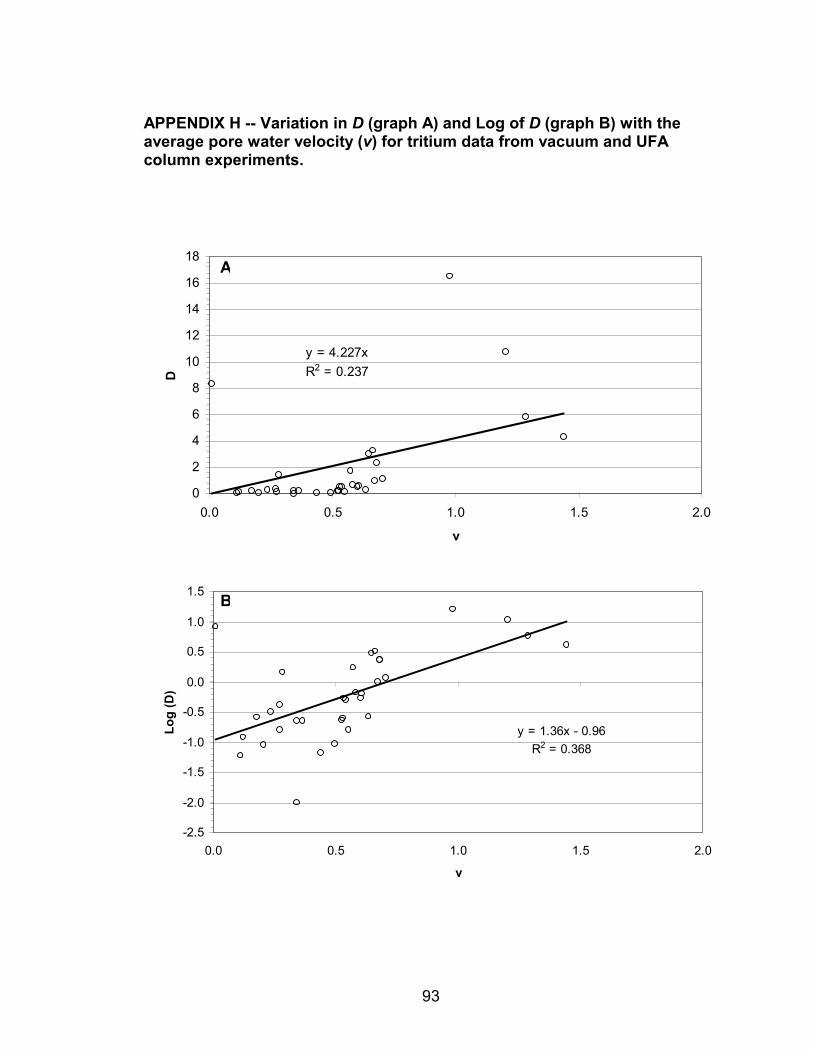
93
APPENDIX H -- Variation in D (graph A) and Log of D (graph B) with the average pore water velocity (v) for tritium data from vacuum and UFA column experiments.
y = 4.227xR2 = 0.237
0
2
4
6
8
10
12
14
16
18
0.0 0.5 1.0 1.5 2.0
v
D
A
y = 1.36x - 0.96R2 = 0.368
-2.5
-2.0
-1.5
-1.0
-0.5
0.0
0.5
1.0
1.5
0.0 0.5 1.0 1.5 2.0
v
Log
(D)
B

94
APPENDIX I – Comparison of tritium transport parameters for vacuum system, determined from using the equilibrium (EQ) and nonequilibrium (NON) modelsHHHH
ExperimentIIII vEQ
(cm⋅⋅⋅⋅min-1) DEQ vNON
(cm⋅⋅⋅⋅min-1) DNON ββββ
Cr/V-0.5-75 0.5221 0.2331 0.4651 0.2411 0.8903
Cr/V-0.5-63 0.2808 1.456 0.2750 1.721 0.9939
Cr/V-0.5-62 0.5317 0.5470 0.5321 0.5566 0.9999
Cr/V-0.5-56 0.1097 0.0619 0.1095 0.0629 0.9999
Cr/V-0.5-54 0.4360 0.0688 0.4351 0.0701 0.9991
Cr/V-1.0-74 0.6318 0.2718 0.6299 0.3048 0.9999
Cr/V-1.0-64 0.4950 0.0940 0.4929 0.1409 0.9987
Cr/V-1.0-62 0.5256 0.2570 0.5257 0.2572 0.9999
Cr/V-1.0-58 0.5510 0.1664 0.5516 0.1665 0.9999
Cr/V-1.0-51 0.1198 0.1223 0.1239 0.1160 0.9999
HAbbreviations are as follows: D, hydrodynamic dispersion coefficient; v, average pore water velocity; and β, fraction mobile water. IExperiments are identified by three components: column method (V = vacuum, U = UFA), tracer concentration (mM), and percent moisture saturation.

95
APPENDIX J – Comparison of tritium transport parameters for the UFA (centrifuge system), 0.5 mM Cr(VI) tracer solution, determined using the equilibrium (EQ) and nonequilibrium (NON) modelsHHHH
ExperimentIIII vEQ (cm⋅⋅⋅⋅min-1)
DEQ vNON (cm⋅⋅⋅⋅min-1)
DNON ββββ
Cr/U-0.5-75 0.2033 0.0916 0.2105 0.0905 0.9999
Cr/U-0.5-70 0.3622 0.2264 0.3306 0.2084 0.9141
Cr/U-0.5-68 0.3401 0.2276 0.3240 0.3303 0.9999
Cr/U-0.5-57 0.6052 0.6514 0.6026 0.6314 0.9931
Cr/U-0.5-51 0.2345 0.3335 0.2354 0.3359 0.9999
Cr/U-0.5-45 0.5381 0.5166 0.4817 0.4818 0.9999
Cr/U-0.5-32 0.6720 1.007 0.2778 0.3333 0.3947
Cr/U-0.5-31 0.5704 1.785 0.6127 1.544 0.9929
Cr/U-0.5-28 0.7020 1.188 0.7018 1.185 0.9996
Cr/U-0.5-25 0.0066 8.411 0.3513 7.933 0.9999
Cr/U-0.5-19 1.2040 10.78 1.152 11.24 0.9878
Cr/U-0.5-18 0.9767 16.56 0.9482 16.54 0.9974
Cr/U-0.5-16 0.6786 2.37 0.6765 2.466 0.9989
HAbbreviations are as follows: D, hydrodynamic dispersion coefficient; v, average pore water velocity; and β, fraction mobile water. IExperiments are identified by three components: column method (V = vacuum, U = UFA), tracer concentration (mM), and percent moisture saturation.

96
APPENDIX K – Comparison of tritium transport parameters for the UFA (centrifuge system), 1.0 mM Cr(VI) tracer solution, determined using the equilibrium (EQ) and nonequilibrium (NON) modelsHHHH
ExperimentIIII vEQ (cm⋅⋅⋅⋅min-1)
DEQ vNON (cm⋅⋅⋅⋅min-1)
DNON ββββ
Cr/U-1.0-94 0.1741 0.2617 0.1751 0.2337 0.9999
Cr/U-1.0-66 0.3398 0.0101 0.3022 0.0262 0.8842
Cr/U-1.0-57a 0.2676 0.4168 0.2714 0.3973 0.9999
Cr/U-1.0-57b 0.2707 0.1623 0.2751 0.2236 0.9972
Cr/U-1.0-44 0.5807 0.6764 0.5789 0.6876 0.9999
Cr/U-1.0-33 0.6005 0.5527 0.6005 0.5484 0.9999
Cr/U-1.0-26a 0.6612 3.3190 0.6590 3.3570 0.9999
Cr/U-1.0-26b 0.6460 3.0920 0.5767 2.8440 0.9006
Cr/U-1.0-21 1.4420 4.2820 1.2250 4.9720 0.9758
Cr/U-1.0-19 0.6786 2.3700 0.6692 2.8770 0.9971
Cr/U-1.0-17 1.2840 5.8160 1.2750 6.0520 0.9999
HAbbreviations are as follows: D, hydrodynamic dispersion coefficient; v, average pore water velocity; and β, fraction mobile water. IExperiments are identified by three components: column method (V = vacuum, U = UFA), tracer concentration (mM), and percent moisture saturation.

97
APPENDIX L – pH change during saturated Cr(VI) experiment using 1 mM K2Cr2O7 solution at 0.789 cm3⋅⋅⋅⋅min-1.
4.0
4.1
4.2
4.3
4.4
4.5
4.6
0 4 8 12 16
Pore volume
pH
Switched back to AGW

98
APPENDIX M – Saturated Cr(VI) breakthrough curves for vacuum and UFA experiments at 0.5 and 1.0 mM Cr(VI) concentrations.
0.0
0.2
0.4
0.6
0.8
1.0
1.2
0 5 10 15 20 25 30 35
Pore volume
Efflu
ent (
C/C
o)
Vacuum 0.5mMVacuum 1.0mMUFA 0.5mMUFA 1.0mM

99
APPENDIX N – Cr(VI) vacuum curves for 0.5 mM Cr(VI) at all moisture saturation levels.
0.0
0.2
0.4
0.6
0.8
1.0
1.2
0 5 10 15 20 25 30
Pore volume
Efflu
ent (
C/C
o) 75%66%63%56%54%

100
APPENDIX O – Cr(VI) vacuum curves for 1.0 mM Cr(VI) at all moisture saturation levels.
0.0
0.2
0.4
0.6
0.8
1.0
1.2
0 5 10 15 20
Pore volume
Efflu
ent (
C/C
o) 74%64%62%58%51%

101
APPENDIX P – Selected Cr(VI) UFA 0.5mM curves at various moisture saturation levels.
0.0
0.2
0.4
0.6
0.8
1.0
1.2
0 4 8 12 16 20 24 28 32 36 40
Pore volume
Efflu
ent (
C/C
o)
75%57%45%18%

102
APPENDIX Q – Selected Cr(VI) UFA 1.0 mM curves at various moisture saturation levels.
0.0
0.2
0.4
0.6
0.8
1.0
1.2
0 4 8 12 16 20 24 28 32 36 40
Pore volume
Efflu
ent (
C/C
o)
94%57%44%19%

103
APPENDIX R – Observed and predicted Cr(VI) transport in UFA and vacuum columns. Curves are fit using the equilibrium transport model.
Observed Predicted
Cr/U-1.0-44
0.0
0.2
0.4
0.6
0.8
1.0
0 5 10 15 20 25
Pore volume
C/C
o
Cr/U-0.5-25
0.0
0.2
0.4
0.6
0.8
1.0
0 10 20 30 40 50 60
Pore volume
C/C
o
Cr/V-1.0-57
0.0
0.2
0.4
0.6
0.8
1.0
1.2
0 5 10 15 20
Pore volume
C/C
o
R2 = 0.9517
R2 = 0.9042
R2 = 0.8889

104
APPENDIX S – Comparison of Cr(VI) retardation factors for the vacuum system, determined by direct measurement or from solute breakthrough curves evaluated using the equilibrium (EQ) and nonequilibrium (NON) modelsHHHH
ExperimentIIII ρρρρb
(g⋅⋅⋅⋅cm-3) Q
(cm3⋅⋅⋅⋅min-1) θθθθ REQ RNON
Cr/V-0.5-75 1.44 0.813 0.34 4.540 4.571
Cr/V-0.5-63 1.43 0.706 0.29 3.296 3.317
Cr/V-0.5-62 1.45 0.735 0.28 4.938 4.946
Cr/V-0.5-56 1.46 0.131 0.25 6.476 6.469
Cr/V-0.5-54 1.45 0.700 0.24 4.578 4.575
Cr/V-1.0-74 1.49 0.789 0.32 3.284 3.285
Cr/V-1.0-64 1.50 0.671 0.28 3.032 3.034
Cr/V-1.0-62 1.50 0.730 0.27 3.222 3.222
Cr/V-1.0-58 1.48 0.664 0.25 3.314 3.317
Cr/V-1.0-51 1.45 0.142 0.23 4.074 4.207
HAbbreviations are as follows: ρb, bulk density; Q, flow rate; θ, volumetric water content; REQ, retardation coefficient from equilibrium model; and RNON, retardation coefficient from nonequilibrium model. IExperiments are identified by three components: column method (V = vacuum, U = UFA), tracer concentration (mM), and percent moisture saturation.

105
APPENDIX T – Comparison of Cr(VI) retardation factors for the UFA (centrifuge system), 0.5 mM Cr(VI) tracer solution, determined using the equilibrium (EQ) and nonequilibrium (NON) modelsHHHH
ExperimentIIII ρρρρb (g⋅⋅⋅⋅cm-3)
Q (cm3⋅⋅⋅⋅min-1)
θθθθ REQ RNON
Cr/U-0.5-75 1.47 0.792 0.34 3.439 3.553
Cr/U-0.5-70 1.57 0.810 0.29 5.303 5.301
Cr/U-0.5-68 1.58 0.810 0.28 5.096 5.283
Cr/U-0.5-57 1.54 0.810 0.24 8.496 8.485
Cr/U-0.5-51 1.55 0.500 0.21 6.283 6.312
Cr/U-0.5-45 1.56 0.810 0.19 7.062 6.362
Cr/U-0.5-32 1.53 0.810 0.13 8.000 7.736
Cr/U-0.5-31 1.52 0.810 0.13 8.813 8.663
Cr/U-0.5-28 1.56 0.810 0.11 8.819 8.823
Cr/U-0.5-25 1.57 0.810 0.10 9.940 12.32
Cr/U-0.5-19 1.53 0.810 0.08 15.33 15.62
Cr/U-0.5-18 1.50 0.810 0.08 12.16 12.06
Cr/U-0.5-16 1.48 0.810 0.07 2.787 2.847
HAbbreviations are as follows: ρb, bulk density; Q, flow rate; θ, volumetric water content; REQ, retardation coefficient from equilibrium model; and RNON, retardation coefficient from nonequilibrium model. IExperiments are identified by three components: column method (V = vacuum, U = UFA), tracer concentration (mM), and percent moisture saturation.

106
APPENDIX U – Comparison of Cr(VI) retardation factors for the UFA (centrifuge system), 1.0 mM Cr(VI) tracer solution, determined using the equilibrium (EQ) and nonequilibrium (NON) modelsHHHH
ExperimentIIII ρρρρb (g⋅⋅⋅⋅cm-3)
Q (cm3⋅⋅⋅⋅min-1)
θθθθ REQ RNON
Cr/U-1.0-94 1.47 0.792 0.41 2.308 2.299
Cr/U-1.0-66 1.57 0.810 0.27 2.988 2.815
Cr/U-1.0-57a 1.56 0.500 0.23 4.745 4.746
Cr/U-1.0-57b 1.54 0.810 0.24 2.964 3.101
Cr/U-1.0-44 1.58 0.810 0.18 4.409 4.408
Cr/U-1.0-33 1.57 0.810 0.14 4.664 4.658
Cr/U-1.0-26a 1.53 0.810 0.11 11.46 11.49
Cr/U-1.0-26b 1.53 0.810 0.11 7.122 7.166
Cr/U-1.0-21 1.54 0.810 0.09 12.07 11.72
Cr/U-1.0-19 1.49 0.810 0.08 2.858 3.103
Cr/U-1.0-17 1.51 0.810 0.07 6.399 6.454
HAbbreviations are as follows: ρb, bulk density; Q, flow rate; θ, volumetric water content; REQ, retardation coefficient from equilibrium model; and RNON, retardation coefficient from nonequilibrium model. IExperiments are identified by three components: column method (V = vacuum, U = UFA), tracer concentration (mM), and percent moisture saturation.

107
APPENDIX V – Retardation factors calculated using the nonequilibrium model, RNON, versus retardation factors calculated using the equilibrium model, REQ for UFA and vacuum Cr(VI) data.
y = 1.0186x - 0.0559R2 = 0.9808
0
2
4
6
8
10
12
14
16
18
0 3 6 9 12 15 18
REQ
RN
ON

108
APPENDIX W -- Percent recovery of Cr(VI) after experiment completion and after extraction with 10 mM KH2PO4 solution.
ExperimentHHHH Experimental % recovery
% recovery after extraction
Cr/V-0.5-75 79.6 89.3 Cr/V-0.5-66 111.4 111.4 Cr/V-0.5-63 75.4 75.4 Cr/V-0.5-56 82.3 82.3 Cr/V-0.5-54 92.2 97.9 Cr/V-1.0-74 94.2 98.3 Cr/V-1.0-64 70.2 78.9 Cr/V-1.0-62 83.8 92.7 Cr/V-1.0-58 97.4 100.6 Cr/V-1.0-51 75.2 94.8 Cr/U-0.5-75 99.6 105.5 Cr/U-0.5-70 73.2 90.9 Cr/U-0.5-68 71.8 90.5 Cr/U-0.5-57 89.8 91.1 Cr/U-0.5-51 70.6 78.4 Cr/U-0.5-45 83.2 100.3 Cr/U-0.5-32 68.8 89.0 Cr/U-0.5-31 67.6 89.1 Cr/U-0.5-28 82.5 91.6 Cr/U-0.5-25 83.0 92.0 Cr/U-0.5-19 63.7 91.6 Cr/U-0.5-18 73.8 79.8 Cr/U-0.5-16 95.0 98.1 Cr/U-1.0-94 99.4 103.1 Cr/U-1.0-66 64.2 74.3 Cr/U-1.0-57a 77.9 86.2 Cr/U-1.0-57b 104.0 105.5 Cr/U-1.0-44 97.4 109.8 Cr/U-1.0-33 78.6 99.7 Cr/U-1.0-26a 53.2 77.1 Cr/U-1.0-26b 59.0 81.8 Cr/U-1.0-21 69.6 94.6 Cr/U-1.0-19 94.5 103.7 Cr/U-1.0-17 84.1 98.6 AVERAGE 81.4 92.5
HExperiments are identified by three components: column method (V = vacuum, U = UFA), tracer concentration (mM), and percent moisture saturation.