comparison of two methods of recording dpoaes over … · comparison of two methods of recording...
TRANSCRIPT
Comparison of Two Methods of Recording DPOAEs Over a Wide Frequency Range in a Large
PopulationSumitrajit Dhar, Rebekah Abel, Jungmee Lee, Renee Banakis, and Jonathan Siegel; The Hugh Knowles Center & The Roxelyn & Richard Pepper Department of
Communication Sciences & Disorders, Northwestern University, Evanston, IL.
Tonal signals continuously swept in frequency were used in some of the earliest investigations of distortion product otoacoustic
emissions (DPOAEs) (e.g., Brown and Kemp, 1984). This technique has recently come into use again (e.g., Long, Talmadge, & Lee,
2008) and certainly provides the opportunity to rapidly record DPOAE data at very high frequency density. However, stimulus tones
at discrete frequencies have been the used in the vast majority of reports on DPOAEs to date. DPOAEs recorded using these two
techniques need to be thoroughly and carefully compared. Long et. al., (2008) showed the equivalence between DPOAEs recorded
using tones at discrete frequencies and tones swept in frequency at 8 or 16 s/octave and in six human ears for f2 frequencies up to 4
kHz. In this report we compare DPOAEs recorded using swept- and discrete-frequency stimuli in a population of approximately 100
human ears. DPOAEs were recorded on the same day using two different hardware and software setups from each ear between f2
frequencies of 0.5 and 16 kHz using a stimulus frequency ratio of 1.22 and three stimulus level combinations (L1/L2 = 55/40, 65/55,
75/75). DPOAE levels recorded using the two different techniques will be compared statistically across the whole population as well
as in specific age groups.
Stimulus tones continuously swept in frequency were used to record DPOAEs in some of the earliest
publications (e.g., Brown and Kemp, 1984). Measurements systems and practices have since evolved to
predominantly use tones pairs at discrete frequencies to record DPOAEs. Sophisticated strategies have been
developed and deployed to achieve criterion noise levels and/or signal-to-noise ratios (SNR) before
recording is terminated for any given stimulus-frequency pair. Such strategies are particularly useful in
clinical systems where automatic decision making is of great advantage.
When recorded at closely spaced frequencies, DPOAEs demonstrate a pseudo-periodic pattern of
peaks and valleys, typically referred to as fine structure or microstructure. Fine structure depth is sensitive to
minor insults to the cochlea (Engdahl and Kemp, 1996). Increasing interest in evaluating the clinical utility
of DPOAE fine structure has been stymied by the time consuming process of recording DPOAEs at closely
spaced frequencies. This practical difficulty can potentially be overcome by using stimulus tones swept in
frequency.
The equivalence between DPOAEs recorded using swept frequency stimuli and those recorded using
traditional discrete frequency stimuli has to be carefully evaluated before this new recording paradigm can
be adopted for clinical use. Without such equivalence DPOAEs recorded using swept frequency stimulus
tones could not be evaluated against existing normative data sets which were all established using discrete
frequency stimulus tones. Long et al., (2008) have demonstrated virtual equivalence between DPOAE
recorded using swept and discrete frequency stimuli on six human ears for f2 frequencies up to 4 kHz. Here
we extend these results to f2 frequencies of 17 kHz and multiple stimulus-level combinations on a cohort of
109 human subjects.
Introduction
The presented data were recorded from 109 subjects between 10 and 65 years of age. Average pure-tone
thresholds for 0.5, 1, 2, and 4 kHz ranged between 0 and 60 dB HL. Stimuli were presented to the
participants using MB Quart 13.01 HX speakers. The output of the transducers was coupled to the
participant’s ear canal via an Etymotic Research ER-10B+ microphone probe assembly. The ear-canal
signal was then passed through its preamplifier (20 dB gain). Analog-to-digital and digital-to-analog
conversions were performed using a 24 bit input/output device, set at a sampling rate of 44,100 Hz.
Stimulus levels were specified as SPL measured in an IEC-711 ear-simulator with insertion depth
compensation (Siegel, 2009 ARO poster #34). Stimulus frequency ratio of 1.22 and stimulus-level
combinations of 55/40, 65/55, and 75/75 dB SPL were used. Two independent computer systems were used
to record swept and discrete frequency DPOAEs.
Swept Frequency: Custom software developed by Dr. Carrick Talmadge running on an Apple Macintosh
computer was used to generate and record signals. Stimulus tones were swept at 8 and 24 s/octave for
frequencies below and above 6 kHz. DPOAE phase and magnitude was estimated using a least squares fit
algorithm (Long and Talmadge, 1997). Six sweeps were typically averaged for each subject. Experimenters
used their discretion to record additional sweeps when an acceptable SNR was not achieved after six
sweeps.
Discrete Frequency: Discrete Frequency: Measurements were made using Emav (Neely & Liu, 1994)
running on an IBM personal computer running Windows XP. Signals were generated by a Card Deluxe
audio interface at a sample rate of 44.1 kHz, responses were averaged into an 8192 point buffer and
analyzed using an 8192 point FFT. Stimuli were presented for a minimum of 1.5 seconds with averaging
time extended until one of the stopping conditions was reached: maximum time of 4 seconds, SNR > 12 dB
or a noise floor of < -20 dB SPL.
Post Processing: DPOAE level and noise floor were averaged by 1/3 octave bands centered around
audiometric test frequencies between 0.75 and 17 kHz. All data points with a noise floor estimate less than 0
dB SPL were included in the average. Mean DPOAE and noise levels and 95% confidence intervals (CI)
were computed for each frequency and each stimulus level combination. DPOAE levels and noise floor
measured at each frequency using the swept and discrete frequency stimuli were compared using the
Kendall tau b correlation coefficient. This non-parametric statistic is a measure of association between pairs
of observations.
Methods
Brown, A. M., Kemp, D. T.. (1984) "Suppressibility of the 2f1-f2 stimulated acoustic emissions in gerbil and man", Hearing Research 13: 29—37.
Engdahl, B., Kemp, D. T.. (1996) "The effect of noise exposure on the details of distortion product otoacoustic emissions in humans", Journal of the Acoustical Society of
America 99: 1573-87.
Long, G. R., Talmadge, C. L.. (1997) "Spontaneous otoacoustic emission frequency is modulated by heartbeat", Journal of the Acoustical Society of America 102: 2831—
2848.
Long, G. R., Talmadge, C. L., Lee, J.. (2008) "Measuring distortion product otoacoustic emissions using continuously sweeping primaries", 124: 1613.
Neely, S. T., and Liu, Z. (1994). ―EMAV: Otoacoustic emission averager,‖ Technical Memo No. 17, Boys Town National Research Hospital, Omaha, NE.
AcknowledgementsThe authors would like to thank Salvador Aguiñaga, Lauren Calandruccio, Erica Choe, Chun Liang Chan, Kathleen Dunckley, Evan Grolley, Helen
Han, Lauren Hardies, Vickie Hellyer, Jungwha Julia Lee, Allan Morgan, Kelly Waldvogel, Coryn Weissinger, Darrin Worthington, Steve Zecker and
Wei Zhao.
References
Abstract
Figure 4. Comparison of noise floor estimates obtained using discrete and swept frequency stimuli. The
construction of the figure is similar to that of Figure 3.
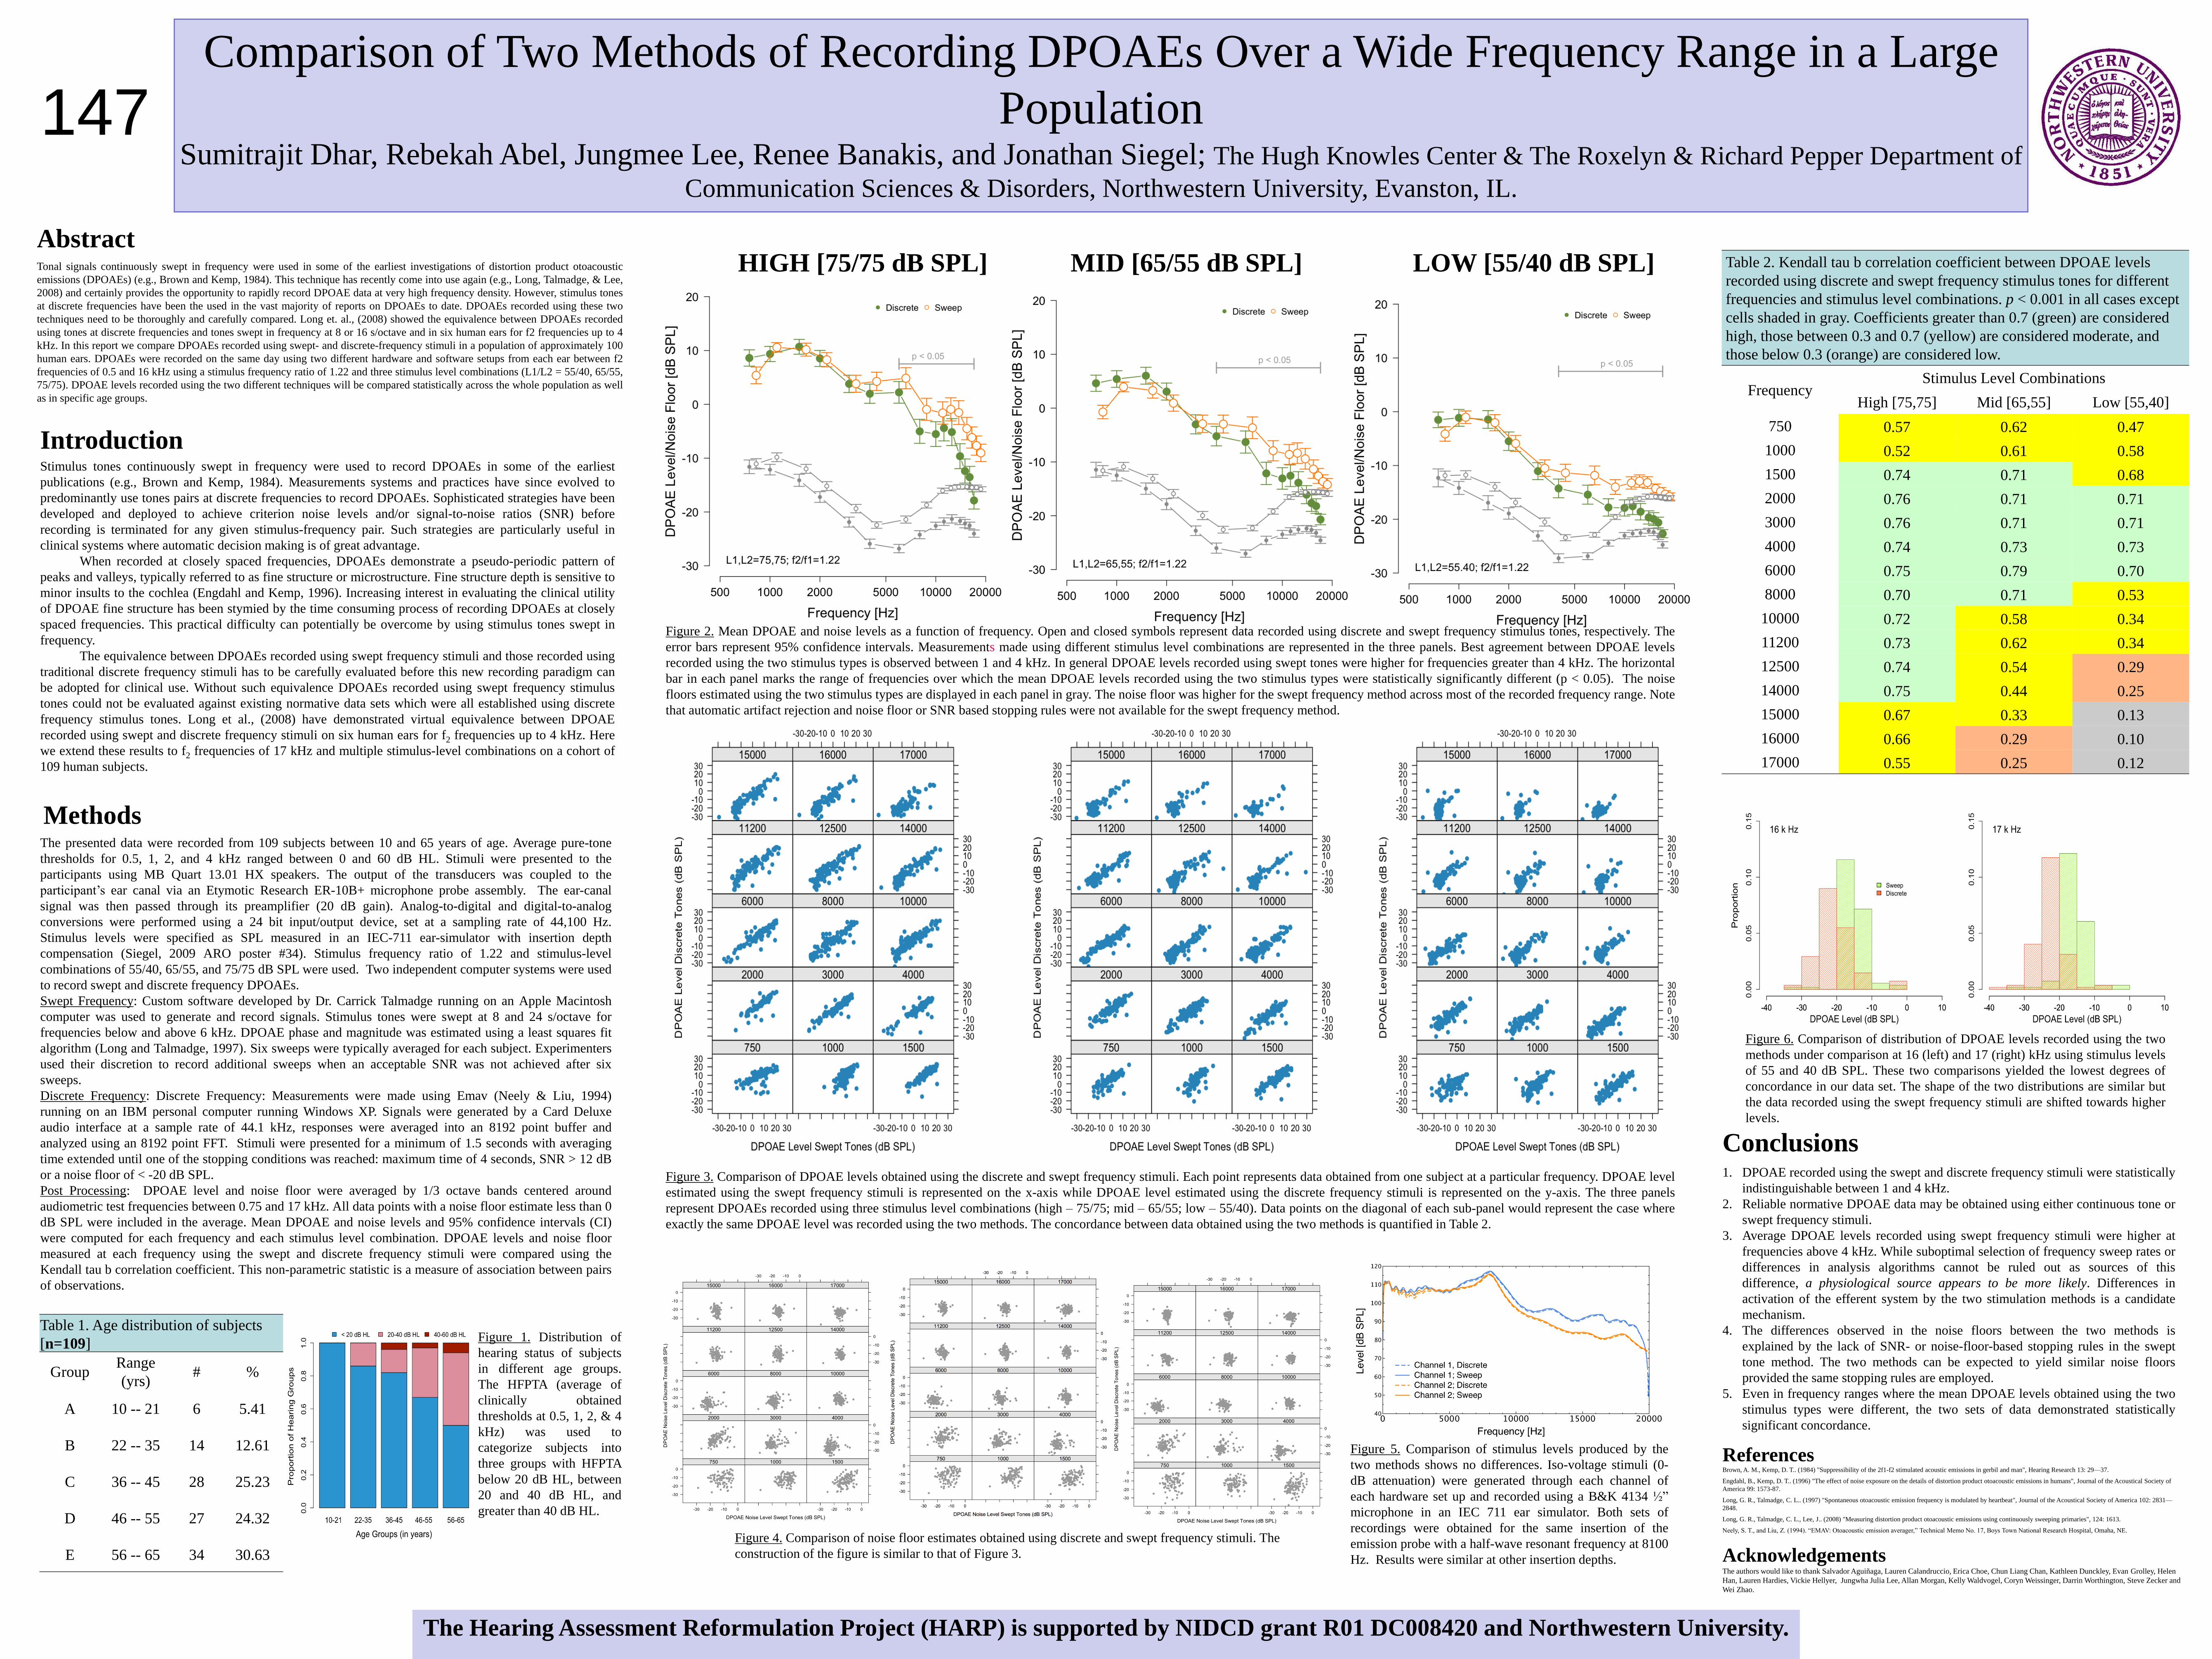
HIGH [75/75 dB SPL] MID [65/55 dB SPL] LOW [55/40 dB SPL]
Table 1. Age distribution of subjects
[n=109]
GroupRange
(yrs)# %
A 10 -- 21 6 5.41
B 22 -- 35 14 12.61
C 36 -- 45 28 25.23
D 46 -- 55 27 24.32
E 56 -- 65 34 30.63
Figure 1. Distribution of
hearing status of subjects
in different age groups.
The HFPTA (average of
clinically obtained
thresholds at 0.5, 1, 2, & 4
kHz) was used to
categorize subjects into
three groups with HFPTA
below 20 dB HL, between
20 and 40 dB HL, and
greater than 40 dB HL.
Figure 2. Mean DPOAE and noise levels as a function of frequency. Open and closed symbols represent data recorded using discrete and swept frequency stimulus tones, respectively. The
error bars represent 95% confidence intervals. Measurements made using different stimulus level combinations are represented in the three panels. Best agreement between DPOAE levels
recorded using the two stimulus types is observed between 1 and 4 kHz. In general DPOAE levels recorded using swept tones were higher for frequencies greater than 4 kHz. The horizontal
bar in each panel marks the range of frequencies over which the mean DPOAE levels recorded using the two stimulus types were statistically significantly different (p < 0.05). The noise
floors estimated using the two stimulus types are displayed in each panel in gray. The noise floor was higher for the swept frequency method across most of the recorded frequency range. Note
that automatic artifact rejection and noise floor or SNR based stopping rules were not available for the swept frequency method.
Figure 3. Comparison of DPOAE levels obtained using the discrete and swept frequency stimuli. Each point represents data obtained from one subject at a particular frequency. DPOAE level
estimated using the swept frequency stimuli is represented on the x-axis while DPOAE level estimated using the discrete frequency stimuli is represented on the y-axis. The three panels
represent DPOAEs recorded using three stimulus level combinations (high – 75/75; mid – 65/55; low – 55/40). Data points on the diagonal of each sub-panel would represent the case where
exactly the same DPOAE level was recorded using the two methods. The concordance between data obtained using the two methods is quantified in Table 2.
Table 2. Kendall tau b correlation coefficient between DPOAE levels
recorded using discrete and swept frequency stimulus tones for different
frequencies and stimulus level combinations. p < 0.001 in all cases except
cells shaded in gray. Coefficients greater than 0.7 (green) are considered
high, those between 0.3 and 0.7 (yellow) are considered moderate, and
those below 0.3 (orange) are considered low.
FrequencyStimulus Level Combinations
High [75,75] Mid [65,55] Low [55,40]
750 0.57 0.62 0.47
1000 0.52 0.61 0.58
1500 0.74 0.71 0.68
2000 0.76 0.71 0.71
3000 0.76 0.71 0.71
4000 0.74 0.73 0.73
6000 0.75 0.79 0.70
8000 0.70 0.71 0.53
10000 0.72 0.58 0.34
11200 0.73 0.62 0.34
12500 0.74 0.54 0.29
14000 0.75 0.44 0.25
15000 0.67 0.33 0.13
16000 0.66 0.29 0.10
17000 0.55 0.25 0.12
Figure 6. Comparison of distribution of DPOAE levels recorded using the two
methods under comparison at 16 (left) and 17 (right) kHz using stimulus levels
of 55 and 40 dB SPL. These two comparisons yielded the lowest degrees of
concordance in our data set. The shape of the two distributions are similar but
the data recorded using the swept frequency stimuli are shifted towards higher
levels.
1. DPOAE recorded using the swept and discrete frequency stimuli were statistically
indistinguishable between 1 and 4 kHz.
2. Reliable normative DPOAE data may be obtained using either continuous tone or
swept frequency stimuli.
3. Average DPOAE levels recorded using swept frequency stimuli were higher at
frequencies above 4 kHz. While suboptimal selection of frequency sweep rates or
differences in analysis algorithms cannot be ruled out as sources of this
difference, a physiological source appears to be more likely. Differences in
activation of the efferent system by the two stimulation methods is a candidate
mechanism.
4. The differences observed in the noise floors between the two methods is
explained by the lack of SNR- or noise-floor-based stopping rules in the swept
tone method. The two methods can be expected to yield similar noise floors
provided the same stopping rules are employed.
5. Even in frequency ranges where the mean DPOAE levels obtained using the two
stimulus types were different, the two sets of data demonstrated statistically
significant concordance.
Conclusions
147
Figure 5. Comparison of stimulus levels produced by the
two methods shows no differences. Iso-voltage stimuli (0-
dB attenuation) were generated through each channel of
each hardware set up and recorded using a B&K 4134 ½‖
microphone in an IEC 711 ear simulator. Both sets of
recordings were obtained for the same insertion of the
emission probe with a half-wave resonant frequency at 8100
Hz. Results were similar at other insertion depths.
The Hearing Assessment Reformulation Project (HARP) is supported by NIDCD grant R01 DC008420 and Northwestern University.