comparison of three processes for parenteral nanoemulsion
TRANSCRIPT

HAL Id: hal-02362258https://hal.archives-ouvertes.fr/hal-02362258
Submitted on 28 Nov 2019
HAL is a multi-disciplinary open accessarchive for the deposit and dissemination of sci-entific research documents, whether they are pub-lished or not. The documents may come fromteaching and research institutions in France orabroad, or from public or private research centers.
L’archive ouverte pluridisciplinaire HAL, estdestinée au dépôt et à la diffusion de documentsscientifiques de niveau recherche, publiés ou non,émanant des établissements d’enseignement et derecherche français ou étrangers, des laboratoirespublics ou privés.
Comparison of Three Processes for ParenteralNanoemulsion Production: Ultrasounds, Microfluidizer,
and Premix Membrane EmulsificationOcéane Alliod, Eyad Almouazen, Georgio Nemer, Hatem Fessi, Catherine
Charcosset
To cite this version:Océane Alliod, Eyad Almouazen, Georgio Nemer, Hatem Fessi, Catherine Charcosset. Comparison ofThree Processes for Parenteral Nanoemulsion Production: Ultrasounds, Microfluidizer, and PremixMembrane Emulsification. Journal of Pharmaceutical Sciences, Wiley, 2019, 108 (8), pp.2708-2717.�10.1016/j.xphs.2019.03.026�. �hal-02362258�

Comparison of three processes for parenteral nanoemulsion production:ultrasounds, microfluidizer and premix membrane emulsification
Oceane Alliod, Eyad Almouazen, Georgio Nemer, Hatem Fessi, Catherine Charcosset∗
Univ Lyon, Universite Claude Bernard Lyon 1, CNRS, LAGEP UMR 5007, 43 boulevard du 11 novembre 1918, F-69100,VILLEURBANNE, France
Abstract
Nanoemulsions are of great interest for pharmaceutical applications, including parenteral dosage forms.
However, their production is still limited and requires more efficient and adaptive technologies. The more
common systems are high-shear homogenization like microfludizers (MF) at industrial scale and ultrasounds
at research scale, both based on high energy limiting their application for sensitive drugs. Recently, a process
based on premix membrane emulsification (PME) was developed to produce nanoemulsions. These three
processes have been compared for the production of a model parenteral nanoemulsion containing all-trans-
retinoic acid, a thermolabile molecule which is used in the treatment of acute promyelocytic leukemia in a
parenteral form. Droplet size and active integrity were studied because of their major interest for efficacy
and safety assessment. Regarding droplet size, PME produced monodispersed droplets of 335 nm compared
to the other processes which produced nanoemulsions of around 150 nm but with the presence of micron
size droplets detected by laser diffraction and optical microscopy. No real difference between the three
processes was observed on active degradation during emulsifcation. However, regarding stability, especially
at 40oC nanoemulsions obtained with the microfluidizer showed a greater molecule degradation and unstable
nanoemulsion with a 4 times droplet size increase under stress conditions.
Keywords: Parenteral Nanoemulsion, Premix membrane emulsification, atRA, Microfludizer, Ultrasounds
1. Introduction
Nanoemulsions are dispersed systems of droplets with nanometric diameter (< 500 nm) which are used
in several pharmaceutical dosage forms and cosmetic formulations. The small droplet size enhances emulsion
kinetic stability, allows to solubilize and protect hydrophobic drug molecules and contributes to drug bioavail-
ability enhancement. Their versatility, biocompatibility and biodegradability make these systems valuable5
Abbreviations: atRA, all-trans-retinoic acid; DLS, Dynamic light scattering; DME, Direct membrane emulsification; FDA,Food and drug administration; HLB Hydrophilic and Lipophilic balance; HPLC High pressure liquid chromatography; LD, Laserdiffraction; O/W, oil-in-water; MCT, Medium chain triglycerides; MF, Microfluidizer; PDI, Polydispersity index; PME, Premixmembrane emulsification; SLN, Solid lipid nanoparticles SPG, Shirasu Porous Glass; ; US, Ultrasounds;
∗Corresponding author. Address: Univ Lyon, Universite Claude Bernard Lyon 1, CNRS, LAGEP UMR 5007, 43 boulevarddu 11 novembre 1918, F-69100, VILLEURBANNE, France. Tel.: +33 4 72 43 18 34
Email address: [email protected] (Catherine Charcosset)
Preprint submitted to Journal of Pharmaceutical Sciences March 12, 2019
pharmaceutical asset in different marketed dosage forms for oral, nasal, parenteral, dermal, transdermal,
ocular and pulmonary administration routes [1, 2, 3].
Nanoemulsions are the unique choice for intravenous emulsion-based formulations which require specific
and strict criteria including controlled droplet sizes (less than 1 or 2 µm) [4], restricted composition, physico-
chemical and biological stability and sterilized requirement. Parenteral nanoemulsions have been presented10
in numerous studies [5, 6, 7, 8] and were included in several clinical trials such as treatment of leukemia
[9] and diabetic dyslipidemia [10]. Parenteral nanoemulsions are interesting formulations for the delivery of
many drugs [4]. They can avoid the use of conventional co-solvent systems and the associated undesirable
effects caused by precipitation of the drug at the injection site, as well as protein binding and hydrolytic
degradation of drugs. Another advantage of parenteral emulsions is their potential to achieve a sustained15
release and to target concerned tissue [7].
Manufacturing of nanoemulsions is usualy classified into low and high energy emulsification methods. Low-
energy emulsification methods are based on physico-chemical principles such as phase inversion temperature,
phase inversion composition or nanoprecipitation [11]. However, the specific composition requirement inherent
in these methods gives high energy methods an advantage. Indeed, high energy processes are suitable for a20
larger range of formulations as nanoemulsions are generated using mechanical devices with intensive disruptive
forces that breakup the oil and water phases [12]. Among these high energy methods, the most used are
high pressure homogenizers, microfluidizers (MF) and ultrasounds (US). The two first techniques are based
on similar technologies, a high pressure flux in a microchannel creating high shear stress with cavitation
and impact. The main difference is that MF presents an interaction chamber of fixed geometry whereas25
in traditional high pressure homogenizers the valve moves to create the pressure. MF and high pressure
homogenizers [13] require high energy input (pressure applied up to around 2000 bars). Unfortunately, only
0.1 % of the energy input is actually used for emulsification, while the remaining energy (99.9%) is dissipated
as heat [14]. Moreover, monodispersed droplets are obtained only after several cycles, as all droplets do
not undergo the same shear stress depending on their position in the interaction chamber. US is based on30
cavitation mechanism and requires also high energy input. This process can generate nanoemulsions with
very small droplet size, but usually broad size distributions are obtained and is limited to laboratory scale.
The drawback of these technologies is their energy consumption but also the additional cost for scaling up,
which is known as one of the biggest challenges for nanoemulsions production in the pharamaceutical industry
[15]. Moreover, high thermal energy produced during emulsification limits their application for thermolabile35
drugs.
More recently, membrane emulsification has gained significant attention because of the low energy required
leading to low shear stress and temperature increase and its good scalability. Membranes can be used either
to generate an emulsion, the process is then called direct membrane emulsification or to modify it and is
then called premix membrane emulsification (PME). In direct membrane emulsification, a dispersed phase is40
injected through membrane pores in a continuous phase. In PME, a coarse emulsion called premix is injected
2

directly through the microporous membrane in order to form smaller droplets. Advantages of PME over
DME are that the flowrate of the product emulsion is generally much higher, higher droplet concentrations
are obtained and the mean droplet sizes are smaller [16, 17]. For the production of nanoemulsions, PME is of
great interest. Bunjes et al. prepared nanoemulsions by PME with droplet sizes lower or around 200 nm with45
a narrow size distribution [18, 19, 20]). This result was explained by the high pore tortuosity and thickness of
the Shirasu Porous Glass (SPG) membranes which are the most commonly used membranes for emulsification.
Using these SPG membranes and PME, Bunjes and Joseph produced a few milliliters of nanoemulsion
[18, 19, 21]. The production of nanoemulsions by membrane emulsification remains a challenging undertaking
[18] especially for large volumes at high flowrates. Hitherto, this process has been used to homogenize small50
amounts of emulsion, but a recent publication by Alliod et al. [22] proposed a novel approach which allowed
the homogenization of 500 mL of coarse emulsion into a nanoemulsion by running it through membranes
with average pore sizes at a minimum of 0.2 µm whilst keeping pressure under 60 bars. Thus, PME can be
used to create nanoemulsions that carry sensitive active pharmaceutical ingredients prone to isomerization
or degradation. Also, this process presents additional industrial interest because it can work in a continuous55
way. Moreover, SPG membranes can be sterilized to ensure aseptic production for injectable nanoemulsions.
The aim of this study is to evaluate the potential of these three different processes on production of
nanoemulsions within the specific requirements of parenteral formulation. The first process, MF, is a com-
mercially and industrially available process. The second, US is a process used mostly at laboratory scale for
the production of nanoemulsions. The last process, PME, has been used for many years for the preparation of60
emulsions with micron-sized droplets, but has been investigated only recently for the production of emulsions
with droplets size below several microns. These three processes have never been investigated in the same
study, however a study compared a traditionnal membrane process (micron size) and a microfludizer for
emulsion production [23] and several compared ultrasounds and microfludizer for nanoemulsion production
[24, 25]. The first study showed interesting results for both processes but no size under one micron were65
reached with the membrane process [23]. Concerning comparison of US and MF, similar results in size were
often obtained.
In order to evaluate the effect of each process on possible active degradation, a model active was chosen,
all-trans-retinoic acid (atRA). This active has a great potential for injection but is very light and temperature
sensitive. This active form of vitamin A, atRA, has been marketed for oral and topical administrations. Its70
therapeutic potential is thus far limited to the treatment of acne [26] and other superficial skin ailments
and to the treatment of acute promyelocytic leukemia [27, 28], among other cancer types [29]. Modern
research posits that atRA influences tumor progression by affecting cancer cell proliferation rates and their
state of differentiation [30]. Numerous research efforts were dedicated to the development of parenterally
administrable forms in order to overcome the limitations of the existing prominent cancer-treating oral75
forms such as variable atRA bioavailability among patients and decrease its plasmatic level after long-term
treatment [26]. Therefore, it has been the subject of thorough investigation to propose adaptable parenteral
3

forms using cyclodextrins [31], liposomes [32], or lipid core nanocapsules [33, 34, 35]. To our knowledge, no
atRA-loaded nanoemulsion for parenteral administration has been developed.
The objective of this study is to compare the three processes for the production of atRA parenteral na-80
noemulsions regarding droplet size and drug stability. Firstly, the emulsion composition was selected after
HLB (hydrophilic and lipophilic balance) determination, solubility and osmometry measurements. Then,
nanoemulsions production was optimized regarding droplet size and dispersity. For that pressure and cycle
number were investigated for MF, number of cycles coupled with pore size for PME and intensity and process-
ing time for US. Following this optimization, the more interesting conditions for each process were selected85
and the active preservation was determined over 3 months with four storage conditions, ie: dark conditions
temperature of 4oC, ambient temperature and 40oC and in light conditions at ambient temperature.
2. Experimental Section
2.1. Materials
AtRA, 13-cis-retinoic acid, 9-cis-retinoic acid, Tween 20 (Polysorbate 20), Span 80 (Polysorbate 80)90
were purchased from Sigma Aldrich (France). Derquim+ was purchased from Derquim (Spain), Labrafac
wl1349 (MCT oil) was purchased from Gattefosse (France). Glycerol was purchased from Carl Roth (France).
Ultrapure water was obtained using a Millipore (France) Synergy Unit system.
2.2. Preparation of the premix
In order to determine the final quantity of atRA to be added to the emulsion to ensure no-crystallization95
after manufacturing, the solubility in MCT was determined. Tween 20 and Span 80 were chosen because both
emulsifiers are FDA approved for intravenous administration and are relatively innocuous in low quantities.
Moreover, to ensure optimal stability of the nanoemulsion, the emulsifier mix was added at a mass percentage
of 5% [22]. Finally, the osmolarity was adjusted by adding glycerol and was measured using an OSMOMAT
030 cryoscopic osmometer.100
Preparations were all performed at room temperature. Both phases were first prepared separately. The
oil phase was prepared by adding 10% MCT, 2.7% Span 80 and 0.2% atRA and stirring magnetically at 600
rpm until a homogeneous consistency was obtained. In the aqueous phase, 1.88% glycerol and 2.3% Tween
20 were dissolved in water. Once a homogeneous consistency was obtained for the aqueous phase, the oil
phase was poured while magnetic stirring was set at 600 rpm. The mixture was stirred until a homogeneous105
and consistent white color was obtained. During all the process, exposition to day light was avoided.
2.3. Production of nanoemulsions
2.3.1. PME
The experimental set-up and method used for the preparation of nanoemulsions by PME are adaptated
from the approach detailed by Alliod et al. [22] (Figure 1). The set-up comprised a high pressure benchtop110
4

single cylinder pump BTSP 500-5 (Floxlab, Nanterre, France). The pump is made of high grade stainless
steel and equipped with a pressure sensor (0.1 bar), two pneumatic valves for tank feeding and outlet delivery,
a control panel and a storage tank of 500 mL. Pressurization was obtained by way of an electric motor-driven
piston. A maximum flowrate of 200 mL/min can be obtained with this pump. The membrane module was
connected to the pump with high pressure fittings (Swagelock, France).115
Figure 1: Experimental set-up of the high syringe pump with membrane holder and SPG membrane
Hydrophilic SPG membranes were provided by SPG Technology Co. Ltd (Miyazaki, Japan). These
membranes are of a tubular design with an inner diameter of 8.5 mm and a uniform thickness of 0.8 mm.
20 mm membranes were used throughout the experimentation. Membranes with mean pore size of 0.2,
0.3, 0.4, 0.5 µm were investigated and their mean pore size data was provided by the manufacturer. The
membrane module used was an external pressure microkit module for membranes with a length of 20 mm120
(SPG Technology). The cleaning procedure consisted in three injections through the membrane of 500 mL
of a 1 % Derquim + solution [36] at 70oC and 200 mL/min, and then three injections of 500 mL of pure
water at room temperature and 200 mL/min. The membrane resistance to water was recovered after this
treatment.
To produce nanoemulsions, the premix was placed in the feed tank and pumped in the syringe pump. First125
20 mL premix was injected in order to remove air from the experimental set-up and fill it with premix. Most
of the experiments were then carried out with volumes of injection from 40 to 200 mL to perform all cycles
5

with sufficient material. The transmembrane pressure never exceeded 60 bars. The nanoemulsion produced
flew from the membrane tube under gravity and was collected in a beaker placed beneath the module.
The membrane used for production at each cycle was the following: Cycle 1 : 0.5 µm pore size; Cycle 2 :130
0.4 µm pore size; Cycle 3 : 0.3 µm pore size; Cycle 4 : 0.2 µm pore size. After each cycle the emulsion was
collected and analyzed. All emulsions were investigated in a stability study.
2.3.2. MF
An LM20 series Microfluidizer processor (Microfluidics, Massachussets, USA) was used. Its reservoir
capacity is 300 mL and it can be operated at pressures up to 2068 bars.135
The effects of several parameters were investigated: pressure values from 500 to 2000 bars; number of
cycles : 1, 2, 3, 4, and 5 cycles. After each cycle, the emulsion was collected and analyzed. For the stability
study, the preparations investigated were obtained after cycle 1, 3 and 5 at a pressure of 1000 bars.
2.3.3. US
A UP400S Ultrasonic Processor (Hielscher, Teltow, Germany) was used to create nanoemulsions. It is140
equipped with a 100 mm titanium cylindrical sonotrode (radius = 7 mm) and a sound protection box. Its
operating frequency is 24 kHz and its amplitude can be modulated using a simple knob fitted onto the device.
To obtain homogeneous size reduction, the emulsion was magnetically stirred throughout the homogenization
process. The preparations were placed in an ice bath to limit temperature increase.
Two variables were taken into account when evaluating US as an homogenization method: amplitude145
which was modulated at 30% and 60% and time of exposure which lasted 1, 2 or 5 min. For the stability
study, the essay investigated was obtained at 60% intensity for a duration of 5 min.
2.4. Particle size distribution measurements
For droplet size experiments and measurements were all done in triplicate. Average droplet size distribu-
tions and average results with standard deviations are presented.150
2.4.1. Dynamic light scattering
The droplet size was measured by means of dynamic light scattering (DLS) using a Zetasizer Nano Z
(Malvern Instruments, France). Data processing of the DLS measurements were done with the Zetasizer
software by both cumulants and distribution analysis. Results were Z-average, which is the mean size, and
the size distribution in intensity. Before measurement, the nanoemulsions were diluted in ultrapure water155
(the dilution factor was adjusted to obtain an attenuation factor between 7 and 9). The measurements were
realized at 25oC.
2.4.2. Laser diffraction
The droplet sizes of optimized nanoemulsions were measured by Laser Diffraction (LD) particle size
analysis with a Mastersizer 3000 (Malvern Instruments, France). The technique is based on measurement160
6

of the intensity of light scattered as a laser beam passes through a dispersed particulate sample. The Mie
scattering theory was used, with a refractive index and an absorption index set at 1.55 and 0.005 for the
dispersed phase, respectively. The continuous phase was ultrapure water with a refractive index 1.33. The
results were expressed by D50 the mean droplet diameter for which 50 % of droplets in volume are below this
size and the dispersity of the sample is given by the span value.165
2.5. Optical microscopy
A Leica DM2000 LED optical microscope fitted with a high definition camera was used to observe droplets
without dilution. The images were captured remotely and analyzed via the LAS EZ software developed by
Leica. Droplet sizes were determined using the software integrated features.
2.6. High Performance Liquid Chromatography170
atRA quantification in nanoemulsion was monitored using a RP-HPLC method (Agilent 1200 series) as
previously described by Almouazen et al.[37]. Briefly, C18 column with 2.6 µm particle size (Phenomenex,
Kinetex) was used as a stationary phase. Mobile phase composed of 30% methanol, 35% acetonitrile, 35%
of deionized water with 0.5% acetic acid was injected at a flowrate of 1.4 mL/min. All samples were diluted
in acetonitrile and the injected volume was 10µl. Finally the UV-detector was used at λ = 356 nm.175
2.7. Stability
Samples of interest were kept in stability in four different conditions: protected from light at temperature
of 4oC, ambient temperature and 40oC and exposed to day light at ambient temperature.
3. Results
3.1. Determination of optimal formulation180
O/W (oil-in-water) emulsions with HLB values of 9, 10 and 11 were observed by optical microscopy and
the preparation corresponding to the HLB value of 10 was determined to give the smallest droplet size. The
total mass of emulsifier (5 g per 100 g of emulsion) was comprised of 46% Tween 20 and 54% Span 80, or
2.3 g and 2.7 g per 100 g of emulsion, respectively. The solubility of atRA per gram of MCT was determined
to be 2.24 mg in average thus a concentration of 0.02% was used, 1.88% of glycerol was added to adjust185
emulsion osmolality to 0.300 osmol/kg and be isotonic with plasma.
All experiments were performed at a composition described in Table 1. The premix was obtained by the
same procedure for all experiments as described in Materials and Methods. The droplet size distribution of
the premixes were similar for all experiments and determined by LD at D50 = 10.3 µm and Span = 2.77.
3.2. Effect of the process on the resulting droplet size of the nanoemulsions190
Using the predefined premix formulation, nanoemulsions were prepared by the three procedures described
in details in Material and Methods. For each procedure, we evaluated and optimized experimental conditions
regarding the nanoemusion size distribution determined by DLS.
7
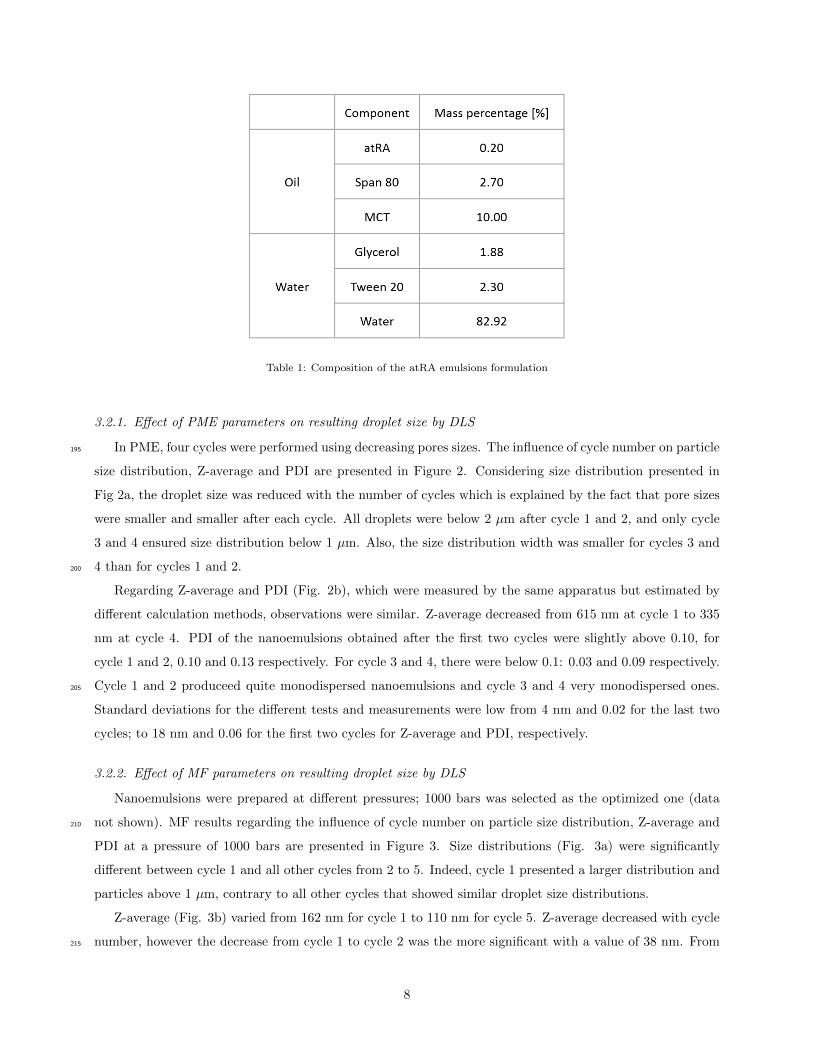
Table 1: Composition of the atRA emulsions formulation
3.2.1. Effect of PME parameters on resulting droplet size by DLS
In PME, four cycles were performed using decreasing pores sizes. The influence of cycle number on particle195
size distribution, Z-average and PDI are presented in Figure 2. Considering size distribution presented in
Fig 2a, the droplet size was reduced with the number of cycles which is explained by the fact that pore sizes
were smaller and smaller after each cycle. All droplets were below 2 µm after cycle 1 and 2, and only cycle
3 and 4 ensured size distribution below 1 µm. Also, the size distribution width was smaller for cycles 3 and
4 than for cycles 1 and 2.200
Regarding Z-average and PDI (Fig. 2b), which were measured by the same apparatus but estimated by
different calculation methods, observations were similar. Z-average decreased from 615 nm at cycle 1 to 335
nm at cycle 4. PDI of the nanoemulsions obtained after the first two cycles were slightly above 0.10, for
cycle 1 and 2, 0.10 and 0.13 respectively. For cycle 3 and 4, there were below 0.1: 0.03 and 0.09 respectively.
Cycle 1 and 2 produceed quite monodispersed nanoemulsions and cycle 3 and 4 very monodispersed ones.205
Standard deviations for the different tests and measurements were low from 4 nm and 0.02 for the last two
cycles; to 18 nm and 0.06 for the first two cycles for Z-average and PDI, respectively.
3.2.2. Effect of MF parameters on resulting droplet size by DLS
Nanoemulsions were prepared at different pressures; 1000 bars was selected as the optimized one (data
not shown). MF results regarding the influence of cycle number on particle size distribution, Z-average and210
PDI at a pressure of 1000 bars are presented in Figure 3. Size distributions (Fig. 3a) were significantly
different between cycle 1 and all other cycles from 2 to 5. Indeed, cycle 1 presented a larger distribution and
particles above 1 µm, contrary to all other cycles that showed similar droplet size distributions.
Z-average (Fig. 3b) varied from 162 nm for cycle 1 to 110 nm for cycle 5. Z-average decreased with cycle
number, however the decrease from cycle 1 to cycle 2 was the more significant with a value of 38 nm. From215
8

Figure 2: Effect of cycles number on particle size distribution in intensity a); Z-average and PDI b) by DLS for PME at cycles
1 to 4
cycle 2, Z-average values were quite stable. Moreover, standard deviation was high for cycle 1, S.D. = 40 nm,
and negligible for other cycles. PDI values were stable with cycle number and set between 0.11 and 0.17 for
cycle 4 and 1 respectively, which indicated quite monodipersed emulsion. As seen on Fig 3a, size distribution
was larger for cycle 1.
3.2.3. Effect of US parameters on resulting droplet size by DLS220
Figure 4 presents optimization of droplet sizes of nanoemulsions produced by US. Droplet size distributions
at processing time of 1, 2 and 5 min are shown in Fig.4a and Z-average and PDI for US intensities of 30%
and 60% and processing time of 1, 2 and 5 min in Fig 4b. Regarding droplet size distribution (Fig 4a), 1
min processing time led to polydispersed and bigger droplets, a part of the distribution being above 1 µm
compared to longer processing times. At 2 and 5 min, the distributions were similar and all of the distribution225
was below 1 µm.
In addition, Z-average (Fig 4b), decreased with processing time, from 334 nm to 173 nm at 1 min and 5
min at 30% US intensity and from 195 nm to 173 nm at 1 min and 5 min at 60% US intensity. Also, at 1 and
2 min processing time, nanoemulsions obtained at 60% US intensity were smaller than the ones obtained at
30%. However, at 5 min, nanoemulsions obtained at 30% and 60% US intensities had the same Z-average.230
Finally, PDIs, (Fig 4b) were high at 1 min processing time, 0.26 and 0.61 at 30% US intensity and 60% US
9
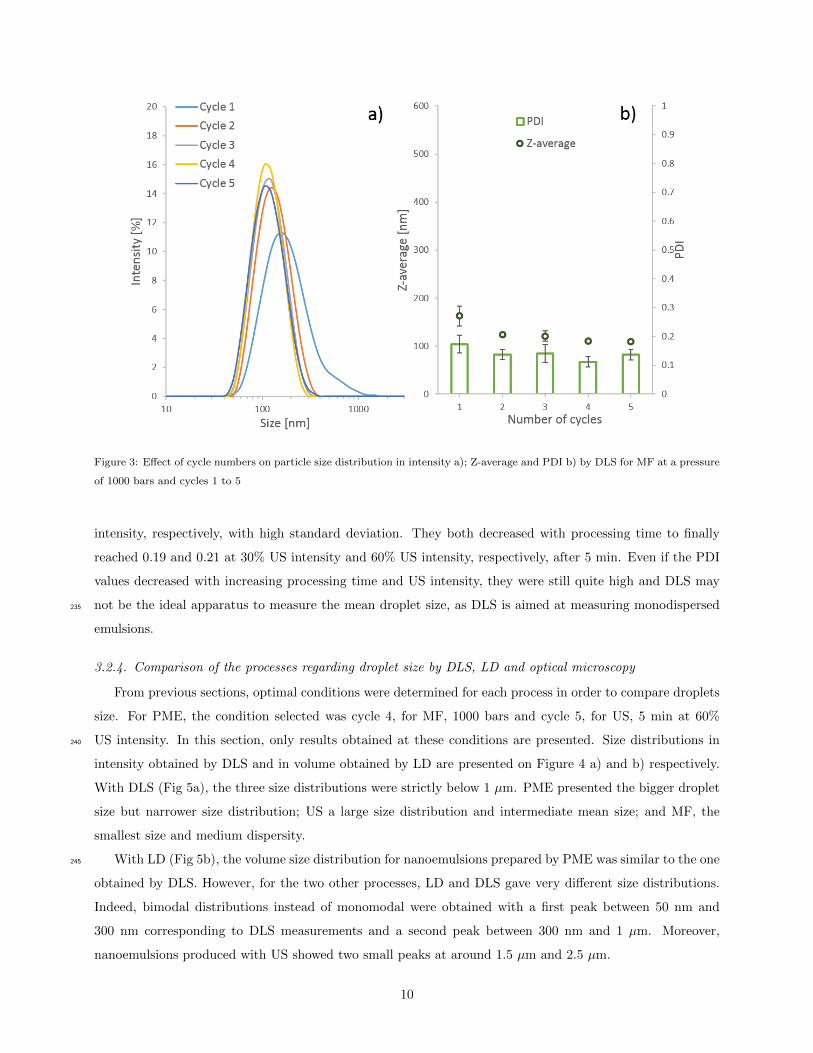
Figure 3: Effect of cycle numbers on particle size distribution in intensity a); Z-average and PDI b) by DLS for MF at a pressure
of 1000 bars and cycles 1 to 5
intensity, respectively, with high standard deviation. They both decreased with processing time to finally
reached 0.19 and 0.21 at 30% US intensity and 60% US intensity, respectively, after 5 min. Even if the PDI
values decreased with increasing processing time and US intensity, they were still quite high and DLS may
not be the ideal apparatus to measure the mean droplet size, as DLS is aimed at measuring monodispersed235
emulsions.
3.2.4. Comparison of the processes regarding droplet size by DLS, LD and optical microscopy
From previous sections, optimal conditions were determined for each process in order to compare droplets
size. For PME, the condition selected was cycle 4, for MF, 1000 bars and cycle 5, for US, 5 min at 60%
US intensity. In this section, only results obtained at these conditions are presented. Size distributions in240
intensity obtained by DLS and in volume obtained by LD are presented on Figure 4 a) and b) respectively.
With DLS (Fig 5a), the three size distributions were strictly below 1 µm. PME presented the bigger droplet
size but narrower size distribution; US a large size distribution and intermediate mean size; and MF, the
smallest size and medium dispersity.
With LD (Fig 5b), the volume size distribution for nanoemulsions prepared by PME was similar to the one245
obtained by DLS. However, for the two other processes, LD and DLS gave very different size distributions.
Indeed, bimodal distributions instead of monomodal were obtained with a first peak between 50 nm and
300 nm corresponding to DLS measurements and a second peak between 300 nm and 1 µm. Moreover,
nanoemulsions produced with US showed two small peaks at around 1.5 µm and 2.5 µm.
10

Figure 4: Effect of US duration from 1 min to 5 min on particle size distribution in intensity by DLS a) and effect of US duration
and intensity on Z-average and PDI b)
These observations are confirmed by the mean size and dispersity by DLS and LD presented on Table250
2. The nanoemulsions obtained by PME presented a mean droplet size value of 335 nm and 333 nm by
DLS and LD respectively, a PDI of 0.09 and Span of 0.56. This corroborates the results shown on Figure
5, both analytic methods confirmed a monodispersed nanoemulsion with a mean size value of around 330
nm. On the contrary, nanoemulsions obtained by MF presented different mean size and dispersity by DLS
and LD. The mean droplet size was 40 nm bigger with LD than with DLS. But more importantly LD and255
DLS gave different dispersities. Indeed, nanoemulsion produced by MF presented a Span of 2.75 and could
be considered as polydispersed whereas a PDI of 0.14 by DLS indicated a monodispersed sample. Same
observation can be made for the nanoemulsions obtained by US, the difference in mean size obtained by DLS
and LD was small, 14 nm smaller by LD, but the dispersities were much different. PDI was measured at
0.19 with DLS, which was considered as quite monodispersed and Span at 2.04 indicating a polydispersed260
distribution.
A third observation method, optical microscopy, was used to confirm the presence of microscopic droplets
(> 1 µm). On Figure 6, four photographies are presented, two of nanoemulsions obtained with MF at 1000
bars, at cycle 1: Figure 6a) and at cycle 5: Figure 6b). Figure 6c) shows an emulsion produced with US at
60% intensity during 5 min and finally Figure 6d) an emulsion produced by PME at cycle 4. On Figure 6a),265
11

Figure 5: Comparison of size distribution in intensity by DLS a) and in volume by LD b) for the three different processes PME,
MF and US for selected conditions
Table 2: Summary of size results for the three different processes PME, MF and US for selected conditions
we observe several droplets bigger than 1 µm and droplets up to 5.6 µm were measured. Figure 6b) shows
that most micron size droplets disappeared after 5 cycles but some were still present with size between 1 and
3 µm, in agreement with what was observed on Figure 5 by LD. Figure 6c) shows the nanoemulsion produced
by US, with also micron size droplets. Droplets between 1 and 5 µm were observed which is in agreement
with the size distribution by LD presented on Figure 5. On the contrary, for nanoemulsions prepared by270
12

PME (Figure 6d), no droplets can be seen even if the magnificence factor was 100 instead of 40 for the other
photographies. This is also in agreement with the droplet size distribution obtained with LD.
Figure 6: Optical microscopy photographs at x40 of three emulsions a) first cycle of MF at 1000 bars; b) fifth cycle of MF at
1000 bars; c) 5 min at 60% intensity US; and one at x 100, d) fourth cycle of PME
Stability assessment was made by DLS and presented on Figure 7. Droplet size distributions at each
selected condition for each process are presented at t=0, just after production, at t+2 weeks and at t+3
months measured 15 days and 3 months after preparation, respectively, for samples kept at 40oC. Regarding275
nanoemulsion produced by PME, a very small difference in droplet size distribution was observed between
post production and t+3 months; Z-average values were 335 nm and 350 nm, respectively. For US, the size
distribution changed slightly but not significantly (173 nm at t=0 and 170 nm at t+3 months). Then for
MF, the distribution became larger with Z-average value increased from 110 to 150 nm at 2 weeks and to
607 nm at 3 months. For US, the size distribution changed slightly but not significantly. Then for MF, the280
distribution became larger and mean droplet size increased from 110 to 150 nm at 2 weeks and to 607 nm at
3 months. These results were confirmed by LD and optical microscopy (data not shown).
13

Figure 7: Comparison of size distributions in intensity (DLS) at t=0, t+2 weeks and t+3months under accelerated stability at
(40oC) for nanoemulsions prepared by PME, MF and US with selected conditions
3.3. Effect of the process on API degradation
Results presented in this section were obtained at the optimal conditions determined previously for each
process. AtRA degradation was negligible for each process and approximately 100% of atRA was recovered at285
the end of the production (data not shown). AtRA stability was investigated under accelerated and normal
stability conditions including light and temperature over 2 weeks (Figure 8).
The stability conditions investigated were ambient temperature in day light and protected from day light,
at 4oC protected from day light and at 40oC protected from day light. At 4oC, no degradation of atRA
occurred regardless of the process used, the lowest percentage being 97% after 2 weeks for PME and MF.290
At ambient temperature, in dark conditions, degradation started slowly with the lowest percentage of 84%
obtained for MF. No real difference was seen between the different processes. To evaluate the process impact
on atRA degradation and predict long term stability, stressed stability at 40oC was done over 2 weeks. After
1 week, MF showed the lowest percentage at 18% followed by PME at 67% and finally US seemed to present
no degradation but a very high standard deviation compared to the other processes. At 2 weeks, atRA295
completely disappeared for MF whereas for PME and US it was still present at 35% and 54%, respectively.
The chromatography analysis showed a decrease of atRA within the nanoemulsion without any isomeration
as the principal isomers (13 cis, 9 cis and 11 cis) were not detected (Figure 9). In order to study the process
impact on atRA isomeration, stability under day light exposure was also performed over 2 weeks. After one
week, like with other conditions, MF was the most degraded down to 21%, followed by PME, 35% and finally300
US with 41%. After two weeks the percentages became very low: 17% for MF, 22% for PME and 25% for
US. This reduced atRA quantity under light was mainly due to isomeration as the three isomers can be seen,
peaks at 15.5 min for 9-cis-atRA, at 14 min for 13-cis-atRA and at 12.5 for 11-cis-atRA by chromatography
analysis (Figure 9) and no difference was observed between the three processes.
These data were completed by long term stability measurements at 3 months at 4oC and percentage were305
14

found to be 77%, 76% and 63% for nanoemulsions produced by US, PME and MF respectively (data not
shown), which is in accordance with accelerated stability.
Overall, the process which seems to degrade less atRA was US, followed closely by PME but nanoemulsions
produced by MF were significantly more degraded at the more extreme conditions regarding temperature
and light exposure.310
Figure 8: Stability of atRA nanoemulsions during 2 weeks: remained atRA was determined and expressed as percentage of
post-production content
4. Discussion
Emulsions produced by US and MF at optimal conditions presented similar characteristics, with very fine
droplets below 200 nm but large size distribution. This large size distribution was not seen by DLS which
is not adapted to polydispersed samples. However, it was observed by two other techniques, LD and optical
microscopy. US is known to produce polydispersed samples as only the suspension near the sonifier probe is315
affected by ultrasonic waves [38]. In MF, all droplets need to experience the peak shear rate generated by
a flow-producing device otherwise the resulting emulsions are polydispersed [39]. This explains why several
cycles are needed, and this study shows that even after 5 cycles, micron size droplets were present in the
sample. PME presented a different droplet size distribution profile, the optimized sample had a mean value
of 335 nm and a good monodispersity confirmed by DLS, LD and optical microscopy showing no micron sized320
15

Figure 9: Peak areas at different retention times after 2 weeks in stability at day light exposure and 40oC
droplets. These results were similar to the ones obtained previously with this set-up and the same surfactant
system [22].
In terms of stability, nanoemulsions produced by PME and US did not present any destabilization over 3
months under stressed stability at 40oC. On the contrary, MF showed emulsion droplets 36% bigger after 2
weeks and 452% after 3 months. These nanoemulsions can be considered unstable.325
The three processes produced nanoemulsions that can be used in intravenous applications. However, MF
and US will loose expensive active ingredients during the filtration/sterilization step where micron droplets
will be removed. On the contrary, a sterile nanoemulsion can be obtained by PME, if the membrane is
sterilized as the final pore size used is 0.2 µm [21]. Thus PME could be a one step process of emulsifica-
16

tion/sterilization with no active ingredient loss and presenting advantages regarding economical aspects.330
The three processes had a small impact on at-RA degradation during emulsification and no difference
was observed. For this reason and considering the difference of energy input between the three processes, the
impact of emulsification on atRA was evaluated in stability study. After 2 weeks, no significant degradation
was seen at 4oC and at ambient temperature protected from light. However, at 40oC and day light conditions,
nanoemulsions produced by MF were more degradated than the ones obtained by the two other processes.335
US and PME showed similar behavior but US produced nanoemulsions even less sensitive to degradation.
Similar degradation profile was previously observed on other colloidal formulation of atRA. For solid lipid
nanoparticles of atRA, prepared also for parenteral administration, rapid degradation was observed by light
(in 10 h) and also by the storage at 4oC (about of 50% after 1 month) [40]. This degradation could be due
to the use of high-pressure homogenizer during SLN preparation and the authors proposed lyophilization or340
adding anti-oxidant agent to enhance the storage. In our study, storage at 4oC will be recommended as the
nanoemulsions prepared by US and PME showed slow degradation over 3 months. In a final formulation
for a parenteral application, an antioxidant can be added to improve atRA stability. However, accelerated
stability (40oC) indicated rapid degradation for nanoemulsion prepared by MF together with greater long
term instability at 4oC than the other processes.345
This difference in degradation rate might be explained by the shear rate applied to droplets that was
much higher with MF than PME creating droplet friction and other physical stresses. Also, the energy input
was much higher in MF, that results in a temperature increase up to 73oC at 2000 bars and fifth pass.
Indeed, MF requires a high energy input per unit volume (E/V), E/V = 108 J.m−3 with a lot of heat loss
by viscous dissipation. US requires nearly the same E/V as MF [41], however in our study, an ice bath was350
used preventing a high temperature increase. This can explain why the lowest degradation was seen with
this process. PME, working at around 50 bars, requires nearly 2 orders of magnitude lower energy E/V=5 x
106 J.m−3 compared to US or MF, which can explain the lower degradation observed.
5. Conclusion
In this study, O/W nanoemulsions for parenteral administration of at-RA were prepared successfully by355
MF, US and PME. First, the composition parameters were investigated in order to fulfill the requirement of
a parenteral nanoemulsion.
Three processes were studied regarding the influence of the production parameters on droplet size by DLS,
LD and optical microscopy. It was found that for PME, droplet size distributions were all monodispersed and
except for cycle 1, all below 500 nm, reaching 335 nm at cycle 4. DLS and LD measurements were similar and360
no micron size droplet was seen by optical microscopy. For MF, after cycle 1, the nanoemulsions presented
all low PDI and a mean droplet size below 200 nm by DLS. However, by LD and optical microscopy, bigger
droplets above 500 nm and a very large dispersity were measured. By US, after 5 min, all nanoemulsions were
below 200 nm but with quite high PDI. By LD and optical microscopy, some bigger droplets were seen above
17

1µm. Moreover, nanoemulsions produced by US appeared to be more polydispersed. In stressed stability,365
nanoemulsions produced by US and PME did not change over 3 months. Those produced by MF, on the
contrary showed a drastic increase in droplet size of 426% after 3 months. Nanoemulsions produced by MF
were found unstable under stress conditions.
Also, the three processes were evaluated for their impact on drug degradation and no difference was seen.
In stability, no significant difference was observed of atRA degradation at t=0 and after 2 weeks of storage370
at 4oC and dark ambient temperature. However, atRA nanoemulsion exposed to 40oC or day light showed
rapid atRA degradation with significant differences between the three processes. Nanoemulsions prepared
by US showed the best overall resistance to degradation, followed by the one produced by PME and finally
by MF which was totally degradated after 2 weeks at 40oC and showed the higher degradation under light
exposure.375
In conclusion, all processes are suitable to produce injectable nanoemulsions but only PME was adapted to
thermosensitive actives with the potential of large scale production. Moreover, in terms of droplet size, PME
produced monodispersed droplets of 330 nm compared to the other processes which produced nanoemulsions
of around 150 nm but with the presence of micron size droplets combined with droplet instability over 3
months for MF. Therefore, PME could be an alternative industrial process for parenteral emulsions manu-380
facturing with no additional sterilization step and a lower energy requirement. Nanoemulsions were found
unstable under stress conditions; that can be explained by more severe processing conditions that create
droplets friction and other physical stresses and thus less stable emulsions.
Acknowledgment
This work was supported by PeptiCaps project. This project has received funding from the European385
Union’s Horizon 2020 Research and Innovation program under Grant Agreement no686141.
References
[1] C. Lovelyn, A. A. Attama, Current State of Nanoemulsions in Drug Delivery, Journal of Biomaterials
and Nanobiotechnology 02 (05) (2011) 626–639. doi:10.4236/jbnb.2011.225075.
URL http://www.scirp.org/journal/doi.aspx?DOI=10.4236/jbnb.2011.225075390
[2] D. Mou, H. Chen, D. Du, C. Mao, J. Wan, H. Xu, X. Yang, Hydrogel-thickened nanoemulsion system
for topical delivery of lipophilic drugs, International Journal of Pharmaceutics 353 (1-2) (2008) 270–276.
[3] S. Setya, S. Talegaonkar, B. K. Razdan, Nanoemulsions: formulation methods and stability aspects,
World Journal of Pharmaceutical Sciences 3 (2) (2014) 2214–2228.
[4] A. G. Floyd, Top ten considerations in the development of parenteral emulsions, Pharmaceutical Science395
& Technology Today 2 (4) (1999) 134–143.
18

[5] X. Yang, D. Wang, Y. Ma, Q. Zhao, J. K. Fallon, D. Liu, X. E. Xu, Y. Wang, Z. He, F. Liu, Theranostic
nanoemulsions: codelivery of hydrophobic drug and hydrophilic imaging probe for cancer therapy and
imaging, Nanomedicine 9 (18) (2014) 2773–2785, pMID: 25000945. arXiv:https://doi.org/10.2217/
nnm.14.50, doi:10.2217/nnm.14.50.400
URL https://doi.org/10.2217/nnm.14.50
[6] A. Desai, T. Vyas, M. Amiji, Cytotoxicity and apoptosis enhancement in brain tumor cells upon coadmin-
istration of paclitaxel and ceramide in nanoemulsion formulations, Journal of Pharmaceutical Sciences
97 (7) (2008) 2745 – 2756. doi:https://doi.org/10.1002/jps.21182.
URL http://www.sciencedirect.com/science/article/pii/S0022354916326284405
[7] I. Venkateshwarlu, K. Prabhakar, M. Ali, V. Kishan, Development and in vitro cytotoxic evaluation of
parenteral docetaxel lipid nanoemulsions for application in cancer treatment, PDA Journal of Pharma-
ceutical Science and Technology 64 (3) (2010) 233–241, cited By 8.
URL https://www.scopus.com/inward/record.uri?eid=2-s2.0-78149352110&partnerID=40&md5=
7d51fef7a38566d82248c4ab44bbc281410
[8] K. K. Singh, S. K. Vingkar, Formulation, antimalarial activity and biodistribution of oral lipid na-
noemulsion of primaquine, International Journal of Pharmaceutics 347 (1) (2008) 136 – 143. doi:
https://doi.org/10.1016/j.ijpharm.2007.06.035.
URL http://www.sciencedirect.com/science/article/pii/S0378517307005522
[9] ClinicalTrials.gov Bethesda (md): National Library of Medicine (US). February 29, 2000 . Identifier415
NCT01326078. Use of Lipid Emulsion or Nanoemulsion of Propofol on Children Undergoing Ambulatory
Invasive Procedures, March 30, 2011; Available at: https://clinicaltrials.gov/ct2/show/nct01326078.
Accessed September 26, 2018.
[10] ClinicalTrials.gov Bethesda (md): National Library of Medicine (US). February 29, 2000 . Identifier
NCT01010035. Cholesterol Metabolism and Lipid Transfer in Diabetes; Nov 9, 2009 Available at:420
https://clinicaltrials.gov/ct2/show/nct01010035. Accessed September 26, 2018.
[11] C. Solans, I. Sole, Nano-emulsions: Formation by low-energy methods, Current Opinion in Colloid &
Interface Science 17 (5) (2012) 246–254. doi:10.1016/j.cocis.2012.07.003.
URL http://linkinghub.elsevier.com/retrieve/pii/S1359029412000787
[12] M. N. Yukuyama, D. D. M. Ghisleni, T. J. A. Pinto, N. A. Bou-Chacra, Nanoemulsion: process selection425
and application in cosmetics - a review, International Journal of Cosmetic Science (2015) n/a–n/adoi:
10.1111/ics.12260.
URL http://doi.wiley.com/10.1111/ics.12260
19

[13] S. Schultz, G. Wagner, K. Urban, J. Ulrich, High-pressure homogenization as a process for emulsion
formation, Chemical Engineering & Technology 27 (4) (2004) 361–368. doi:10.1002/ceat.200406111.430
URL http://doi.wiley.com/10.1002/ceat.200406111
[14] T. Tadros, P. Izquierdo, J. Esquena, C. Solans, Formation and stability of nano-emulsions, Advances in
Colloid and Interface Science 108-109 (2004) 303–318. doi:10.1016/j.cis.2003.10.023.
URL http://linkinghub.elsevier.com/retrieve/pii/S000186860300157X
[15] Y. Singh, J. G. Meher, K. Raval, F. A. Khan, M. Chaurasia, N. K. Jain, M. K. Chourasia, Nanoemulsion:435
Concepts, development and applications in drug delivery, Journal of Controlled Release 252 (2017) 28–
49. doi:10.1016/j.jconrel.2017.03.008.
URL https://linkinghub.elsevier.com/retrieve/pii/S0168365917301128
[16] A. Nazir, K. Schroen, R. Boom, Premix emulsification: A review, Journal of Membrane Science 362 (1-2)
(2010) 1–11. doi:10.1016/j.memsci.2010.06.044.440
URL http://linkinghub.elsevier.com/retrieve/pii/S0376738810005119
[17] G. Vladisavljevic, M. Shimizu, T. Nakashima, Preparation of monodisperse multiple emulsions at high
production rates by multi-stage premix membrane emulsification, Journal of Membrane Science 244 (1-2)
(2004) 97–106. doi:10.1016/j.memsci.2004.07.008.
URL http://linkinghub.elsevier.com/retrieve/pii/S0376738804005058445
[18] S. Gehrmann, H. Bunjes, Instrumented small scale extruder to investigate the influence of process
parameters during premix membrane emulsification, Chemical Engineering Journal 284 (2016) 716–723.
doi:10.1016/j.cej.2015.09.022.
URL http://linkinghub.elsevier.com/retrieve/pii/S1385894715012796
[19] S. Joseph, H. Bunjes, Evaluation of Shirasu Porous Glass (SPG) membrane emulsification for the prepa-450
ration of colloidal lipid drug carrier dispersions, European Journal of Pharmaceutics and Biopharma-
ceutics 87 (1) (2014) 178–186. doi:10.1016/j.ejpb.2013.11.010.
URL http://linkinghub.elsevier.com/retrieve/pii/S0939641113003822
[20] S. Gehrmann, H. Bunjes, Preparation of lipid nanoemulsions by premix membrane emulsification with
disposable materials, International Journal of Pharmaceutics 511 (2) (2016) 741–744. doi:10.1016/j.455
ijpharm.2016.07.067.
URL http://linkinghub.elsevier.com/retrieve/pii/S0378517316307177
[21] S. Joseph, H. Bunjes, Preparation of nanoemulsions and solid lipid nanoparticles by premix membrane
emulsification, Journal of Pharmaceutical Sciences 101 (7) (2012) 2479–2489. doi:10.1002/jps.23163.
URL http://doi.wiley.com/10.1002/jps.23163460
20
[22] O. Alliod, J.-P. Valour, S. Urbaniak, H. Fessi, D. Dupin, C. Charcosset, Preparation of oil-in-water na-
noemulsions at large-scale using premix membrane emulsification and Shirasu Porous Glass (SPG) mem-
branes, Colloids and Surfaces A: Physicochemical and Engineering Aspectsdoi:10.1016/j.colsurfa.
2018.04.045.
URL http://linkinghub.elsevier.com/retrieve/pii/S0927775718303212465
[23] G. T. Vladisavljevic, U. Lambrich, M. Nakajima, H. Schubert, Production of O/W emulsions using SPG
membranes, ceramic α-aluminium oxide membranes, microfluidizer and a silicon microchannel platea
comparative study, Colloids and Surfaces A: Physicochemical and Engineering Aspects 232 (2-3) (2004)
199–207. doi:10.1016/j.colsurfa.2003.10.026.
URL http://linkinghub.elsevier.com/retrieve/pii/S0927775703006137470
[24] S. Mahdi Jafari, Y. He, B. Bhandari, Nano-Emulsion Production by Sonication and Microfluidiza-
tion - A Comparison, International Journal of Food Properties 9 (3) (2006) 475–485. doi:10.1080/
10942910600596464.
URL http://www.tandfonline.com/doi/abs/10.1080/10942910600596464
[25] S. Y. Tang, P. Shridharan, M. Sivakumar, Impact of process parameters in the generation of novel475
aspirin nanoemulsions comparative studies between ultrasound cavitation and microfluidizer, Ultrasonics
Sonochemistry 20 (1) (2013) 485 – 497. doi:https://doi.org/10.1016/j.ultsonch.2012.04.005.
URL http://www.sciencedirect.com/science/article/pii/S1350417712000806
[26] E. Trapasso, D. Cosco, C. Celia, M. Fresta, D. Paolino, Retinoids: new use by innovative drug-delivery
systems, Expert Opinion on Drug Delivery 6 (5) (2009) 465–483. doi:10.1517/17425240902832827.480
URL http://www.tandfonline.com/doi/full/10.1517/17425240902832827
[27] M. Huang, Y.-C. Ye, S. Chen, J.-R. Chai, J.-X. Lu, L. Zhoa, L. Gu, Z.-Y. Wang, Use of all-trans retinoic
acid in the treatment of acute promyelocytic leukemia, Blood 72 (2) (1988) 567–572.
[28] S. Castaigne, C. Chomienne, M. T. Daniel, P. Ballerini, R. Berger, P. Fenaux, L. Degos, All-trans retinoic
acid as a differentiation therapy for acute promyelocytic leukemia. I. Clinical results, Blood 76 (9) (1990)485
1704–1709.
[29] D. K. Singh, S. M. Lippman, Cancer Chemoprevention-Part 1: Retinoids and Carotenoids and Other
Classic Antioxidants, Physicians Practice 12 (1998) 1643–1658.
[30] M. Bryan, E. D. Pulte, K. C. Toomey, L. Pliner, A. C. Pavlick, T. Saunders, R. Wieder, A pilot phase II
trial of all-trans retinoic acid (Vesanoid) and paclitaxel (Taxol) in patients with recurrent or metastatic490
breast cancer, Investigational New Drugs 29 (6) (2011) 1482–1487. doi:10.1007/s10637-010-9478-3.
URL http://link.springer.com/10.1007/s10637-010-9478-3
21

[31] L. Coelho, I. Almeida, J. Sousa Lobo, J. Sousa e Silva, Photostabilization strategies of photosensitive
drugs, International Journal of Pharmaceutics 541 (1-2) (2018) 19–25. doi:10.1016/j.ijpharm.2018.
02.012.495
URL https://linkinghub.elsevier.com/retrieve/pii/S0378517318300930
[32] B. Ozpolat, G. Lopez-Berestein, P. Adamson, C. J. Fu, A. H. Williams, Pharmacokinetics of in-
travenously administered liposomal all-trans-retinoic acid (ATRA) and orally administered ATRA in
healthy volunteers, Journal of Pharmacy and Pharmaceutical Sciences 6 (2) (2003) 292–301.
[33] A. Ourique, S. Azoubel, C. Ferreira, C. Silva, M. Marchiori, A. Pohlmann, S. S. Guterres, R. Beck,500
Lipid-core nanocapsules as a nanomedicine for parenteral administration of tretinoin: development and
in vitro antitumor activity on human myeloid leukaemia cells, Journal of Biomedical Nanotechnology
6 (3) (2010) 214–223.
[34] A. Chinsriwongkul, P. Chareanputtakhun, T. Ngawhirunpat, T. Rojanarata, W. Sila-on, U. Ruktanon-
chai, P. Opanasopit, Nanostructured Lipid Carriers (NLC) for Parenteral Delivery of an Anticancer505
Drug, AAPS PharmSciTech 13 (1) (2012) 150–158. doi:10.1208/s12249-011-9733-8.
URL http://www.springerlink.com/index/10.1208/s12249-011-9733-8
[35] E. Schultze, J. Buss, K. Coradini, K. R. Begnini, S. S. Guterres, T. Collares, R. C. R. Beck, A. R.
Pohlmann, F. K. Seixas, Tretinoin-loaded lipid-core nanocapsules overcome the triple-negative breast
cancer cell resistance to tretinoin and show synergistic effect on cytotoxicity induced by doxorubicin and510
5-fluororacil, Biomedicine & Pharmacotherapy 96 (2017) 404–409. doi:10.1016/j.biopha.2017.10.
020.
URL https://linkinghub.elsevier.com/retrieve/pii/S0753332217330925
[36] S. H. Silalahi, T. Leiknes, Cleaning strategies in ceramic microfiltration membranes fouled by oil and
particulate matter in produced water, Desalination 236 (1-3) (2009) 160–169. doi:10.1016/j.desal.515
2007.10.063.
URL http://linkinghub.elsevier.com/retrieve/pii/S0011916408006395
[37] E. Almouazen, S. Bourgeois, A. Boussad, P. Valot, C. Malleval, H. Fessi, S. Nataf, S. Brianon, Devel-
opment of a nanoparticle-based system for the delivery of retinoic acid into macrophages, International
Journal of Pharmaceutics 430 (1) (2012) 207 – 215. doi:https://doi.org/10.1016/j.ijpharm.2012.520
03.025.
URL http://www.sciencedirect.com/science/article/pii/S0378517312002669
[38] N. Anton, J.-P. Benoit, P. Saulnier, Design and production of nanoparticles formulated from nano-
emulsion templates-a review, Journal of Controlled Release 128 (3) (2008) 185 – 199. doi:https:
//doi.org/10.1016/j.jconrel.2008.02.007.525
URL http://www.sciencedirect.com/science/article/pii/S0168365908001016
22

[39] M. M. Fryd, T. G. Mason, Advanced nanoemulsions, Annual Review of Physical Chemistry 63 (1) (2012)
493–518, pMID: 22475339. arXiv:https://doi.org/10.1146/annurev-physchem-032210-103436,
doi:10.1146/annurev-physchem-032210-103436.
URL https://doi.org/10.1146/annurev-physchem-032210-103436530
[40] S.-J. Lim, M.-K. Lee, C.-K. Kim, Altered chemical and biological activities of all-trans retinoic acid
incorporated in solid lipid nanoparticle powders, Journal of Controlled Release 100 (1) (2004) 53 – 61.
doi:https://doi.org/10.1016/j.jconrel.2004.07.032.
URL http://www.sciencedirect.com/science/article/pii/S0168365904003773
[41] W. Li, T. S. H. Leong, M. Ashokkumar, G. J. O. Martin, A study of the effectiveness and energy535
efficiency of ultrasonic emulsification, Physical Chemistry Chemical Physics 20 (1) (2018) 86–96. doi:
10.1039/C7CP07133G.
URL http://xlink.rsc.org/?DOI=C7CP07133G
23