comparison of the structure and composition of
TRANSCRIPT
Comparison of the Structure and Composition of Bacterioplankton
Communities in the Ballast Water of Commercial Ships and the Duluth-Superior Harbor
A THESIS SUBMITTED TO THE FACULTY OF THE GRADUATE SCHOOL OF
UNIVERSITY OF MINNESOTA BY
Jacqueline B. Welch
IN PARTIAL FULFILLMENT OF THE REQUIREMENTS FOR THE DEGREE OF MASTER OF SCIENCE
Adviser: Randall E. Hicks
August 2012

© Copyright Jacqueline Beebe Welch 2012
i
ACKNOWLEDGEMENTS
I first would like to express my sincere appreciation for the guidance and support
of my advisor, Randy Hicks. His dedication and commitment to the success of his
students is unwavering. I would also like to thank my other committee members,
Stephanie Guildford and Clay Carter for their insights and suggestions.
The success of this study depended on a number of people willing to contribute
their time and expertise. I would like to thank Randolph G. Beebe of Wolfshead
Research Logistics for his assistance in water sampling and data collection in the field.
Brian Newman performed nutrient analyses and Brittany Kruger and Meg Macdonald
assisted in DOC evaluation and SUVA calculations. I am indebted to John Thomas of
the Minnesota Pollution Control Agency (MPCA) for his assistance in obtaining ballast
water samples. Tim Tuominen of the Western Lakes Superior Sanitary District
(WLSSD) provided treated wastewater effluent samples. I would also like to thank
Valerie Brady and Jennifer Olker for instruction in ordination analysis using PC-ORD,
John Pastor for discussion on diversity, and Elizabeth Minor for discussion on DOC
concentrations and SUVA values.
I’ve always been impressed with Randy’s ability to consistently find exceptional
people to work in his Microbial Ecology Lab. Dennis Hansen, Jason Kish, Jon Bostrom,
and Ryan Oster were working in the Lab when I started graduate school in 2008. They
created a collaborative and fun atmosphere making my transition back to academia seem
(almost) easy. I am especially grateful to Jon and Ryan for their support and friendship
throughout this ‘journey.’ Juana Muñoz Ucrós, Xiaowei “Wendy” Zhao, Caitlin Sloan,
and Dr. Andrew “Drew” Reed have continued the tradition of making the Hicks lab a
great place to work. I thank Drew for his assistance and guidance with the phylogenetic
analyses in this study and Juana and Wendy for their help with all those mini plasmid
preps.
I am grateful to the Water Resources Science program at the University of
Minnesota Twin Cities for support through a travel award fellowship (2011) and a block
grant for research (2012). I would also like to thank the Department of Biology at the
ii
University of Minnesota Duluth for seven semesters of graduate teaching assistantship
funding. A number of Biology faculty members provided insightful guidance and
encouragement during my teaching appointments including Lyle Shannon, Paul Bates,
and Tim Craig. I especially thank John Dahl, a truly gifted professor whose enthusiasm
for teaching is infectious. A special thank you to Biology Department staff especially
Nick Lamon and Doreen Wallace.
Most of all, I thank my family and friends for their unwavering support. My four
sons have been patient with their incredibly distracted mom and my husband has put in a
lot of unpaid overtime without complaint. I’m incredibly grateful to my dear friend,
Grace Glick.
This research was primarily supported by a grant to Randall E. Hicks from the
Great Lakes Protection Fund (Project 841) through a subcontract (040294UMD) from the
Northeast-Midwest Institute, Washington, DC. I received additional support from a grant
to R. Hicks from the National Science Foundation (EF-0914450).

iii
DEDICATION
This thesis is dedicated to my mother, Lorraine M. Beebe, and to the memory of my father, Emmett R. Beebe.
iv
ABSTRACT
Ship ballast water is a potential vector for the introduction and spread of aquatic
nonindigenous species (NIS). Although most studies focus on invasive plants and
animals, there is an increased interest in the potential for invasive microbes. The Duluth-
Superior Harbor (DSH), located in a freshwater estuary at the confluence of Lake
Superior and the St. Louis River, receives more ballast water discharge than any other
Great Lakes port yet little is known about the bacterioplankton communities in the harbor
or the ballast water released into the harbor. The two most important factors affecting the
successful establishment of an aquatic NIS through ballast water discharge are propagule
pressure, and the abiotic and biotic characteristics of the new environment. Water was
collected at six sites in Lake Superior, the Duluth-Superior Harbor, and the lower St.
Louis River to characterize bacterioplankton communities. Other water samples were
collected from the ballast tanks of ten commercial ships visiting the Duluth-Superior
Harbor and the Western Lake Superior Sanitary District (WLSSD) because these sources
may influence the genetic structure and composition of natural bacterioplankton
communities in the harbor. Three distinct bacterioplankton communities representative
of Lake Superior, the Duluth-Superior Harbor, and the St. Louis River habitats were
detected in water samples collected on one day in early September 2009 (ANOSIM, p <
0.05) using a DNA fingerprint analysis (T-RFLP). These results were consistent with
findings of other investigations that found distinct bacterioplankton communities in
estuarine mixing zones. Water temperature, dissolved organic carbon (DOC),
ammonium (NH4+), and nitrate (NO3
−) were more highly correlated with differences in
the genetic structure of bacterioplankton communities along a transect from the river
through the harbor than other environmental variables.
DNA fingerprint analyses also indicated that bacterioplankton communities
discharged into the DSH with ballast water and treated wastewater effluent were different
from bacterioplankton communities found within the harbor. The most common bacterial
phyla found in freshwater habitats (i.e., Alphaproteobacteria, Betaproteobacteria,
Actinobacteria, Bacteroidetes) were also seen in 16S rRNA gene clone libraries of

v
freshwater ballast and the Duluth-Superior Harbor. The genetic structure and species
composition of the seawater ballast bacterioplankton community from an ocean-going
ship was fundamentally different than the bacterioplankton communities in freshwater
ballast, and was uncharacteristically dominated by bacteria from the
Epsilonproteobacteria. Interestingly, three environmental DNA sequences from the
seawater ballast of this ship were similar to Tennacibaculum soleae, a marine fish
pathogen (phylum Bacteroidetes, Class Flavobacteria). DNA from this pathogenic
marine bacterium, if not its intake cells, survived in the ballast tank of a transoceanic ship
for at least two weeks before the ballast water arrived at the Duluth-Superior Harbor.
This example illustrates the potential for transporting potentially harmful bacteria over
long distances in the ballast water of commercial ships to harbors in the Laurentian Great
Lakes.
vi
TABLE OF CONTENTS
ACKNOWLEDGMENTS...………………………………………………………….... i
DEDICATION…………………………………………………………………….…… iii
ABSTRACT……………………………………………………………………………. iv
LIST OF TABLES………………………………………………………………….......viii
LIST OF FIGURES……………………………………………………………………. x
CHAPTER I Introduction and Overview...……………………………….…... 1
CHAPTER II Changes in the Genetic Structure of Bacterioplankton Communities along a transect through the Duluth-Superior Harbor………………………………………. 8
INTRODUCTION……………………………………….……. 8
METHODS…………………………………………...……….. 14
Study sites and sampling……………………………… 14
Artificial mixtures of Lake Superior and St. Louis River water…………………………………. 15
Physicochemical and biotic analyses…………………. 15
Prokaryotic cell abundance…………………………… 17
Bacterioplankton community analyses…………..…… 17
Statistical Analyses………………………………...…. 20
RESULTS……………………………………………...……... 24
Physicochemical and biotic characteristics………….... 24
Analyses of the genetic structure of bacterioplankton communities…………………………………………... 28
Relationships between the genetic structure of bacterioplankton communities and
environmental variables……………………………..... 48
DISCUSSION………………………………………………… 56
CHAPTER III Comparison of Bacterioplankton Communities in the Ballast Water of Commercial Ships, Treated Wastewater Effluent, and the Duluth-Superior Harbor……………………………… 67

vii
INTRODUCTION…………………………………….……… 67
METHODS…………………………………………………… 69
Study location……………………………………….... 69
Water samples for bacterioplankton community analyses………………………………………..……... 70
Prokaryotic cell abundance…………………………... 74
Bacterioplankton community analyses……………..... 74
Statistical analyses of bacterioplankton T-RFLP profiles……………………………………………….. 76
Construction of bacterioplankton 16S rRNA gene clone libraries………………………………………… 77
Analyses of bacterioplankton clone libraries……….... 81
RESULTS…………………………………………………..... 83
Prokaryotic cell abundance…………………………... 83
T-RFLP profiles of bacterioplankton communities….. 83
Bacterioplankton 16S rRNA gene clone libraries…..... 90
DISCUSSION………………………………………………... 105
REFERENCE………………………………………………………………… 115
APPENDIX…………………………………………………………………... 138
viii
LIST OF TABLES
Table II.1. Physicochemical and biotic conditions at sites along a transect from Lake Superior, through the Duluth-Superior Harbor, and into the St. Louis River………………………………………...… 27 Table II.2. One-way analysis of similarities (ANOSIM) for pairwise comparisons of T-RFLP profiles of bacterioplankton community 16S rDNA in Lake Superior, the Duluth-Superior Harbor, and the St. Louis River………………………………….……………. 38 Table II.3. Similarities of percentages (SIMPER) for pairwise comparisons of T-RFLP profiles of bacterioplankton community 16S rDNA in Lake Superior, the Duluth-Superior Harbor, and the St. Louis River ……………………………………………………………………..…. 39 Table II.4. Kendall’s tau rank correlations between physiochemical and biotic parameters and axes 1 and 2 for NMS ordination analyses of bacterioplankton T-RFLP profiles………………………. 55 Table III.1. Transit information and ballast water data from commercial vessels that were sampled in the Duluth-Superior Harbor from July to November 2009…………………………………………. 73 Table III.2. Information about the number of clones sequenced and the diversity of bacterial 16S rRNA gene clone libraries developed for three ballast water samples and the inner harbor site of the Duluth-Superior Harbor (DSH-IN)…………………………………… 93 Table III.3. Environmental habitats of sequences in the BLAST database with the highest BLAST score matching the 16S rRNA gene clones in the libraries developed for three ballast water samples and the inner harbor of the Duluth-Superior Harbor…………………. 97 Table A-1. Pearson correlation coefficients among environmental variables....… 139 Table A-2. Results from the Shapiro-Wilk W test for normality for environmental variables……………………………………………... 140 Table A-3. Data summary and outlier analysis for datasets used in Bray-Curtis ordination analysis of bacterioplankton T-RFLP profiles from all sampling sites………………………………………. 141
ix
Table A-4. Data summary and outlier analysis for datasets used in NMS ordination analysis of bacterioplankton T-RFLP profiles from the lake and river water mixtures and from all sampling sites ……………………………………………………………………….. 142 Table A-5. Data summary and outlier analysis for datasets used in NMS ordination analysis of bacterioplankton T-RFLP profiles from the Duluth-Superior Harbor and the St. Louis River samples ………………………………………………………………………… 143 Table A-6. Summary of the NMS ordination analysis results for final solutions ….…………………………………………………………………….. 144 Table A-7. Correlations between physicochemical parameters and NMS ordination axes 1 and 2…………………….…………………… 145

x
LIST OF FIGURES
Figure II.1. Map of the western end of Lake Superior, the Duluth-Superior Harbor, and the Lower St. Louis River………………………………. 9 Figure II.2. Temperature and specific conductivity profiles of the water column along a transect from Lake Superior, through the Duluth- Superior Harbor, and into the St. Louis River……………………..… 25 Figure II.3. Dendrograms depicting hierarchical cluster analysis of T-RFLP profiles of bacterioplankton community 16S rDNA from Lake Superior, the Duluth-Superior Harbor, and the St. Louis River……… 29 Figure II.4. Bray-Curtis ordinations of T-RFLP profiles of bacterioplankton community 16S rDNA from Lake Superior, the Duluth-Superior Harbor, and the St. Louis River……………………………………… 34 Figure II.5. Venn diagrams describing the number of terminal restriction fragments (TRFs) in T-RFLP profiles of bacterioplankton community 16S rDNA from Lake Superior, the Duluth-Superior Harbor, and the St. Louis River……………………………………… 41 Figure II.6. Linear regression model of DOC concentrations and estimated locations of artificial lake and river water mixtures…………………. 44 Figure II.7. NMS ordinations of T-RFLP profiles of bacterioplankton community 16S rDNA from artificial lake and river water mixtures and samples from Lake Superior, the Duluth-Superior Harbor, and the St. Louis River………………………………...…………….. 46 Figure II.8. NMS ordinations of T-RFLP profiles of HaeIII enzyme digests of bacterioplankton community 16S rDNA from the Duluth-Superior Harbor and the St. Louis River.……………………..……………….. 50 Figure II.9. NMS ordinations of T-RFLP profiles of MspI and RsaI enzyme digests of bacterioplankton community 16S rDNA from the Duluth- Superior Harbor and the St. Louis River ………………………...….. 52 Figure III.1. Map of Duluth-Superior harbor with locations of ballast water and harbor sample sites………………………………………………….. 71 Figure III.2 Volume of ballast water discharged into the Duluth-Superior Harbor by ships arriving from various ports in the Laurentian Great Lakes during the 2009-shipping season………………………. 79
xi
Figure III.3. Dendrograms depicting hierarchical clustering of T-RFLP profiles of bacterioplankton communities in ballast water from commercial ships sampled in the Duluth-Superior Harbor during 2009……….…. 84 Figure III.4. NMS ordinations of T-RFLP profiles of bacterioplankton communities in freshwater ballast water, dockside water samples, and at two Duluth-Superior Harbor sites…………………………….. 88 Figure III.5. Dendrograms depicting hierarchical clustering of T-RFLP profiles of bacterioplankton communities from water in the Duluth-Superior Harbor and treated wastewater effluent from the Western Lake Superior Sanitary District (WLSSD)……………………………….... 91 Figure III.6. Rarefaction curves of OTUs for four 16S rRNA gene clone libraries ………………………………………….…………………………….. 95 Figure III. 7. Percentage of 16S rRNA gene clones assigned to different bacterial phyla and Proteobacteria class levels for each of the clone libraries developed for the inner harbor site and freshwater and seawater ballast……………………………………………….... 99 Figure III.8. Phylogenetic relationship of clones in the four 16S rRNA gene clone libraries constructed for ballast and harbor water and 16S rDNA sequences from bacterial clones from the Alphaproteobacteria bacterial class……………………………….… 101 Figure III.9. Phylogenetic relationship of clones in the four 16S rRNA gene clone libraries constructed for ballast and harbor water and 16S rDNA sequences from bacterial clones from the Actinobacteria bacterial phylum……………………………………………….……. 103 Figure III.10. Phylogenetic relationship of three 16S rRNA gene clones from Ship 9 that were affiliated with the Flavobacteria bacterial genus ………………………………………………………………………… 106 Figure A.1. Histogram showing the volume and source of ballast water (MT) that was discharged into the Duluth-Superior Harbor by commercial ships during the 2009-shipping season………………...... 146 Figure A.2. Identity of the bacterial phylum for the closest matching BLAST library sequences to clones in the four 16S rRNA gene libraries …… 149
1
CHAPTER I
Introduction and Overview
Over 180 nonindigenous species (NIS) have been established in the Great Lakes
basin since 1840 (Ricciardi 2006). Biological invasions can result in dramatic
environmental impacts (Mills et al. 1994, Ricciardi and MacIsaac 2011), substantial
economic costs (Rothlisberger et al. 2012), and affect human health (Ricciardi et al.
2011). Hecky et al. (2004) describes the virtual re-engineering of the nutrient and energy
flow in nearshore zones of Lake Erie by invasive dreissenid mussels (zebra mussel,
Dreissena polymorpha; quagga mussel, Dreissena bugensis) increasing the potential for
eutrophication and algal fouling of area shorelines. Rothlisberger et al. (2012) reports a
conservative estimate of damage costs attributed to ship-borne NIS in the Great Lakes
region of $138 million per year and the potential for annual economic losses exceeding
$800 million for sportfishing alone. Ballast water transport has also been connected with
the spread of paralytic shellfish poisoning (PSP) in humans caused by the ingestion of
shellfish contaminated with toxic dinoflagellates, such as the invasive Gymnodinium
catenatum, that can cause outbreaks leading to fatalities and hospitalizations (McMinn et
al. 1997, Anderson et al. 1989, Rodrigues et al. 2012).
Ballast water discharged from transoceanic commercial ships has been implicated
in the majority of the aquatic NIS introductions in the Great Lakes since the opening of
the St. Lawrence Seaway in 1959 (Mills et al. 1994, Grigorovich et al. 2003, Ricciardi
2006). Ballast water is taken on-board ships for the purpose of stability during a voyage
and is then discharged in port when loading cargo and often en route to reduce a vessel’s
draft in shallow waters (Carlton et al. 1995, Grigorovich et al. 2003).
Most of the studies about ballast water-mediated discharge of aquatic NIS have
been focused on macroorganisms such as the zebra mussel (Dreissena polymorpha;
Hebert et al. 1989), the sea lamprey (Petromyzon marinus; Smith et al. 1980), and the
spiny water flea (Bythotrephes longimanus; Bur et al. 1986). However, only recently
have microorganisms been added to the list of potential aquatic nonindigenous species.

2
In the emerging field of microbial invasion ecology, both pathogenic and non-pathogenic
microbes in aquatic and terrestrial ecosystems are now being studied as potential invasive
microbes (Litchman 2010). Bain et al. (2010) reported on the invasive pathogenic fish
virus, Viral Hemorrhagic Septicemia (VHS), and its widespread distribution throughout
the Great Lakes since it was first detected in 2005. Briand et al. (2004) examined the
physiological characteristics of the toxic algal-bloom forming tropical cyanobacterium,
Cylindrospermopsis raciborskii, to explain its invasive spread at temperate mid-latitudes.
Van der Putten et al. (2007) proposed that pathogenic and symbiotic invasive soil
microbes would have a strong effect on individual plant species, community diversity,
and ecosystem function.
Prokaryotes are ubiquitous, highly abundant, and play a critical role in
biogeochemical cycles in both aquatic and terrestrial ecosystems (Whitman et al. 1998,
Azam and Worden 2004, Furhman et al. 1989, DeLong and Karl 2005, van der Heijden et
al. 2008) yet, historically, there was little concern for the possibility of microbial invasive
species. A long-held view in microbiology was that free-living microorganisms can be
found essentially everywhere and was summed up in the saying, “everything is
everywhere, but the environment selects” (Beijerinck 1913, Bass-Becking 1934). Widely
distributed bacterial groups have been identified at the phylum level (Lemke et al. 2009,
Glöckner et al. 2000) and at the species level (Nold and Zwart 1998, Roberts et al. 1995).
However, some microbial species exhibit distinct geographic patterns (Whitaker et al.
2003, Cho and Tiedje 2000). The restricted range of microorganisms may be the result of
different environmental conditions (Horner-Devine et al., 2003, Crump et al. 2007,
Martiny et al. 2006; Nemergut et al. 2011) and limitations on dispersal (Martiny et al.
2006). For aquatic microorganisms transported in the estimated 3 to 5 billion metric tons
of ballast water transferred globally each year (IMO 2008), some of these limitations to
dispersal have been removed (Ruiz et al. 2000, Drake et al. 2001, Seiden et al. 2010, Sun
et al. 2010).
The concern for ballast water-mediated transport of bacteria and viruses is due to
their high abundance in aquatic habitats, potential toxicity and pathogenicity, dispersal
capabilities due to their small size, and an ability to form resting stages (Ruiz et al. 2000,
3
Drake et al. 2007, Dolan 2005). Asexual reproduction, high growth rates, efficient
resource utilization, and competitive capabilities may also contribute to the potential
success of microbial invasive species (Litchman 2010, Ruiz et al. 2000).
Bacteria can survive in the ballast water of ships in free-living populations
(Joachimsthal et al. 2004) or associated with particles and biota (Ruiz et al. 2000). In
addition, bacteria can be found in residual sediments at the bottom of ballast tanks or in
biofilms on internal surfaces (Drake et al. 2005, Drake et al. 2007). Bacterial abundance
in ballast water can range from 107 cells to as much as 1010 cells per liter (Ruiz et al.
2000, Drake et al. 2002, Joachimsthal et al. 2004, Burkholder et al. 2007). Drake et al.
(2007) estimated that as many as 1020 bacteria and viruses (3.9 x 10¹⁸ bacteria cells and
6.8 x 10¹⁹ viruses) can be discharged into the lower Chesapeake Bay region annually. Of
these microorganisms, it was estimated that 56 % could survive in the Bay after
discharge.
Pathogenic and indicator microorganisms (i.e., organisms associated with human
and animal diseases) in ballast water are of particular concern (Joachimsthal et al. 2004;
Burkholder et al. 2007). Knight et al. (1999) detected fecal coliforms, fecal streptococci,
Escherichia coli, Salmonella spp., Clostridium perfringens, and Vibrio cholerae in
residual ballast water collected from transoceanic vessels entering the St. Lawrence
Seaway. In another study, Ruiz et al. (2000) detected pathogenic strains of V. cholerae
(i.e., O1 and O139), the causative agents of human cholera, in zooplankton samples from
93% of the ships entering Chesapeake Bay. Though these studies simply detected the
presence of harmful microorganisms, ballast water discharge was directly implicated as
the vector for the introduction of a pathogenic strain of V. cholera into oyster beds off the
coast of Alabama in Mobile Bay (McCarthy et al. 1992).
The only widespread method used to mitigate further introductions of NIS into the
Great Lakes is ballast water exchange (BWE), which involves flushing out coastal
organisms in ships’ ballast water with mid-ocean water before the vessel enters the St.
Lawrence Seaway (IMO 2004; Federal Register 1999). This BWE practice both dilutes
organism abundance and changes the salinity in the ballast tank. Most coastal organisms
would not be expected to survive in ocean water (Locke et al. 1993) and marine
4
organisms discharged into freshwater would be unlikely to survive and develop
reproducing populations (Smith et al. 1999). Though studies have shown BWE is
effective at reducing the abundance of planktonic organisms by up to 80 to 95 % (Ruiz
and Reid 2007, Taylor et al. 2007), substantial numbers of organisms and their resting
stages can remain in ballast tank residual water, sediments, and in internal surface
biofilms (Hallegraeff and Bolch 1992, Galil and Hülsmann 1997, Drake et al. 2007).
Although there is extensive development and research on mechanical, physical, and
chemical methods to treat ballast water before or during discharge, currently no standard
methods have been established. The final ruling from the United States Coast Guard
(USCG) on regulations for ballast water management concluded that BWE will remain an
interim protective measure until on-board ballast water treatment systems are available to
meet ballast water discharge standards (BWDS) for the allowable concentrations of living
organisms discharged by ballast water (Federal Register 2012). Similar BWDS have
been established by a number of states in the Great Lakes region (i.e., Minnesota,
Wisconsin, New York, and Michigan), and by the Environmental Protection Agency
(EPA; Federal Register 2012; U.S. CRS Report 2012). These BWDS are in line with the
ballast water management standards of the United Nations’ International Maritime
Organization (IMO) including benchmarks for the concentration of select indicator
microorganisms (i.e., Toxigenic V. cholerae [serotypes O1 and O139], Escherichia coli,
and intestinal enterococci; IMO 2008).
Current ballast water management practices on transoceanic ships entering the
Great Lakes – St. Lawrence Seaway can potentially prevent future biological invasions
(MacIsaac et al. 2002), but the further spread of an NIS within the Great Lakes after its
initial discovery (secondary spread) will determine the final economic and environmental
impacts (Lodge et al. 1998). Rup et al (2010) identified domestic ballast water transfers
within the Great Lakes as the most important vector for the secondary spread of NIS.
Domestic bulk carriers (‘Lakers’) transfer 95% of the ballast water transported within and
between the Great Lakes. In the EPA’s National Coastal Assessment Report IV (U.S.
EPA 2012) based on water and sediment quality, benthic community condition, loss of
coastal habitat, and fish tissue contaminants, the Great Lakes coasts received the lowest

5
overall condition score (2.2 = Fair to poor). Southeastern Alaska and American Samoa
received the highest overall condition score (5 = Good). Since ballast water is typically
taken up in coastal waters, domestic transfers of ballast water within and between the
Great Lakes remain a concern. Another important finding by Rup et al. (2010) was the
overall transport of ballast water from the lower to upper lakes. The majority of the
initial discoveries of NIS within the Great Lakes occurred in the lower lakes (Grigorovich
et al. 2003).
The two most important factors affecting the successful establishment of a NIS
are propagule pressure and the abiotic and biotic characteristics of the new environment
(Smith et al. 1999, Grigorovich et al. 2003, Lockwood et al. 2005, U.S. EPA 2008,
Litchman 2010). Propagule pressure is defined as the number of non-native organisms
introduced to a new environment including both the abundance of organisms and the
frequency of introduction events (Lockwood et al. 2005, Wonham et al. 2000). Microbial
abundance in ballast water can be used as a proxy for propagule pressure where ballast
water discharge volume and shipping traffic patterns are used to estimate the frequency
of inoculation (Drake et al. 2007). Invasion pressure includes the density, diversity, and
species richness of organisms discharged in ballast water (Smith et al. 1999, Jousset et al.
2011).
The majority of the studies on prokaryotic organisms in ballast water estimated
their abundance after a voyage, during a voyage, or before and after mid-ocean exchange
(MOE; Drake et al. 2002, Drake et al. 2005, Sun et al. 2010, Seiden et al. 2011). Other
studies detected and estimated the abundance of specific target organisms such as enteric
bacteria (i.e., E. coli, V. cholerae, enterococci; Ruiz et al. 2000, Aquirre-Macedo et al.
2008, Joachimsthal et al. 2004, Ivanov 2006, Burkholder et al. 2007), human pathogenic
bacteria (i.e., Listeria monocytogenes, Mycobacterium spp., Pseudomonas aeruginosa;
Burkholder et al. 2007), toxic Cyanobacteria (Doblin et al. 2002), or bacteria associated
with coral disease (i.e., Serratia marcescens, and Sphingomona spp.; Aquirre-Macedo et
al. 2008). Yet, very few studies have explored the structure and composition of bacterial
communities in ballast water (Tomaru et al. 2010) and compared these communities to
those in the waters of the recipient port (Ma et al. 2009).
6
Biotic conditions in a new environment that can effect the establishment of
microorganisms introduced via ballast water discharge include the community structure
and composition of the resident bacterial communities (Jousset et al. 2011, Lichtman
2010), grazing pressure by zooplankton, and mortality due to viral lysis (Hahn and Höfle
2001, Muylaert et al. 2002, Berdjeb et al. 2011). Abiotic conditions of recipient aquatic
environments, such as temperature, salinity, nutrient availability, water quality, and
various anthropogenic disturbances, can also have a profound influence on whether
newly introduced microorganisms survive and reproduce (Smith et al. 1999, Mack and
D’Antonio 1998, Drake et al. 2007).
The international port in the Duluth-Superior Harbor (DSH), at the western end of
Lake Superior, is the largest and busiest commercial port in the Great Lakes with almost
1000 vessel visits annually (DSPA 2012). The DSH, located at the confluence of Lake
Superior and the St. Louis River in a freshwater estuary, received twice the total
discharge volume and two times more ballast water discharge events than any other Great
Lakes port during 2006 and 2007 (U.S. EPA 2008). In the EPA study, Predicting Future
Introductions of Nonindigenous Species to the Great Lakes (U.S. EPA 2008), commercial
ports in the Great Lakes identified to be at greatest risk of future invasions were Toledo,
OH, Gary, IN, Duluth, MN, Milwaukee and Superior, WI, Chicago, Il, and Ashtabula and
Sandusky, OH. These ports were identified based on the suitability of habitat and
propagule pressure. Although this 2008 EPA study determined that the suitability of the
habitat in the DSH was lower than for other ports in the Great Lakes, the potential for the
transport of nonindigenous species to the DSH was determined to be high. The Duluth-
Superior Harbor is located in one of four invasion “hotspots” within the Great Lakes
based on initial NIS discoveries (Grigorovich et al. 2003).
It is crucial to monitor areas that are at most risk for invasions, such as the
Duluth-Superior Harbor (Vander Zanden and Olden 2008). Ricciardi et al. (2011)
likened biological invasions to natural disasters and emphasized the importance of a rapid
response and assessment, which is intrinsically dependent on monitoring and early
detection of alien organisms. Recently, there have been studies conducted within the
Duluth-Superior Harbor to describe the abundance and distribution of native and
7
nonindigenous species of fish (Peterson et al. 2011), benthic invertebrates (Trebitz et al.
2010), and crustacean zooplankton (M. C. TenEyck and D. K. Branstrator unpublished
data). However, there have been few studies to-date describing the bacterioplankton
community structure and composition in the harbor and how this community compares to
those found in the waters of Lake Superior and the St. Louis River. Similarly, there has
been no research on the composition and diversity of bacterioplankton communities in
ballast water discharged into the Duluth-Superior Harbor or other Great Lakes ports
despite the potential risks to native organisms, human health, and the economies of
communities within Great Lakes region.
In Chapter II, I present research findings on both the genetic structure of the
bacterioplankton communities within the Duluth-Superior Harbor and various abiotic and
biotic factors within the harbor that may influence these communities. In Chapter III, I
compare bacterioplankton communities in ballast water and treated wastewater effluent
entering the Duluth-Superior Harbor with the bacterioplankton communities within the
harbor. The main research goals of this study were to: (1) determine if the structure of
the bacterioplankton communities gradually transition along a transect from the St. Louis
River, through the Duluth-Superior Harbor, and into Lake Superior, (2) determine
whether the structure of the bacterioplankton community within the harbor simply
reflects a mixture of bacterioplankton communities from Lake Superior and the St. Louis
River, (3) evaluate abiotic and biotic factors that may influence the bacterioplankton
community structure within the harbor, (4) compare the bacterioplankton community
structure within the harbor to the structure of bacterioplankton communities in ballast
water of commercial ships and treated wastewater effluent, (5) characterize the
composition and diversity of bacterioplankton communities in the harbor and in both
freshwater and seawater ballast, and (6) identify bacterial taxa in ballast water collected
from ships entering the Duluth-Superior Harbor that may be of economic or
environmental concern, or of threat to human health.
8
CHAPTER II
Changes in the Genetic Structure of Bacterioplankton Communities along a Transect through the Duluth-Superior Harbor
INTRODUCTION
Ballast water is a major vector in the introduction and spread of aquatic
nonindigenous species (NIS) in the Great Lakes – St. Lawrence Seaway (Mills et al.
1994, Grigorovich et al. 2003). The Duluth-Superior Harbor (DSH), at the western end
of Lake Superior, receives more ballast water discharge than any other Great Lakes port
(MPCA 2008; Fig. II.1). Based on initial NIS discoveries, the Duluth-Superior Harbor is
in one of four biological invasion “hotspots” in the Great Lakes (Grigorovich et al. 2003,
Trebitz et al. 2010). It is important to monitor and assess areas most at risk for biological
invasions (Vander Zanden and Olden 2008, Ricciardi et al. 2011). The potential for the
successful introduction and spread of an invasive microbe via ballast water is affected by
the abiotic and biotic characteristics of the recipient environment (Smith et al. 1999,
Grigorovich et al. 2003, U.S. EPA 2008). Abiotic conditions that can influence the ability
of potentially invasive microbes to survive and reproduce in the new environment include
temperature, salinity, pH, nutrient availability, and anthropogenic disturbances (Smith et
al. 1999, Fierer et al. 2007, Mack and D’Antonio 1998, Drake et al. 2007). Biotic
conditions that may influence successful microbial invasion include the resident bacterial
community structure and composition (Jousset et al. 2011, Lichtman 2010), grazing
pressure by zooplankton, and mortality risks due to viral lysis (Hahn and Höfle 2001,
Muylaert et al. 2002, Berdjeb et al. 2011).
The Duluth-Superior Harbor is located in a freshwater estuary at the confluence of
the St. Louis River and Lake Superior, the freshwater lake with the largest surface area in
the world. The hydrology of the Duluth-Superior Harbor is affected by the inflow of two
rivers, two outflow channels, Lake Superior seiche oscillations, and a counter-clockwise
current that flows along the Lake Superior shore (Stortz and Sydor 1980, Jordan et al.
1981, Beletsky et al. 1999; Fig. II.1).
9
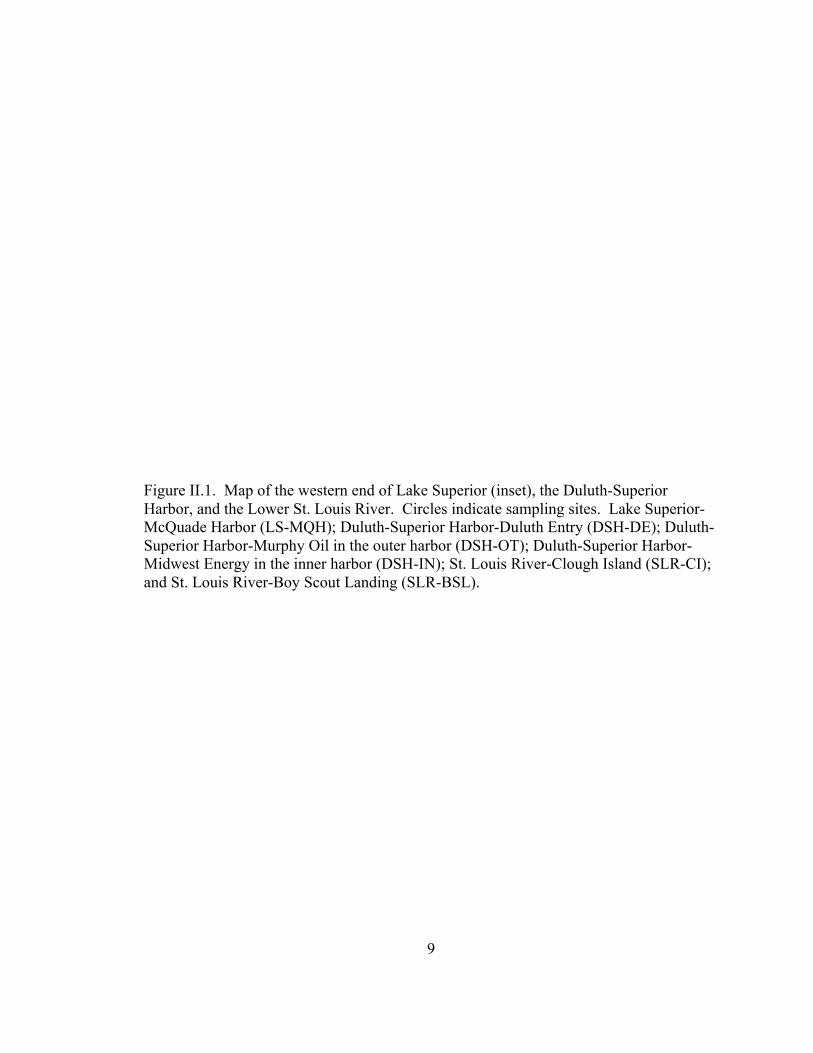
Figure II.1. Map of the western end of Lake Superior (inset), the Duluth-Superior Harbor, and the Lower St. Louis River. Circles indicate sampling sites. Lake Superior-McQuade Harbor (LS-MQH); Duluth-Superior Harbor-Duluth Entry (DSH-DE); Duluth-Superior Harbor-Murphy Oil in the outer harbor (DSH-OT); Duluth-Superior Harbor-Midwest Energy in the inner harbor (DSH-IN); St. Louis River-Clough Island (SLR-CI); and St. Louis River-Boy Scout Landing (SLR-BSL).

10
11
The St. Louis River (mean annual discharge of 56 m3 sec-1; Mitton et al. 1994)
flows through the St. Louis River estuary entering the inner harbor in St. Louis Bay,
continues through the outer harbor at the western end of Superior Bay, and finally
discharges into Lake Superior primarily through the Duluth shipping channel (Duluth
Entry). The Nemadji River (mean annual discharge of 11 m3 sec-1; MPCA/WDNR 1992)
enters the outer harbor at the eastern end of Superior Bay adjacent to Allouez Bay and
discharges into Lake Superior primarily through the Superior shipping channel (Superior
Entry). The amplitude of the Lake Superior seiche entering the harbor typically ranges
from 3 to 15 cm and has a fundamental oscillation period of 7.9 hours (Stortz and Sydor
1980) that can set up minor periodic oscillations every 2.1 hours within the harbor
(Jordan et al. 1981). The mixing of river and lake water by these tide-like seiche
oscillations help define the lower portion of the St. Louis River as a freshwater estuary
(Herdendorf 1990).
The St. Louis River watershed (9,283 km2) is primarily forested but includes
wetlands, agriculture, urban, and open water sections (MDNR 2006). The presence of
tannins and humic acids released from decaying organic material in swamps and bogs
gives the St. Louis River water its characteristic ‘tea-color’ (Wagner 1976). In addition
to high dissolved organic content, the St. Louis River and its tributaries are a major
source of suspended solids, most of which are deposited within the harbor itself (Bahnick
and Markee 1985). Other sources of suspended solids to the harbor include treated
wastewater effluent, storm-water runoff, and resuspended sediments in ballast water
discharge (Klarer and Millie 1994, Villac and Kaczmarska 2011, Bailey et al. 2003). The
Western Lake Superior Sanitary District (WLSSD), a municipal and industrial
wastewater treatment facility, discharges tertiary-treated effluent into the inner harbor of
DSH at an annual rate of 40 million gallons per day (MGD). Treated wastewater effluent
turbidity levels can vary and are affected by storm water and snow melt-water inflow.
Storm water run-off can carry accumulated solids from streets, gutters, and other urban
and industrial structures. A major secondary source of turbidity in the harbor is the
resuspension of sediments due to seiche oscillations, ship traffic, and periodic dredging of
shipping channels (Stortz and Sydor 1980). Resuspension of sediments can release
12
nutrients and increase bacterial cell abundance in the water column (Reddy et al. 1996,
Holmroos et al. 2009, Pettibone et al. 1996).
A well-documented feature of river-dominated marine estuaries is an estuarine
turbidity maxima (ETM) created by water density differences and the interaction of river
flow and tidal forces. Particles of inorganic and organic origin are trapped in this zone of
mixing extending the residence time of nutrients and particle-associated bacteria and
setting up conditions for an estuarine ecotone (Crump et al. 1999, 2004). In Great Lakes
estuaries, it is hypothesized that a vertical gradient may occur if cold lake water flows
under much warmer river water, but this would be short-lived due to heat transfer (Dyer
1990). Residence times in Great Lakes estuaries may be more driven by hydrologic
features (Morrice et al. 2004, McCarthy et al. 2007). In freshwater estuaries with
restricted outflows, seiche activity can take the place of tides and induce temporary
entrapment of lake plankton, suspended solids, and nutrients where lake and river waters
mix (Klarer and Millie 1994). Like most Great Lakes estuaries, the St. Louis River
estuary is considered a drowned river estuary, but it is also classified as a baymouth bar-
type estuary due to the presence of Minnesota Point, a long narrow strip of sand
influencing the mixing of lake and river water by protecting the estuary from high-energy
wind and waves of Lake Superior.
In the transition zone of an estuary, a combination of physical, chemical, and
biotic conditions influence the structure and composition of bacterial communities. In
marine estuaries, salinity gradients define a unique estuarine ecotone (Bouvier et al.
2002, Crump et al. 2004, Bernhard et al. et al. 2005). In Great Lakes freshwater
estuaries, nutrient rich river water mixes with phosphorus-deficient lake water to form an
area with unique water chemistry (Lavrentyev et al. 2004, Mueller-Spitz et al. 2009). In
the freshwater estuary, Old Woman Creek (Lake Erie), conductivity, turbidity and total
suspended solids were highest at the confluence of lake and stream water (Herdendorf
1990). Fortunato and Crump (2011) demonstrated that physical conditions in the mixing
zones of estuaries define the boundaries of distinct microbial habitats, but gradients
affecting primary productivity (i.e., nutrients and light) and secondary productivity (i.e.,
grazing) influence the variability within microbial communities. In Old Woman Creek

13
estuary, Lavrentyev et al. (2004) found peak microbial biomass, peak plankton richness,
and increased nutrient cycling in the mixing zone of Lake Erie and stream water. In
addition, they estimated that microbial grazers consumed at least 50% of the daily
production of bacteria and nanoplankton at the confluence of the lake and stream water.
These findings are consistent with what has been established for nutrient cycling and
aquatic food web dynamics in marine estuaries (Godhantaraman and Uye 2003, Iriarte et
al. 2003, Lehrter et al. 1999, Roman et al. 2001).
Adequate residence time is a critical component in the influence of an estuarine
mixing zone on nutrient cycling (Crump et al. 2004, Lavrentyev et al. 2004) and on
communities of zooplankton (Morgan et al. 1997, Lavrentyev et al. 2004), phytoplankton
(Ferreira et al. 2005, Wang et al. 2004), and bacterioplankton (Crump et al. 2004,
Bernhard et al. 2005, Fortunato and Crump 2011). Crump et al. (2004) detected unique
bacterial communities in the Columbia River estuary when the 17 to 18 day residence
time of the estuarine water exceeded the average doubling times of the bacterioplankton
communities measured in the summer and fall (1.1 and 1.9 days, respectively). Stortz
and Sydor (1980) estimated the residence time in the Duluth-Superior Harbor to be on the
order of 30 to 40 days based on a simulation study evaluating the transport of a dissolved
pollutant entering the inner harbor at the Midwest Energy coal dock (Superior, WI). This
long residence time may allow a unique bacterial community to develop within the
Duluth-Superior Harbor.
To date, there have been few investigations of the structure or composition of
bacterioplankton communities within the Duluth-Superior Harbor or the St. Louis River.
This study was designed to examine the genetic structure of the bacterioplankton
communities within the Duluth-Superior Harbor and evaluate a number of abiotic and
biotic parameters that may influence the resident bacterioplankton communities. The
first objective was to test the hypothesis that the genetic structure of bacterioplankton
communities within the harbor is fundamentally different from the community structure
of bacterioplankton populations in Lake Superior and the St. Louis River. Bray-Curtis
ordination analysis was used to test whether the genetic structure of the bacterioplankton
communities changed along a transect from the St. Louis River, through the Duluth-
14
Superior Harbor, and into Lake Superior. In addition, artificial mixtures of Lake Superior
and St. Louis River water were used to determine if the bacterioplankton community
structure within the harbor reflects a simple mixture of lake and river bacterioplankton.
First, DOC concentrations in mixtures of lake and river water were used to identify
locations in the harbor that may have had similar ratios of lake and river water. Next, the
genetic structure of bacterioplankton communities within these mixtures, were compared
to the genetic structure of bacterioplankton communities near the estimated locations
within the harbor. The second objective of this study was to evaluate the potential
influence of various abiotic and biotic factors on the structure of bacterioplankton
communities in the Duluth-Superior Harbor.
METHODS Study sites and sampling
Six sample sites were chosen along a 36 km transect from Lake Superior, through
the Duluth-Superior Harbor into the Lower St. Louis River (Fig. II.1). The Lake Superior
sample site (LS-MQH, 46°51.98' N; 91°55.42' W) was located 1.6 km offshore of Lake
Superior approximately 15.5 km from the Duluth Entry. The Duluth Entry sample site
(DSH-DE, 46°46.81'N; 92°04.95'W) was adjacent to the major discharge channel of the
St. Louis River on the Lake Superior side. The outer harbor sample site (DSH-OT,
46°45.64' N; 92°05.59' W) was in the eastern end of Superior Bay near the Murphy Oil
Marine Terminal Berth 3, and the inner harbor sample site (DSH-IN, 46°44.69' N;
92°06.96' W) was located in the St. Louis Bay near Superior Midwest Energy Terminal
(St. Louis Bay). In the lower St. Louis River, sample site SLR-CI (46°42.95' N;
92°11.23' W) was located northeast of Clough Island within the boating channel. The
upper St. Louis River sample site (SLR-BSL, 46°39.19' N; 92°13.68' W) was located
upstream from the Oliver Bridge at Boy Scout Landing.
On September 3, 2009, three independent replicate water samples were collected
at each sample site just below the water surface using 20-L plastic carboys. Carboys
were rinsed with sample water prior to sample collection. No rain had occurred 48 hours
15
prior to sampling. Water samples were stored at 4°C within four hours of collection and
filtered the same day.
Artificial mixtures of Lake Superior and St. Louis River water
Mixtures of Lake Superior and St. Louis River water were used to determine if
the bacterioplankton community structure in the harbor simply reflected a mixture of
bacterioplankton communities from the lake and river. Additional Lake Superior (LS-
MQH) and St. Louis River (SLR-BSL) water was collected at the time of sampling and
then combined in the laboratory into three different mixtures (i.e., 60% Lake: 40% River
[60L/40R], 40 % Lake: 60% River [40L/60R], and 20% Lake: 80% River [20L/80R]).
For each lake and river water mixture, total cells were collected on three membrane
filters to extract microbial DNA and perform T-RFLP analysis (see details below).
Minor et al. (2008) found DOC concentrations to be higher in the St. Louis River than
those found in Lake Superior. A simple linear regression analysis was used to place the
lake and river water mixtures along the sample transect through the harbor based on DOC
concentrations (see analysis details below). Nonmetric multidimensional scaling (NMS)
was used to place T-RFLP profiles of the lake and river water mixtures and field sample
sites in ordination space.
Physicochemical and biotic analyses
At each field sample site, vertical profiles of temperature, dissolved oxygen (DO),
and specific conductivity were measured using a STD/CTD – model SD204 (SAIV A/S
Environmental Sensors and Systems, Bergen, Norway). Water pH was measured using a
YSI 63 meter (Yellow Springs Instruments, Yellow Springs, Ohio) and turbidity was
measured using a Lamotte 2020e Portable Turbidity Meter (geo scientific ltd.,
Vancouver, BC, Canada). Duplicate water samples were collected near the surface at
each site in acid-washed, brown, high-density polyethylene (HDPE), 1-L plastic bottles.
Aliquots of water collected for UV-visible (UV-vis) spectroscopy were stored in amber
glass bottles and processed within 4 h. For chlorophyll a (Chl a) analysis, water samples
were filtered through glass-fiber filters (Whatman GF/F, 47 mm) under low light within 5
16
h of collection. The filters were wrapped in aluminum foil and stored at -20ºC until Chl a
concentrations were measured. Aliquots of each glass fiber filtrate were used for UV-vis
spectroscopy within 4 h. Two hundred ml portions of each glass fiber filtrate were stored
frozen (-20ºC) in brown, HDPE bottles for nutrient analyses. A 40 ml portion of each
glass fiber filtrate was acidified (pH 2) with 6N HCL for dissolved organic carbon (DOC)
analysis and stored frozen (-20ºC).
DOC and SUVA254 – DOC analyses were conducted on filtered water samples,
using a high-temperature combustion technique in a TOC-VCSH/SCN Total Carbon
Analyzer (Shimadzu, Columbia, MD). Prior to analysis, inorganic carbon was removed
by acidifying (pH 2) and sparging leaving the non-purgeable organic carbon (NPOC) in
the water samples. Potassium hydrogen pthalate (KHP) was used to calibrate the TOC
analyzer and to evaluate performance. UV-vis spectroscopy was performed with a
Genesys6 scanning spectrophotometer (Thermo Electron Corp.) scanning from 200 to
800 nm. UV-vis measurements at 254 nm were used to determine specific UV
absorbance (SUVA254) and spectral slope (S250-400). SUVA254 was calculated by dividing
the UV absorbance at 254 nm (m-1) by the DOC concentration (mg C/L-1). When
SUVA254 is normalized for DOC concentrations, it strongly correlates with the aromatic
portion of the DOC in aquatic systems (Weishaar et al., 2003). The spectral slope (S250-
400) values reflect the optical characteristics of a natural water sample and are calculated
as described in Minor and Stephens (2008) using wavelengths from 250 to 400 nm
(Obernosterer and Benner 2004, Minor et al. 2007).
Nutrient analyses – Dissolved inorganic nutrient concentrations were determined
in filtered water sample using flow injection analysis (QuickChem®, Lachat Instruments,
Loveland, CO). Nitrate was reduced to nitrite when passed through a copper-cadmium
column and combined nitrite (reduced nitrate and original nitrite) was determined by the
sulfanilamide method (Strickland and Parsons 1968). Henceforth, combined nitrite will
be referred to as NO3−, since nitrate is more stable than nitrite and is in higher
concentrations in aquatic ecosystems (Rouse et al. 1999). Dissolved orthophosphate
(soluble reactive phosphorus, SRP) was determined by formation of reduced antimony-
phosphomolybdate complex and measured colorimetrically (Strickland and Parsons
17
1968). The salicylate-hypochlorite method was used to measure dissolved ammonia-
nitrogen (Reardon et al. 1966). The equilibrium between un-ionized ammonia (NH3) and
ionized ammonia (NH4⁺) in natural freshwater is primarily influenced by pH and
temperature (Emerson et al. 1975; Soderberg and Meade 1991). Ammonium
concentrations (NH4⁺ µg L-1) at the time of sampling were estimated from dissolved
ammonia-nitrogen (NH3-N µg L-1) concentrations by first converting NH3-N to NH3
(conversion factor 17/14; U.S. EPA 1979). The pH and temperature at each site were
then used to determine the fraction of NH4⁺ at the time of collection based on equations
from Emerson et al. (1975; U.S. EPA 1979).
Chlorophyll a – Chlorophyll was extracted from glass fiber filters in 90% acetone
at 4ºC for 24 h. Extracts were analyzed with a Turner 10-AU fluorometer (Turner
Designs, Sunnyvale, CA). The extracts were reanalyzed after acidification with 6N HCL.
If a decline in relative fluorescence in acidified extracts was not detected, no correction
for phaeopigment contribution was applied (Lorenzen 1967).
Prokaryotic cell abundance
A portion of each water sample was preserved with 37% formaldehyde (pre-
filtered through 0.22 µm pore filter; 2% final concentration) and stored in the dark at 4°C
for up to 2 weeks. A small portion of each preserved sample was placed on a black
polycarbonate filter (25 mm dia., 0.22 µm pore; GE Water & Process Technologies,
Trevose, PA). The DNA in cells was stained with 4’6-diamidino-2-phenylindole (DAPI;
10 µM final concentration), filtered onto the membrane filter, and prokaryotic cells (i.e.,
cells with no visible nucleus) were counted using a Nikon Eclipse 80i epifluorescence
microscope (Porter and Feig 1980).
Bacterioplankton community analyses
Total DNA extraction – Microbial cells in water samples were collected onto
Duropore® membrane filters (142 mm dia., 0.22 µm pore size; Millipore, Billerica, MA)
by N2 gas pressure filtration (< 40 psi) until the filters clogged (i.e., filtrate flow was
substantially reduced). Membrane filters were stored in Whirl-Pak® bags (Nasco, Fort
18
Atkinson, WI) at -80°C. Frozen filters were crushed in the Whirl-Pak® bags before a
one-eighth portion (by weight) was removed for DNA extraction. Since organic material,
clay particles, and humic acids can co-extract with DNA and inhibit PCR amplification
(Kirk et al. 2004), a MoBio PowerSoil® DNA Isolation Kit (MoBio Laboratories, Inc.,
Carlsbad, CA) was used for all DNA extractions. Extracted DNA was stored in sterile
elution buffer (10 mM Tris) at -80°C until further analysis.
Polymerase chain reaction (PCR) – For each sample, the bacterial 16S rRNA
gene was amplified using 40 ng of extracted DNA as a template, Ilustra™ puReTaq
Ready-To-Go PCR Beads (GE Healthcare, Piscataway, NJ), a bacterial-specific forward
primer (27F-FAM; 5’-AGAGTTTGATCMTGGCTCAG-3’; Lane 1991), and a universal
reverse primer (1492R; 5’-TACGGYTACCTTGTTACGACTT-3’; Lane 1991). The
27F-FAM primer was 5’- end labeled with 6-carboxyfluorescein (6-FAM). Integrated
DNA Technologies (Coralvile, IA) synthesized all PCR primers. Each PCR reaction (25
µl) contained ~ 2.5 units of puReTaq DNA polymerase, 200 µM each dNTP in 10 mM
Tris-HCl, 50 mM KCl, and 1.5 mM MgCl2. PCR reaction tubes were placed in a
preheated (94°C) thermal cycler block (DNA Engine® Peltier Thermal Cyclers; MJ
Research). The PCR program included an initial denaturing step at 94°C for 3 min
followed by 20 cycles of denaturation at 94°C for 30 s, annealing at 56°C for 30 s, and
extension at 72°C for 90 s. After a final extension step at 72°C for 10 min, the PCR
reaction tubes were stored at 4°C. The low number of cycles, excess primer, and low
annealing temperature used in the PCR amplification procedure were to minimize PCR
bias (Polz and Cavanaugh 1998, Acinas et al. 2005). PCR products of the expected
fragment size (~1465bp), determined by agarose gel electrophoresis, were purified using
an UltraClean™ PCR Clean-up™ Kit (MoBio Laboratories, Inc., Carlsbad, CA).
Purified PCR products were eluded in nuclease-free water, stored at 4°C, and used within
24 hours.
Terminal restriction fragment length polymorphism (T-RFLP) analysis – Purified
PCR products were digested at 37ºC for 3 hours using restriction enzymes HaeIII, MspI,
and RsaI (Promega, Fitchburg, WI). Digestion was terminated by incubation at 65ºC for
15 minutes. Digested PCR products were precipitated in ethanol, dried, and resuspended
19
in nuclease-free water. The fluorescent terminal restriction fragments (TRFs) of digested
PCR products were separated by size using capillary electrophoresis on an ABI 3730xl
Genetic Analyzer (Applied Biosystems, Carlsbad, CA; BioMedical Genomics Center,
University of Minnesota). Since unrelated bacterial species may produce the same
terminal restriction fragment length for a particular primer-restriction enzyme
combination, multiple restriction enzymes were used to more accurately resolve the
natural diversity in bacterial communities (Liu et al. 1997, Marsh et al. 2000).
Sample electropherograms from GeneMapper® were directly imported into the
BioNumerics® software package (Applied-Maths, Belgium) and converted to
densitometric curves. To remove background noise in the densitometric curve profiles, a
spectral analysis was performed for each sample set to determine the optimal settings for
the Wiener Cut-off (least square filtering) and background scaling (background
subtraction). In addition, a signal/noise ratio was calculated and used as an additional
quality control parameter with the optimal value being greater than 50. Densitometric
curve files were visualized as a gel image of bands and as a profile of corresponding
peaks each representing one terminal restriction fragment (TRF). Each curve file
represents a unique collection of peaks referred to as a DNA fingerprint for each
bacterioplankton community. The BioNumerics® software estimates the TRF sizes in
base pairs (bp) by referencing the internal standard (MapMarker® 1000; 23 standards
ranging from 50 bp to 1000 bp) using the cubic spline fit algorithm. TRFs with estimated
sizes outside of the range of the molecular weight standards were excluded from further
analysis.
The fluorescence intensity of each peak was used to indicate the abundance of
each TRF. Same-sized TRFs can represent more than one taxon that can be distinct from
one another (Dunbar et al. 2001, Kaplan and Kitts 2003) and some organisms produce
multiple TRF sizes (Nübel et al. 1996, Wintzingerode et al. 1997). As a result, TRFs can
represent one bacterial group (taxon) or a number of bacterial groups (taxa). Individual
peaks that were greater than 1% relative to the maximum fluorescence intensity of each
lane were identified. This 1% minimum profiling was used to identify background noise
in the peak profiles. In some samples, percent minimum profiling was adjusted upwards
20
to compensate for higher noise levels, but profiles containing a high level of noise (> 5 %
of the maximum fluorescent intensity) were removed from further analysis. A shoulder
sensitivity of 5 was used for profiles containing peaks without a local maximum or
reported as close doublets. Across all T-RFLP profiles, for each restriction enzyme,
peaks were aligned and placed into bin classes using a 1% position tolerance and 1%
optimization. Peaks representing fragments differing by less than 0.5 bp were included in
the same bin class. Dunbar et al. (2001) found reproducible peaks of less than 0.5 bp in
the same DNA fingerprint indicating closely migrating fragments that differ in length or
nucleotide sequence. For this reason, rounding the fragment size to the nearest integer is
not recommended (Dunbar et al. 2001, Schütte et al. 2008). Peak assignments were
visually inspected and manually adjusted when software placed peaks in inappropriate
classes.
BioNumerics® numerical outputs representing peak heights were imported into
Microsoft Excel. Utilizing relative peak heights (RPH) and presence-absence (PA,
binary) data for the analysis of natural community T-RFLP profiles is recommended
(Blackwood et al. 2003, Culman et al. 2008, Schütte et al. 2008). Fragments with peak
heights less than 50 relative fluorescence units were removed from further analysis
(Blackwood et al. 2003). Since the concentration of DNA injected into each lane in
capillary electrophoresis can differ between samples and even replicates, T-RFLP peak
profiles were relativized or standardized by dividing each peak height by the total sum of
all peak heights for each sample (Liu et al. 1997, Dunbar et al. 2001, Osborn et al. 2000).
Statistical Analyses
Cluster analysis – Densitometric curves in each of the T-RFLP profiles were
compared to explore the natural groupings of the sampling sites using similarity-based
cluster analysis within BioNumerics®. Pairwise similarity matrices were calculated
using Pearson correlation coefficients and dendrograms were constructed using the un-
weighted pair group method with arithmetic mean (UPGMA) clustering algorithm.
BioNumerics® estimates the uncertainty of the dendrogram branches using Cophenetic
correlation comparing the matrix similarities and the dendrogram-derived similarities.
21
Ordination data analyses – Both relative peak height and presence-absence T-
RFLP profiles were summarized and compared in Microsoft Excel. Dominant TRFs
were identified in each restriction enzyme digest creating two TRF subsets, i.e., the most
dominant TRFs and the least dominant TRFs. First, the relative peak heights for each
TRF in a given sample were averaged (ignoring zeros). Then, dominant TRFs were
identified in each restriction enzyme digest that had average peak heights representing
greater than 5% of the total fluorescence in at least one sample profile.
Ordination techniques were performed using PC-ORD Version 4.0 software
(McCune and Mefford 1999). PC-ORD was also used to determine the degree of sparsity
(i.e., percent of empty cells in the data matrix or zero richness) and heterogeneity in all
datasets used in ordination analyses. Heterogeneity was estimated by evaluating the
average skewness, and coefficient of variation (CV) of totals for fragment data (Peck
2010). Following distance matrix calculations, all datasets were analyzed for the
presence of outliers defined here as sample units or fragments with calculated distances >
2 standard deviations (SD) from the mean. Weak outliers have SDs ranging from 2.0 to
2.3 and moderate outliers have SDs ranging from 2.3 to 3. (McCune and Grace 2002). In
ordination analyses, all groups should have similar within group dispersion to avoid false
significant results (Legendre and Legendre 1998) and standard deviation is a widely used
indicator of dispersion. All ordination analyses were run with and without outliers to
determine if revealed patterns mainly reflected relationships associated with outliers.
Ordinations were also run with and without rare fragments (Bernhard et al. 2005) defined
here as fragments present in only one replicate of one sample. Deleting rare species is a
common practice in community composition analyses to reduce noise (McCune and
Grace 2002).
Bray-Curtis ordination – Bray-Curtis (polar) ordinations based on similarities of
T-RFLP profiles were calculated to determine if the genetic structure of bacterioplankton
communities gradually changed along a transect from Lake Superior, through the Duluth-
Superior Harbor, and into the St. Louis River (Beals 1984, McCune and Grace 2002). In
this study, Sorensen (Bray-Curtis) and Jaccard distance measures were used and the
endpoints for both axes were objectively selected using variance regression. Sorensen
22
and Jaccard distance measures are recommended for abundance (relative peak height)
and presence-absence datasets (respectively) since these distance measures do not
consider TRF joint-absences as an indication of similarity between samples (Ramette
2007, Schütte et al. 2008). In addition, Sorensen and Jaccard distance measures are
effective for zero-rich, heterogeneous datasets, and are not excessively sensitive to
outliers (McCune and Grace 2002, Rees et al. 2004, Schütte et al. 2008, Peck 2010). The
percent variance explained by each axis was calculated and the axes were presented in
order of importance.
NMS ordination – Nonmetric multidimensional scaling (NMS) was performed
with the Sorensen distance measure to explore relationships between environmental
variables and the bacterioplankton communities in the harbor and river (Mather 1976,
Kruskal 1964b, McCune and Grace 2002). NMS ordinations are recommended for T-
RFLP data since T-RFLP profiles rarely meet multivariate normality requirements of
parametric ordination methods (Ramette 2007). In NMS plots, samples with greater
similarity are in closer proximity in ordination space. In this study, the autopilot ‘slow
and steady’ option was used to determine recommended number of axes. A final stress of
5-10 is considered a good ordination with minimal risk of false representation of
redundancy patterns (Kruskal’s Stress multiplied by 100; McCune and Grace 2002,
Kruskal 1964a, Clarke 1993). Although a final stress of 10-20 may provide a usable
interpretation at the lower end, plots with stress values at the upper end may provide a
misleading representation (Clarke 1993). To determine if the stress values were stronger
than expected by chance, a Monte Carlo test was run 250 times on randomized data
during each run. To verify consistency of the depicted patterns of T-RFLP profiles in
ordination space, at least five solutions were determined for each analysis using the
recommended number of dimensions. Presence-absence transformations may mask
relationships with environmental factors so only relative peak height data was used in this
analysis (Muylaert et al. 2002).
Relationships between environmental variables and the T-RFLP profiles of the
harbor and river bacterioplankton communities reflected in the NMS ordination plots
were explored using a joint-plot overlay of a second matrix containing the environmental
23
variables. It is recommended that environmental data with non-normal distribution
should be transformed before use in ordination analysis (McCune and Grace 2002). The
Shapiro-Wilk W test was used to test for normal distribution in environmental data
(Shapiro and Wilk 1965) and was performed using Microsoft Excel Analyze-It Software,
Ltd. Scatterplots of the ordination scores for each axis are examined in PC-ORD to
identify non-linear relationships with environmental variables where the use of a
nonparametric measure of correlation would be more appropriate than a parametric
measure.
One-way analysis of similarity (ANOSIM) and similarity percentage (SIMPER) –The
statistical differences between groups in the ordination plots were tested using ANOSIM
with 999 permutations (Clarke 1993, Rees et al. 2004). In this analysis, an R statistic is
computed (0 to 1). R-values > 0.75 indicate groups are well separated, R-values > 0.5
indicate separated groups with some overlap, and R-values < 0.25 indicate groups that are
minimally separated (Ramette 2007). SIMPER analysis was used to estimate overall
average dissimilarity in pairwise comparisons of separated groups as determined by
ANOSIM analysis. In addition, SIMPER analysis was used to identify TRFs that
contribute the most to the dissimilarity between groups in pairwise comparisons (Clarke
1993, Rees et al. 2004). In both ANOSIM and SIMPER analyses, Sorensen and Jaccard
distance measures were used for abundance (RPH) and presence-absence (P-A) datasets,
respectively. ANOSIM and SIMPER were performed using PAST Version 2.15
(Hammer et al. 2001).
Correlation analyses – To determine the relationships among ten environmental
variables, the on-line software PAST Version 2.15 (Hammer et al. 2001) was used to
calculate Pearson product-moment correlation coefficients (Pearson correlation
coefficients). PAST software was also used to calculate Spearman’s rank correlation
coefficients (ρ) to identify significant correlations between environmental variables and
the abundance of influential TRFs identified in SIMPER analysis. All correlation
analyses were completed using average relative peak heights for TRFs calculated by
averaging peak heights of the replicates from each sample site while ignoring zeros.
24
RESULTS Physicochemical and biotic characteristics
Temperature profiles at most field sites showed a warmer upper water layer that
extended to a depth of approximately 2 meters (Fig. II.2). At the inner harbor site (DSH-
IN), the warmer upper layer extended 3 to 3.5 m below the surface. There was a distinct
decrease in water temperature in the bottom 1.5 m at the Duluth Entry (DSH-DE) and
outer harbor (DSH-OT) sites. Differences in specific conductivity were small within the
water column at the inner harbor and St. Louis River sites (DSH-IN, SLR-CI and SLR-
BSL). Specific conductivity, however, dropped in the last 1 to 1.5 meters at the Duluth
Entry (DSH-DE) and the outer harbor (DSH-OT) sites.
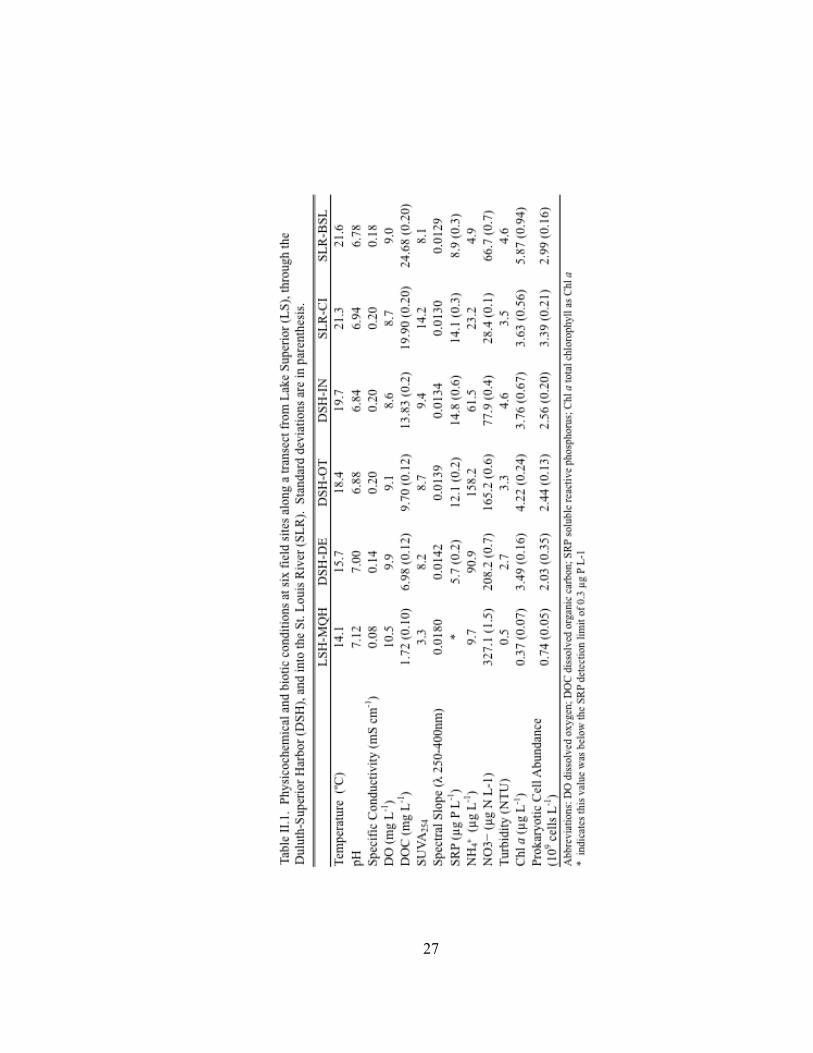
Physicochemical and biotic characteristics of sites along the sample transect
reflected both upstream and downstream gradients (Table II.1). The upper-most river site
(SLR-BSL) had the highest temperature (21.6ºC) and DOC concentration (24.68 mg C
L-1) and both factors gradually declined through the harbor and out into the lake (14.1ºC,
1.72 mg C L-1, respectively). In contrast, the highest levels of NO3− were in Lake
Superior (327.1 µg L-1) and gradually decreased through the harbor and upstream (SLR-
BSL; 66.7 µg L-1). Higher values of NH4+ concentration, turbidity, SRP, and specific
conductivity were found within the harbor (158.2 µg L-1, 4.6 NTU, 12.1 µg P L-1, and
0.20 mS cm-1, respectively) than in Lake Superior or the St. Louis River. Chlorophyll a
concentration, an estimate of algal abundance (Bird and Kalff 1984), was highest at the
furthest river site upstream (SLR-BSL; 5.87 µg L-1). The highest Chl a concentration
within the harbor was at the outer harbor site (DSH-OT; 4.22 µg L-1). No correction for
phaeopigment contribution was required for any sample. Filters for Chl a analysis were
stored over 6 months before processing. Significant amounts of Chl a may be lost when
filters are stored for over a month at -20ºC (Wasmund et al. 2006), so the reliability of
these results was uncertain. The SUVA254 value for the Lake Superior water sample (3.3)
was lower than the SUVA254 values for the harbor and river water samples (8.2 to 9.4 and
8.1 to 14.2, respectively) indicating less humified or aromatic DOM in Lake Superior
compared to the harbor (Weishaar et al. 2003). The highest calculated SUVA254 value
(14.2) was at the SLR-CI river site in Pokegama Bay near the mouth of the Pokegama
25
Figure II.2. (A) Temperature and (B) specific conductivity profiles of the water column on September 3, 2009 at six field sites along a transect from Lake Superior (LS-MQH), through the Duluth-Superior Harbor (DSH-DE, DSH-OT, DSH-IN), and into the St. Louis River (SLR-CI, SLR-BSL). See text for site abbreviations.

26
27
28
River. The spectral slope (S250-400) value was higher for the Lake Superior water sample
(0.0180) than for the harbor and the river water samples (0.0130 to 0.0142 and 0.129 and
0.130, respectively).
Overall, the prokaryotic cell abundance decreased from the St. Louis River to
Lake Superior (2.99 to 0.74 x 10⁹ cells L-1, respectively) but cell abundance was over
10% higher at the SLR-CI river site (3.39 x 10⁹ cells L-1) compared to the upper-most
river site.
Several abiotic and biotic parameters were correlated (p < 0.05; Appendix Table
A-1). Turbidity correlated positively with temperature, DOC, SRP, and prokaryotic cell
abundance and negatively correlated with NO3−. There were no significant relationships
between NH4+ and any other parameters. Environmental variables were normally
distributed as determined by a Shapiro-Wilk W test (Shapiro and Wilk 1965) so
transformations were not necessary (Appendix Table A-2).
Analyses of the genetic structure of bacterioplankton communities
Comparison of the lake, harbor, and river bacterioplankton communities –
Bacterioplankton communities formed at least 3 clusters as revealed by curve-based
hierarchical clustering analysis with >75% similarity among all samples within each
dataset (Fig. II.3). T-RLFP profiles of bacterioplankton communities from the lake
samples formed distinct clusters in all three restriction enzyme digests of 16S rDNA PCR
products. Replicate T-RFLP profiles from the SLR-CI river site were grouped in both the
river and the harbor clusters in the HaeIII and MspI enzyme digests and only in the
harbor cluster for the RsaI enzyme digest. A typically high percent similarity between
replicates reflects the high reproducibility of the T-RFLP analysis results.
Data sets used in each ordination analysis were determined to be sparse and
moderately heterogeneous (Appendix Tables A-3, A-4, and A-5). Overall consistency of
sample site placement in ordination space when outliers or rare fragments were removed
suggested robust patterns.
The Bray-Curtis ordinations of the bacterioplankton T-RFLP profiles constructed
using relative peak height TRFs for samples along the transect through the Duluth-
29
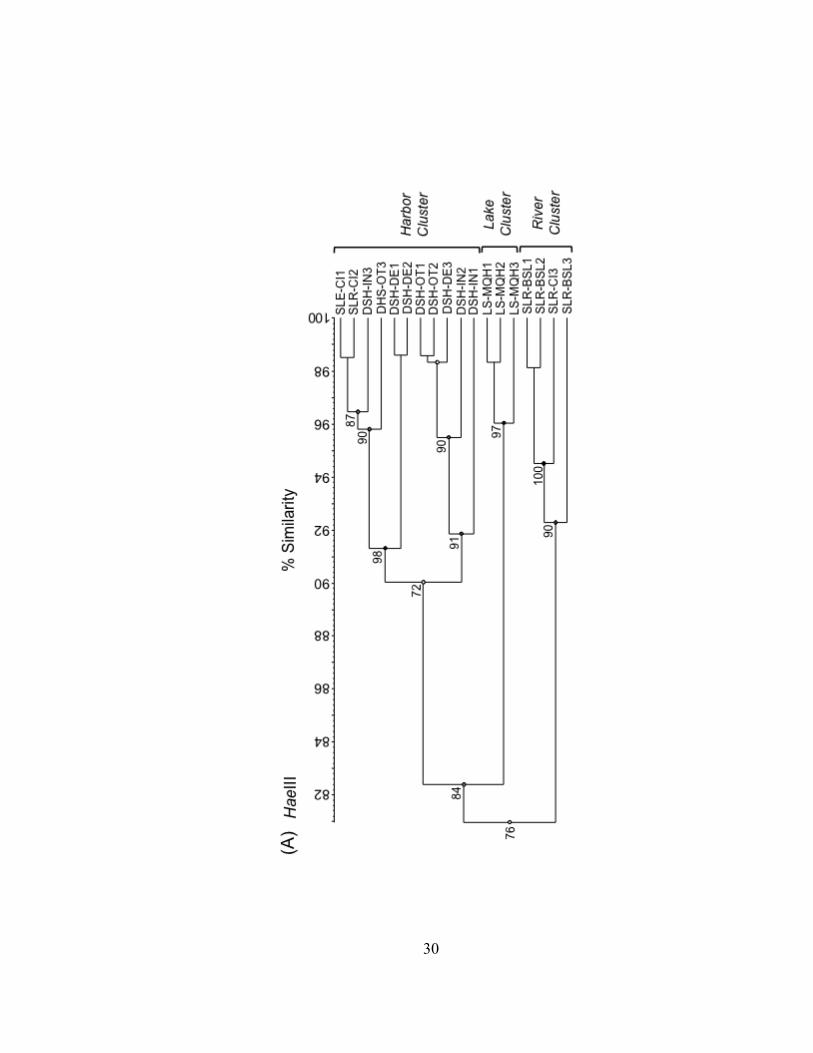
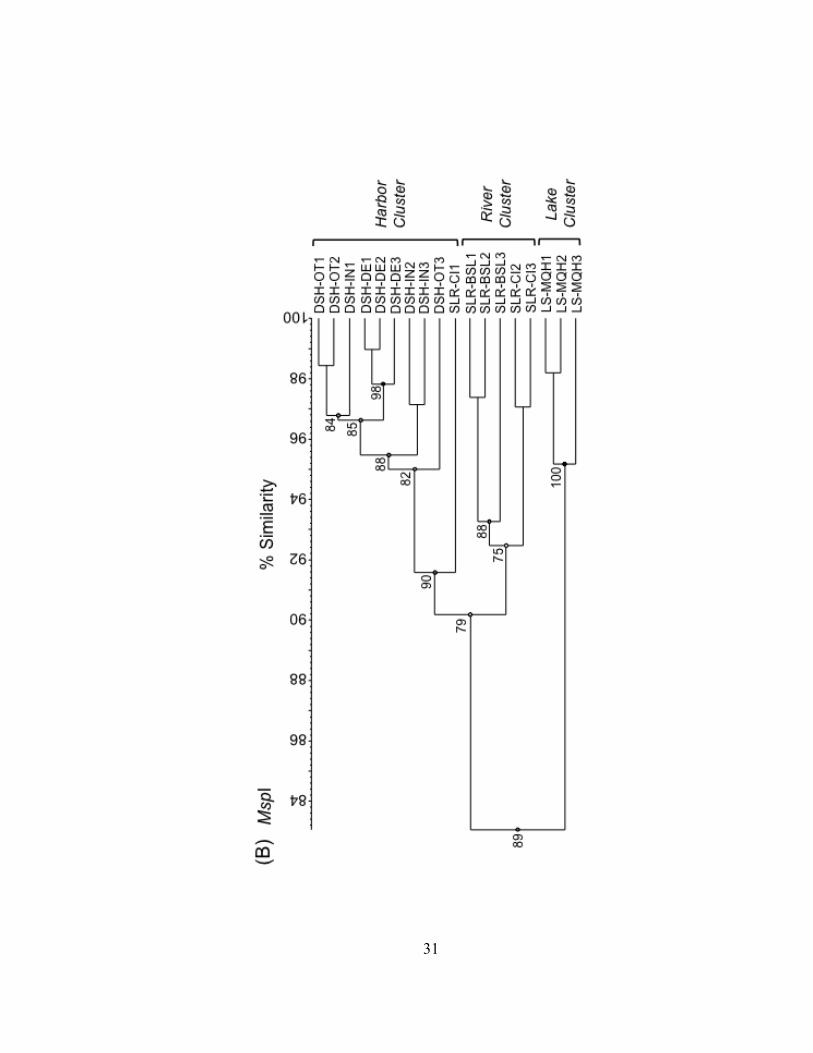
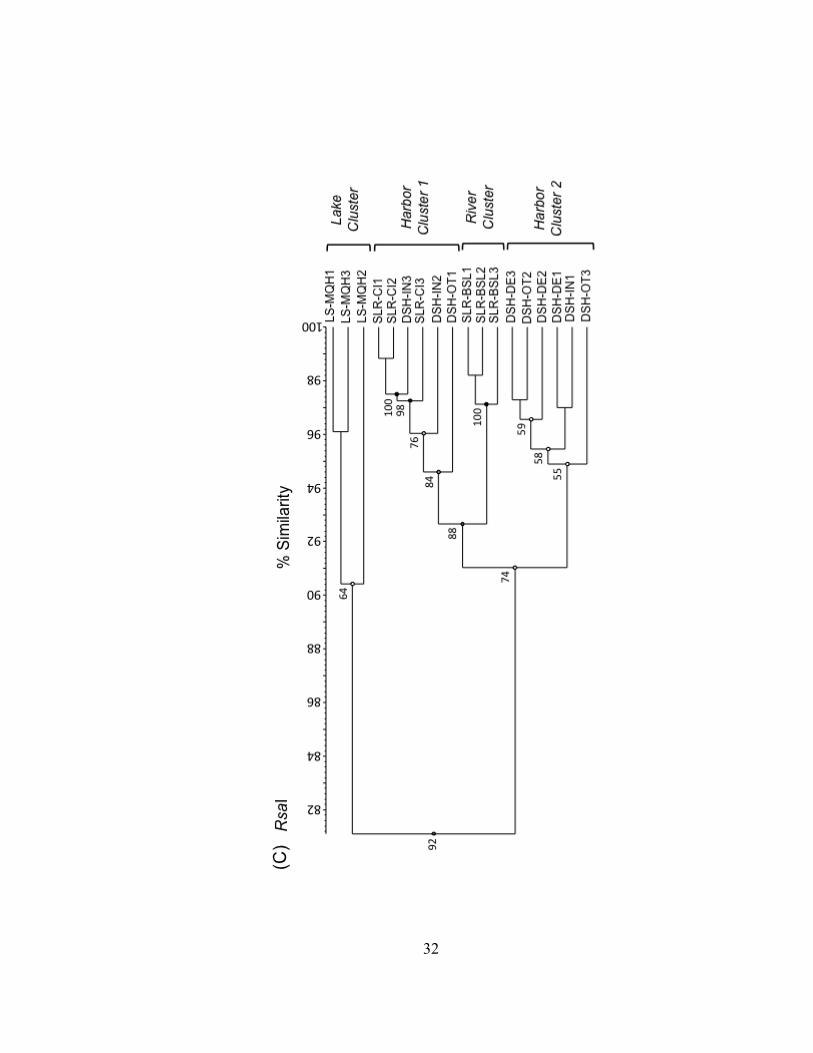
Figure II.3. UPGMA dendrograms depicting hierarchical cluster analysis of T-RFLP profiles of HaeIII (A), MspI (B), and RsaI (C) restriction enzyme digests of bacterioplankton community 16S rDNA from field sites in Lake Superior, the Duluth-Superior Harbor, and the St. Louis River. Pairwise similarity matrices were calculated using the Pearson correlation coefficient. Numbers at branch nodes indicate the cophenetic correlation between the dendrogram-derived similarities and the matrix similarities. Site abbreviations are followed by replicate designation.
30
31
32
33
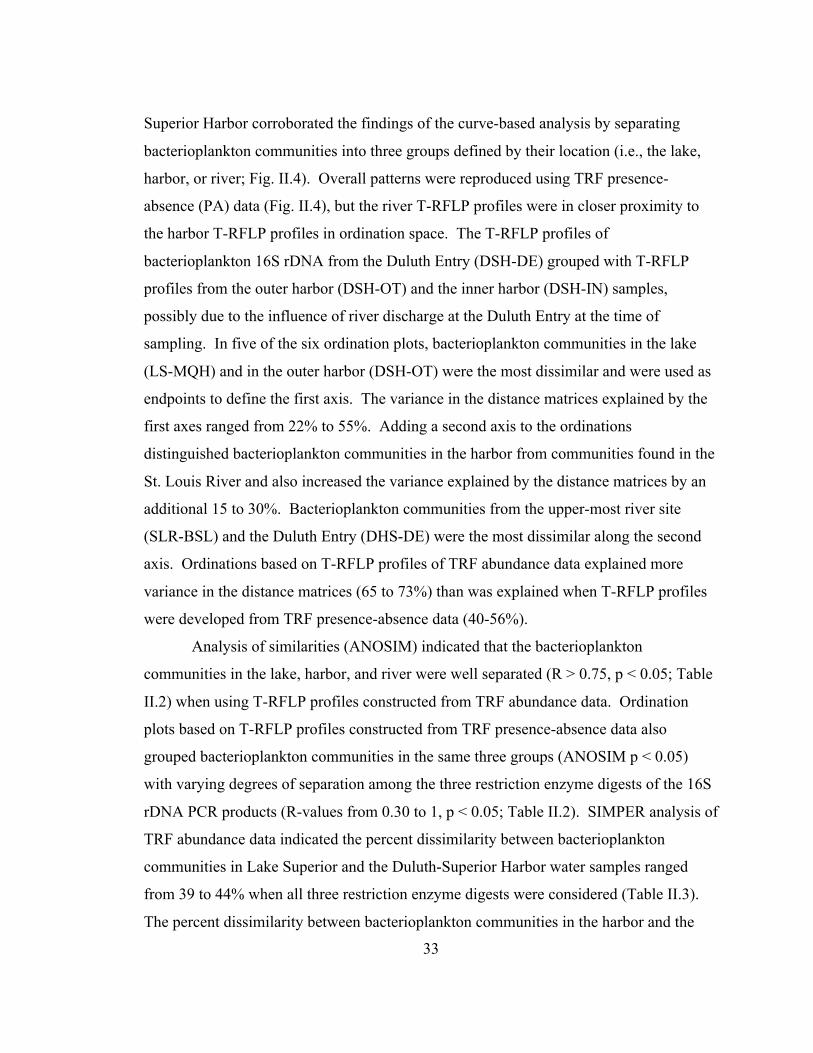
Superior Harbor corroborated the findings of the curve-based analysis by separating
bacterioplankton communities into three groups defined by their location (i.e., the lake,
harbor, or river; Fig. II.4). Overall patterns were reproduced using TRF presence-
absence (PA) data (Fig. II.4), but the river T-RFLP profiles were in closer proximity to
the harbor T-RFLP profiles in ordination space. The T-RFLP profiles of
bacterioplankton 16S rDNA from the Duluth Entry (DSH-DE) grouped with T-RFLP
profiles from the outer harbor (DSH-OT) and the inner harbor (DSH-IN) samples,
possibly due to the influence of river discharge at the Duluth Entry at the time of
sampling. In five of the six ordination plots, bacterioplankton communities in the lake
(LS-MQH) and in the outer harbor (DSH-OT) were the most dissimilar and were used as
endpoints to define the first axis. The variance in the distance matrices explained by the
first axes ranged from 22% to 55%. Adding a second axis to the ordinations
distinguished bacterioplankton communities in the harbor from communities found in the
St. Louis River and also increased the variance explained by the distance matrices by an
additional 15 to 30%. Bacterioplankton communities from the upper-most river site
(SLR-BSL) and the Duluth Entry (DHS-DE) were the most dissimilar along the second
axis. Ordinations based on T-RFLP profiles of TRF abundance data explained more
variance in the distance matrices (65 to 73%) than was explained when T-RFLP profiles
were developed from TRF presence-absence data (40-56%).
Analysis of similarities (ANOSIM) indicated that the bacterioplankton
communities in the lake, harbor, and river were well separated (R > 0.75, p < 0.05; Table
II.2) when using T-RFLP profiles constructed from TRF abundance data. Ordination
plots based on T-RFLP profiles constructed from TRF presence-absence data also
grouped bacterioplankton communities in the same three groups (ANOSIM p < 0.05)
with varying degrees of separation among the three restriction enzyme digests of the 16S
rDNA PCR products (R-values from 0.30 to 1, p < 0.05; Table II.2). SIMPER analysis of
TRF abundance data indicated the percent dissimilarity between bacterioplankton
communities in Lake Superior and the Duluth-Superior Harbor water samples ranged
from 39 to 44% when all three restriction enzyme digests were considered (Table II.3).
The percent dissimilarity between bacterioplankton communities in the harbor and the
34
Figure II.4. Bray-Curtis ordinations based on Sorensen similarities of T-RFLP profiles of bacterioplankton community 16S rDNA from lake, harbor and river water samples. T-RFLP profiles consisted of relative peak height (RPH) of TRFs (A, C, and E) or the presence or absence (PA) of TRFs (B, D, and F). Open squares indicate Lake Superior samples (LS-MQH), solid black shapes indicate Duluth-Superior Harbor samples (DSH-DE, squares; DSH-OT, triangles; DSH-IN, circles), and solid grey shapes indicate St. Louis River samples (SLR-CI, squares; SLR-BSL, circles). For each plot, the endpoints of the two axes were objectively selected using variance regression. Ellipses were added subjectively following analysis. Ordinations of the HaeIII [(A) and (B)] and MspI [(C) and (D)] datasets were reflected vertically and horizontally for ease of viewing. Both ordinations of the RsaI dataset [(C) and (D)] were only reflected vertically.
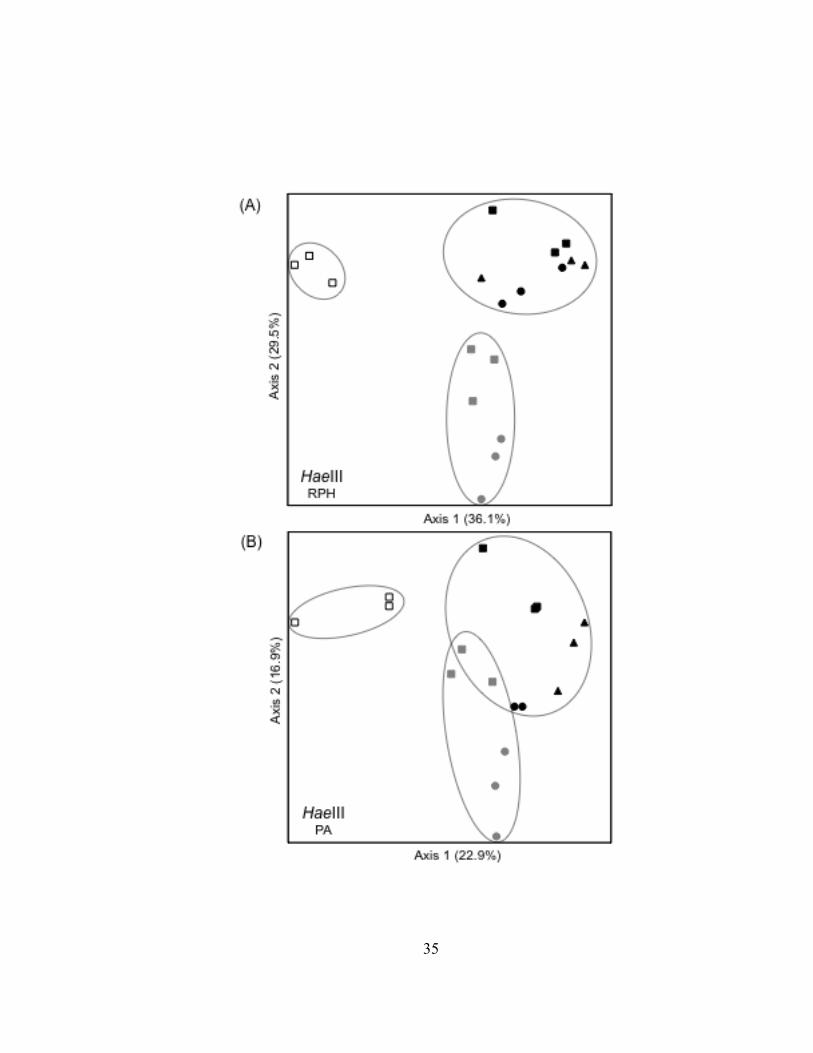
35
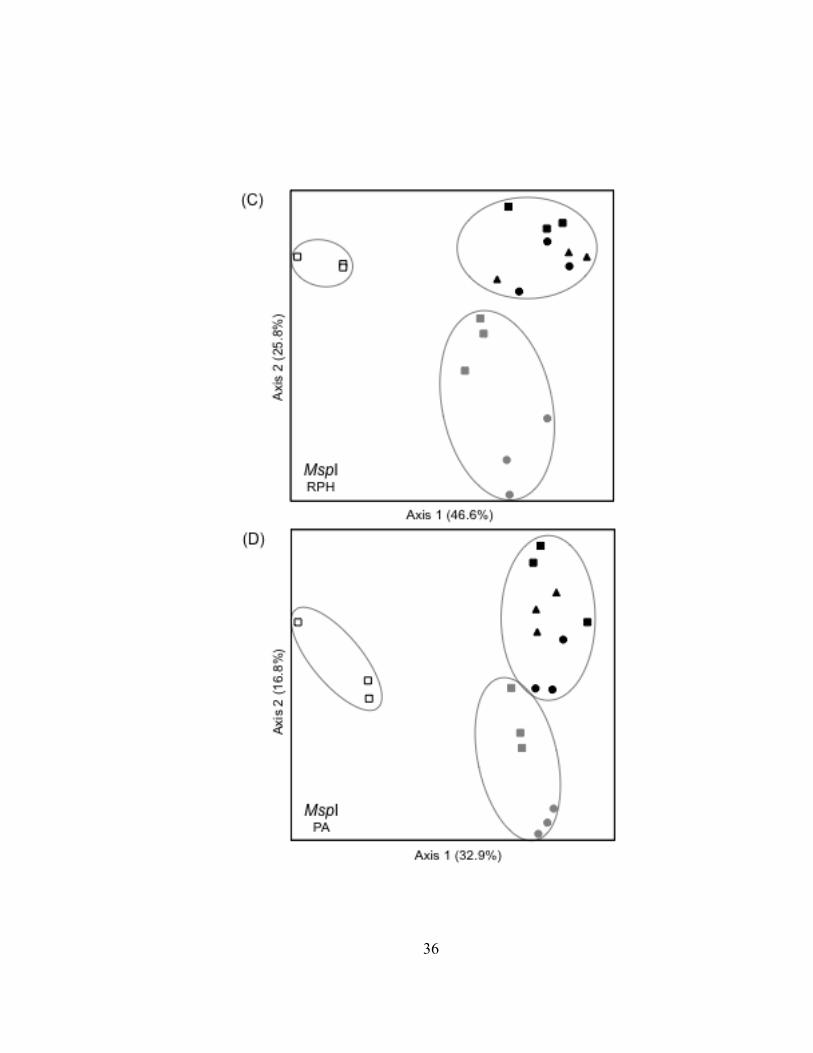
36

37
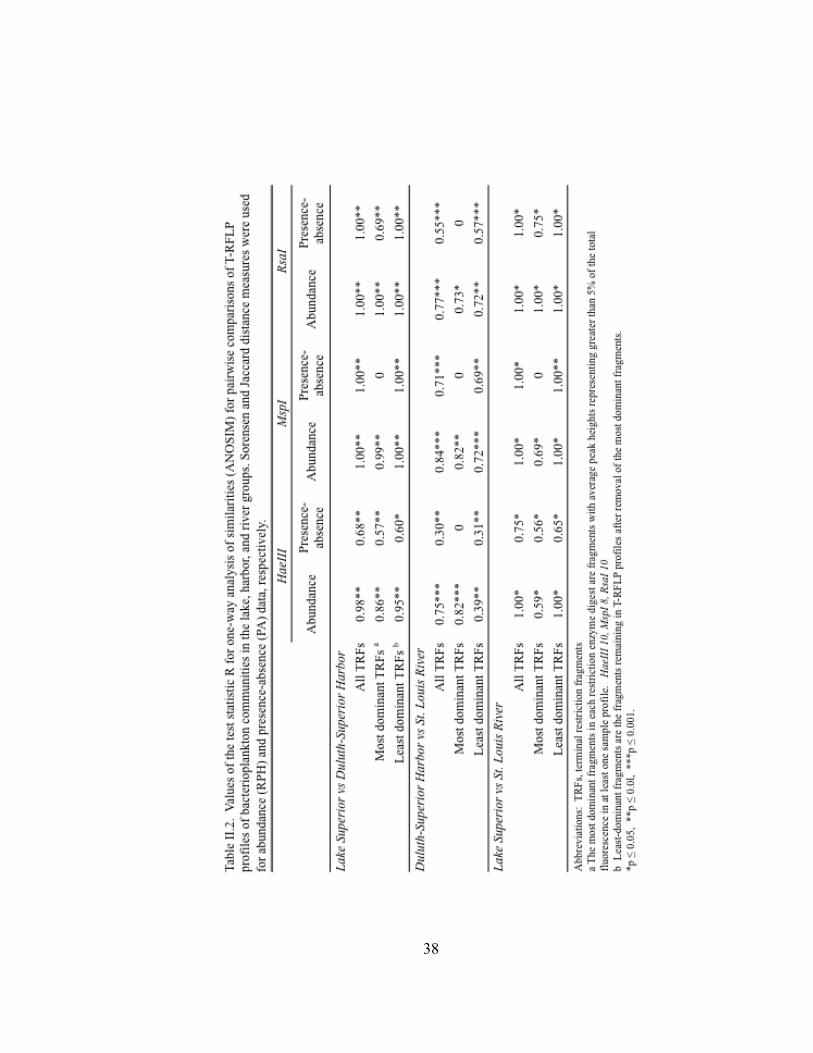
38
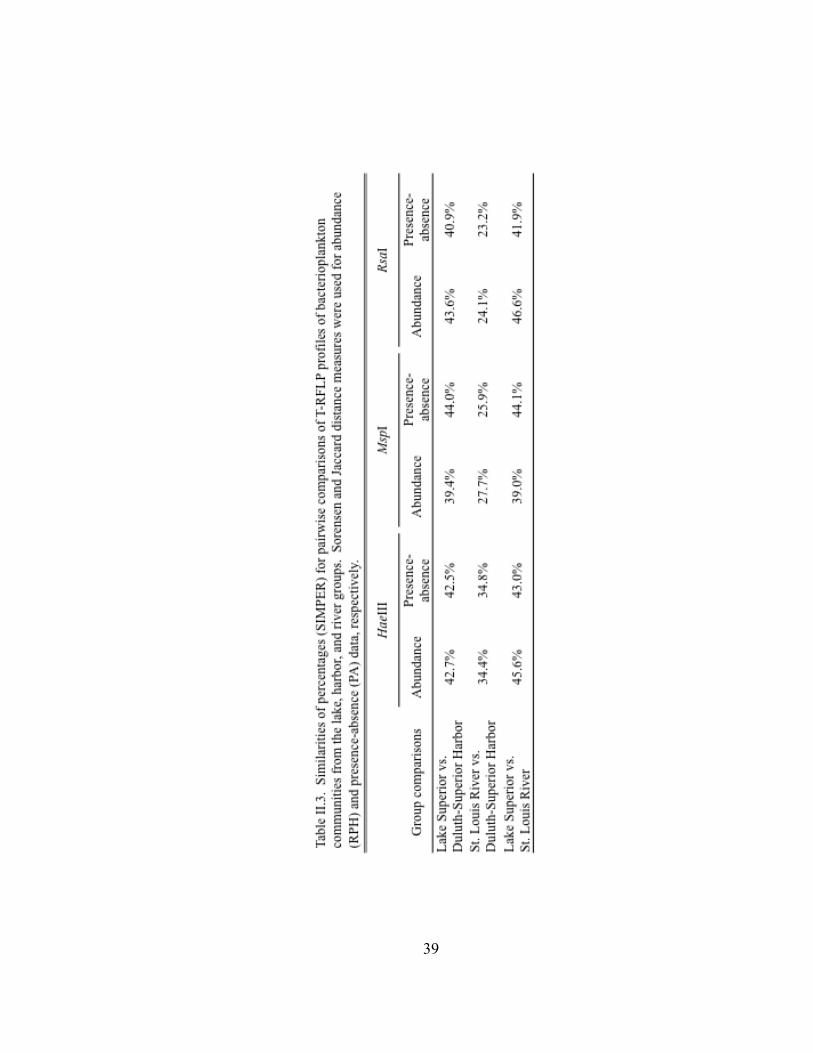
39

40
St. Louis River water samples ranged from 24 to 34%. SIMPER analysis of TRF
presence or absence data produced similar percentages for the same pairwise
comparisons (Table II.3).
The total number of terminal restriction fragments (TRFs) identified in HaeIII,
MspI, and RsaI enzyme digest datasets were 126, 103, and 121, respectively.
Approximately 30% of the TRFs were present in bacterioplankton T-RFLP profiles in all
three groups, i.e., Lake Superior, the Duluth-Superior Harbor, and the St. Louis River
(Fig. II.5). T-RFLP profiles of harbor bacterioplankton communities shared more TRFs
(75-90%) with communities in other regions of the sample transect than the lake or river
groups (63 to 85% and 57 to 90%, respectively) when the HaeIII and MspI enzyme
digests were evaluated. However, unique TRFs were detected in T-RFLP profiles of
bacterioplankton communities from all three regions along the transect in all three
restriction enzyme digests. Fewer unique fragments were detected in bacterioplankton
community T-RFLP profiles from the Lake Superior samples than from the harbor or
river samples. Approximately 17% of the TRFs from the HaeIII restriction enzyme
digest were only detected in bacterioplankton communities from the harbor samples.
There were greater than 2.5 times more unique TRFs in bacterioplankton community T-
RFLP profiles from the harbor region than in profiles from either the lake or the river
areas, when RsaI was used to digest the bacterioplankton 16S rDNA PCR products.
Dominant TRFs were identified in each restriction enzyme digest that had average
peak heights representing greater than 5% of the total fluorescence in at least one sample
profile. Ten dominant TRFs were identified in the HaeIII restriction enzyme digest
representing 69.5% of the total fluorescence in the dataset. Eight dominant fragments
(86.2% total fluorescence) and 10 dominant fragments (80.1% total fluorescence) were
identified in the MspI and RsaI restriction enzyme digests, respectively.
Additional ANOSIM analyses were conducted on T-RFLP profiles constructed
using the most and least dominant TRFs to determine if the separation of
bacterioplankton communities from different regions of the transect was primarily due to
the most common TRFs in the T-RFLP profiles. Bacterioplankton communities were
still observed to be in well separated groups in five of the six pairwise comparisons (R =
41
Figure II.5. Venn diagrams describing the number of terminal restriction fragments (TRFs) in T-RFLP profiles of bacterioplankton community 16S rDNA from the lake, harbor, and river groups using HaeIII, MspI, and RsaI enzyme digests. Numbers in the overlapping portions of the circles are the number of fragments shared between groups. The total number of TRFs for each group is in parenthesis.
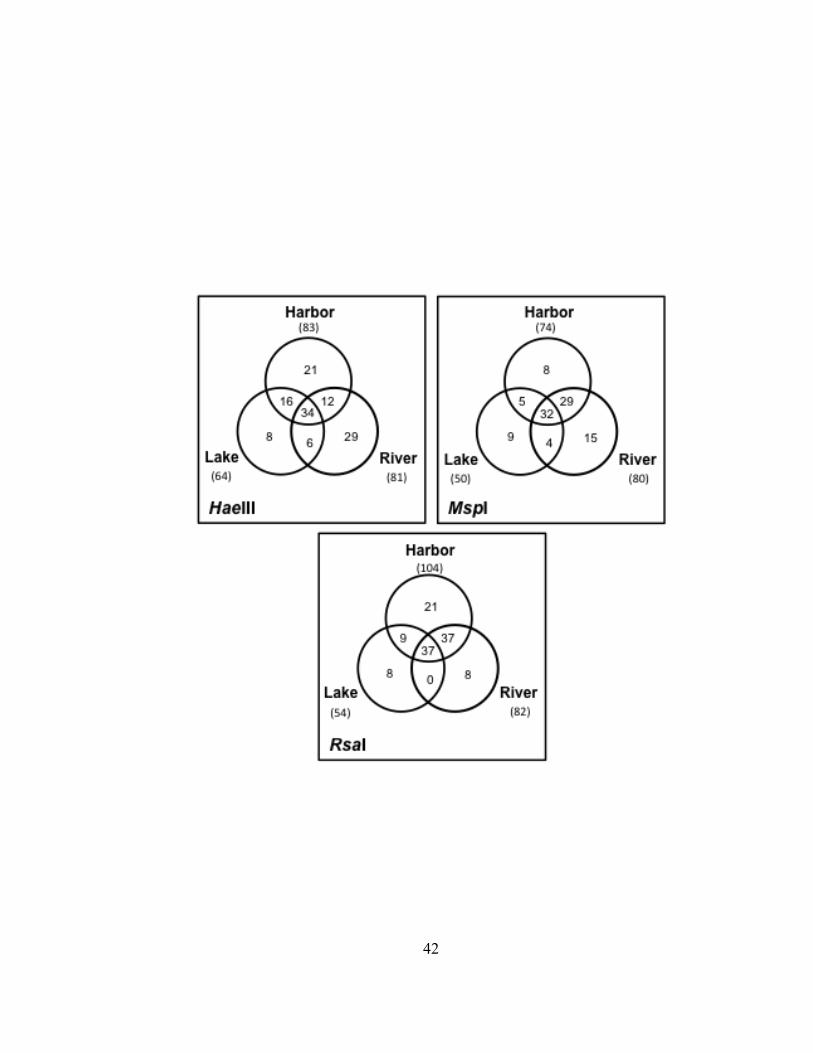
42
43
> 0.70, p < 0.05; Table II.2). Comparing the abundance of the most dominant TRFs
resulted in a stronger separation between the harbor and river bacterioplankton
communities in the HaeIII and MspI restriction enzyme digests (R = 0.82, p < 0.001; R =
0.82, p < 0.01, respectively) than when the least dominant TRF fragments were used (R
=0.31, p < 0.01; R = 0.69, p < 0.01, respectively). The abundance of the most and least
dominant TRFs separated the bacterioplankton communities in the lake and harbor
equally as well when the MspI and RsaI datasets were evaluated (R = 0.99, p < 0.01 and
R = 1, p < 0.01; R = 1, p < 0.01 and R = 1, p < 0.01, respectively). The total percent
contribution of the most dominant TRFs to the dissimilarity between the T-RFLP profiles
of bacterioplankton communities from the lake, harbor, and river ranged from 41 to 63%
(SIMPER). In the HaeIII and MspI restriction enzyme digests, the abundance of the most
dominant TRFs had a greater influence on the dissimilarity between the T-RFLP profiles
of bacterioplankton communities from the harbor and river (63.3% and 49.3%,
respectively) than was found between with the communities in the harbor and lake
(53.9% and 47.3%, respectively) or the communities in the river and lake (50.5% and
40.6%, respectively).
Comparison of lake and river water mixtures with field samples – The three
mixtures of Lake Superior (L) and St. Louis River (R) water (i.e., 60L/40R, 40L/60R, and
20L/80R), had DOC concentrations of 10.69, 15.35, and 19.94 mg L-1, respectively. A
location along the sample transect was estimated for each lake and river water mixture
based on its DOC concentration using a linear regression model (y = 0.8707x + 7.4785;
R² = 0.99; p < 0.05; Fig. II.6). The distances from the Duluth Entry field site (DSH-DE)
were 3.7 ± 3.8, 9.06 ± 3.7, and 14.3 ± 3.8 km for mixtures (i.e., 60L/40R, 40L/60R, and
20L/80R, respectively). This placed two of the mixtures (60L/40R and 40L/60R) within
the harbor and one mixture 20L/80R between the two field sites in the St. Louis River.
NMS ordinations were performed to determine if the T-RFLP profiles of the
artificial bacterioplankton communities in the lake and river water mixtures were most
similar to the communities at field sites in closest proximity to the estimated locations of
mixtures along the sample transect (Fig. II.7). Unfortunately, several T-RFLP profiles
44
Figure II.6. Dissolved organic carbon (DOC) concentrations along the sampling transect through the Duluth-Superior Harbor (solid black shapes: DSH-DE square, DSH-OT triangle, DSH-IN circle) and into the St. Louis River (solid grey shapes: SLR-CI square, SLR-BSL circle). The regression line indicates a significant decrease in DOC concentration from the river into the harbor. The dashed lines surrounding the regression line represent the 95% confidence intervals. Open diamonds represent corresponding distances from the Duluth Entry estimated for artificial mixtures using the equation: y = 0.8707x + 7.4785; R² = 0.99; P < 0.05. Proportions of Lake Superior (L) and St. Louis River (R) water in each mixture are depicted in boxes.

45
46
Figure II.7. Nonmetric multidimensional scaling (NMS) ordinations based on Sorensen similarities of T-RFLP profiles of HaeIII, MspI, and RsaI enzyme digests of bacterioplankton community 16S rDNA from artificial mixtures of lake and river water and samples from the lake, the harbor, and the lake. T-RFLP profiles consisted of relative peak height of TRFs. Open squares indicate Lake Superior samples (LS-MQH), solid black shapes indicate Duluth-Superior Harbor samples (DSH-DE, squares; DSH-OT, triangles; DSH-IN, circles), solid grey shapes indicate St. Louis River samples (SLR-CI, squares; SLR-BSL, circles), and open diamonds indicate artificial mixtures of lake and river water.
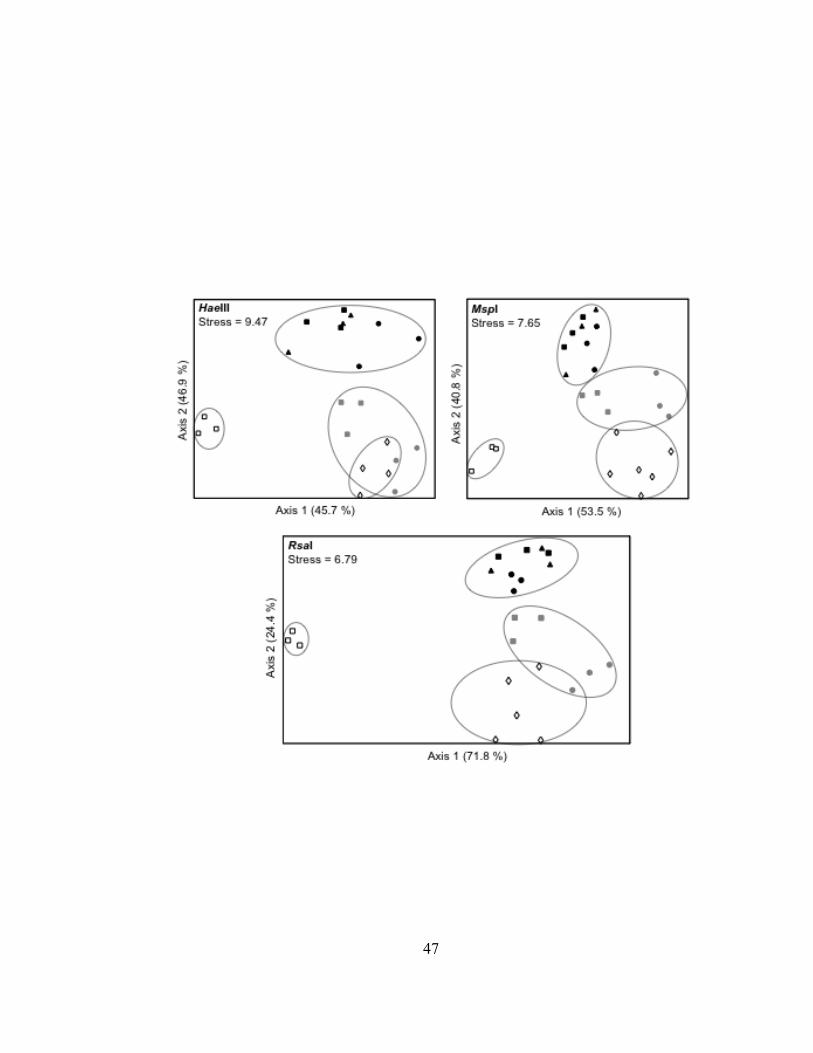
47

48
from the lake and river mixture samples were removed due to their poor quality. All the
T-RFLP profiles for the 20L/80R mixtures, regardless of restriction enzyme used, had
high noise signals and could not be used. One of the T-RFLP profile replicates of the
60L/40R mixture in each of the HaeIII and RsaI restriction enzyme digests were removed
due to low total signal or very few peaks and two replicate T-RFLP profiles of the
artificial community in the 60L/40R mixture for the HaeIII digest were removed due to
high noise signals. Only abundance data (RPH) was used for these ordination analyses
since solutions computed using presence-absence (PA) data resulted in final stress values
> 15.
The structure of the artificial bacterioplankton communities in the lake and river
water mixtures was most similar to the structure of bacterioplankton communities in the
St. Louis River in all three restriction enzyme digests as illustrated by the NMS
ordination plots of T-RFLP profiles constructed from TRF peak abundance data (Fig.
II.7). The first axis in all ordination plots separated bacterioplankton communities in
Lake Superior from those in the harbor, the river, and the lake and river water mixtures.
The second axis in all the ordination plots accounted for a significant percentage of the
variance in the distance matrices (24% to 47%) and placed bacterioplankton communities
from the lake and river water mixtures at the greatest distance from bacterioplankton
communities in the harbor. In the HaeIII dataset, the bacterioplankton communities in
the lake and river water mixtures appeared to group with bacterioplankton communities
from the St. Louis River, but in the MspI and RsaI datasets, the bacterioplankton
communities from the mixtures and the river formed separate but overlapping groups.
Ordination plots from all three restriction enzyme digests were determined to be ‘good
solutions’ (Final stress < 10) and produced stronger axes than would be expected by
chance (Monte Carlo stress test, 250 permutations, p < 0.01; Appendix Table A-6).
Relationships between the genetic structure of bacterioplankton communities and
environmental variables
The relationship between a number of abiotic and biotic factors and the genetic
structure of the bacterioplankton communities in the Duluth-Superior Harbor and the St.
49
Louis River was examined using nonmeteric multidimensional scaling (NMS) ordination
of T-RFLP profiles of abundance data and a joint-plot overlay of a second matrix
containing environmental variables (Figs. II.8 and II.9). Ordination plots from all three
restriction enzyme digests were determined to be ‘good solutions’ (Final stress < 10) and
produced stronger axes than would be expected by chance (Monte Carlo stress test, 250
permutations, p < 0.01; Appendix Table A-6). Temperature, DOC, and NH4+, were the
most influential environmental factors contributing to the variability in the
bacterioplankton community structure along the sample transect (Figs. II.8 and II.9). An
additional variable, NO3-, was correlated with differences in bacterioplankton community
structure when RsaI enzyme digests of bacterial DNA was used to construct T-RFLP
profiles. A number of relationships between environmental factors and ordination axes
were non-linear, so non-parametric Kendall’s tau rank correlation was used. In the
HaeIII and MspI datasets, temperature and DOC were positively correlated (tau > 0.6)
and NH4+ was negatively correlated (tau > 0.6) with axis 1 (Table II.4). In the RsaI
dataset, temperature and DOC were negatively correlated (tau > 0.9) and NH4+ was
positively correlated (tau > 0.7) with axis 2. In addition, NO3− was also positively
correlated with axis 2 (tau > 0.7) in the RsaI dataset. A complete table of correlations
with ordination axes can be viewed in the Appendix (Table A-7).
The Spearman’s rank correlation coefficient (ρ) was used to further examine the
relationship between the environmental variables measured in this study and the
bacterioplankton communities in the Duluth-Superior Harbor and the St. Louis River
water samples. SIMPER analysis was performed on both abundance (RPH) and
presence-absence (PA) datasets to identify TRFs that contributed the most to the
dissimilarity between the T-RFLP profiles of the bacterioplankton communities in the
harbor and river. When considering abundance data, many of the TRFs that contribute
the most to the dissimilarity between the harbor and the river bacterioplankton
communities were the most dominant TRFs in each restriction enzyme digest. The most
influential TRF in the abundance data from the HaeIII restriction enzyme digest (18.8%
contribution to dissimilarity) was positively correlated with NH4+ (𝜌 = 0.94, p < 0.01) and
was found in much greater abundance in the T-RFLP profiles of bacterioplankton
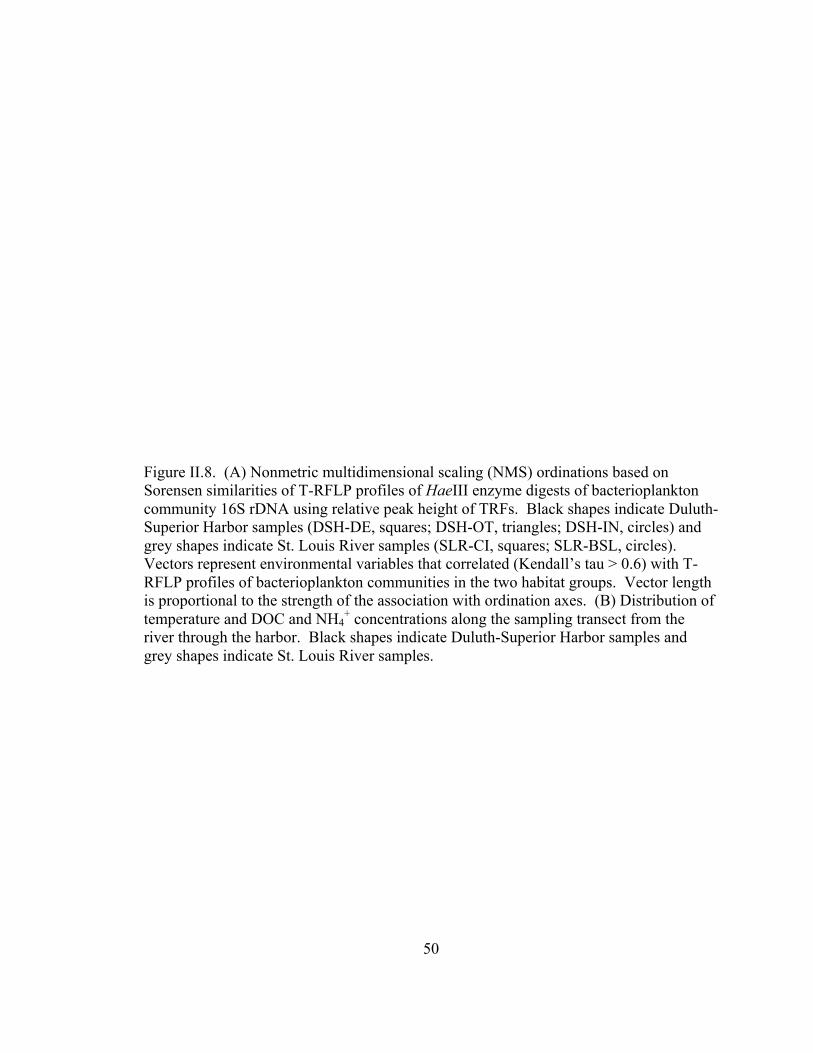
50
Figure II.8. (A) Nonmetric multidimensional scaling (NMS) ordinations based on Sorensen similarities of T-RFLP profiles of HaeIII enzyme digests of bacterioplankton community 16S rDNA using relative peak height of TRFs. Black shapes indicate Duluth-Superior Harbor samples (DSH-DE, squares; DSH-OT, triangles; DSH-IN, circles) and grey shapes indicate St. Louis River samples (SLR-CI, squares; SLR-BSL, circles). Vectors represent environmental variables that correlated (Kendall’s tau > 0.6) with T-RFLP profiles of bacterioplankton communities in the two habitat groups. Vector length is proportional to the strength of the association with ordination axes. (B) Distribution of temperature and DOC and NH4
+ concentrations along the sampling transect from the river through the harbor. Black shapes indicate Duluth-Superior Harbor samples and grey shapes indicate St. Louis River samples.
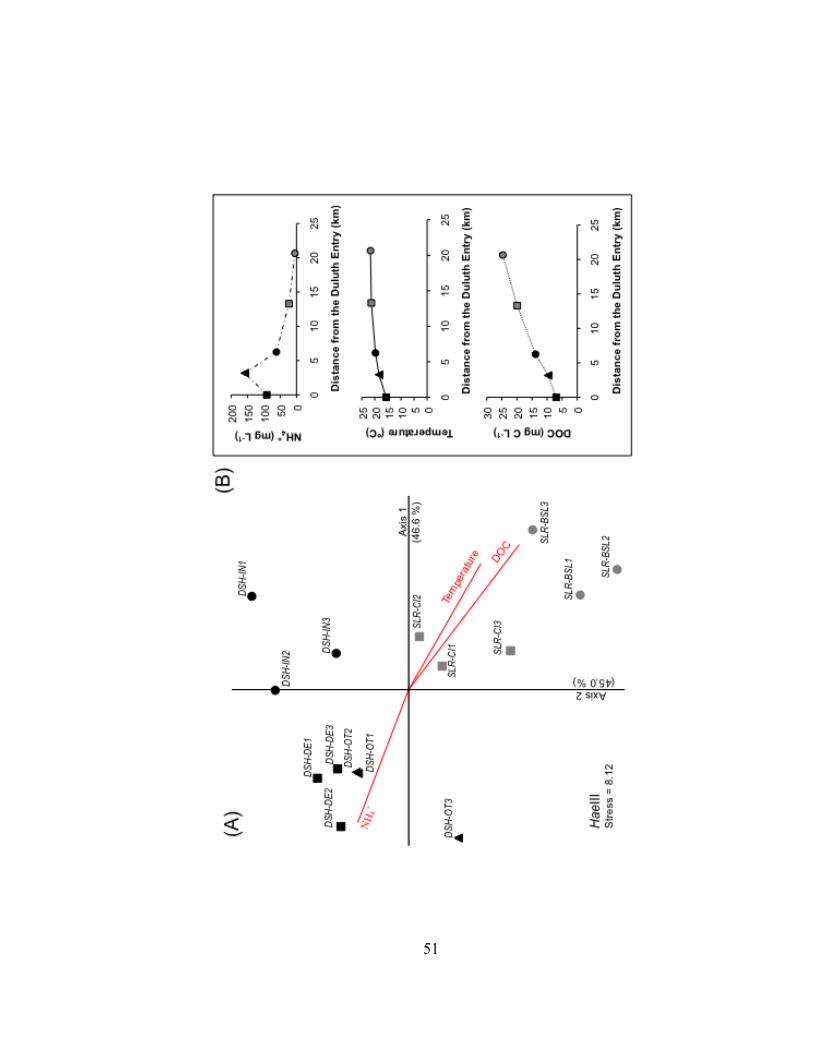
51
52
Figure II.9. Nonmetric multidimensional scaling (NMS) ordinations based on Sorensen similarities of T-RFLP profiles of MspI (A) and RsaI (B) enzyme digests of bacterioplankton community 16S rDNA using relative peak height of TRFs. Black shapes indicate Duluth-Superior Harbor samples (DSH-DE, squares; DSH-OT, triangles; DSH-IN, circles) and grey shapes indicate St. Louis River samples (SLR-CI, squares; SLR-BSL, circles). Vectors represent environmental variables that correlated (Kendall’s tau > 0.6) with T-RFLP profiles of bacterioplankton communities in the two habitat groups. Vector length is proportional to the strength of the association with ordination axes.
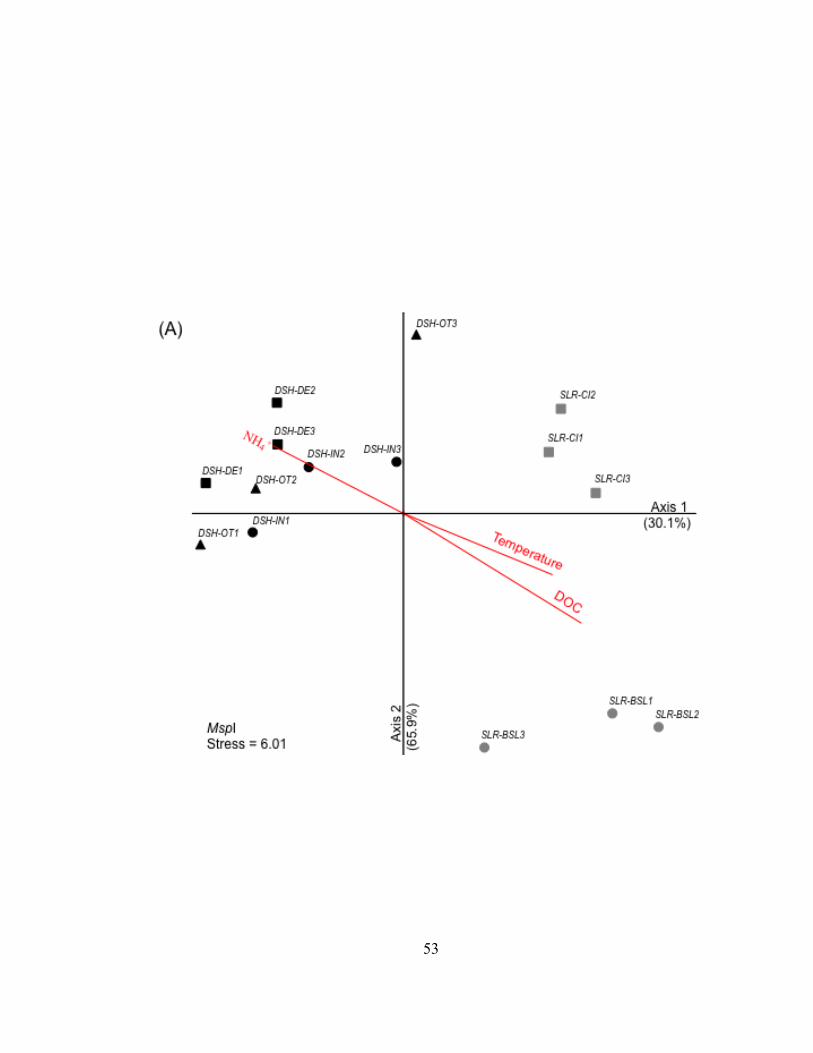
53
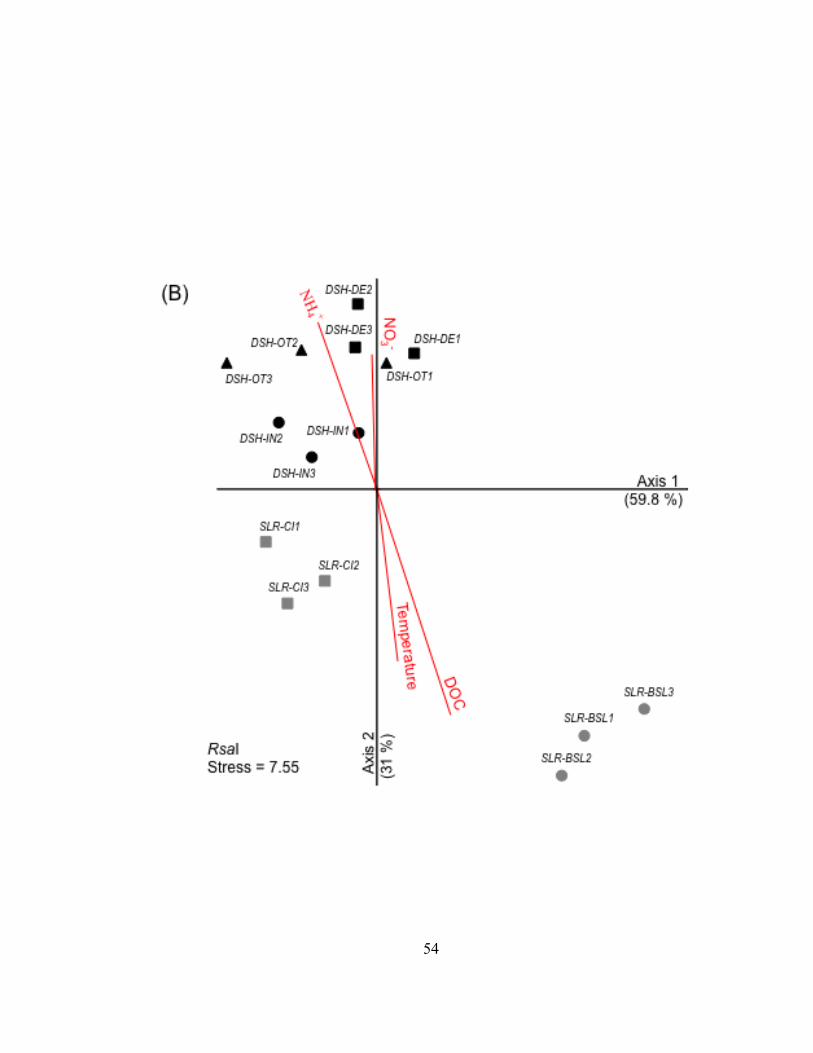
54
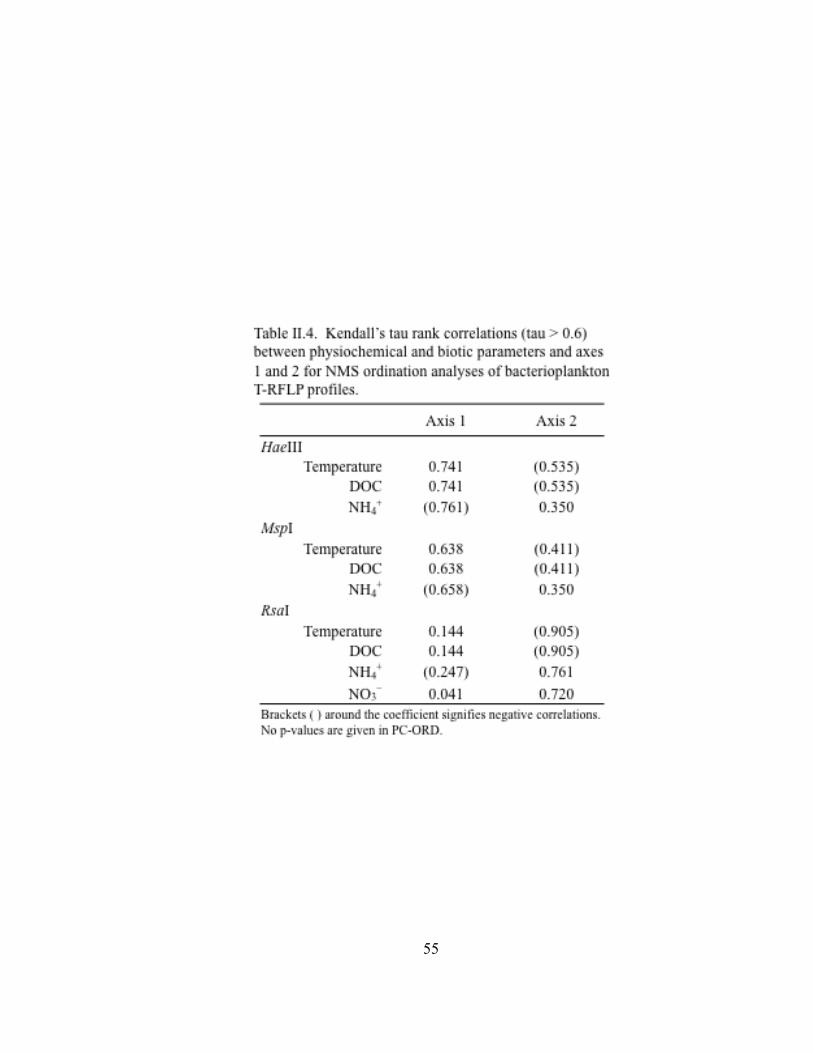
55
56
communities within the harbor than in either the lake or river habitats. Five of the ten
most influential TRFs in the same restriction enzyme digest were positively correlated
with temperature and DOC (𝜌 > 0.82, p < 0.05) and were responsible for 23.7% of the
dissimilarity between the harbor and river bacterioplankton community T-RFLP profiles.
One TRF in each of the HaeIII and RsaI restriction enzyme digests was positively
correlated with SRP (𝜌 > 0.82, p < 0.05). When considering presence-absence data, the
most influential TRFs in the T-RFLP profiles in the HaeIII, MspI, and RsaI restriction
enzyme digests were positively correlated with NH4+ (𝜌 = 0.88, p < 0.05; 𝜌 = 0.88, p <
0.05; 𝜌 = 0.94, p < 0.05; respectively) and these TRFs were only detected in the
bacterioplankton communities in the harbor samples.
DISCUSSION Analysis of the genetic structure of bacterioplankton communities along the
transect from the St. Louis River through the Duluth-Superior Harbor, and into Lake
Superior revealed three well-separated types of communities that were defined by their
location (Figs. II.3 and II.4). Bacterioplankton communities from the lake, harbor, and
river were comparably separated when either the abundance (relative peak height) or the
presence or absence of terminal restriction fragments (TRFs) were used to construct
community profiles. Abundance data typically reflects the more dominant members of a
community while presence-absence data enhances the effect of more rare members.
When either the most dominant or less dominant bacterial taxa were considered, the
bacterioplankton communities from the lake, harbor, and river habitats were determined
to be in separate groups (Table II.2). These comparisons indicate that the more abundant
bacterial taxa did not exclusively determine the separation of bacterioplankton
communities.
LaPara et al. (2011) reported comparable ordination patterns in a comparison of
bacterial community structure along a similar sample transect through the Duluth-
Superior Harbor using NMS ordination analysis of automatic ribosomal intergenic spacer
57
analysis (ARISA) profiles. However, it was not determined in this study whether the
ARISA profiles of the bacterial communities in Lake Superior, the Duluth-Superior
Harbor, and the St. Louis River formed separate, statistically significant groups.
The most abundant bacterial taxa in the bacterioplankton communities from the
lake, harbor, and river habitats were also widely distributed. This finding is consistent
with other studies that relate bacterial taxa distribution and abundance (Pommer et al.
2007, Nemergut et al. 2011). The higher abundance of a few bacterial groups may lead
to their more widespread dispersal (Fenchel and Finlay 2004, Nemergut et al. 2011),
whereas more rare bacterial groups may even be dispersal limited (Bell 2010). However,
an important point to consider is the potential bias of many commonly used molecular
techniques. Molecular community profiling methods, such as T-RFLP, that are based on
PCR amplification using universal primers may preferentially detect more dominant
groups (i.e., ≧ 1% of the total cell number) while the more rare groups (i.e., < 1%)
remain undetected (Pedrós-Alió 2006, Blackwood et al. 2007). Populations of rare
microbes can be major contributors to the overall diversity in microbial communities.
Nevertheless, other researchers have proposed that bacterial groups most important in
energy flow and carbon and nutrient cycling (e.g. ammonia oxidizers) may be the more
abundant groups (Pedrós-Alió 2006, Ward and O’Mullan 2002).
Nearly 40% of the bacterial taxa detected in the Duluth-Superior Harbor
bacterioplankton communities were also detected in both Lake Superior and the St. Louis
River communities (Fig. II.5). This pattern of overlapping bacterial communities across
spatial gradients has been previously observed. The mixing zone at the confluence of a
river and a lake or ocean creates a unique environment where bacterial communities will
contain members of both source waters (Crump et al. 1999, 2004; Alonso et al. 2010). In
the Columbia River estuary, Crump et al. (1999) detected both marine groups (SAR11 in
Alphaproteobacteria) and freshwater groups (Betaproteobacteria and Verrucomicrobium
spp.) in free-living bacterioplankton. In the Milwaukee harbor, bacterial communities
reflected a mixture of bacterioplankton groups from both Lake Michigan and a number
its tributaries (Mueller-Spitz et al. 2009).
58
However, nearly one-third of the bacterial taxa detected in the harbor
bacterioplankton communities were not detected in either the lake or river communities
(Fig. II.5). These unique bacterial taxa in the harbor may have been introduced into the
harbor from sources other than the lake or river or they may have been present in the
bacterioplankton communities of the lake or the river samples in very low numbers, but
had increased in abundance when exposed to the abiotic or biotic conditions in the
Duluth-Superior Harbor. Overall, the abundance of bacterial taxa contributed more to the
differences between the structure of the harbor and river bacterioplankton communities
than between the structure of either the lake and harbor or the lake and river communities
(Fig. II.4, Table II.2). Stortz and Sydor (1980) estimated the residence time of a
dissolved pollutant entering the inner harbor over the course of 8 hours to be between 30
and 40 days. This long residence time combined with normal bacterial growth rates may
allow different bacterioplankton populations to proliferate within the harbor.
The St. Louis River and Lake Superior are the major natural sources of bacteria
influencing the genetic structure of bacterioplankton communities detected in the Duluth-
Superior Harbor. Overall, the prokaryotic cell abundance increased from Lake Superior
to the St. Louis River (0.74 to 2.99 x 10⁹ cells L-1, respectively). The low prokaryotic
cell abundance in Lake Superior determined in this study was similar to findings of
previous studies (Auer and Powell 2004, Hicks et al. 2004). Other natural sources of
bacteria that may influence the bacterioplankton community structure in the harbor
include soil bacteria from surface water run-off, sloughing of benthic biofilms, and
hyporheic sediments in the mixing zone of shallow groundwater and surface water
(Crump et al. 2007, Febria et al. 2010). The SUVA254 values for Lake Superior (3.3) and
the St. Louis River (8.9) were similar to those reported by Minor and Stephens (2008; 1.3
and 8.4 respectively) but the highest SUVA254 value was observed at the river site in
Pokegama Bay (SLR-CI, Fig. II.1). The Pokegama River watershed is predominantly
forested and has its headwaters in an extensive system of red clay wetlands. Ågren et al.
(2008) detected higher SUVA254 levels from wetland sources than forest runoff alone,
which may account for the elevated SUVA254 value at the SLR-CI site. The high
SUVA254 value at this site suggests that wetland dissolved organic matter (DOM) could
59
be reaching the harbor from this St. Louis River tributary. In addition, the Pokegama
River can be turbid and contain suspended clays transported from the Pokegama wetlands
(Johnston et al. 2001). Irvine et al. (2002) found a strong positive relationship between
bacteria and suspended solids. Similarly, prokaryotic cell abundance and turbidity were
positively correlated in this study (Appendix Table A-1). So, bacteria from wetlands in
this watershed may have entered the harbor and contributed to the differences in the
bacterioplankton communities observed in the harbor samples when compared to the
Lake Superior and the upper St. Louis River samples.
The two principal anthropogenic sources of bacteria to the Duluth-Superior
Harbor are treated wastewater effluent discharged into the inner harbor and ballast water
discharged into both the inner and outer harbors. Inflow and infiltration of water into the
sanitary sewer system during heavy rainstorms or snowmelt can cause sanitary sewer
overflows resulting in increased nutrients, bacteria, and suspended solids in storm water
run-off. Ballast water can contain freshwater and marine bacterioplankton and bacteria
associated with suspended sediments. Residual water and sediments in a ships’ ballast
tank can also be a source of bacteria to the harbor. In a ship’s ballast tank, a portion of
the ballast water and sediments (residuals) remain after ballast water discharge and is
considered ‘unpumpable.’ These sediments can then be resuspended and partially
discharged during subsequent ballast water management practices (Bailey et al. 2003).
Drake et al. (2005) reported an estimated 6.8 x 10¹⁴ bacterial cells detected in the
residuals of a ships’ ballast tank. In 2005, an estimated 5 billion gallons of ballast water
was discharged into the Duluth-Superior Harbor (MPCA 2008). Using the estimated
range of bacterial cells in ballast water reported by Sun et al. (2010; 2.5 x 10⁸ to 2.1 x 10⁹
cells L-1), 4.7 x 10¹⁸ to 4.0 x 10¹⁹ bacterial cells could potentially be discharged into the
DSH annually.
In the artificial community experiment, the T-RFLP profiles of bacterioplankton
assemblages in all the lake and river water mixtures were most similar to the T-RFLP
profiles of bacterioplankton communities from the St. Louis River (Fig. II.7), but the
estimated location of two of the lake and river water mixtures, based on the DOC
concentrations, were in the harbor (Fig. II.6). These results may indicate that the
60
bacterioplankton communities in the harbor are not simple mixtures of bacterioplankton
from Lake Superior and the St. Louis River, but they may also be due to an artifact of the
T-RFLP analysis or the effect of photodegradation on DOC concentrations. During the
PCR procedure on the artificial bacterioplankton assemblages, a greater number of 16S
rDNA sequences from the river water than from the lake water may have been amplified
due to the higher prokaryotic cell abundance in the river water sample when compared to
the lake water sample (Table II.1). As a result, a larger fraction of the PCR products used
in the T-RFLP analysis of the lake and river water mixtures were of river origin allowing
more TRFs from the river water sample to be raised to detectable levels. Consequently,
the genetic structure of the artificial bacterioplankton assemblages would be most similar
to the structure of the bacterioplankton communities from the St. Louis River.
When exposed to UV radiation, dissolved organic matter (DOM) is subject to
photodegradation resulting in decreased DOC concentration and changes in optical
characteristics such as reduced aromaticity, i.e., lower SUVA254 values, and increased
spectral slope (De Haan 1993, Brinkmann et al. 2003, Biddanda and Cotner 2003, Minor
and Stephens 2008). In this study, a loss of DOC due to photodegradation in the surface
water along the sample transect would cause an underestimation of the distance from the
Duluth Entry that was determined for each of the artificial lake and river water mixtures.
The SUVA254 values and spectral slope (S250-400) values calculated for this study were
consistent with those previously described for Lake Superior and a number of its
tributaries (Minor and Stephens 2008). The SUVA254 value was lower in Lake Superior
than in the harbor or river and the spectral slope (S250-400) value was higher in Lake
Superior than in the harbor or the river. The decrease in SUVA254 values and increase in
spectral slope (S250-400) values along the sample transect through the harbor is consistent
with changes due to photodegradation. However, it could not be determined by data
collected in this study whether the changes in optical characteristics in the DOC along the
sample transect was due to photodegradation or simple dilution from seiche activity, the
effects of microbial activity, or other abiotic or biotic conditions.
The potential influence of various environmental variables on the genetic
structure of bacterioplankton communities in the Duluth-Superior Harbor and the St.

61
Louis River was examined in this study. The structure and composition of aquatic
bacterioplankton communities can be influenced by temperature (Yannerall and Triplett
2005), pH (Fierer et al. 2007), DOC concentrations (Methe and Zehr 1999, Judd et al.
2006), nutrient concentrations (Bell et al. 1982, Pace and Funk 1991, Carlsson and Caron
2001), and primary productivity (Horner-Devine et al. 2003). The results from NMS
ordination analyses indicated temperature, dissolved organic carbon (DOC), ammonium
(NH4+), and nitrate (NO3
−) were more highly correlated with differences in the genetic
structure of bacterioplankton communities along the transect from the river through the
harbor than the other environmental variables measured in this study. The structure of
the bacterioplankton communities from the river is associated with high water
temperature and DOC concentration while bacterioplankton communities in the harbor
were related to the higher NH4+ and NO3
− concentrations detected within the harbor
(Table II.1, Figs. II.8 and II.9).
Surface water temperatures along the sample transect gradually decreased as the
warm water of the St. Louis River mixed with the cool water of Lake Superior (Fig. II.2).
The further extension of the warmer upper layer into the water column at the inner harbor
site (DSH-IN) when compared to the other field sites may have been due to the additional
heat load from the treated wastewater effluent discharged near the site. The average
temperature for WLSSD wastewater effluent in September 2009 was 34.9ºC (Tuominen,
personal comm.). Even with a warmer layer of water in the upper portions of the water
column at all sites within the harbor and river, differences in the specific conductivity at
various depths were minimal indicating sufficient mixing at the field sites. Lake water
influence was more evident at the Duluth Entry (DSH-DE) and in the outer harbor (DSH-
OT) where reduction in specific conductivity recorded at a depth of four to five meters
coincided with the decrease in water temperatures. Schroeder and Collier (1966)
describe a similar phenomenon at the mouth of the Cuyahoga River at Cleveland, Ohio
where warmer river waters with higher conductivity flowed over cooler lake water with
lower conductivity. Numerous studies report the broad effects of temperature on
bacterial communities including effects on abundance, growth rates, and productivity in
62
addition to community structure and composition (Shiah and Ducklow 1994, Yannarell
and Triplett 2004, Kan et al. 2006, Crump and Hobbie 2005).
The low DOC concentration in Lake Superior and the higher DOC concentrations
measured in the St. Louis River (Table II.1) were similar to those previously reported for
Lake Superior and some of its tributaries (Hicks et al. 2004, Minor and Stephens 2008).
Changes in the composition or supply of DOM, for example during low flow conditions
or storm events, can affect bacterial productivity, growth rates, and influence taxonomic
shifts in bacterial communities (Judd et al. 2006, Cottrell and Kirchman 2000, Kritzberg
et al. 2006, Jones et al. 2009, Fierer et al. 2007, Kirchman and Rich 1997).
The abundance of a number of the dominant bacterial taxa of bacterial
communities in the harbor and river were strongly influenced by gradients in temperature
and DOC. In the HaeIII restriction enzyme digest, both the abundance and presence of
one dominant fragment (TRF69) positively correlated with temperature and DOC and
contributed to differences between the structure of the bacterial communities in the
harbor and river (SIMPER). The TRF69 fragment was two times more abundant in the
inner harbor (DSH-IN) than in either of the river sites and in very low abundance in the
other harbor sites. The higher abundance of TRF69 in the inner harbor than in the river
suggests that there was adequate residence time within the inner harbor for the TRF69
bacterial population to respond to the different conditions found in the harbor.
The concentration of NO3− was highest in Lake Superior and gradually declined
through the Duluth-Superior Harbor and into the St. Louis River (Table II.1). Lake
Superior is considered to be an oligotrophic lake (Biddanda et al. 2001) and is
characterized by high nitrate and low phosphorus concentrations (Sterner 2011). Lake
Superior may have been the source of elevated NO3− concentrations at the Duluth Entry
(DSH-DE) and outer harbor (DSH-OT). During the summer months, increased levels of
NO3−, at the lower portions of Lost Creek Wetlands (Wisconsin), was attributed to Lake
Superior seiche activity (Morrice et al. 2004).
Ammonium (NH4+) and soluble reactive phosphorus (SRP) concentrations were
higher within the harbor when compared with concentrations in the lake or the upper
river (Table II.1). Concentrations of NH4+ and SRP at the lower river site (SLR-CI) may

63
have been influenced by the Pokegama River discharge. Johnston et al. (2001) detected
higher NH4+ and SRP concentrations in fall surface water samples at the Pokegama
Wetland, on the Pokegama River, than at the Fon du Lac Wetland, on the main stem of
the St. Louis River. The concentration of NH4+ in the outer harbor (DSH-OT) was 30
times higher than the concentration detected at the upper-most river site (SLR-BSL).
Although mechanisms that caused differences in bacterioplankton community structure
between the river, harbor, and lake could not be determined, bacterioplankton abundance
and growth rates are known to increase in response to elevated inorganic nutrient
concentrations from other studies (Pace and Funk 1991, Carlsson and Caron 2001).
The abundance of the bacterial taxa whose presence or absence contributed the
most to the dissimilarity between the harbor and river bacterioplankton communities, in
each of the three restriction enzyme digests, positively correlated with NH4+ and was only
detected in the harbor samples. The most dominant TRF in the T-RFLP profiles from the
HaeIII restriction enzyme digest positively correlated with NH4+ and was over two-fold
more abundant in the harbor than in either the river or lake. It is unknown whether
specific bacterial groups were responding to the high concentrations of NH4+ in the
harbor, but Bell et al. (1982) found NH4+ to be the most influential physicochemical
parameter measured in two Canadian rivers that correlated with bacterial diversity.
Sediment resuspension may have been a source of NH4+ and SRP to the water
column in the Duluth-Superior Harbor. Sediments are resuspended in the harbor due to
lake induced seiche oscillations, ship traffic, and the periodic maintenance of shipping
channels by dredging (Stortz and Sydor 1980). Erdmann et al. (1994) found a 47-fold
increase in suspended solids in the water column immediately following the passage of a
ship. During re-suspension of sediments, NH4+ and SRP can be released to the water
column (Simon 1989, Reddy et al. 1996). Once in the water column, NH4+ is desorbed
and rapidly oxidized to NO3− through nitrification or assimilated by microorganisms. In
a similar manner, following re-suspension of sediments, SRP is released into the water
column where it is readily taken-up by microorganisms or re-adsorbs to particles (House
et al. 1998, Lijklema 1980, Zhang and Huang 2007). Retention of nutrients in sediments
64
is a function of both residence time and biotic demand (Morrice et al. 2004, Brookshire et
al. 2005).
A major natural source of NH4+ in aquatic sediments is from microbial
degradation of organic matter (Blackburn and Henriksen 1983). Another source is the
reduction of NO3− to NH4
+ or dissimilatory nitrate reduction to ammonium (DNRA) that
may be significant in some aquatic systems (Gardner et al. 2006). Ammonium (NH4+)
readily adsorbs to particles and is the dominant nitrogen form in anoxic sediments
(Forsberg and Ryding 1979). In a river system, only small amounts of phosphorus are
from natural sources such as riparian vegetation (Meyer and Likens, 1979), the
weathering of soil parent material, and the atmosphere (Holton et al. 1988).
Anthropogenic sources such as agriculture and urban surface run-off, and other point
sources often contribute a greater proportion of the phosphorus-load to an aquatic system
(Withers and Jarvie 2008). Treated wastewater effluent is considered to be a major
anthropogenic source of nutrients to aquatic systems (USGS 2006, Millier and Hooda
2011). The WLSSD treated wastewater effluent is discharged into the inner harbor in
close proximity to the inner harbor site (DSH-IN) and just upstream from the outer harbor
site (DSH-OT).
The turbidity levels were highest at the upper-most river site (SLR-BSL) and at
the inner harbor site (DSH-IN). During a two-year study, TenEyck and Branstrator
(unpublished data) detected higher turbidity levels in the inner and outer portions of the
Duluth-Superior Harbor compared to turbidity levels in the St. Louis River. The St.
Louis River and its tributaries are a major source of suspended solids including eroded
soils (e.g. red clay), particulate organic matter, and re-suspended sediments most of
which is deposited within the harbor itself (Bahnick and Markee 1985). Other sources of
suspended solids into the harbor include treated wastewater effluent, storm-water runoff,
and sediments released when ballast water is discharged (Klarer and Millie 1994, Villac
and Kaczmarska 2011).
In addition to releasing nutrients, resuspended sediments can release bacteria
(Pettibone 1996). Pettibone et al. (1996) reported a ten-fold increase in bacteria cell
counts in the water column following the passage of a 195.7-m bulk cargo vessel in the
65
Buffalo River (New York). Suspended particulate matter can provide surface areas for
colonization by bacteria, and particle-associated bacterial populations can be
fundamentally different from communities of free-living bacterioplankton (Crump et al.
1999, DeLong 1993).
Methodological considerations
There are a number of pitfalls and biases associated with molecular profiling
techniques based on PCR amplification that should be mentioned at this point.
Preferential cell disruption (Wintzingerode et al. 1997) and variable results between
different DNA extraction procedures (Luna et al. 2006) can affect the original DNA
template used in PCR methods. Biases associated with the PCR procedures include PCR
inhibition due to organic matter, clay particles, and humic acids (Kirk et al. 2004, Tebbe
and Vahjen 1993), primer hybridization efficiency and specificity (Brunk et al. 1996,
Rainey et al. 1994), preferential amplification (Reysenbach et al. 1992), random events
occurring in early PCR cycles (e.g. PCR drift; Polz and Cavanaugh 1998), amplification
of contaminant DNA (Wintzingerode et al. 1997), and formation of chimeric DNA due to
competition for primer or as a result of DNA damage during rigorous cell lysis (Pääbo et
al. 1990, Wintzingerode et al. 1997). In the T-RFLP method, erroneous results can also
occur due to incomplete or non-specific restriction (Marsh 2000). Other factors affecting
T-RFLP analyses include effects on electrophoretic mobility by different dye labels, the
purine content of PCR amplicons, and interference of shorter fragments by larger
fragments in capillary electrophoresis (Kaplan and Kitts 2003, Schütte 2008, Danovaro et
al. 2006). Despite these pitfalls and biases, the size and fluorescence signal of individual
TRFs are highly reproducible making T-RFLP a widely used, reliable and robust tool for
rapid comparisons of microbial communities (Osborn et al. 2000, Blackwood et al. 2003,
Schütte 2008). The similar results obtained for replicates in this study supports these
findings.
66
Conclusion
Three distinct bacterioplankton communities representative of Lake Superior, the
Duluth-Superior Harbor, and the St. Louis River habitats were detected in water samples
collected on one day in early September 2009. The genetic structure of the
bacterioplankton community did not transition gradually from the St. Louis River,
through the Duluth-Superior Harbor, and into Lake Superior as it might be expected to if
the harbor communities were merely mixtures of bacterioplankton from the river and
lake. Differences in the abundance of bacterial groups played a prominent role in the
dissimilarity between the harbor and the river bacterioplankton communities. Although
the exact mechanism(s) responsible for the differences detected in the genetic structure of
the bacterioplankton communities in the Duluth-Superior Harbor and the St. Louis River
could not be determined with the data collected in this study, it is clear that the structure
of these communities was related to differences in the chemical and physical parameters
found in these habitats. It is important to realize that a small number of sites were
sampled on one late summer day in this study, and so it does not constitute a thorough
analysis of bacterioplankton communities in Lake Superior, the Duluth-Superior Harbor,
or the St. Louis River. However, the results from this study were consistent with findings
of other investigations that distinct bacterioplankton communities can be found in
estuarine mixing zones.
67
CHAPTER III
Comparison of Bacterioplankton Communities in the Ballast Water of Commercial Ships, Treated Wastewater Effluent,
and the Duluth-Superior Harbor
INTRODUCTION The spread and establishment of aquatic nonindigenous species (NIS) via ballast
water transport is of concern worldwide (IMO 2008). Ballast water is taken on-board
ships for the purpose of stability during a voyage and discharged in port when loading
cargo and possibly en route to reduce a vessels draft in shallow waters (Carlton et al.
1995, Grigorovich et al. 2003). In addition, commercial ships exchange ballast water
taken up in coastal waters with mid-ocean water before entering the Great Lakes-St.
Lawrence Seaway to fulfill ballast water management requirements designed to mitigate
the spread of aquatic NIS (IMO 2004; Federal Register 1999). An estimated 3 to 5
billion metric tons (Mt) of ballast water is transported globally each year (IMO 2008).
The concern for the transport of potentially invasive microbes in ballast water is due to
their high abundance in aquatic habitats, their potential for pathogenicity and toxicity,
and the ability of some bacteria to enter a reversible dormant state in stress environments
(Ruiz et al. 2000, Drake et al. 2007, Dolan 2005). Dormant pathogens may be resistant to
antibiotics since antimicrobial agents usually target actively growing cells (Jones and
Lennon 2010). High growth rates, efficient resource utilization, and small size
facilitating dispersal are additional traits that can contribute to the survival and
establishment of microorganisms in a new environment (Litchman 2010, Ruiz et al.
2000).
An important factor determining the successful establishment of an invasive
species is propagule pressure, that is, the abundance of non-native organisms introduced
to a new environment and the frequency of introduction events (Lockwood et al. 2005,
Wonham et al. 2000). Microbial abundance in ballast water can be used as a proxy for
propagule pressure while ballast water discharge volume and shipping traffic patterns are
used to estimate the frequency of inoculation (Drake et al. 2007). In addition to the

68
abundance of organisms being introduced, invasion pressure includes the diversity and
species richness of organisms discharged in ballast water (Smith et al. 1999, Jousset et al.
2011).
The majority of the studies on prokaryotic organisms in ballast water have
focused on abundance. Burkholder et al. (2007) found bacterial abundance was unrelated
to vessel type, exchange status, or age of water. A number of studies also reported no
differences in bacterial abundance between exchanged and un-exchanged ballast water at
the end of a voyage though some studies detected changes in bacterial abundance during
the voyage (Drake et al. 2007, Drake et al. 2002, Seiden et al. 2010). Tomaru et al.
(2010) detected a significant decrease in bacterial cell abundance following mid-ocean
exchange (MOE). Bacterial cell abundance has also been compared among habitats
within the ballast tank, i.e., ballast water, residual water and sediments, and biofilms on
internal structures of ballast tanks (Drake et al. 2007). Other studies have estimated the
abundance of specific target organisms such as enteric bacteria (i.e., E. coli, V. cholerae,
enterococci; Ruiz et al. 2000, Aquirre-Macedo et al. 2008, Joachimsthal et al. 2004,
Ivanov 2006, Burkholder et al. 2007), human pathogenic bacteria (i.e., Listeria
monocytogenes, Mycobacterium spp., Pseudomonas aeruginosa; Burkholder et al. 2007),
toxic Cyanobacteria (Doblin et al. 2002), or bacteria associated with coral disease (i.e.,
Serratia marcescens, and Sphingomona spp.; Aquirre-Macedo et al. 2008).
Only a few studies have explored the structure and composition of bacterial
communities in ballast water and compared these communities to those in the waters of
recipient ports. For example, Tomaru et al. (2010) used denaturing gradient gel
electrophoresis (DGGE) to detect changes in bacterial community structure before and
after mid-ocean exchange and Ma et al. (2009) used restriction fragment length
polymorphism (RFLP) and 16S rDNA sequencing to compare 65 clones developed from
bacterioplankton communities in ballast water collected from one ship and bacterial
communities in local seawater.
The international port in the Duluth-Superior Harbor receives more ballast water
discharge from commercial ships than any other port in the Great Lakes (U.S. EPA 2008)
and is considered to be in one of four invasion ‘hotspots’ within the Laurentian Great
69
Lakes (Grigorovich et al. 2003). Bacterial populations from treated wastewater are also
discharged into the harbor by the Western Lake Superior Sanitary District (WLSSD)
tertiary treatment plant at a rate of approximately 40 million gallons a day (MGD).
Bacteria introduced with wastewater effluent can have a significant influence on the
bacterial community structure in the receiving waters (Wakelin et al. 2008).
The overall goal of this study was to compare the genetic structure of
bacterioplankton communities from ballast water and treated wastewater with natural
communities in the Duluth-Superior Harbor. First, the community structure of
bacterioplankton collected from these water sources was compared using terminal
restriction fragment length polymorphism (T-RFLP) analysis, a genetic fingerprinting
technique. Then, four 16S rRNA gene clone libraries were created for three ballast water
samples and one harbor water sample to compare the composition of the bacterioplankton
communities. Finally, the DNA sequences from the four clone libraries were examined
to identify DNA sequences associated with known human or animal pathogens.
METHODS Study location
The Duluth-Superior Harbor (DSH) is located on the western arm of Lake
Superior and is a major industrial shipping port with an estimated 27 km of maintained
shipping channels. The hydrology of the DSH is affected by the inflow of two rivers, two
outflow channels, Lake Superior seiche oscillations, and a counter-clockwise current that
flows along the Lake Superior shore. The St. Louis River (mean annual discharge of 56
m3 sec-1; Mitton et al., 1994) flows through the St. Louis River estuary, enters the harbor
at St. Louis Bay, and then discharges into Lake Superior primarily through the Duluth
shipping channel (Duluth Entry). The Nemadji River (mean annual discharge of 11 m3
sec-1; MPCA /WDNR, 1992) enters the harbor at the eastern end of Superior Bay
adjacent to Allouez Bay and then discharges into Lake Superior primarily through the
Superior shipping channel (Superior Entry). Lake Superior seiche amplitudes entering
the DSH typically range from 3.0 to 15 cm with fundamental and minor periodic
70
oscillations every 7.9 and 2.1 hours, respectively (Sydor and Stortz, 1980, Jordan et al.
1981).
Water samples for bacterioplankton community analyses
Between July 2009 and November 2009, ballast water samples were collected
from ten commercial vessels at seven different dock locations in the DSH in cooperation
with the Minnesota Pollution Control Agency (MPCA) during routine activities including
loading cargo, unloading cargo, deballasting or refueling (Fig. III.1). Ballast water was
collected from a ballast tank of six transoceanic vessels and four lake freighters (Table
III.1). Only two seawater ballast samples were collected from the transoceanic vessels.
These vessels had each undergone mid-ocean exchange (MOE) of their ballast water
approximately two weeks before entering the DSH. Ballast tanks that were sampled were
chosen based on their proximity to the dock where the ship was berthed, depth of ballast
water within the tank, ease of access to the tank, and the origin of the ballast water.
Three replicate water samples were collected in pre-rinsed, 20-L plastic carboys from the
ballast tank by using a length of 0.5” polyethylene siphon tubing lowered through a
sounding tube located on the deck of the ship. Ballast water was collected from Ship 6
(FWB6) with a ballast pump during active ballast water discharge because of the low
volume of water in the ballast tank. Harbor surface water adjacent to the dock (dockside)
was collected using a pre-rinsed 3-gallon plastic container either before or immediately
after ballast water was sampled. On October 30, 2009, three replicate treated wastewater
effluent samples were collected in 20-L plastic carboys at the Western Lake Superior
Sanitary District wastewater treatment plant (Duluth, MN) from an outgoing pipe spigot.
Water was collected from two regions, in the DSH, near dock areas where ballast
water is routinely discharged by commercial ships. On September 3, 2009, three
replicate near-surface water samples were collected in 20-L plastic carboys in the outer
harbor (DSH-OT, 46°45.64' N; 92°05.59' W) at the eastern end of Superior Bay near the
Murphy Oil Marine Terminal Berth 3 and in the inner harbor (DSH-IN, 46°44.69' N;
92°06.96' W) in St. Louis Bay near Superior Midwest Energy Terminal (St. Louis Bay;
Fig. III.1). All carboys were rinsed with harbor water prior to collecting samples. No

71
Figure III.1. Map of Duluth-Superior Harbor. Letters indicate locations of harbor sample sites. Encircled ‘A ’indicates the inner harbor site (DSH-IN) and encircled ‘B’ indicates the outer harbor site (DSH-OT). Black circles indicate docks where ballast water samples were collected. Murphy Oil, Terminal Berth 3-Murphy Oil Marine Terminal; CHS, CHS No. 1; Peavey, Peavey Conner's Point Elevator; General Mills-Superior, General Mills Superior Elevators S & X; Midwest Energy, Midwest Energy Resources Co.-Superior Midwest Energy Terminal; CN/DMIR, CN Dock 6.
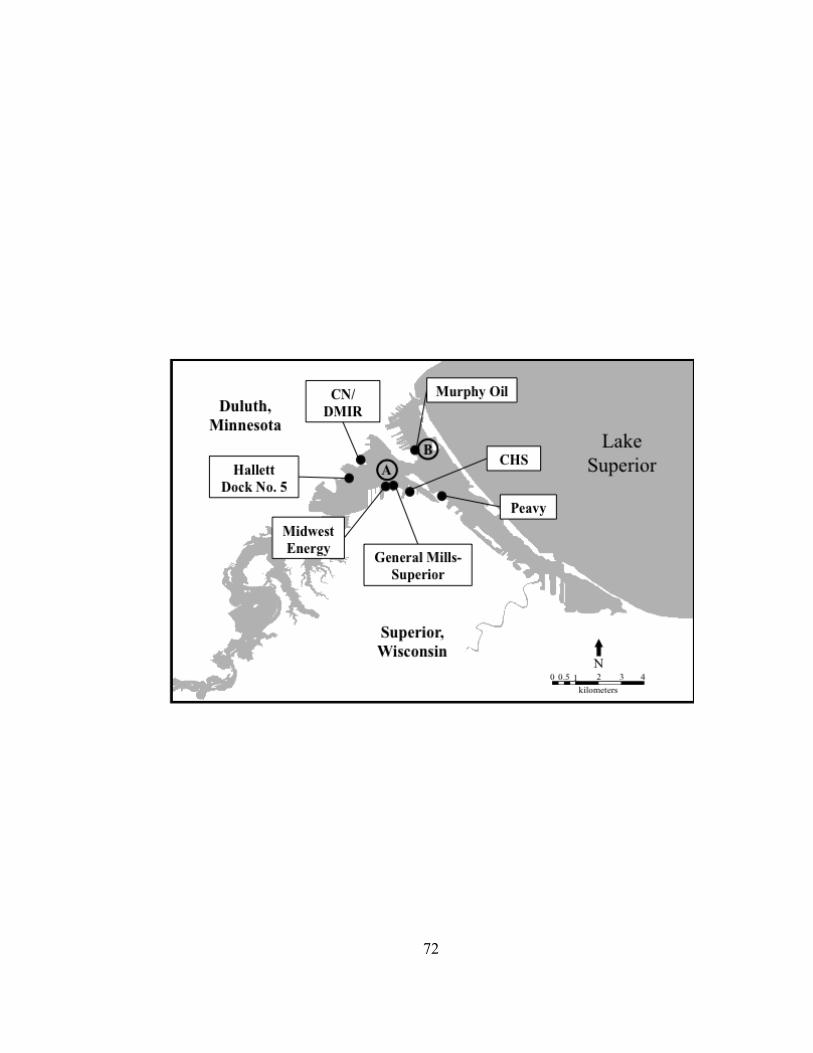
72

73
74
rain occurred within 48 hours prior to sampling. All ballast water, treated wastewater,
and harbor water samples were transported to the lab within hours of collection, stored at
4°C and processed the same day.
Prokaryotic cell abundance
A portion of each water sample was preserved with 37% formaldehyde (pre-
filtered through 0.22 µm pore filter; 2% final concentration) and stored in the dark at 4°C
for up to 2 weeks. A small portion of each preserved sample was placed on a black
polycarbonate filter (25 mm dia., 0.22 µm pore; GE Water & Process Technologies,
Trevose, PA). The DNA in cells was stained with 4’6-diamidino-2-phenylindole (DAPI;
10 µM final concentration), filtered onto the membrane filter, and prokaryotic cells (i.e.,
cells with no visible nucleus) were counted using a Nikon Eclipse 80i epifluorescence
microscope (Porter and Feig 1980).
Bacterioplankton community analyses
Total DNA extraction – Microbial cells in water samples were collected onto
Duropore® membrane filters (142 mm dia., 0.22 µm pore; Millipore, Billerica, MA) by
N2 gas pressure filtration at <40 psi until the filters clogged (i.e., filtrate flow was
substantially reduced). Individual membrane filters were folded and stored in Whirl-
Pak® bags (Nasco, Fort Atkinson, WI) at -80°C. Frozen filters were crushed in the
Whirl-Pak® bags before a one-eighth portion (by weight) was removed for DNA
extraction. A MoBio PowerSoil® DNA Isolation Kit (MoBio Laboratories, Inc.,
Carlsbad, CA) was used for all DNA extractions. Extracted DNA was stored in sterile
elution buffer (10 mM Tris) at -80°C until used for molecular analyses.
Polymerase chain reaction (PCR) – The bacterial 16S rRNA gene was amplified
from 40 ng of extracted DNA as a template with illustra™ puReTaq Ready-To-Go PCR
Beads (GE Healthcare, Piscataway, NJ) using the bacterial specific primer 27F (5’-
AGAGTTTGATCMTGGCTCAG-3’; Lane 1991), and the universal primer 1492R (5’-
TACGGYTACCTTGTTACGACTT-3’; Lane 1991; Integrated DNA Technologies,
Coralville, IA). The 27F primer was 5’ end labeled with 6-carboxyfluorescein (6-FAM).
75
When reconstituted to a 25 µl volume, each PCR bead tube contained ~ 2.5 units of
puReTaq DNA polymerase, 200 µM each dNTP in 10 mM Tris-HCl, 50 mM KCl, and
1.5 mM MgCl2. PCR bead tubes with DNA templates and 1.5 µl of 10 µM solutions of
each primer were placed in a preheated (94°C) thermal cycler block (DNA Engine®
Peltier Thermal Cyclers; MJ Research). The amplification protocol included an initial
denaturing step at 94°C for 3 min followed by 20 cycles of denaturation at 94°C for 30 s,
annealing at 56°C for 30 s, and extension at 72°C for 90s. After a final extension step at
72°C for 10 min, the PCR bead tubes were stored at 4°C. PCR products of the expected
fragment size (~1465bp), as determined by agarose gel electrophoresis, were purified
using an UltraClean™ PCR Clean-up™ Kit (MoBio Laboratories, Inc., Carlsbad, CA).
Purified PCR products were eluded in nuclease-free water, stored at 4°C, and used within
24 hours.
Terminal restriction fragment length polymorphism (T-RFLP) analysis –
Differences in the overall structure of bacterioplankton communities in all ballast water,
treated wastewater, and harbor water samples were evaluated using T-RFLP analysis.
Purified PCR products were digested at 37ºC for 3 hours using restriction enzymes
HaeIII, MspI, and RsaI (Promega, Fitchburg, WI). Digestion was terminated by
incubation at 65ºC for 15 minutes. Digested PCR products were precipitated in ethanol,
dried, and resuspended in nuclease-free water. Fluorescently labeled and purified PCR
products were digested in separate reactions using HaeIII, MspI, and RsaI restriction
enzymes (Promega, Fitchburg, WI). The fluorescent terminal-restriction fragments
(TRFs) of digested PCR products were separated by size on an ABI 3730xl Genetic
Analyzer (Applied Biosystems, Carlsbad, CA; BioMedical Genomics Center, University
of Minnesota). Sample electropherograms from GeneMapper® software were directly
imported into the BioNumerics® software package (Applied-Maths, Belgium) and
converted to densitometric curves. The BioNumerics® software estimated the TRF sizes
in base pairs (bp) by comparison to the MapMarker® 1000 molecular weight standard
(i.e., 23 DNA fragments ranging from 50 bp to 1000 bp in size) using a cubic spline fit
algorithm. TRFs with estimated sizes outside of the range of the molecular weight
standard were excluded from further analysis. Individual peaks that were greater than 1%
76
relative of the maximum fluorescence intensity of each lane were defined as peaks
(bands). In some samples, this percentage was adjusted upwards to compensate for
higher noise levels, but profiles containing a high level of noise (> 5 % of the maximum
fluorescent intensity) were removed from further analysis. For each restriction enzyme,
TRF peaks in all T-RFLP profiles were aligned and placed into bin classes using a 1%
position tolerance and 1% optimization. Assignments were visually inspected to detect
erroneous assignments.
Statistical analyses of bacterioplankton T-RFLP profiles
Cluster analysis – Natural groupings among bacterioplankton communities from
different sources were illustrated using hierarchical clustering. For each restriction
enzyme digest, densitometric curves of each T-RFLP profile were compared using
similarity-based cluster analysis within BioNumerics®. Pairwise similarity matrices
were calculated using Pearson correlation coefficients and dendrograms were constructed
using the un-weighted pair group method using arithmetic averages (UPGMA) clustering
algorithm. The uncertainty of dendrogram branches was estimated using Cophenetic
correlation comparing the matrix similarities and the dendrogram-derived similarities.
NMS ordination – Nonmetric multidimensional scaling (NMS) was performed
using PC-ORD Version 4.0 (McCune and Mefford 1999) with the Sorensen distance
measure to explore relationships between freshwater ballast samples and harbor water
samples (dockside and pelagic). TRF peak heights were imported into Microsoft Excel
and fragments with peak heights < 50 relative fluorescence units were removed before
further analysis (Blackwood et al. 2003). T-RFLP peak profiles were standardized by
dividing each peak height, by the total sum of all peak heights for each sample since the
concentration of DNA injected into each lane in capillary electrophoresis can differ
between samples and even replicates (Liu et al. 1997, Dunbar et al. 2001, Osborn et al.
2000). NMS is a non-parametric multivariate analysis method that uses an iterative
algorithm to extract the strongest patterns of community structure from a dataset and
summarizes these patterns on a minimum number of ordination axes (Mather 1976,
Kruskal 1964b, McCune and Grace 2002). Ordination plots with a final stress of 5-10
77
were considered good ordinations with minimal risk of false representation of
redundancy patterns (Kruskal’s Stress multiplied by 100; McCune and Grace 2002,
Kruskal 1964a, Clarke 1993), although a final stress of 10-20 may provide a usable
interpretation at the lower end (Clarke 1993). A Monte Carlo test was run 250 times on
randomized data during each run to determine if the stress values were stronger than
expected by chance. In this study, the autopilot ‘slow and steady’ option was used to
determine recommended number of axes.
One-way analysis of similarity (ANOSIM) – The statistical difference between
groups in ordination plots was tested using ANOSIM with 999 permutations (Clarke
1993, Rees et al. 2004). In this analysis, an R statistic is computed (0 to 1). R-values >
0.75 indicate groups are well separated, R-values > 0.5 indicate separated groups with
some overlap, and R-values < 0.25 indicate groups that are minimally separated (Ramette
2007). ANOSIM was performed on T-RFLP profiles consisting of relative peak heights
of TRFs in PAST Version 2.15 software (Hammer et al. 2001) using a Sorensen distance
measure.
Construction of bacterioplankton 16S rRNA gene clone libraries
Three ballast water samples and one harbor water sample were selected to
construct 16S rRNA gene clone libraries to identify the types of bacteria present in these
samples. The inner harbor sample (DSH-IN) was chosen because it was taken from a
part of the DSH where the most ballast water is discharged by commercial ships.
Seawater ballast from Ship 9 was chosen based on quality of T-RFLP profiles as
compared to the sample from Ship 7. The two freshwater ballast samples were selected
from the larger set of ballast samples based on whether they came from ports that
contribute a large volume of ballast water to the Duluth-Superior Harbor and from
locations associated with current or predicted future NIS invasions (Grigorovich et al.
2003, U.S. EPA 2008). Information on ballast activity was obtained for commercial
ships arriving in the DSH from the National Ballast Information Clearinghouse (NBIC;
http://invasions.si.edu/nbic/) database, which includes arrival port, arrival date, last port,
ballast water source, and discharge volume. Patterns of ballast water discharge were
78
analyzed using Microsoft Excel software and ArcGIS version 9.1 (ESRI, Relands
California).
Information from ballast water management (BWM) logs submitted to NCIB for
arrival to Duluth, MN and Superior, WI were downloaded and combined in Microsoft
Excel. Entries from ocean-going vessels (approximately 49,000 Mt), from unknown
sources (approximately 300,000 Mt), and from vessels that did not discharge into the
harbor were removed from the dataset. The 490 remaining entries including 74 different
vessels and 64 different ballast water source harbors and were sorted by greatest to least
discharge volume. The top 20 source ports constituted nearly 90% of the total discharge
(Fig. III.2; Appendix Fig. A-1). The top three sites each contributed over 1 million
metric tons of ballast water including St. Clair, MI (25.46%), Gary, IN (9.38%), and
Monroe, MI (8.65%). A total of 15.1 million metric tons (MMt; 3.7 billion gallons) were
discharged into the Duluth-Superior Harbor in 2009.
One freshwater ballast sample chosen for creating a clone library was from Ship 6
(Table III.1). Ballast water from this ship originated from St. Clair, MI located in the
Lake Huron-Lake Erie corridor, an aquatic invasion ‘hotspot’ (Grigorovich et al. 2003).
The second freshwater ballast sample was chosen from a transoceanic ship (Ship 3; Table
III.1) that had taken up freshwater ballast in Burns Harbor in Lake Michigan. Burns
Harbor was the fourth largest contributor of ballast water discharged into the Duluth-
Superior Harbor (0.97 MMt) during the 2009-shipping season and is located within 15
miles of Gary, IN. Gary Harbor is the second most high-risk port for future invasions of
nonindigenous species (NIS) as determined by the EPA (2008).
Four 16S rRNA gene clone libraries were constructed for the DSH-IN harbor
water sample and the three ballast water samples (FWB3, FWB6, SWB9). The same
PCR procedure used for T-RFLP was followed but a non-labeled 27F forward primer was
used. For each clone library, amplicons from duplicate PCR reactions were pooled to
minimize PCR bias (Blackwood et al. 2003). The combined amplicons were cloned
using a TA Cloning® Kit with One Shot® INVαF’ Chemically Competent E. coli
(Invitrogen™). Escherichia coli cells containing clonal inserts were spread on Luria-
Bertani (LB) agar containing 100 µg ml-1 ampicillin and grown overnight at 37ºC.
79
Figure III.2. Volume of ballast water discharged into the Duluth-Superior Harbor by ships arriving from various ports in the Laurentian Great Lakes during the 2009-shipping season. Black circles depict source port locations. The diameter of the circles and the type of color fill indicate the millions of metric tons (MMt) of ballast water discharged from each source port. The three largest contributors to the total ballast water discharged during 2009 (15.1 MMt) into the Duluth-Superior Harbor were St. Clair, MI (3.75 MMt), Gary, IN (1.38 MMt), and Monroe, MI (1.27 MMt).
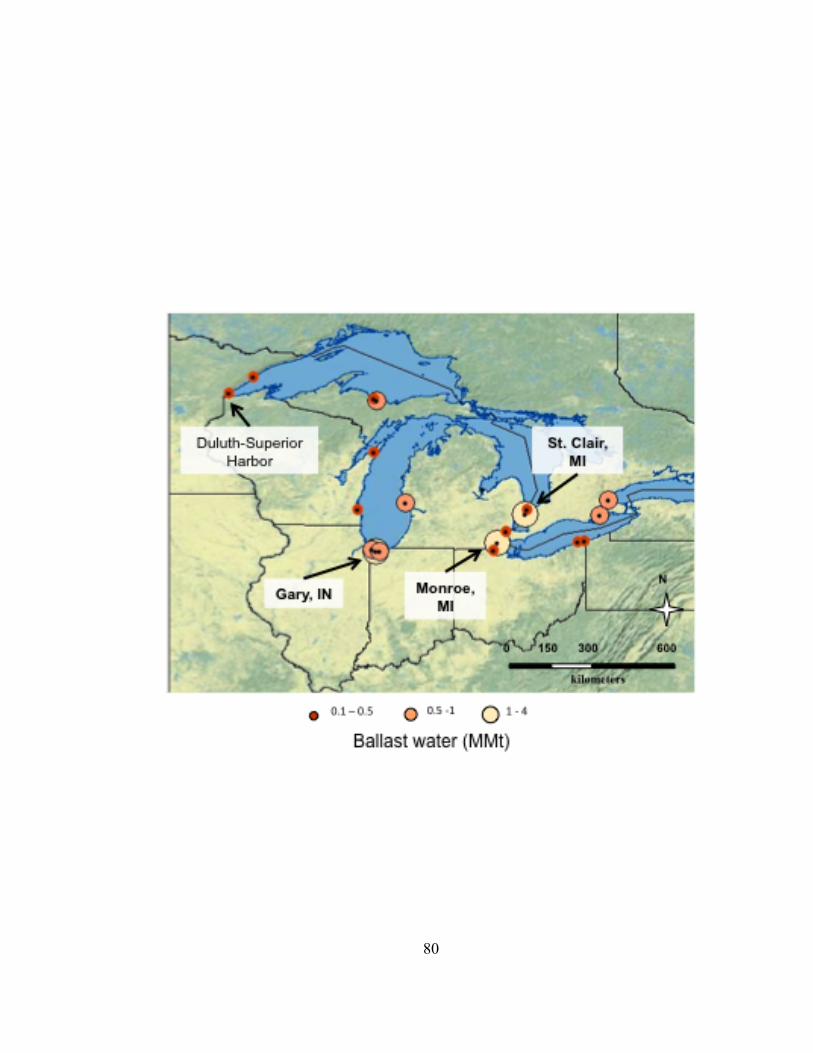
80
81
Randomly selected clones were picked with sterile toothpicks and grown overnight at
37°C in LB broth containing 100 µg ml-1 ampicillin in 96-well microplates. Sterile
glycerol was added (final concentration 10 %) to each well and the microplates were
stored at -80°C.
For DNA sequence analyses, clones were grown overnight in LB broth containing
100 µg ml-1 ampicillin at 37°C. Plasmids were isolated using an UltraClean® Standard
Mini Plasmid Prep Kit (MoBio Laboratories, Inc) and sequenced on an ABI Prism 3730xl
DNA Analyzer (Applied Biosystems) at the University of Minnesota BioMedical
Genomics Center. The 16S rRNA gene sequences from clonal inserts were edited and
evaluated for quality using 4Peaks version 1.7.2 software (4Peaks by A. Griekspoor and
T. Groothuis, mekentosj.com). The sequences were evaluated with VecScreen
(http://www.ncbi.nlm.nih.gov/VecScreen/VecScreen.html) to identify possible vector-
contaminated clones. Quality sequences of approximately 500 base pairs (bp) in length
were retained for further analysis. Each of these high quality sequences was assigned to
phylogenetic groups based on nearest-neighbor sequences identified in GenBank (> 90%
identity) using the BLAST search tool (http://blast.ncbi.nlm.nih.gov/Blast.cgi).
Analyses of bacterioplankton clone libraries
The LIBSHUFF computer program (http://libshuff.mib.uga.edu) was used to
determine if the clone libraries were derived from statistically different bacterioplankton
communities. Similarity percentages between selected sequences were calculated by
creating a similarity matrix in dnadist in PHYLIP
(http://hpc.icrisat.cgiar.org/Pise/5.a/phylogeny/dnadist.html). Sequences in each clone
library were grouped into operational taxonomic units (OTUs) at the ≧ 97% sequence
similarity level by using the web-based bioinformatics tool FastGroupII (Yu et al. 2006;
http://biome.sdsu.edu/fastgroup/fg_tools.htm). Rarefaction analyses were performed in
FastGroupII to compare the richness among samples that have been un-equally sampled.
However, rarefaction curve analysis does not reflect richness or evenness of the original
microbial communities (Hughes et al. 2001) because it does not correct for unseen taxa

82
(Kan et al. 2007). Therefore, the richness of the original community was estimated using
the nonparametric richness estimator, Chao1 (Chao 1984). Chao1 is useful for datasets
with a disproportionate number of low-abundance classes, but can underestimate richness
if coverage is low (Chao 1984, Hughes et al. 2001). The percent coverage was calculated
to determine the completeness of the each clone library (Good 1953).
Two indices were used to measure diversity, the Shannon-Wiener index and
Simpson’s index. The Shannon-Wiener index (H’) correlates with species richness and
evenness and is more heavily weighted to rare species (Shannon and Weaver 1949,
Wiener 1948, Krebs 1989, Hill et al. 2003). Simpson’s index gives the probability that
two randomly chosen individuals would belong to the same species and is more heavily
weighted to dominant species. Simpson’s index values range from 0 to 1, with the
greater value representing no diversity, so the Simpson’s Reciprocal index was used here
for ease of interpretation. The Simpson’s index is not as sensitive to low coverage as the
Shannon-Wiener index (Hill et al. 2003). Calculations for Chao1, coverage, and the
diversity indices were performed using SPADE (Species Prediction and Diversity
Estimation; Chao and Shen 2005).
Phylogenetic analysis – The partial 16S rRNA gene sequences within each clone
library were aligned using the multiple sequence alignment software program,
CLUSTALW implemented in MEGA version 4.0 (Tamura et al. 2007). Aligned
sequences were evaluated in MALLARD (http://www.bioinformatics-
toolkit.org/Mallard/index.html) to check for chimeric or other anomalous sequences.
Phylogenetic groups of clone sequences, their nearest neighbors defined by BLAST, and
a collection of taxonomically related sequences from the National Center for
Biotechnology Information (NCBI) nucleotide database
(http://www.ncbi.nlm.nih.gov/nuccore) were aligned using CLUSTALW. Consensus
phylogenetic trees were constructed from 1,000 bootstrap replicate trees with MEGA
using the neighbor-joining algorithm and pairwise distance estimates calculated using the
Kimura 2 parameter evolutionary model.
83
RESULTS Prokaryotic cell abundance
The abundance of prokaryotic cells in ballast water ranged from 0.27 to 1.88 x 10⁹
cells L-1 and from 0.93 to 2.68 x 10⁹ cells L-1 in dockside water samples (Table III.1).
Prokaryotic cell abundance was higher in freshwater ballast water than in seawater and
brackish water ballast samples (Student’s t test; p < 0.05). Prokaryotic cells were less
abundant in ballast water than in DSH water adjacent to the dock when all ballast and
dockside water samples were considered (Student’s t test; p < 0.05). Prokaryotic cell
abundances were similar in the two field sites sampled in the inner (DSH-IN; 2.56 x 10⁹
cells L-1) and outer (DSH-OT; 2.44 x 10⁹ cells L-1) harbor of the DSH. Prokaryotic cells
could not be counted in WLSSD wastewater effluent because of the very high amount of
particulate material in these samples.
T-RFLP profiles of bacterioplankton communities
The T-RFLP profiles of bacterioplankton communities in freshwater ballast were
well separated from seawater ballast communities when densitometric curves were used
to construct T-RFLP profiles of these communities, regardless of the enzyme used to
digest the PCR fragments (Fig. III.3). Two well-separated clusters were also observed in
peak-based analyses (ANOSIM: R = 0.924 to 0.988, p < 0.01). The bacterioplankton
community T-RFLP profiles of the two seawater ballast samples were less than 35%
similar to those of the other ballast water samples. The community profiles showed a
high degree of reproducibility because replicates of samples often formed clusters of >
90% similarity.
The bacterioplankton communities in freshwater ballast and harbor water depicted
in NMS ordination plots were minimally separated (R = 0.288-0.499, p < 0.001; Fig.
III.4). Bacterioplankton communities from the inner (DSH-IN) and outer (DSH-OT)
harbor always grouped with bacterioplankton communities in the dockside samples when
any of the three restriction enzymes was used to construct T-RFLP profiles. Final stress
values ranged from 9.17 to 11.41, indicating that the ordination axes were stronger than
would be expected by chance (Monte Carlo Stress test, 250 permutations, p < 0.01).
84
Figure III.3. UPGMA dendrograms showing hierarchical clustering of T-RFLP profiles of bacterioplankton communities in ballast water from commercial ships sampled in the Duluth-Superior Harbor during 2009. T-RFLP profiles were generated using three different restriction enzyme digests of the same samples – HaeIII (A), MspI (B), and RsaI (C). Letters after the ship numbers indicate replicates of the same sample. Numbers at branch nodes are Cophenetic correlation coefficients that estimate the uncertainty of dendrogram branches.
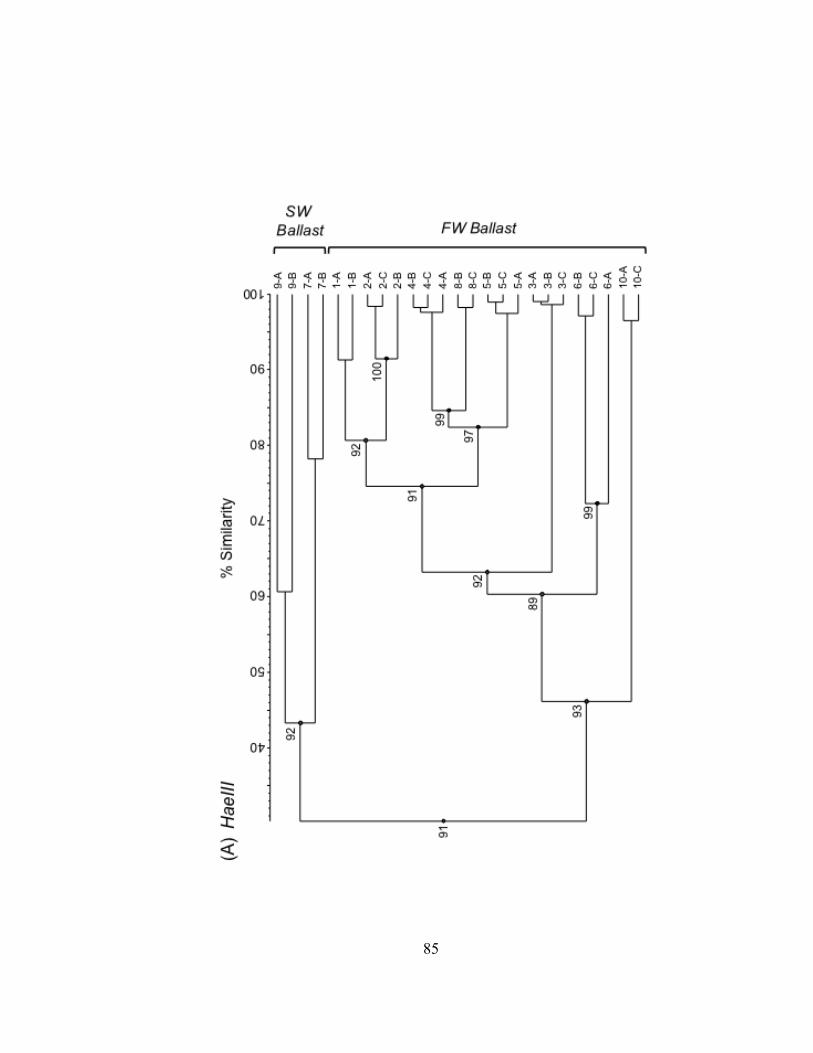
85

86
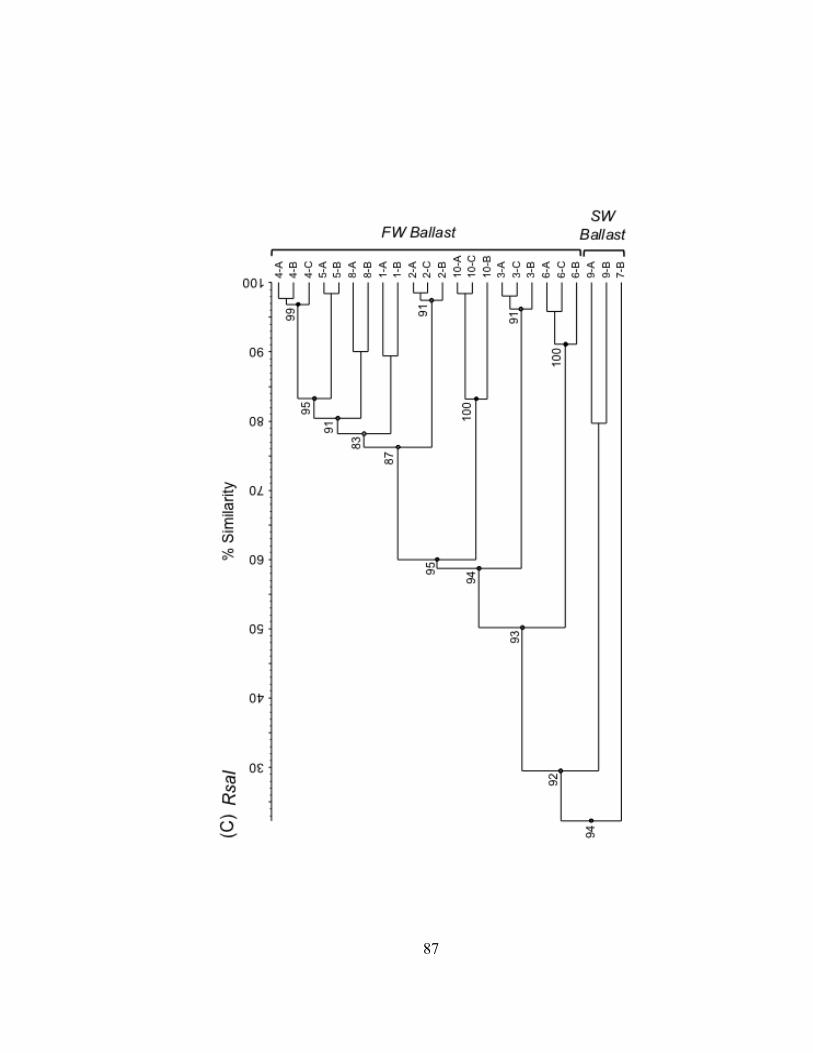
87
88
Figure III.4. NMS ordinations of T-RFLP profiles of bacterioplankton communities in freshwater ballast, dockside water samples, and at two Duluth-Superior Harbor sites. T-RFLP profiles were generated using three different restriction enzyme digests of the same samples – HaeIII (A), MspI (B), and RsaI (C). Grey squares indicate ballast water samples and asterisks indicate dockside water samples. Black circles indicate harbor water samples collected at outer (DSH-OT) and inner (DSH-IN) harbor sites. Stress values for each ordination are reported on each graph.
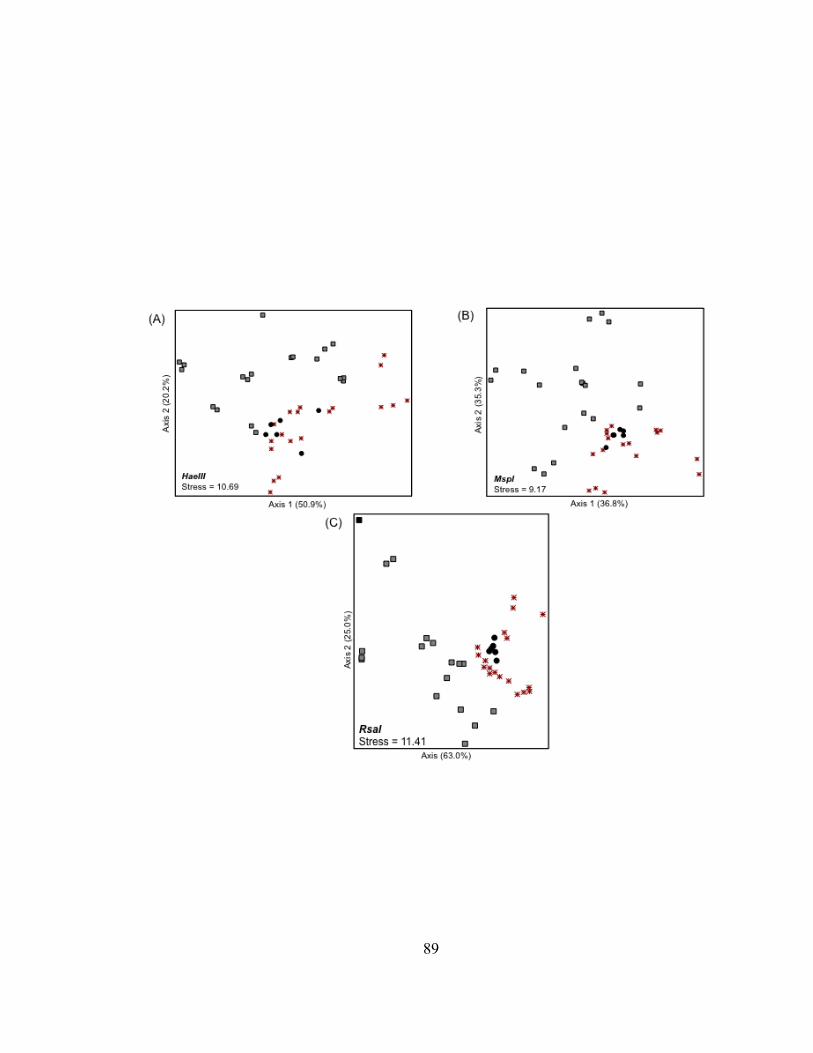
89

90
Densitometric curves of the T-RFLP profiles of the bacterioplankton communities
in the WLSSD and the harbor water samples formed two distinct clusters in all three
restriction enzyme digest (Fig. III.5). Percent similarities between clusters ranged from
22.8 to 33%. These two clusters were supported in peak-based analyses. T-RFLP
profiles of bacterioplankton communities of treated wastewater effluent and harbor water
were well separated when the relative peak heights of terminal restriction fragments
(TRFs) were used to construct profiles (ANOSIM: R = 1, p < 0.05).
Bacterioplankton 16S rRNA gene clone libraries
To further characterize the bacterioplankton communities, 16S rRNA gene clone
libraries were developed for three ballast and one harbor water sample. Initially, partial
16S rDNA fragments from 753 clones were sequenced. Clones removed from analysis
included three clones with possible vector contamination, four sequences determined to
be anomalous by MALLARD, and 123 clones with poor quality (i.e., low or absent
signal, possible DNA contamination, background noise). No chimeric sequences were
identified. The FWB3, FWB6, and SWB9 clone libraries had 16 to 21 poor quality
clones removed whereas DSH-IN had 67 poor quality clones removed. Partial 16S rDNA
sequences (approximately 500bp) from 623 clones were used in the final analysis (Table
III.2).
Results from LIBSHUFF indicated that the four clone libraries were derived from
distinctly different bacterial communities (p < 0.01). Percent coverage estimates for
OTUs (≧ 97% sequence identity) ranged from 60 to 72% indicating incomplete sampling
of the original bacterial communities (Table III.2). Shannon-Wiener indices and Chao1
richness estimates were not significantly different among the four clone libraries.
However, both the Shannon-Wiener index and Chao1 can be affected by low coverage.
Thus, the Simpson’s Reciprocal Index (SRI), which is less affected by coverage was also
calculated (Table III.2). The FWB6 clone library of the freshwater ballast from St. Clair
had the highest Simpson’s diversity (SRI = 54.7) and the seawater ballast for Ship 9
(SWB9) had the lowest diversity (SRI = 10.4). Although the Simpson’s diversity of the
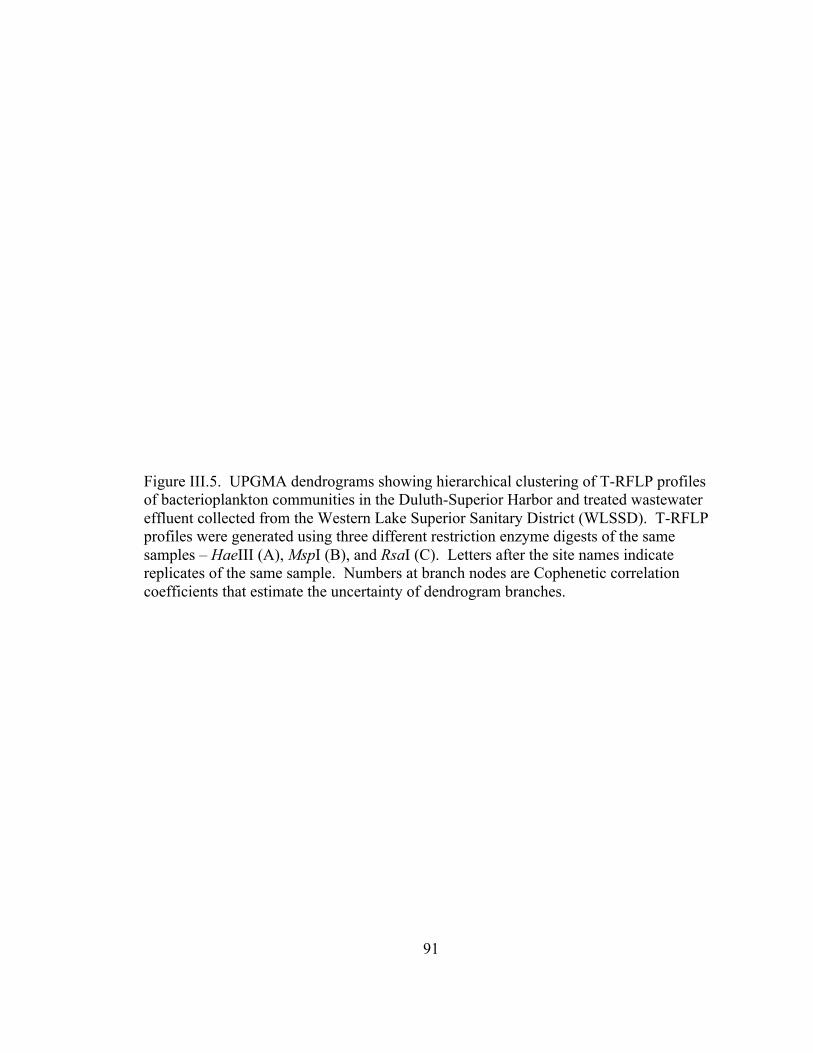
91
Figure III.5. UPGMA dendrograms showing hierarchical clustering of T-RFLP profiles of bacterioplankton communities in the Duluth-Superior Harbor and treated wastewater effluent collected from the Western Lake Superior Sanitary District (WLSSD). T-RFLP profiles were generated using three different restriction enzyme digests of the same samples – HaeIII (A), MspI (B), and RsaI (C). Letters after the site names indicate replicates of the same sample. Numbers at branch nodes are Cophenetic correlation coefficients that estimate the uncertainty of dendrogram branches.
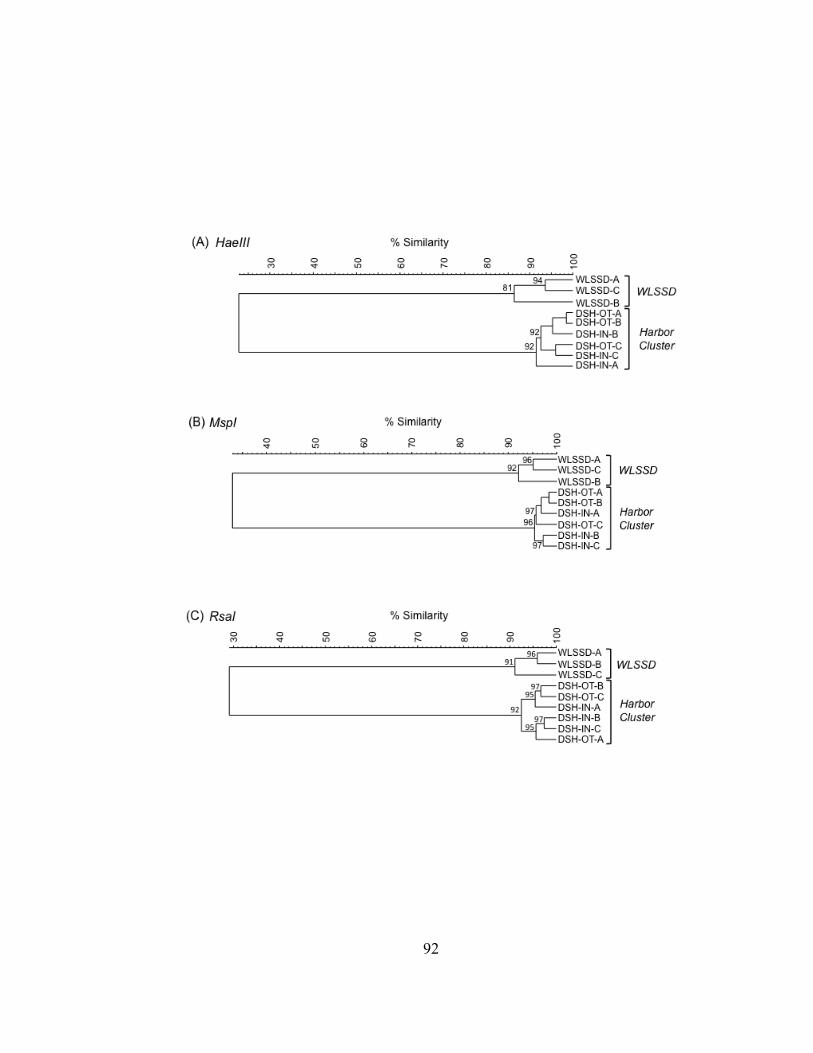
92
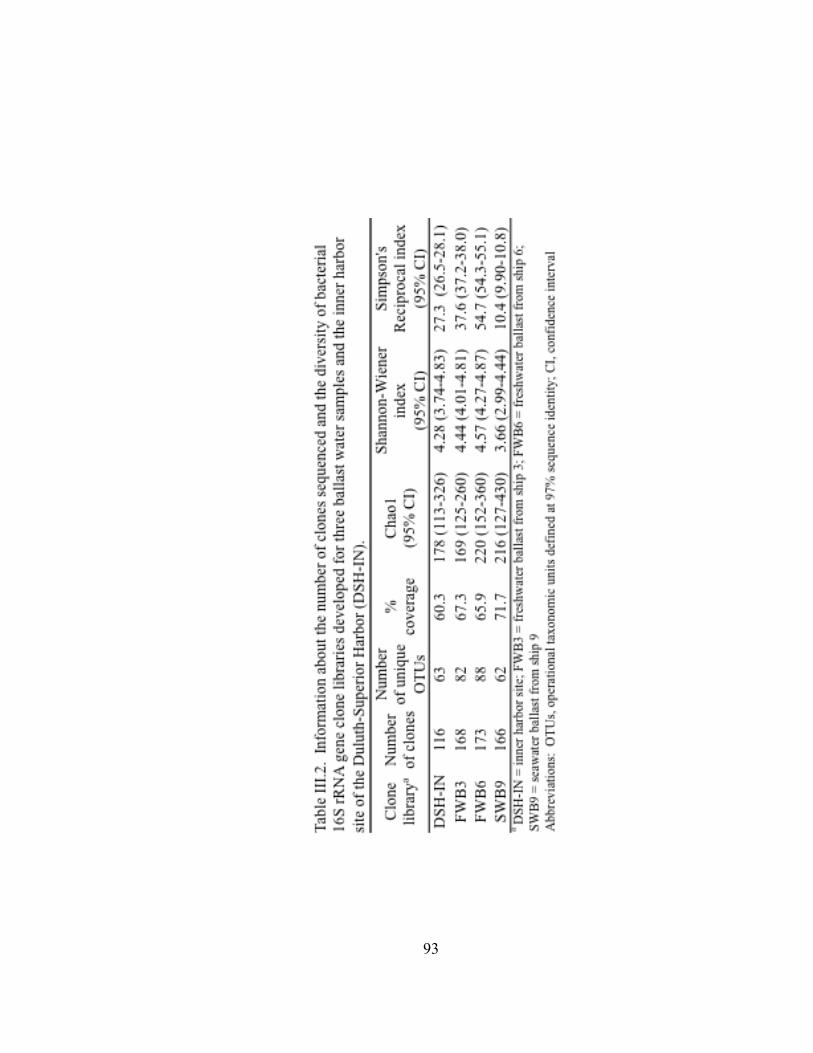
93
94
harbor water clone library (DSH-IN) was lower than the diversity indices for the two
freshwater ballast libraries, only the diversity indices derived from similar sample sizes
should be directly compared (Hill et al. 2003). The harbor clone library (DSH-IN) had at
least 50 fewer clones than the three ballast water libraries.
Rarefaction analysis gives an indication of sample richness within each clone
library and a rough estimate of diversity. The rarefaction curves at high sequence
similarity (≧97%) for all three freshwater samples (i.e., FWB3, FWB6, DSH-IN)
overlapped (Fig. III.6.A), suggesting similar levels of richness within these clone libraries
compared to the seawater ballast clone library (SWB9). At this high level of sequence
similarity, none of the rarefaction curves reached an asymptote indicating incomplete
coverage of species richness in all four samples. A sequence similarity of 80% has been
used to indicate bacteria belonging to the same phylum (Hong et al. 2006). The distinct
decline in the rate of detected OTUs in rarefaction curves calculated for the SWB9 and
FWB6 libraries at 80% sequence similarity indicated that most of the dominant bacterial
phyla were detected in these samples (Fig. III.6.B). The trajectory of the rarefaction
curves of the FWB3 and DSH-IN clone libraries indicated that some dominant bacterial
phyla that may have been present in these samples were not detected, but the FWB3
library showed greater phylum-level richness than the DSH-IN library. A large
percentage of OTUs in each of the clone libraries occurred only once (singletons = 28 to
40%).
Taxonomic assignments of clones made by comparing clonal sequences to
sequences in the GenBank library usually reflected the freshwater or marine habitat of the
water samples used to create the 16S rRNA gene clone libraries (Table III.3). In the three
freshwater clone libraries, the majority of the nearest GenBank database sequences with
> 97% maximum identity were isolated from lakes. In the seawater ballast clone library,
the nearest sequences were isolated from marine sources. All but one of the clones used
in this analysis had ≥ 90% max identity with a 16S rRNA gene sequence in GenBank
(Appendix Fig. A-3).
For the DSH-IN clone library, the bacterial phylogenetic groups assigned the most
95
Figure III.6. Rarefaction curves of OTUs for 16S rRNA gene clone libraries from the inner harbor site (DSH-IN), and ships carrying freshwater ballast (FWB3, FWB6) and seawater ballast (SWB9). The numbers in the ballast water clone library names correspond to the ballast water samples in Table III.1. Rarefaction curves are shown for OTUs with 97% sequence similarity (A) and OTUs with 80% sequence similarity (B).
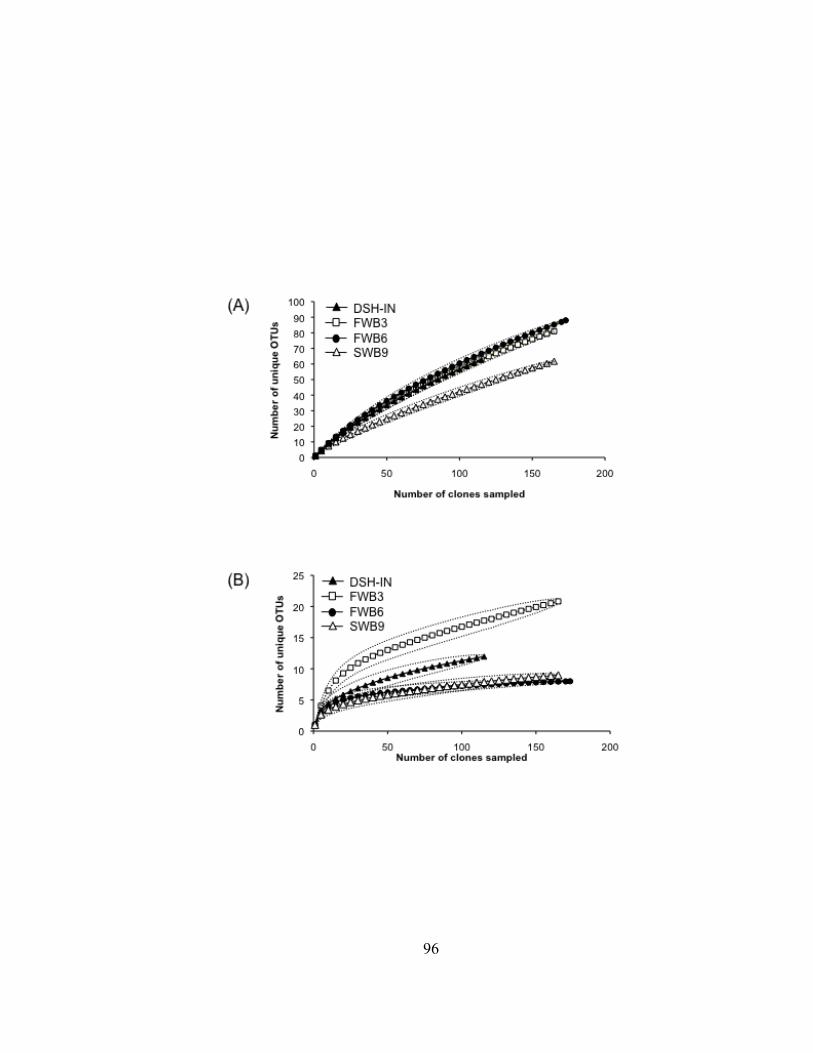
96
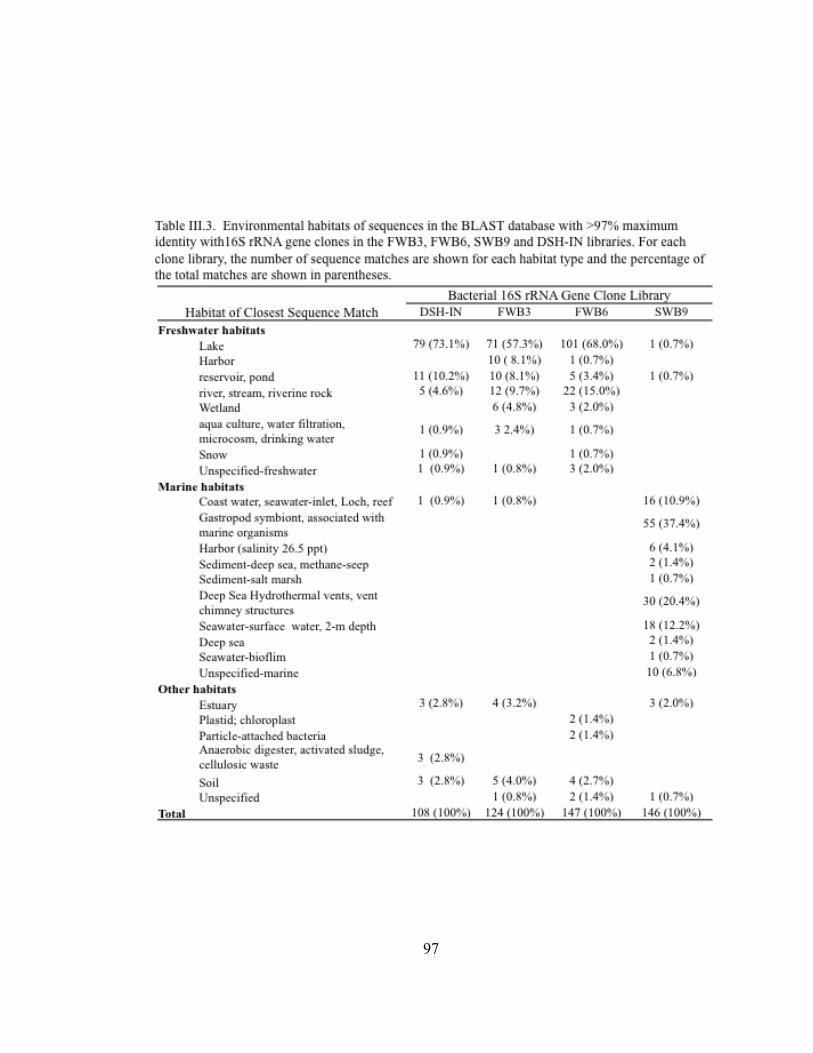
97
98
sequences were Betaproteobacteria (32%), Actinobacteria (27%), and
Alphaproteobacteria (24%; Fig. III.7). Bacterial clones attributed to the Actinobacteria
(32%) were the most abundant in the FWB3 clone library followed by clones assigned to
the Bacteroidetes (20%), Alphaproteobacteria (14%), and Verrucomicrobia (14%)
bacterial phylogenetic groups. In the FWB6 clone library, the Bacteroidetes (44%)
phylum had the most representatives followed by the Alphaproteobacteria (18%) and
Actinobacteria (15%). In the seawater ballast SWB9 clone library, 48% of the bacterial
clones were assigned to the Epsilonproteobacteria followed by Alphaproteobacteria
(28%) and Bacteroidetes (11%). Only 4% of the clones were affiliated with the
Gammaproteobacteria. More clones were assigned to the Betaproteobacteria in the
Duluth-Superior Harbor water clone library, as might be expected for a freshwater
habitat. Clonal sequences affiliated with the Alphaproteobacteria, however, were more
common in the two freshwater ballast clone libraries than sequences from sequences the
Betaproteobacteria. In the seawater ballast library, clones affiliated with the
Alphaproteobacteria were much more common than those affiliated with the
Betaproteobacteria, as is expected for a marine environment. Phylogenetic trees were
constructed for one bacterial phylum (Actinobacteria) and two bacterial classes
(Alphaproteobacteria, phylum Proteobacteria; Flavobacteria, phylum Bacteroidetes) by
comparing bacterial clone sequences from this study with some of their nearest neighbors
obtained from GenBank and sequences selected from scientific literature (Figs. III.8 and
III.9). While bacterial clones from the freshwater and seawater ballast samples were
distributed throughout the class Alphaproteobacteria, large numbers of clones were
found within taxonomic groups of the order Rickettsiales (Fig. III.8). In the freshwater
libraries, most alphaproteobacterial clones were found in the LD12 clade (FWB3,14;
FWB6,10, DSH- IN, 20) while most alphaproteobacterial clones (28) were placed in
SAR11 cluster in the marine ballast library (SWB9; Fig. III.8).
Bacterial clones affiliated with the Actinobacteria were common in the freshwater
ballast and harbor water clone libraries (Fig. III.7). Only seven clones from the SWB9
99
Figure III. 7. Percentage of 16S rRNA clones assigned to different bacterial phyla and Proteobacteria class levels for each of the clone libraries developed for the inner harbor site (DSH-IN), freshwater ballast (FWB3, FWB6), and seawater ballast (SWB9). Numbers below the taxonomic labels indicate the number of clones assigned to each taxon.

100
101
Figure III.8. Phylogenetic relationship of clones in the four 16S rRNA gene clone libraries constructed for ballast and harbor water to 16S rDNA sequences from cultured bacteria and uncultured clones from the alpha-Proteobacterial class. Clone names from this study are shown in bold and include information abut the water source (DSH, Duluth-Superior Harbor; FWB, freshwater ballast; and SWB, seawater ballast), ship number, clone designation, and a unique symbol for the water source (i.e., DSH4-square, FWB3-triangle, FWB6-inverted triangle, and SWB9-circle). Closely related clonal sequences are grouped together and the number of clones from each clone library are shown in parentheses. The accession numbers of sequences selected from GenBank are shown in parenthesis. Evolutionary distances were calculated using the Kimura 2-parameter. Numbers at nodes indicate the percentage of bootstrap iterations (of 1,000 replicate trees) that support each branching point. Scale bar indicates substitutions per nucleotide position. Aquifex pyrophilus (M83548) was used as an outgroup.
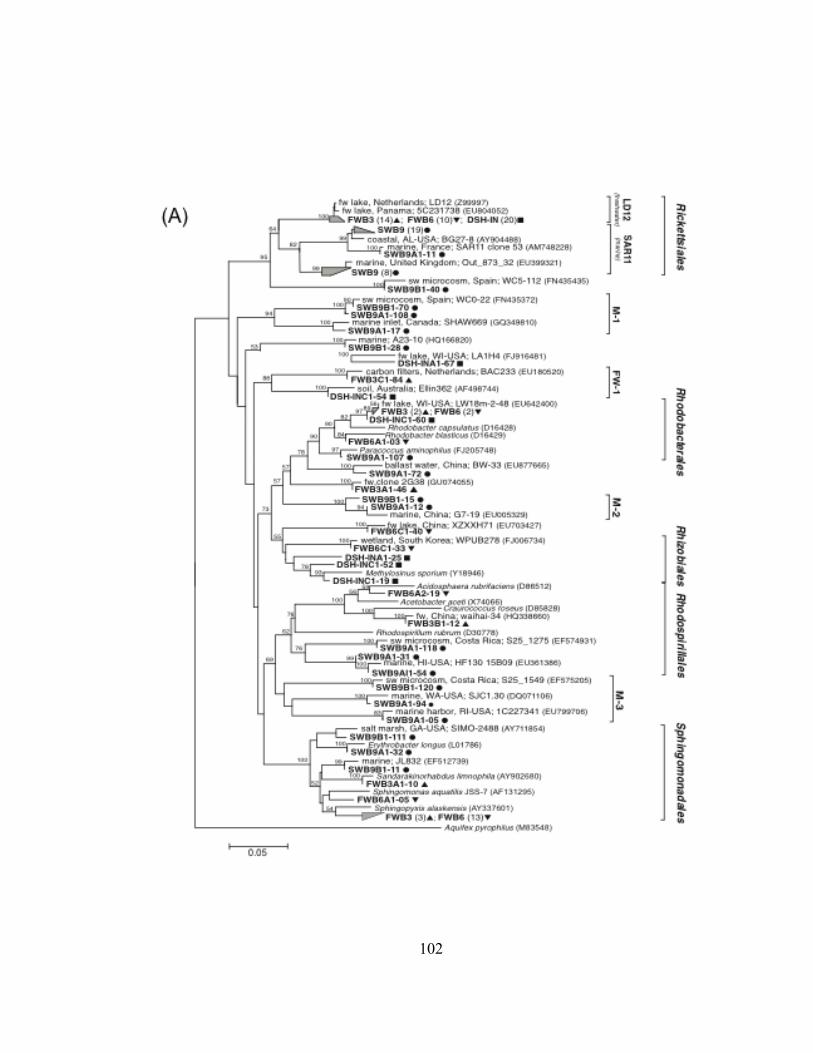
102
103
Figure III.9. Phylogenetic relationship of clones in the four 16S rRNA gene clone libraries constructed for ballast and harbor water to 16S rDNA sequences from cultured bacteria and uncultivated clones from the Actinobacteria. Clone names from this study are shown in bold are from this study and are the same as in Fig. III.9. Closely related clonal sequences are grouped together and the number of clones from each clone library are shown in parentheses. The numbers of grouped clones are in italicized parenthesis next to clone library designation. The accession numbers of sequences from GenBank are shown in parenthesis. Evolutionary distances were calculated using the Kimura 2-parameter. Numbers at nodes indicate the percentage of bootstrap iterations (of 1,000 replicate trees) that support each branching point. Scale bar indicates substitutions per nucleotide position. Planctomyces limnophilis (NR029225) was used as an outgroup.
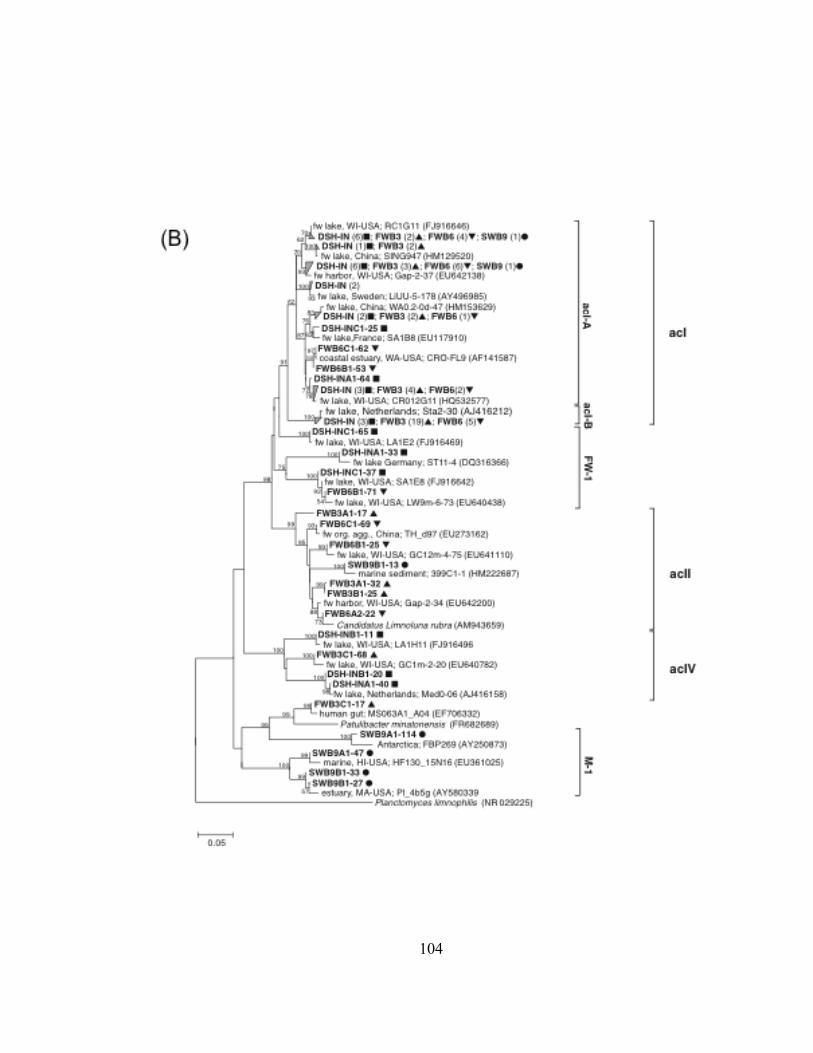
104
105
clone library were affiliated with the Actinobacteria and four of these clones were in the
distinct marine clade (M-1 ) of this phylum (Fig. III.9). Bacterial clones affiliated with
the Bacteroidetes phylum were present in all the clone libraries, but more commonly
found in the freshwater ballast libraries than in the clone libraries constructed for harbor
water or seawater ballast (Fig. III.7). Interestingly, three bacterial clones (SWB9A1-95,
SWB9A1-106, and SWB9B1-66) in the seawater ballast clone library clustered with the
genus Tenacibaculum (Fig. III.10) – a genus within the class Flavobacteria (phylum
Bacteroidetes). The partial 16S rDNA sequences of these clones were 97% similar to the
sequences for Tenacibaculum soleae, a fish pathogen.
DISCUSSION Prokaryotic cell counts in ballast water samples were similar to bacterial
abundances reported in a review of bacterial abundance in ballast water (Sun et al.,
2010). Bacterial abundances were usually twice as high in freshwater ballast than either
seawater or brackish ballast water (Table III.1). However, prokaryotic cells in ballast
water were usually half as abundant as prokaryotic cells in harbor water samples taken
adjacent to the docked ships. These results were consistent with previous studies that
reported lower bacterial abundances in ballast water as compared to the receiving port
water (Joachimsthal et al. 2004, Sun et al. 2010).
Both the frequency of introduction events and the abundance of organisms in
ballast water contribute to propagule pressure. Ballast water was primarily transported to
the DSH during the 2009-shipping season from the lower Great Lakes, with over 30% of
the ballast water discharged originating from within the Lake Huron-Lake Erie
corridor—one of four invasion ‘hotspots’ in the Laurentian Great Lakes (Grigorovich et
al. 2003). In 2010, Rup et al. reported a similar pattern of ballast water that was
transported from the lower lakes to the upper Great Lakes. Using the average prokaryotic
cell abundance in ballast water determined in this study (1.07 ± 0.5 x 10⁸ cells L-1) and
the estimated ballast water discharge volume of during the 2009-shipping season (3.7
billion gallons), the Duluth-Superior Harbor received approximately 2.05 ± 1.0 x 10¹⁷
106
Figure III.10. Phylogenetic relationship of three 16S rRNA gene clones from ship 9 (shown in bold typeface) that were affiliated with the family Flavobacteriaceae (phylum Bacteroidetes). The phylogenetic identity of these clones was most similar to several marine fish pathogens (designated with an asterisk). The accession numbers of sequences from GenBank are shown in parenthesis. Evolutionary distances were calculated using the Kimura-2-parameter. Numbers at nodes indicate the percentage of bootstrap iterations (of 1,000 replicate trees) that support each branching point. Scale bar indicates substitutions per nucleotide position. Agrococcus jenensis (X92492) and Flexibacter flexilis (AB078050) are used as outgroups.
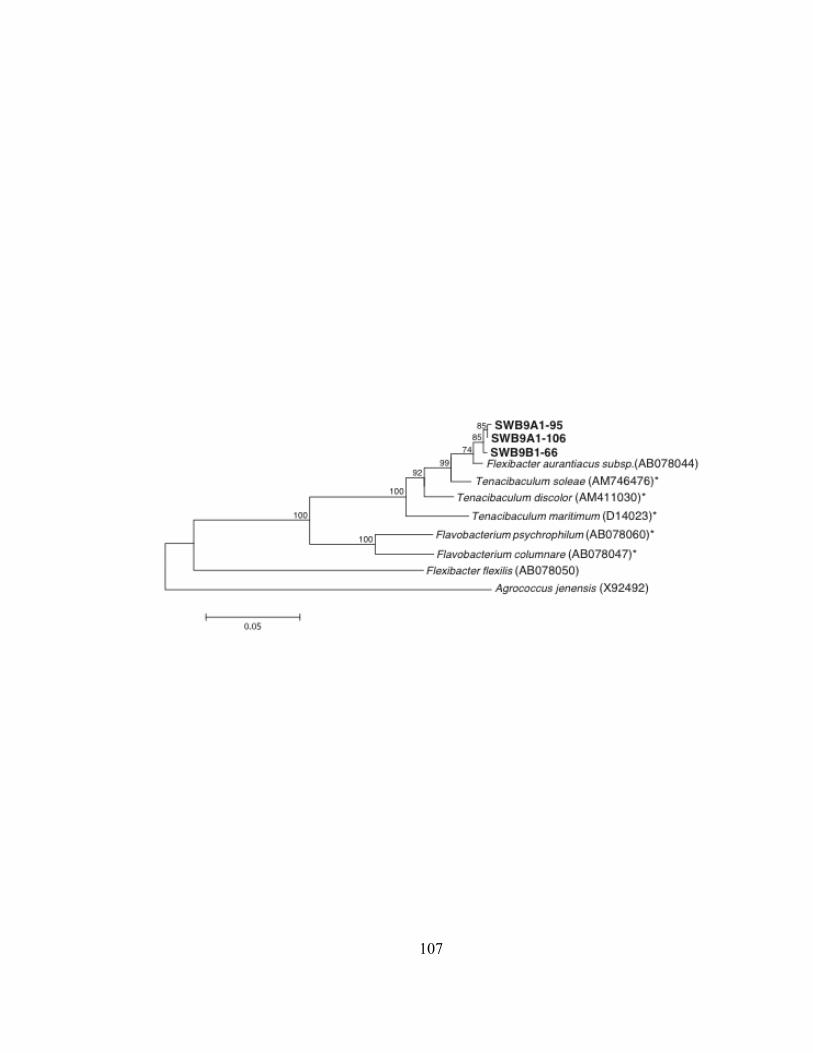
107
108
prokaryotic cells from ballast water in 2009. MacIsaac et al. (2002) found propagule
pressure from bacteria in ballast water was 7 to 8 orders of magnitude higher than the
propagule pressure for small zooplankton (rotifers, copepods, and cladocerans).
The genetic structure of bacterioplankton communities in freshwater and seawater
ballast from commercial ships was distinctly different, as indicated by the T-RFLP
analysis (Fig. III.). This result was not unexpected because pelagic marine bacterial
communities have previously been shown to be fundamentally different than those found
in freshwater (Glöckner et al. 2000). However, there also appeared to be differences
between bacterioplankton communities in freshwater ballast originating from different
ports. The genetic structure of bacterioplankton communities in the Duluth-Superior
Harbor and freshwater ballast water formed two separate, yet overlapping groups (Fig.
III.4). It is interesting that despite the fact that the ballast and dockside water samples
were collected from seven dock locations in the DSH during five months of the ten
month shipping season in Lake Superior, the genetic structure of bacterioplankton
communities in these two types of samples were so well separated. In addition, the inner
harbor (DSH-IN) and outer harbor (DSH-OT) samples collected on September 3, 2009
consistently clustered with the DSH dockside samples. This pattern suggests that either
there are differences between the structure of bacterioplankton communities in the DSH
and other ports in the Laurentian Great Lakes, or that the structure of bacterioplankton
communities in freshwater ballast may be altered by contamination from residual
sediment or by environmental conditions within the ballast tank before the ballast water
is discharged.
Another source of bacterioplankton and possibly nonindigenous species to the
DSH is treated wastewater from the WLSSD wastewater treatment plant in this harbor.
Treated wastewater effluent is a major source of bacteria, such as fecal coliforms and
potential pathogens, to freshwater and coastal waters (Cabral 2010). The genetic
structure of the bacterioplankton community discharged with treated wastewater from the
WLSSD plant in the Duluth-Superior Harbor was unique compared to bacterioplankton
communities from the inner and outer parts of the DSH (R = 1, p < 0.01; Fig. III.5). The
difference, however, might have been observed because the treated wastewater sample
109
was collected two months later in the fall (Oct. 30) than the harbor water samples (Sept.
3). The WLSSD tertiary treatment plant mean annual discharge of 40 MGD was
approximately four times greater than the mean annual ballast water discharge (~10
MGD) to the DSH in 2009. LaPara et al. (2011) determined that treated wastewater
effluent entering the Duluth-Superior Harbor was a major source of Bacteroides bacteria
(phylum Bacteroidetes) and tetracycline resistant genes to water in this harbor. Effects of
bacterial populations entering a new environment may not be immediately detected since
a portion of the bacterial communities detected in environmental samples may be
dormant (metabolically inactive; Cole 1999). These dormant microbes can then serve as
seed banks affecting bacterial community structure and composition in future generations
(Jones and Lennon 2010).
It is impossible to sample microbial communities exhaustively, but the
LIBSHUFF analysis indicated that the 16S rDNA clone libraries from the three ballast
waters (FWB3, FWB6, and SWB9) and the DSH water (DSH-IN) were distinctly
different. Comparing the diversity between bacterial communities can also provide
information on their relative differences (Hughes et al. 2001). The 16S rDNA clone
libraries constructed for freshwater sources (DHS-IN, FWB3, and FWB6) were more
diverse than the clone library derived from the seawater ballast (SWB9). The most
diverse clone library (FWB6) was created from the freshwater ballast transported from
St. Clair, MI and discharged into the DSH.
It was not unexpected to see that the taxonomic assignments of the
bacterioplankton clones reflected the freshwater or marine habitat of the water samples
used to create the clone libraries (Table III.3). Similarly, it was not surprising that the
majority (>57%) of the 16S rDNA clones from the freshwater ballast libraries were
affiliated with bacterial DNA sequences isolated from lakes because all these ballast
waters were taken aboard ships in the Laurentian Great Lakes. Bacterial phyla typically
found in freshwater aquatic habitats are Alphaproteobacteria, Betaproteobacteria,
Actinobacteria, Bacteroidetes, Planctomycetes, and Verrucomicrobia (Zwart et al. 2002,
Glöckner et al. 2000), and this was typical of the freshwater ballast and harbor water
clone libraries in this study (Fig. III.7). Marine bacterioplankton communities can be
110
fundamentally different from communities found in freshwater (Glöckner et al. 1999,
Crump et al. 1999). Betaproteobacteria are not typically found in saline environments,
however, Bouvier and del Giorgio (2007) found a dramatic increase in
Betaproteobacteria when marine communities were incubated in virus-depleted ambient
water. This finding indicates that betaproteobacteria are present in some marine
environments but only one 16S rDNA clone affiliated with the Betaproteobacteria was
found in the seawater ballast clone library (Fig. III.7).
Alphaproteobacteria, Gammaproteobacteria and Bacteroidetes are most common
bacterial taxonomic groups found in marine ecosystems (Pommier et al. 2006) but this
was not typical of the seawater ballast clone library (SWB9). The SWB9 clone library
was dominated by bacterial clones (48%) from the Epsilonproteobacteria phylum (Fig.
II.7). A majority of bacterioplankton clones (58%) in the seawater ballast were affiliated
with bacterial 16S rDNA sequences collected from marine animals and deep sea
hydrothermal vent areas (Table III.3). Epsilonproteobacteria and their environmental
DNA sequences are commonly found in hydrothermal vent ecosystems, marine
sediments, and pelagic marine redoxclines (Nakagawa et al. 2005, Labrenz et al. 2007).
Redoxclines form between oxic and anoxic or sulfidic waters. The high percentage of
Epsilonproteobacteria in the seawater ballast clone library may indicate these conditions
were present within the ballast tank of the ocean-going Ship 9. Is it possible that ocean-
going ships exchanging ballast water in mid-ocean environments are not only picking up
and transporting bacteria associated with deep-sea hydrothermal vents but also providing
the required conditions for them to survive?
It has been proposed that ballast tanks may act as incubators causing increases in
bacterial abundance over time (Drake et al. 2002), but many studies have indicated that
bacterial abundance in ballast tank waters decreases by the end of the voyage (Drake et
al. 2007, Burkholder et al. 2007, Tomaru et al. 2010). Although bacterial abundance and
diversity in ballast tanks might be expected to decrease over time, some microorganisms
may have the ability to survive the harsh conditions within the tank (Seiden et al. 2011).
As a result, the structure of bacterial communities within ballast water could change
during voyages in the ballast tanks of ships. The work of Tomaru et al. (2010) confirms
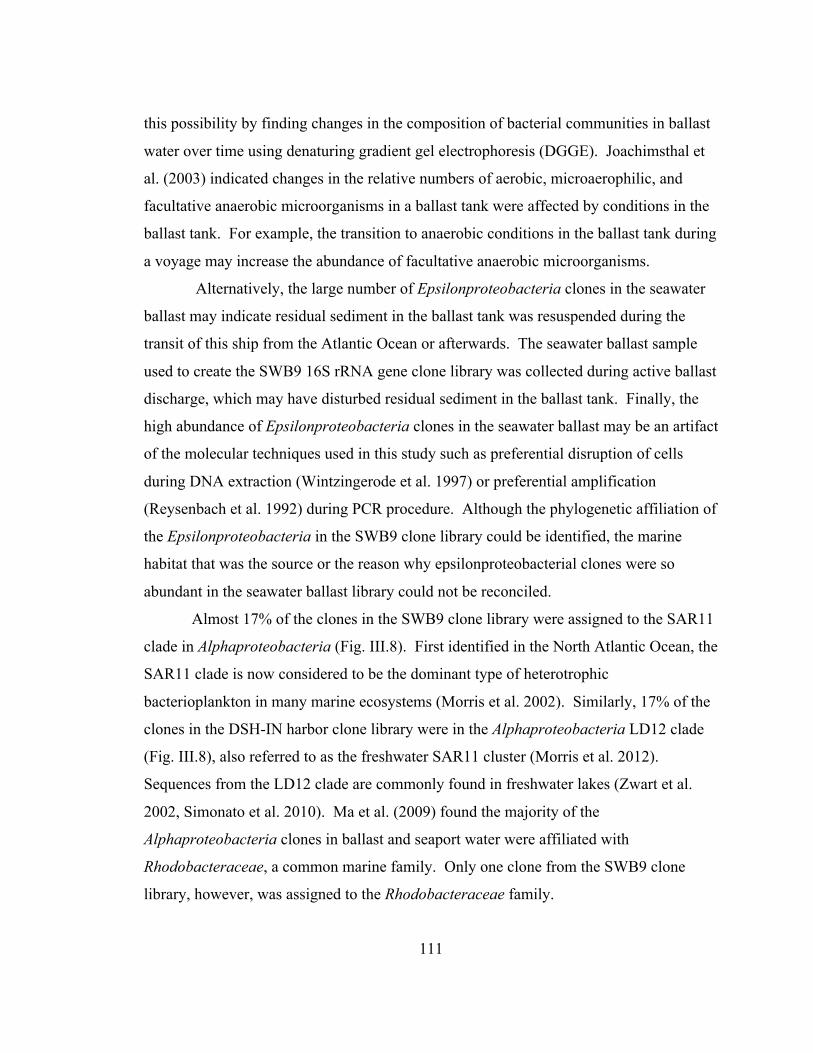
111
this possibility by finding changes in the composition of bacterial communities in ballast
water over time using denaturing gradient gel electrophoresis (DGGE). Joachimsthal et
al. (2003) indicated changes in the relative numbers of aerobic, microaerophilic, and
facultative anaerobic microorganisms in a ballast tank were affected by conditions in the
ballast tank. For example, the transition to anaerobic conditions in the ballast tank during
a voyage may increase the abundance of facultative anaerobic microorganisms.
Alternatively, the large number of Epsilonproteobacteria clones in the seawater
ballast may indicate residual sediment in the ballast tank was resuspended during the
transit of this ship from the Atlantic Ocean or afterwards. The seawater ballast sample
used to create the SWB9 16S rRNA gene clone library was collected during active ballast
discharge, which may have disturbed residual sediment in the ballast tank. Finally, the
high abundance of Epsilonproteobacteria clones in the seawater ballast may be an artifact
of the molecular techniques used in this study such as preferential disruption of cells
during DNA extraction (Wintzingerode et al. 1997) or preferential amplification
(Reysenbach et al. 1992) during PCR procedure. Although the phylogenetic affiliation of
the Epsilonproteobacteria in the SWB9 clone library could be identified, the marine
habitat that was the source or the reason why epsilonproteobacterial clones were so
abundant in the seawater ballast library could not be reconciled.
Almost 17% of the clones in the SWB9 clone library were assigned to the SAR11
clade in Alphaproteobacteria (Fig. III.8). First identified in the North Atlantic Ocean, the
SAR11 clade is now considered to be the dominant type of heterotrophic
bacterioplankton in many marine ecosystems (Morris et al. 2002). Similarly, 17% of the
clones in the DSH-IN harbor clone library were in the Alphaproteobacteria LD12 clade
(Fig. III.8), also referred to as the freshwater SAR11 cluster (Morris et al. 2012).
Sequences from the LD12 clade are commonly found in freshwater lakes (Zwart et al.
2002, Simonato et al. 2010). Ma et al. (2009) found the majority of the
Alphaproteobacteria clones in ballast and seaport water were affiliated with
Rhodobacteraceae, a common marine family. Only one clone from the SWB9 clone
library, however, was assigned to the Rhodobacteraceae family.
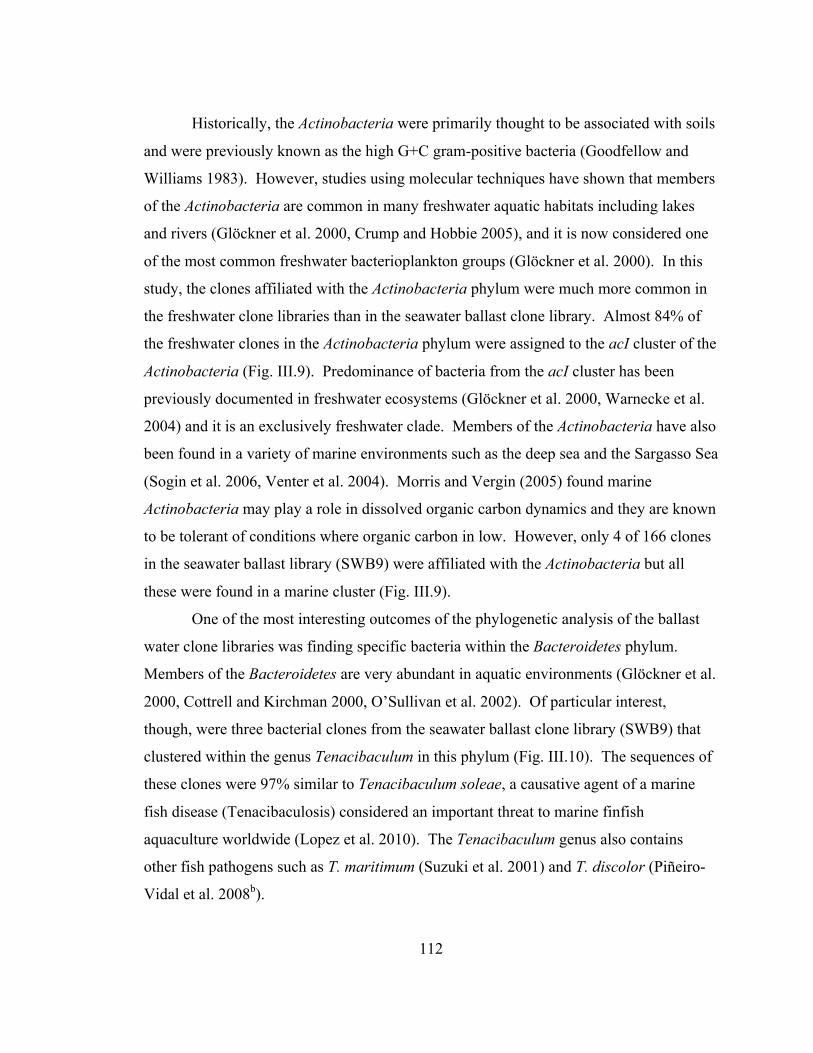
112
Historically, the Actinobacteria were primarily thought to be associated with soils
and were previously known as the high G+C gram-positive bacteria (Goodfellow and
Williams 1983). However, studies using molecular techniques have shown that members
of the Actinobacteria are common in many freshwater aquatic habitats including lakes
and rivers (Glöckner et al. 2000, Crump and Hobbie 2005), and it is now considered one
of the most common freshwater bacterioplankton groups (Glöckner et al. 2000). In this
study, the clones affiliated with the Actinobacteria phylum were much more common in
the freshwater clone libraries than in the seawater ballast clone library. Almost 84% of
the freshwater clones in the Actinobacteria phylum were assigned to the acI cluster of the
Actinobacteria (Fig. III.9). Predominance of bacteria from the acI cluster has been
previously documented in freshwater ecosystems (Glöckner et al. 2000, Warnecke et al.
2004) and it is an exclusively freshwater clade. Members of the Actinobacteria have also
been found in a variety of marine environments such as the deep sea and the Sargasso Sea
(Sogin et al. 2006, Venter et al. 2004). Morris and Vergin (2005) found marine
Actinobacteria may play a role in dissolved organic carbon dynamics and they are known
to be tolerant of conditions where organic carbon in low. However, only 4 of 166 clones
in the seawater ballast library (SWB9) were affiliated with the Actinobacteria but all
these were found in a marine cluster (Fig. III.9).
One of the most interesting outcomes of the phylogenetic analysis of the ballast
water clone libraries was finding specific bacteria within the Bacteroidetes phylum.
Members of the Bacteroidetes are very abundant in aquatic environments (Glöckner et al.
2000, Cottrell and Kirchman 2000, O’Sullivan et al. 2002). Of particular interest,
though, were three bacterial clones from the seawater ballast clone library (SWB9) that
clustered within the genus Tenacibaculum in this phylum (Fig. III.10). The sequences of
these clones were 97% similar to Tenacibaculum soleae, a causative agent of a marine
fish disease (Tenacibaculosis) considered an important threat to marine finfish
aquaculture worldwide (Lopez et al. 2010). The Tenacibaculum genus also contains
other fish pathogens such as T. maritimum (Suzuki et al. 2001) and T. discolor (Piñeiro-
Vidal et al. 2008b).
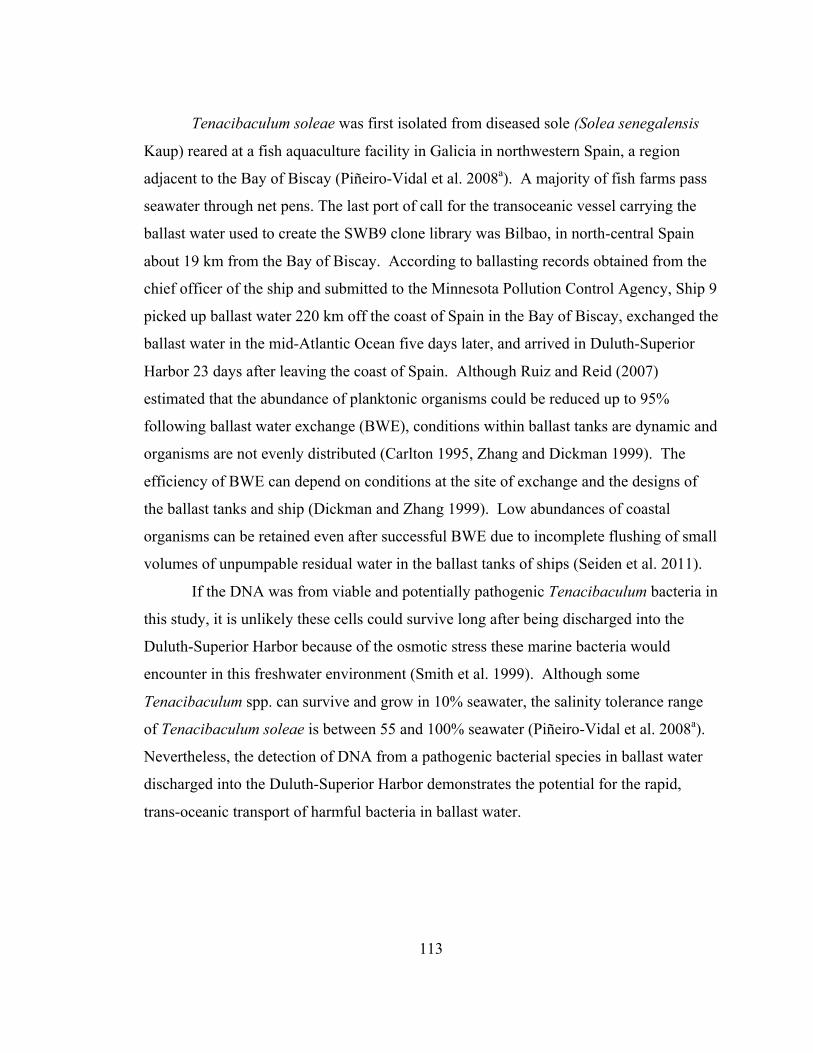
113
Tenacibaculum soleae was first isolated from diseased sole (Solea senegalensis
Kaup) reared at a fish aquaculture facility in Galicia in northwestern Spain, a region
adjacent to the Bay of Biscay (Piñeiro-Vidal et al. 2008a). A majority of fish farms pass
seawater through net pens. The last port of call for the transoceanic vessel carrying the
ballast water used to create the SWB9 clone library was Bilbao, in north-central Spain
about 19 km from the Bay of Biscay. According to ballasting records obtained from the
chief officer of the ship and submitted to the Minnesota Pollution Control Agency, Ship 9
picked up ballast water 220 km off the coast of Spain in the Bay of Biscay, exchanged the
ballast water in the mid-Atlantic Ocean five days later, and arrived in Duluth-Superior
Harbor 23 days after leaving the coast of Spain. Although Ruiz and Reid (2007)
estimated that the abundance of planktonic organisms could be reduced up to 95%
following ballast water exchange (BWE), conditions within ballast tanks are dynamic and
organisms are not evenly distributed (Carlton 1995, Zhang and Dickman 1999). The
efficiency of BWE can depend on conditions at the site of exchange and the designs of
the ballast tanks and ship (Dickman and Zhang 1999). Low abundances of coastal
organisms can be retained even after successful BWE due to incomplete flushing of small
volumes of unpumpable residual water in the ballast tanks of ships (Seiden et al. 2011).
If the DNA was from viable and potentially pathogenic Tenacibaculum bacteria in
this study, it is unlikely these cells could survive long after being discharged into the
Duluth-Superior Harbor because of the osmotic stress these marine bacteria would
encounter in this freshwater environment (Smith et al. 1999). Although some
Tenacibaculum spp. can survive and grow in 10% seawater, the salinity tolerance range
of Tenacibaculum soleae is between 55 and 100% seawater (Piñeiro-Vidal et al. 2008a).
Nevertheless, the detection of DNA from a pathogenic bacterial species in ballast water
discharged into the Duluth-Superior Harbor demonstrates the potential for the rapid,
trans-oceanic transport of harmful bacteria in ballast water.
114
Conclusion
In summary, the genetic structure of bacterioplankton communities in ballast
water and treated wastewater collected during 2009 was different from bacterioplankton
communities in the Duluth-Superior Harbor. These findings indicate there may be a
cause for concern about the potential introduction of pathogenic and potentially invasive
bacteria into the harbor. Bacterial propagule pressure from ship ballast water may be
high, even though prokaryotic cells in ballast water were typically one-half as abundant
as prokaryotic cells in the harbor. The most common bacterial phyla found in freshwater
habitats were also seen in the clone libraries of freshwater ballast and the Duluth-
Superior Harbor. The genetic structure and species composition of the seawater ballast
bacterioplankton community from an ocean-going ship was fundamentally different than
the communities in freshwater ballast, and uncharacteristically dominated by bacteria
from the Epsilonproteobacteria instead of the more commonly found bacterial phyla in
marine ecosystems. DNA from the LD-12 clade of Alphaproteobacteria was common in
freshwater ballast, while alphaproteobacterial DNA from the SAR11 cluster was common
in the seawater ballast of the one ocean-going ship examined. Although there should be
greater concern for introducing potentially harmful bacteria into the Duluth-Superior
Harbor from other freshwater harbors rather than marine sources, this study demonstrated
that DNA from a pathogenic marine bacterium, if not its intact cells, survived in the
ballast tank of a transoceanic ship for at least two weeks before the ballast water was
discharged into Duluth-Superior Harbor. This result demonstrates the potential for
transporting potentially harmful bacteria over long distances in the ballast water of
commercial ships to harbors in the Laurentian Great Lakes.
115
REFERENCES
Acinas, S. G., Sarma-Rupavtarm, R., Klepac-Ceraj, V., and M. F. Polz. 2005. PCR-
induced sequence artifacts and bias: insights from comparison of two 16S rRNA clone libraries constructed from the same sample. Appl. Environ. Microbiol. 71:8966-8969.
Ågren, A., Buffman, I., Berggren, M., Bishop, K., Jansson, M., and H. Laudon. 2008.
Dissolved organic carbon characteristics in boreal streams in a forest-wetland gradient during the transition between winter and summer. J. Geophysic. Res. 113: G03031, doi:10.1029/2007JG000674.
Alonso, C., Gómez-Pereira, P., Ramette, A., Ortega, L., Fuchs, B. M., and R. Amann.
2010. Multilevel analysis of the bacterial diversity along the environmental gradient Río del la Plata-South Atlantic Ocean. Aquat. Microb. Ecol. 61:57-72.
Anderson, D. M., Sullivan, J. J., and B. Reguera. 1989. Paralytic shellfish poisoning in
northwest Spain: the toxicity of the dinoflagellate Gymnodinium catenatum. Toxicon 27:665-674.
Aquirre-Macedo, M. L., Vidal-Martinez, V. M., Herrera-Silveira, J. A., Valdes-Lozano,
D. S., Herrera-Rodriquez, M. Olvera-Novoa, M. A. 2008. Ballast water as a vector of coral pathogens in the Gulf of Mexico: the case of the Cayo Arcas coral reef. Mar. Pollut. Bull. 56:1570-1577.
Auer, M. T., and K. D. Powell. 2004. Heterotrophic bacterioplankton dynamics at a site
off the Southern shore of Lake Superior. J. Great Lakes Res. 30 (Supplement 1):214-229.
Azam, F., and A. Z. Worden. 2004. Microbes, molecules, and marine ecosystems.
Science 303:1622-1624. Bahnick, D. A., and T. P. Markee. 1985. Occurrence and transport of organic
microcontaminants in the Duluth-Superior Harbor. J. Great Lakes Res. 11:143-155.
Bailey, S. A., Duggan, I. C., van Overdjik, C. D. A., Jenkins, P. T., and H. J. MacIsaac.
2003. Viability of invertebrate diapausing eggs collected from residual ballast sediment. Limnol. Oceanogr. 48:1701-1710.
Bain, M. B., Cornwell, E. R., Hope, K. M., Eckerlin, G. E., Casey, R. N., Groocock, G.
H., Getchell, R. G., Bowser, P. R., Winton, J. R., Batts, W. N., Cangelosi, A., and J. W. Casey. 2010. Distribution of an invasive aquatic pathogen (Viral
116
Hemorrhagic Septicemia Virus) in the Great Lakes and its relationship to shipping. PLos ONE 5:e10156. doi:10.1371/journal.pone.0010156.
Bass-Becking, L. G. M. 1934. Geobiologie of inleiding tot de milieukunde. Van Stockum
and Zoon, The Hague, The Netherlands. Beals, E. W. 1984. Bray-Curtis ordination: an effective strategy for analysis of
multivariate ecological data. Adv. Ecol. Res. 14:1-55. Beijerinck, M. W. 1913. De infusies en de ontdekking der backteriën. In jaarboek van de
Koninklijke Akademie v Wetenschappen. Müller, Amsterdam. Beletsky, B., Saylor, J. H., and D. J. Schwab. 1999. Mean circulation in the Great Lakes.
J. Great Lakes Res. 25:78-93. Bell, C. R., Holder-Franklin, M. A., and M. Franklin. 1982. Correlations between
predominant heterotrophic bacteria and physicochemical water quality parameters in two Canadian rivers. Appl. Environ. Microbiol. 43:269-283.
Bell, T. 2010. Experimental tests of the bacterial distance-decay relationship. ISME J.
4:1357-1365. Berdjeb, L., Pollet, T., Domaizon, I., and S. Jacquet. 2011. Effect of grazers and viruses
on bacterial community structure and production in two contrasting trophic lakes. BMC Microbiol. 11:88. http://www.biomedcentral.com/1471-2180/11/88. (Accessed: 7 June 2012)
Bernhard, A. E., Colbert, D., McManus, J., and K. G. Field. 2005. Microbial community
dynamics based on 16S rRNA gene profiles in a Pacific Northwest estuary and its tributaries. FEMS Microbiol. Ecol. 52:115-128.
Biddanda, B. A., and J. B. Cotner. 2003. Enhancement of dissolved organic matter
bioavailability by sunlight and its role in the carbon cycle of Lakes Superior and Michigan. J. Great Lakes Res. 29:228-241.
Biddanda, B. A., Ogdahl, M., and J. B. Cotner. 2001. Dominance of bacterial metabolism
in oligotrophic relative to eutrophic waters. Limnol. Oceanogr. 46:730-739. Bird, D. F., and J. Kalff. 1984. Empirical relationships between bacterial abundance and
chlorophyll concentration in fresh and marine waters. Can. J. fish. Aquat. Sci. 41:1015-1023.
Blackburn, T. H., and K. Henriksen. 1983. Nitrogen cycling in different types of
sediments in Danish waters. Limnol. Oceanogr. 28:477-493.
117
Blackwood, C. B., Hudleston, D., Zak, D. R., and J. S. Buyer. 2007. Interpreting
ecological diversity indices applied to terminal restriction fragment length polymorphism data: insights from simulated microbial communities. Appl. Environ Microbiol. 73:5276-5283.
Blackwood, C. B., Marsh, T., Kim, S., and E. A. Paul. 2003. Terminal restriction
fragment length polymorphism data analysis for quantitative comparison of microbial communities. Appl. Environ. Microbiol. 69:926-932.
Bouvier, T. C., and P A. del Giorgio. 2002. Compositional changes in free-living
bacterial communities along a salinity gradient in two temperate estuaries. Limnol. Oceanogr. 47:453-470.
Bouvier, T. C., and P A. del Giorgio. 2007. Key role of selective viral-induced mortality
in determing marine bacterial community composition. Environ. Microbiol. 9:287-297.
Briand, J., Leboulanger, C., and J. Humbert. 2004. Cylindrospermopsis raciborskii
(Cyanobacteria) invasion at mid-latitudes: selection, wide physiological tolerance, or global warming? J. Phycol. 40:231-238.
Brinkmann, T., Sartorius, D., F. H. Frimmel. 2003. Photobleaching of humic rich
dissolved organic matter. Aquat. Sci. 65:415-424. Brookshire, E. N. J., Valett, H. M., Thomas, S. A., and J. R. Webster. 2005. Coupled
cycling of dissolved organic nitrogen and carbon in a forest stream. Ecology 86:2487-2496.
Brunk, C. F., Avaniss-Aghajani, E., C. A. Brunk. 1996. A computer analysis of primer
and probe hybridization potential with bacterial small-subunit rRNA sequences. Appl. Environ. Microbiol. 62:872-879.
Bur, M. T., Klarer, D. M., and K. A. Krieger. 1986. First records of a European
cladoceran, Bythotrephes cederstroemi, in Lakes Erie and Huron. J. Great Lakes Res. 12:144-146.
Burkholder, J. M., Hallegraeff, G. M., Melia, G., Cohen, A., Bowers, H. A., Oldach, D.
W., Parrow, M. W., Sullivan, M. J., Zimba, P. V., Allen, E. H., Kinder, C. A., and M. A. Mallin. 2007. Phytoplankton and bacterial assemblages in ballast water of U.S. military ships as a function of port of origin, voyage time, and ocean exchange practices. Harmful Algae 6:486-518.
Cabral, J. P. S. 2010. Water microbiology: bacterial pathogens and water. In. J. Environ.

118
Res. Public Health 7:3657-3703. Carlsson, P. and D. A. Caron. 2001. Seasonal variation of phosphorus limitation of
bacterial growth in a small lake. Limnol. Oceanogr. 46:108-120. Carlton, J. T., Reid, D. M., and H. van Leeuwen. 1995. Shipping study. The role of
shipping in the introduction of nonindigenous aquatic organisms to the coastal waters of the United States (other than the Great Lakes) and an analysis of control options. U.S. Coast Guard Nat. Sea Grant Coll. Prog./Conn. Sea Grant. U. S. Coast Guard, Mar. Environ. Prot. Div., Washington, D. C.
Chao, A. 1984. Non-parametric estimation of the number of classes in a population.
Scand. J. Stat. 11:265–270. Chao, A., and T. –J. Shen. 2005. Program SPADE (Species Prediction And Diversity
Estimation). Program and user’s guide published at http://chao.stat.nthu.edu.tw. Cho, J. and J. M. Tiedje. 2000. Biogeography and degree of endemicity of fluorescent
Pseudomonas strains in soil. Appl. Environ. Microbiol. 66:5448-5456. Clarke, K. R. 1993. Non-parametric multivariate analysis of changes in community
structure. Aus. J. Ecol. 18:117-143. Cole, J. J. 1999. Aquatic microbiology for ecosystem scientists: New and recycled
paradigms in ecological microbiology. Ecosystems 2:215-225. Cottrell, M. T., and D. L. Kirchman. 2000. Natural assemblages of marine Proteobacteria
and members of the Cytophaga-Flavobacter cluster consuming low- and high-molecular-weight dissolved organic matter. Appl. Environ. Microbiol. 66:1692-1697.
Crump, B. C., Adams, H. E., Hobbie, J. E., and G. W. Kling. 2007. Biogeography of
bacterioplankton in lakes and streams of an Arctic tundra catchment. Ecology 88:1365-1378.
Crump, B. C., Armbrust, E. V., and J. A. Baross. 1999. Phylogenetic analysis of particle-
attached and free-living bacterial communities in the Columbia River, its estuary, and the adjacent coastal ocean. Appl. Environ. Microbiol. 65:3192-3204.
Crump, B. C. and J. E. Hobbie. 2005. Synchrony and seasonality in bacterioplankton
communities of two temperate rivers. Limnol. Oceanogr. 50:1718-1729.
119
Crump, B. C., Hopkinson, C. S., Sogin, M. L., and J. E. Hobbie. 2004. Microbial biogeography along an estuarine salinity gradient: combined influences of bacterial growth and residence time. Appl. Environ. Microbiol. 70:1494-1505.
Culman, S. W., Gauch, H. G., Blackwood, C. B., and J. E. Thies. 2008. Analysis of T-
RFLP data using analysis of variance and ordination methods: A comparative study. J. Micobiol. Meth. 75;55-63.
Danovaro, R., Luna, G. M., Dell’Anno, A., and B. Pietrangeli. 2006. Comparison of two
fingerprinting techniques, terminal restriction fragment length polymorphism and automated ribosomal intergenic spacer analysis for determination of bacterial diversity in aquatic environments. Appl. Environ. Microbiol. 72:5982-5989.
De Haan, H. 1993. Solar UV-light penetration and photodegradation of humic substances
in peaty lake water. Limnol. Oceanogr. 38:1072-1076. DeLong, E. F., Franks, D. G., and A. L. Alldredge. 1993. Phylogenetic diversity of
aggregate-attached vs. free-living marine bacterial assemblages. Limnol. Oceanogr. 38:924-934.
DeLong, E. F., and D. M. Karl. 2005. Genomic perspectives in microbial oceanography.
Nature 437:336-342. Doblin, M. A., Drake, L. A., Coyne, K. J., Rublee, P. A., and F. C. Dobbs. 2002.
Pfiesteria species identified in ships’ ballast water and residuals: a possible vector for introductions to coastal areas. Ed. Steidinger, K. A., Landsberg, J. H., Tomas, C. R., Vargo, G. A. Harmful algae 2002. Florida Fish and Wildlife Conservation Comm. Fl. Inst. Oceanogr. IOC-UNESCO, St. Petersburg, USA, pp 317–319.
Dickman, M. and F. Zhang. 1999. Mid-ocean exchange of container vessel ballast water:
Effects of vessel type in the transport of diatoms and dinoflagellates from Manzanillo, Mexico, to Hong Kong, China. Mar. Ecol. Prog. Ser. 176:253-262.
Dolan, J. R. 2005. Biogeography of aquatic microbes. Aquat. Microb. Ecol. 41:39-48. Drake, L. A., Choi, K., Ruiz, G. M., and F. C. Dobbs. 2001. Global redistribution of
bacterioplankton and viroplankton communities. Biol. Invasions 3:193-19 Drake, L. A., Doblin, M. A., and F. C. Dobbs. 2007. Potential microbial bioinvasions via
ships’ ballast water, sediment, and biofilm. Mar. Pollut. Bull. 55:333-341. Drake, L. A., Meyer, A. E., Forsberg, R. L., Baier, R. E., Doblin, M. A., Heinemann, S.,
Johnson, W. P., Koch, M., Rublee, P. A., and F. C. Dobbs. 2005. Potential
120
invasions of microorganisms and pathogens via ‘interior hull fouling’: biofilms inside ballast water tanks. Biol. Invasions 7:969-982.
Drake, L. A., Ruiz, G. M., Galil, B. S., Mullady, T. L., Friedmann, D. O., and F. C.
Dobbs. 2002. Microbial ecology of ballast water during a transoceanic voyage and the effects of open-ocean exchange. Mar. Ecol. Prog. Ser. 233:13-20.
Duluth Seaway Port Authority (DSPA). 2012. The largest, farthest-inland freshwater
port. Available at http://www.duluthport.com/port.php. (Accessed: 8 June 2012). Dunbar, J., Ticknor, L. O., and C. R. Kuske. 2001. Phylogenetic specifidity and
reproducibility and new method for analysis of terminal restriction fragment profiles of 16S rRNA genes from bacterial communities. Appl. Environ. Microbiol. 67:190-197.
Dyer, K. 1990. The rich diversity of estuaries. Estuaries. 13:504-505. Emerson K., Russo, R. C., Lund, R. E., and R. V. Thurston. 1975. Aqueous ammonia
equilibrium calculations: effect of pH and temperature. J. Fish. Res. Board Can. 32:2379-2382.
Erdmann, J. B., Stefan, H. G., and P. L. Brezonik. 1994. Analysis of wind- and ship-
induced sediment resuspension in Duluth-Superior Harbor. Water Resour. Bull. 30:1043-1053.
Febria, C. M., Fulthorpe, R. R., and D. D. Williams. 2010. Characterizing seasonal
changes in physicochemistry and bacterial community composition in hyporheic sediments. Hydrobiologia 647:113-126.
Federal Register. 1999. Implementation of the National Invasive Species Act of 1996
(NISA) Notice, 64 FR 26672-26690 (17 May 1999). Federal Register. 2012. U. S. Coast Guard. Rules and Regulations: Standards for living
organisms in ships’ ballast water discharged in U.S. Waters. 33 CFR Part 151/46 CFR Part 162 (23 March 2012) 77:17254-17320.
Fenchel, T., and B. J. Finlay. 2004. Patterns of local and global diversity. Bioscience
54:777-784. Fierer, N., Morse, J. L., Berthrong, S. T., Bernhardt, E. S., and R. B. Jackson. 2007.
Environmental controls on the landscape-scale biogeography of stream bacterial communities. Ecology 88:2162-2173.
121
Ferreira, J. G., Wolff, W. J., Simas, T. C., and S. B. Bricker. 2005. Does biodiversity of estuarine phytoplankton depend on hydrology? Ecol. Model. 187:513-523.
Fortunato, C. S. and B. C. Crump. 2011. Bacterioplankton community variation across
river to ocean environmental gradients. Microb. Ecol. 62:374-382. Forsberg, C., and S. O. Ryding. 1979. Correlations between discharge and transport of
elements: studies from six catchments. Vatten 35:291-300. Fuhrman, J. A., Sleeter, T. D., Carlson, C. A., and L. M. Proctor. 1989. Dominance of
bacterial biomass in the Sargasso Sea and its ecological implications. Mar. Ecol. Prog. Ser. 57:207-217.
Galil, B. S. and N. Hülsmann. 1997. Protist transport via ballast water-biological
classification of ballast tanks by food web interactions. Eur. J. Protistol. 33:244-253.
Gardner, W. S., McCarthy, M. J., An, S., Sobolev, D., Sell, K. S., and D. Brock. 2006.
Nitrogen fixation and dissimilatory nitrate reduction to ammonium (DNRA) support nitrogen dynamics in Texas estuaries. Limnol. Oceanogr. 51:558-568.
Glöckner, F. O., Fuchs, B. M., and R. Amann. 1999. Bacterioplankton compositions of
lakes and oceans: A first comparison based on fluorescence in situ hybridization. Appl Environ. Microbiol. 65:3721-3726.
Glöckner, F. O., Zaichikov, E., Belkova, N., Denissova, L., Pernthaler, J., Pernthaler, A.,
and R. Amann. 2000. Comparative 16S rRNA analysis of lake bacterioplankton reveals globally distributed phylogenetic clusters including an abundant group of Actinobacteria. Appl. Environ. Microbiol. 66:5053-5065.
Good, I. J. 1953. The population frequencies of species and the estimation of population
parameters. Biometrika 40:237-264. Goodfellow, M. and S. T. Williams. 1983. Ecology of actinomycetes. Annu. Rev.
Microbiol. 37:189-216. Godhantaraman, N., and S. Uye. 2003. Geographical and seasonal variations in
taxonomic composition, abundance and biomass of microzooplankton across a brackish-water lagoonal system of Japan. J. Plankton Res. 25:465-482.
Grigorovich, I. A., Colautti, R. I., Mills, E. L., Holeck, K., Ballert, A. G., and H. J.
MacIsaac. 2003. Ballast-mediated animal introductions in the Laurentian Great Lakes: retrospective and prospective analyses. Can. J. Fish. Aquat. Sci. 60:740-756.
122
Hahn, M. W., and M. G. Höfle. 1999. Flagellate predation on a bacterial model
community: interplay of size-selective grazing, specific bacterial cell size, and bacterial community composition. Appl. Environ. Microbiol. 65:4863-4872.
Hahn, M. W., and M. G. Höfle. 2001. Grazing of protozoa and its effect on populations
of aquatic bacteria. FEMS Microbiol. Ecol. 35:113-121. Hallegraeff, G. M., and C. J. Bolch. 1992. Transport of diatom and dinoflagellate resting
spores in ships’ ballast water: implications for plankton biogeography and aquaculture. J. Plankton Res. 14:1067-1084.
Hammer, Ǿ., Harper, D. A. T., and P. D. Ryan. 2001. PAST: Paleontological statistics
software Package for Education and data analysis. Palaeontol. Electron. 4:9. Hebert, P. D. N., Muncaster, B. W., and G. L. Mackie. 1989. Ecological and genetic -
studies on Dreissena polymorpha (Pallas): a new mollusc in the Great Lakes. Can. J. Fish. Aquati. Sci. 46:1587-1591.
Hecky, R. E., Smith, R. E. H., Barton, D. R., Guildford, S. J., Taylor, W. D., Charlton, M.
N., and T. Howell. 2004. The nearshore phosphorus shunt: a consequence of ecosystem engineering by dreissenids in the Laurentian Great Lakes. Can. J. Fish. Aquat. Sci. 61:1285-1293.
van der Heijden, M. G. A., Bardgett, R. D., and N. M. van Straalen. 2008. The unseen
majority: soil microbes as drivers of plant diversity and productivity in terrestrial ecosystesms. Ecol. Lett. 11:296-310.
Herdendorf, C. E. 1990. Great Lakes estuaries. Estuaries. 13:493-503. Hicks, R. E., Aas, P., and C. Jankovich. 2004. Annual and offshore changes in
bacterioplankton communities in the western arm of Lake Superior during 1989 and 1990. J. Great Lakes Res. 30 (Supplement 1):196-213.
Hill, T. J., Walsh, K. A., Harris, J. A., and B. F. Moffett. 2003. Using ecological diversity
measures with bacterial communities. FEMS Microbiol. Ecol. 43:1-11. Holmroos, H., Niemistö, J., Weckström, K., and J. Horppila. 2009. Seasonal variation of
resuspension-mediated aerobic release of phosphorus. Boreal Env. Res. 14:937-946.
Holton, H., Kamp-Nielsen, L., and A. O. Stuanes. 1988. Phosphorus in soil, water and
sediment: an overview. Hydrobiologia 170:19-34.
123
Horner-Devine, M. C., Carney, K. M., and B. J. M. Bohannan. 2003. An ecological perspective on bacterial biodiversity. Proc. R. Soc. Lond. B. 271:113-122.
House, W. A., Jickells, T. D., Edwards, A. C., Praska, K. E., and F. H. Denison. 1998.
Reactions of phosphorus with sediments in fresh and marine waters. Soil Use Manage. 14:139-146.
Hughes, J. B., Hellmann, J. J., Ricketts, T. H., and B. J. M. Bohannan. 2001. Counting
the uncountable: statistical approaches to estimating microbial diversity. Appl. Environ. Microbiol. 67:4399-4406.
IMO (International Maritime Organization). 2004. GloPartnership. Guidelines for ballast
water exchange. Resolution MEPC.124(53). Adopted on 22 July 2005. Available from http://globallast.imo.org (Accessed 8 June 2012)
IMO (International Maritime Organization). 2008. GloPartnership. Guidelines for ballast
water sampling. Resolution MEPC.173(58). Adopted on 10 October 2008. Available from http://globallast.imo.org (Accessed 8 June 2012)
Iriarte, A., Madariaga, I., Revilla, M., and A. Sarobe. 2003. Short-term variability in
microbial food web dynamics in a shallow tidal estuary. Aquat. Microb. Ecol. 31:145-161.
Irvine, K. N., Somogye, E. L., and G. W. Pettibone. 2002. Turbidity, suspended solids,
and bacteria relationships in the Buffalo River Watershed. Middle States Geographer 35:42-51.
Ivanov, V. 2006. Bacteriological monitoring of ships’ ballast water in Singapore and its
potential importance for the management of coastal ecosystems. Environ. Toxicol. 1:59-63.
Joachimsthal, E. L., Ivanov, V., J. H. Tay, and S. T. Tay. 2003. Flow cytometry and
conventional enumeration of microorganissms in ships’ ballast water and marine samples. Mar. Pollut. Bull. 46:269-387.
Joachimsthal, E. L., Ivanov, V., Tay, S. T. L., and J. H. Tay. 2004. Bacteriological
examination of ballast water in Singapore Harbour by flow cytometry with FISH. Mar. Pollut. Bull. 49:334-343.
Johnston, C. A., Bridgham, S. D., and J. P. Schubauer-Berigan. 2001. Nutrient dynamics
in relation to geomorphology of riverine wetlands. Soil Sci. Soc. Am. J. 65:557-577.
124
Jones, S. E. and J. T. Lennon. 2010. Dormancy contributes to the maintenance of microbial diversity. Proc. Natl. Acad. Sci. 107:5881-5886.
Jones, S. E., Newton, R. J., and K. D. McMahon. 2009. Evidence for structuring of
bacterial community composition by organic carbon sources in temperate lakes. Environ. Microbiol. 11:2463-2472.
Jordan, T. F., Stortz, K. R., and M. Sydor. 1981. Resonant oscillation in Duluth-Superior
Harbor. Limnol. Oceanogr. 26:186-190. Jousset, A., Schulz, W., Scheu, S., and N. Eisenhauer. 2011. Intraspecific genotypic
richness and relatedness predict the invisibility of microbial communities. ISME J. 5:1108-1114.
Judd, K. E., Crump, B. C., and G. W. Kling. 2006. Variation in dissolved organic matter
controls bacterial production and community composition. Ecology 87:2068-2079.
Kan, J., Crump, B. C., Wang, K., and F. Chen. 2006. Bacterioplankton community
Chesapeake Bay: predictable or random assemblages. Limnol. Oceanogr. 51:2157-2169.
Kan, J., Suzuki, T., Wang, K., Evans, S. E., and F. Chen. 2007. High temporal but low
spatial heterogeneity of bacterioplankton in the Chesapeake Bay. Appl. Environ. Microbiol. 73:6776-6789.
Kaplan and Kitts. 2003. Variation between observed and true terminal restriction
fragment length is dependent on true TRF length and purine content. J. Microbiol. Meth. 54:121-125.
Kirchman, D. L. and J. H. Rich. 1997. Regulation of bacterial growth rates by dissolved
organic carbon and temperature in the equatorial pacific ocean. Microb. Ecol. 33:11-20.
Kirk, J. L., Beaudette, L. A., Hart, M., Moutoglis, P., Klironomos, J. N., Lee, H., and J.
T. Trevors. 2004. Methods of studying soil microbial diversity. J. Microbiol. Methods. 58:169-188.
Klarer, D. M., and D. F. Millie. 1994. Regulation of phytoplankton dynamics in a
Laurentian Great Lakes estuary. Hydrobiologia 286:97-108. Knight, I, Wells, C. S., Wiggins, B., Russell, H., Reynolds, K. A., and A. Huq. 1999.
Detection and enumeration of fecal indicators and pathogens in the ballast water of transoceanic vessels entering the Great Lakes. In: General Meeting of the
125
American Society for Microbiology. American Society for Microbiology, Chicago, IL, p. 594.
Krebs, C. J. 1989. Ecological methodology. Harper Collins Inc., New York. Kritzberg, E. S., Langenheder, S., and E. S. Lindstrom. 2006. Influence of dissolved
organic matter sources on lake bacterioplankton structure and function – implications for seasonal dynamics of community composition. FEMS Microbiol. Ecol. 56:406-417.
Kruskal, J.B. 1964a. Multidimensional scaling by optimizing goodness of fit to a
nonmetric hypothesis. Psychometrika 29:1-27. Kruskal, J.B. 1964b. Nonmetric multidimensional scaling: a numerical method.
Psychometrika 29:115–129. Labrenz, M., Jost, G., and K. Jürgens. 2007. Distribution of abundant prokaryotic
organisms in the water column of the central Baltic Sea with an oxic-anoxic interface. Aquat. Microb. Ecol. 46:177-190.
Lane, D. J. 1991. 16S/23S rRNA Sequencing. In: Nucleic Acid Techniques in Bacterial
Systematics. E. Stackebrandt and M. Goodfellow, ed. Chichester (UK), John Wiley and Sons. 115-175.
LaPara, T. M., Burch, T. R., McNamara, P. J., Tan, D. T., Yan, M., and J. J. Eichmiller.
2011. Tertiary-treated municipal wastewater is a significant point source of antibiotic resistance genes into Duluth-Superior Harbor. Environ. Sci. Technol. 45:9543-9549.
Lavrentyev, P. J., McCarthy, M. J., Klarer, D. M., Jochem, F., and W. S. Gardner. 2004.
Estuarine microbial food web patterns in a Lake Erie coastal wetland. Microb. Ecol. 48:567-577.
Legendre, P. and L. Legendre. 1998. Numerical ecology. Elsevier Science BV,
Amsterdam. Lehrter, J. C., Pennock, J. R., and G. B. McManus. 1999. Microzooplankton grazing and
nitrogen excretion across a surface estuarine-coastal interface. Estuaries 22:113-125.
Lemke, M. J., Lienau, E. K., Rothe, J., Pagioro, T. A., Rosenfeld, J., and R. DeSalle.
2009. Description of freshwater bacterial assemblages from the upper Paraná River floodpulse system, Brazil. Microb. Ecol. 57:94-103.
126
Lijklema, L. 1980. Interaction of ortho-phosphate with iron(III) and aluminum hydroxides. Environ. Sci. Technol. 14:537-541.
Litchman, E. 2010. Invisible invaders: non-pathogenic invasive microbes in aquatic and
terrestrial ecosystems. Ecol. Lett. 13:1560-1572. Liu, W., Marsh, T. L., Cheng, H., and L. J. Forney. 1997. Characterization of microbial
diversity by determining terminal restriction fragment length polymorphisms of genes encoding 16S rRNA. Appl. Environ. Microbiol. 63:4516-4522.
Locke, A., Reid, D. M., van Leeuwen, H. C., Sprules, W. G., and J. T. Carlton. 1993.
Ballast water exchange as a means of controlling dispersal of freshwater organisms by ships. Can. J. Fish. Aquat. Sci. 50:2086-2093.
Lockwood, J. L., Cassey, P., and T. Blackburn. 2005. The role of propagule pressure in
explaining species invasions. Trends Ecol. Evol. 20:223-228. Lodge, D. M., Stein, R. A., Brown, K. M., Covich, A. P., Brönmark, C., Garvey, J. E.,
and S. P. Klosiewski. 1998. Predicting impact of freshwater exotic species on native biodiversity: challenges in spatial scaling. Aust. J. Ecol. 23:53-67.
López, J. R., Piñeiro-Vidal, M., García-Lamas, N., de la Herran, R., Navas, J. I.,
Hachero-Cruzado, I., and Y. Santos. 2010. First isolation of Tenacibaculum soleae from diseased cultured wedge sole, Dicologoglossa cuneata (Moreau), and brill, Scophthalmus rhombus (L.). J. Fish Dis. 33:273-278.
Lorenzen, C. J. 1967. Determination of chlorophyll and pheo-pigments:
spectrophotometeric equations. Limnol. Oceanogr. 12:343-346. Luna, G. M., Dell’Anno, A., and R. Danovaro. 2006. DNA extraction procedure: a
critical issue for bacterial diversity assessment in marine sediments. Environ. Microbiol. 8:308-320.
Ma, Y., Xiong, H., Tang, S., Yang, Q., and M. Li. 2009. Comparison of the community
structure of planktonic bacteria in ballast water from entry ships and local sea water in Xiamen Port. Prog. Nat. Sci. 19:947-953.
MacIsaac, H. J., Robbins, T. C., and M. A. Lewis. 2002. Modeling ships’ ballast water as
invasion threats to the Great Lakes. Can. J. Fish. Aquat. Sci. 59:1245-1256. Mack, M. C. and C. M. D’Antonio. 1998. Impacts of biological invasions on disturbance
regimes. Trends Ecol. Evol. 13:195-198. Martiny, J. B. Hughes, Bohannan, B. J. M., Brown, J. H., Colwell, R. K., Fuhrman, J. A.,
127
Green, J. L., Horner-Devine, M. C., Kane, M., Krumnins, J. A., Kuske, C. R., Morin, P. J., Naeem, S., Ovreås, L, Reysenbach, A. L., Smith, V. H., and J. T. Staley. 2006. Microbial biogeography: putting microorganisms on the map. Nat. Rev. Microbiol. 4:102-12.
Marsh, T. L., Saxman, P., Cole, J., and J. Tiedje. 2000. Terminal restriction fragment
length polymorphism analysis program, a web-based research tool for microbial community analysis. Appl. Environ. Microbiol. 66:3616–3620.
Mather, P. M. 1976. Computational methods of multivariate analysis in physical
geography. J. Wiley and Sons, London. McCarthy, M. J., Gardner, W. S., Lavrentyev, P. J., Moats, K. M., Jochem, F. J., and D.
M. Klarer. 2007. Effects of hydrological flow regime on sediment-water interface and water column nitrogen dynamics in a Great Lakes coastal wetland (Old Woman Creek, Lake Erie). J. Great Lakes Res. 33:219-231.
McCarthy, S. A., McPhearson, R. M., Guarino, A. M., and J. L. Gaines. 1992. Toxigenic
Vibrio cholerae O1 and cargo ships entering Gulf of Mexico. Lancet 339:624-625.
McCune, B., and J. B. Grace. 2002. Analysis of Ecological Communities. MjM Software
Design, Gleneden Beach, OR. McCune, B., and M. J. Mefford. 1999. PC-ORD, Multivariate analysis of ecological data.
MjM software, Gleneden Beach, OR. McMinn, A., Hallegraeff, G. M., Thomson, P., Jenkinson, A. V., and H. Heijnis. 1997.
Cyst and radionucleotide evidence for the recent introduction of the toxic dinoflagellate Gymnodinium catenatum into Tasmanian waters. Mar. Ecol. Prog. Ser. 161:165-172.
MDNR (Minnesota Department of Natural Resources). 2006. Completion Report: A
study of the St. Louis River. F-29-R(P)-25. Methé, B. A. and J. P. Zehr. 1999. Diversity of bacterial communities in Adirondack
lakes: do species assemblages reflect lake water chemistry. Hydrobiologia 401:77-96.
Meyer, J. L., and G. E. Likens. 1979. Transport and transformation of phosphorus in a
forest stream ecosystem. Ecology 60:1255-69. Millier, H. K. G. R., and P. S. Hooda. 2011. Phosphorus species and fractionation-Why
sewage derived phosphorus is a problem. J. Eniron. Manage. 92:1210-1214.
128
Mills, E. L., Leach, J. H., Carlton, J. T., and C. L. Secor. 1994. Exotic species and the
integrity of the Great Lakes. BioScience 44:666-676. Minor, E. C., Dalzell, B. J., Stubbins, A., and K. Mopper. 2007. Evaluating the
photoalteration of estuarine dissolved organic matter using direct temperature-resolved mass spectrometry and UV-visible spectroscopy. Aquat. Sci. doi:10.1007/s00027-007-0897-y.
Minor, E., and B. Stephens. 2008. Dissolved organic matter characteristics within the
Lake Superior watershed. Org. Geochem. 39:1489-1501. Mitton, G. B., Hess, J. H., and K. G. Guttormson. 1994. Water resources data for
Minnesota, water year 1993. Vol. 1. Great Lakes and Souris-Red-Rainy River Basins. U. S. Geological Survey Water-Data Report MN-93-1. U. S. Geological Survey, Mounds View, MN.
Morgan, C. A., Cordell, J. R., and C. A. Simenstad. 1997. Sink or swim? Copepod
population maintenance in the Columbia River estuarine turbidity-maxima region. Mar. Biol. 129:309-317.
Morrice, J. A., Kelly, J. R., Trebitz, A. S., Cotter, A. M., and M. L. Knuth. 2004.
Temporal dynamics of nutrients (N and P) and hydrology in a Lake Superior coastal wetland. J. Great Lakes Res. 30(Supplement 1):82-96.
Morris, R. M., Frazer, C. D., and C. A. Carlson. 2012. Basin-scale patterns in the
abundance of SAR11 subclades, marine Actinobacteria (OM1), members of the Roseobacter clade and OCS116 in the South Atlantic. Environ. Microbiol. Doi:10.1111/j.1462-2920.2011.02694.x
Morris, R. M., Rappe, M. S. Connon, S. A., Vergin, K. L., Siebold, W. A., Carlson, C.
A., and S. J. Giovannoni. 2002. SAR11 clade dominates ocean surface bacterioplankton communities. Nature. 420:806-810.
Morris, R. M. and K. L. Vergin. 2005. Temporal and spatial response of bacterioplankton
lineages to annual convective overturn at the Bermuda Atlantic Time-series Study site. Limnol. Oceanogr. 50:1687-1696.
MPCA (Minnesota Pollution Control Agency). 2008. Findings of Fact-In the matter of a
request for issuance of the SDS General Permit MNG300000 for ballast water discharges from vessels transiting Minnesota state waters of Lake Superior www.pca.state.mn.us/index.php/view-document.html?gid=10739 (Accessed 30 June 2012)
129
MPCA/WDNR (Minnesota Pollution Control Agency/Wisconsin Department of Natural Resources). 1992. The St. Louis River System Remedial Action Plan, Stage One. Available at http://www.stlouisriver.org/rap.html. (Accessed 30 June 2012)
Mueller-Spitz, S. R., Goetz, G. W., and S. L. McLellan. 2009. Temporal and spatial
variability in nearshore bacterioplankton communities of Lake Michigan. FEMS Microbiol. Ecol. 67:511-522.
Muylaert, K., Van der Gucht, K., Vloemans, N., De Meester, L., Gillis, M., and W.
Vyverman. 2002. Relationship between bacterial community composition and bottom-up versus top-down variables in four eutrophic shallow lakes. Appl. Environ. Microbiol. 68:4740-4750.
Nakagawa, S., Takai, K., Inagaki, F., Hirayama, H., Nunoura, T., Horikoshi, K., and Y.
Sako. 2005. Distribution, phylogenetic diversity and physiological characteristics of epsilon-Proteobacteria in a deep sea hydrothermal field. Environ. Microbiol. 7:1619-1632.
Nemergut, D. R., Costello, E. K., Hamady, M., Lozupone, C., Jiang, L., Schmidt, S. K.,
Fierer, N., Townsend, A. R., Cleveland, C. C., Stanish, L, and R. Knight. 2011. Global patterns in the biogeography of bacterial taxa. Environ. Microbiol. 13:135-144.
Nold, S. C., and G. Zwart. 1998. Patterns and governing forces in aquatic microbial
communities. Aquat. Ecol. 32:17-35. Nübel, U., Engelen, B., Felske, A., Snaidr, J., Wieshuber, A., Amann, R.I., Ludwig, W.,
and H. Backhaus. 1996. Sequence heterogeneities of genes encoding 16S rRNAs in paenibacillus polymyxa detected by temperature gradient gel electrophoresis. J. Bacteriol. 178:5636-5643.
Obernosterer, I., and R. Benner. 2004. Competition between biological and
photochemical processes in the mineralization of dissolved organic carbon. Limnol. Oceanogr. 49:117-124.
Osborn, A. M., Moore, E. R. B., and K. N. Timmis. 2000. An evaluation of terminal-
restriction fragment length polymorphism (T-RFLP) analysis for the study of microbial community structure and dynamics. Environ. Microbiol. 2:39-50.
O’Sullivan, L. A., Weightman, A. J., and J. C. Fry. 2002. New degenerate Cytophaga-
Flexibacter-Bacteroidetes-Specific 16S ribosomal DNA-targeted oligonucleotide probes reveal high bacterial diversity in River Taff epilithon. Appl. Environ. Microb. 68:201-210.
130
Pace, M. L. and E. Funke. 1991. Regulation of planktonic microbial communties by nutrients and herbivores. Ecology 72:904-914.
Pääbo, S., Irwin, D. M., and A. C. Wilson. 1990. DNA damage promotes jumping
between templates during enzymatic amplification. J. Biol. Chem. 265:4718-4721.
Peck, J. E. 2010. Multivariate analysis for community ecologists: Step-by-step using PC-
ORD. MjM Software Design, Gleneden Beach, OR. Pedrós-Alió, C. 2006. Marine microbial diversity: can it be determined? Trends
Microbiol. 14:257-263. Peterson, G. S., Hoffman, J. C., Trebitz, A. S., West, C. W., and J. R. Kelly. 2011.
Establishment patterns of non-native fishes: Lessons from the Duluth-Superior Harbor and lower St. Louis River, an invasion-prone Great Lakes coastal ecosystem. J. Great Lakes Res. 37:349-358.
Pettibone, G. W., Irvine, K. N., and K. M. Monahan. 1996. Impact of a ship passage on
bacteria levels and suspended sediment characteristics in the Buffalo River, New York. Wat. Res. 30:2517-2521.
Piñeiro-Vidal, M., Carballas, C. G., Gómex-Barreiro, O, Riaza, A., and Y. Santos. 2008a.
Tenacibaculum soleae sp. nov., isolated from diseased sole (Solea senegalensis Kaup). Int. J. Syst. Evol. Mic. 58:881-885.
Piñeiro-Vidal, M, Riaza, A., and Y. Santos. 2008b. Tenacibaculum discolor sp. nov. and
Tenacibaculum gallaicum sp. nov., isolated from sole (Solea senegalensis) and turbot (Psetta maxima) culture systems. Int. J. Syst. Evol. Mic. 58:21-25.
Polz, M., and C. Cavanaugh. 1998. Bias in template-to-product ratios in multi-template
PCR. Appl. Environ. Microbiol. 64:3724-3730. Pommier, T., Canbäck, B., Riemann, L., Boström, K. H., Simu, K., Lundberg, P., Tunlid,
A., and Å. Hagström. 2006. Global patterns of diversity and community structure in marine bacterioplankton. Mol. Ecol. 16:867-880.
Porter, K. G., and Y. S. Feig. 1980. The use of DAPI for identifying aquatic microflora.
Limnol. Oceanogr. 25:943-948. van der Putten, W. H., Klironomos, J. N., and D. A. Wardle. 2007. Microbial ecology of
biological invasions. ISME J. 1:28-37.
131
Rainey, F. A., Ward, N., Sly, L. I., and E. Stackebrandt. 1994. Dependence on the taxon composition of clone libraries for PCR amplified, naturally occurring 16S rDNA, on the primer pair and the cloning system used. Experientia 50:796-797.
Ramette, A. 2007. Multivariate analyses in microbial ecology. FEMS Microbiol Ecol.
62:142-160. Reardon, J., Foreman, J. A., and R. L. Searcy. 1966. New reactants for the colorimeteric
determination of ammonia. Clinical Chimica Acta 14:403-405. Reddy, K. R., Fisher, M. M., and D. Ivanoff. 1996. Resuspension and diffusive flux of
nitrogen and phosphorus in a hypereutrophic lake. J. Environ. Qual. 25:363-371. Rees, G. N., Baldwin, D. S., Watson, G. O., Perryman, S., and D. L. Nielson. 2004.
Ordination and significance testing of microbial community composition derived from terminal restriction fragment length polymorphisms: application of multivariate statistics. A. Van. Leeuw. 86:339-347.
Reysenbach, A. L., Giver, L. J., Wickham, G. S., and N. R. Pace. 1992. Differential
amplification of rRNA genes by polymerase chain reaction. Appl. Environ. Microbiol. 58:3417-3418.
Ricciardi, A. 2006. Patterns of invasion in the Laurentian Great Lakes in relation to
changes in vector activity. Diversity Distrib. 12:425-433. Ricciardi, A., and H. H. MacIsaac. 2011. Fifty years of invasion ecology: the legacy of
Charles Elton. 1st ed. Ed. D. M. Richardson. Blackwell. Print. Ricciardi, A., Palmer, M. E., and N. D. Yan. 2011. Should biological invasions be
managed as natural disasters? BioScience 61:312-317. Roberts, M. S., and F. M. Cohan. 1995. Recombination and migration rates in natural
populations of Bacillus subtilis and Bacillus mojavensis. Evolution 49:1081-1094. Rodrigues, S. M., de Carvalho, M., Mestre, T., Ferreira, J. J., Coelho, M., Peralta, R., and
P. Vale. 2012. Paralytic shellfish poisoning due to ingestion of Gymnodinium catenatum contaminated cockles—application of the AOAC HPLC official method. Toxicon 59:558-566.
Roman, M. R., Holliday, D. V., and L. P. Sanford. 2001. Temporal and spatial patterns
of zooplankton in the Chesapeake Bay turbidity maximum. Mar. Ecol. Prog. Ser. 213:215-227.
132
Rothlisberger, J. D., Finnoff, D. C., Cooke, R. M., and D. M. Lodge. 2012. Ship-borne nonindigenous species diminish Great Lakes ecosystems services. Ecosystems 15:462-476.
Rouse, J. D., Bishop, C. A., and J. Struger. 1999. Nitrogen pollution: an assessment of its
threat to amphibian survival. Environ. Health Persp. 107:799-803. Ruiz, G. M., Rawlings, T. K., Dobbs, F. C., Drake, L. A., Mullady, T. Huq, A., and R. R.
Colwell. 2000. Global spread of microorganissm by ships. Nature 408:49-50. Ruiz, G. M., and D. F. Reid. 2007. Current state of understanding about the effectiveness
of ballast water exchange (BWE) in reducing aquatic nonindigenous species (ANS) introductions to the Great Lakes Basin and Chesapeake Bay, USA: synthesis and analysis of existing information. NOAA Technical Memorandum GLERL-142.
Rup, M. P., Bailey, S. A., Wiley, C. J., Minton, M. S., Miller, A. W., Ruiz, G. M., and H.
J. MacIsaac. 2010. Domestic ballast operations on the Great Lakes: potential importance of Lakers as a vector for introduction and spread of nonindigenous species. Can. J. Fish. Aquat. Sci. 67:256-268.
Schroeder, M. E., and C. R. Collier. 1966. Water-quality variations in the Cuyahoga
River at Cleveland, Ohio. U. S. Geological Survey Prof. Paper 550-C:251-255. Schütte, U. M., Abdo, Z., Bent, S. J., Shyu, C., Williams, C. J., Pierson, J. D., and L. J.
Forney. 2008. Advances in the use of terminal restriction fragment length polymorphism (T-RFLP) analysis of 16S rRNA genes to characterize microbial communities. Appl. Microbiol. Biotechnol. 80:365-380.
Seiden, J. M., Way, C. J., and R. B. Rivkin. 2010. Microbial hitchhikers: dynamics of
bacterial populations in ballast water during a trans-Pacific voyage of a bulk carrier. Aquat. Invas. 5:13-22. doi: 10.3391/ai.2010.5.1.3
Seiden, J. M., Way, C. J., and R. B. Rivkin. 2011. Bacterial dynamics in ballast water
during trans-oceanic voyages of bulk carriers: environmental controls. Mar. Ecol. Prog. Ser. 436:145-159.
Shannon, C. E., and W. Weaver. 1949. The mathematical theory of communication.
University of Illinois Press, Urbana, IL. Shapiro, S. S., and M. B. Wilk. 1965. An analysis of variance test for normality
(Complete Samples). Biometrika. 52:591-611.
133
Shiah, F., and H. W. Ducklow. 1994. Temperature and substrate regulation of bacterial abundance, production and specific growth rate in Chesapeake Bay, USA. Mar. Ecol. Prog. Ser. 103:297-308.
Simek, K., Nedoma, J., Pernthaler, J., Posch, T., and J. R. Dolan. 2002. Altering the
balance between bacterial production and protistan bacterivory triggers shifts in freshwater bacterial community composition. A. Van. Leeuw. J. Microb. 81:453-463.
Simon, N. S. 1989. Nitrogen cycling between sediment and the shallow-water column in
the transition zone of the Potomac River and Estuary. II. The role of wind-driven resuspension and adsorbed ammonium. Estuar. Coast. Shelf S. 28:531-547.
Simonato, F., P. R. Gómez-Pereira, Fuchs, B. M., and R. Amann. 2010. Bacterioplankton
diversity and community composition in the Southern Lagoon of Venice. Syst. Appl. Microbiol. 33:128-138.
Smith, B. R., and J. J. Tibbles. 1980. Sea lamprey (Petromyzon marinus) in Lakes Huron,
Michigan, and Superior: history of invasion and control, 1936-78. Can. J. Fish. Aquat. Sci. 37:1780-1801.
Smith, L. D., Wonham, M. J., McCann, L. D., Ruiz, G. M., Hines, A. H., and J. T.
Carlton. 1999. Invasion pressure to a ballast-flooded estuary and an assessment of inoculant survival. Biol. Invasions 1:67-87.
Soderberg, R. W., and J. W. Meade. 1991. The effects of ionic strength on un-ionized
ammonia concentration. Prog. Fish-Cult. 53:118-120. Sogin, M. L., Morrison, H. G., Huber, J. A., Welch, D. M., Huse, S. M., Neal, P. R.,
Arrieta, J. M., and G. J. Herndl. 2006. Microbial diversity in the deep sea and the underexplored “rare biosphere”. Proc. Natl. Acad. Sci. 103:12115-12120.
Sterner, R. W. 2011. C:N:P stoichiometry in Lake Supeior: freshwater sea as end
member. Inland Waters 1:29-46. Stortz, K. R. M. Sydor. 1980. Transports in the Duluth-Superior Harbor. J. Great Lakes
Res. 6:223-231. Strickland, J. D. H. and T. R. Parsons. 1968. A practical manual of sea water analysis.
Fish. Res. Board Can. Bull. No. 167. Queen’s Printer, Ottawa, Ont. Sun, B., Mouland, R., Way, C., and R. B. Rivkin. 2010. Redistribution of heterotrophic
prokaryotes through ballast water: A case study from the west coast of Canada. Aquatic Invasions 5:5-11.
134
Suzuki, M., Nakagawa, Y., Harayama, S., and S. Yamamoto. 2001. Phylogenetic analysis
and taxonomic study of marine Cytophaga-like bacteria: proposal for Tenacibaculum gen. nov. with Tenacibaculum maritimum comb. nov., and Tenacibaculum ovolyticum comb. nov., and description of Tenacibaculum mesophilum sp. nov. and Tenacibaculum amylolyticum sp. nov. Int. J. Syst. Evol. Micr. 51:1639-1652.
Tamura, K., Dudley, J., Masatoshi, N., and S. Kumar. 2007. MEGA4: Molecular
evolutionary genetics analysis (MEGA) Software version 4.0. Mol. Biol. Evol. 24:1596-1599.
Taylor, M. D., MacKenzie, L. M., Dodgshun, T. J., Hopkins, G. A., de Zwart, E. J., and
C. D. Hunt. 2007. Trans-Pacific shipboard trials on planktonic communities as indicators of open ocean ballast water exchange. Mar. Ecol. Prog. Ser. 350:41-54.
Tebbe, C. C., and W. Vahjen. 1993. Interference of humic acids and DNA extracted
directly from soil in detection and transformation of recombinant DNA from bacteria and yeast. Appl. Environ. Microbiol. 59:2657-2665.
Tomaru, A., Kawachi, M., Demura, M., and Y. Fukuyo. 2010. Denaturing gradient gel
electrophoresis shows that bacterial communities change with mid-ocean ballast water exchange. Mar. Pollut. Bull. 60:299-302.
Trebitz, A. S., West, C. W., Hoffman, J. C., Kelly, J. R., Peterson, G. S., I. A.
Grigorovich. 2010. Status of non-indigenous benthic invertebrates in the Duluth-Superior Harbor and the role of sampling methods in their detection. J. Great Lakes Res. 36:747-756.
Tuominen, T. 2010. Personal communication. U.S. Congressional Research Service (CRS). 2012. Ballast water management to combat
invasive species (RL32344; April 10, 2012), by Eugene H. Buck. Available at www.crs.gov (Accessed: 7 June 2012)
U.S. Environmental Protection Agency (EPA). 2008. Predicting future introductions of
nonindigenous species to the Great Lakes. National Center for Environmental Assessment, Washington, DC; EPA/600/R-08/066F. Available from the National Technical Information Service, Springfield, VA, and http://www.epa.gov/ncea.
U.S. Environmental Protection Agency (EPA). 2012. Fact Sheet: National Coastal
Condition Report IV. April 2012. Available at http://water.epa.gov/type/oceb/assessmonitor/nccr/index.cfm (Accessed 8 June 2012)
135
U.S. Environmental Protection Agency (EPA). 1979. Aqueous ammonia equilibrium-
tabulation of percent un-ionized ammonia. EPA-600/3-79-091. Washington, D.C. U.S. Geological Survey (USGS). 2006. Nutrients in streams and rivers across the nation-
1992-2001. National Water-Quality Assessment Program. Scientific Investigations Report 2006-5107.
Venter, C. J., Remington, K., Heidelberg, J. F., Halpern, A. L., Rusch, D., Eisen, J. A.,
Wu, D., Paulsen, I., Nelson, K. E., Nelson, W., Fouts, D. E., Levy, S., Knap, A. H., Lomas, M. W., Nealson, K. H., White, O., Peterson, J., Hoffman, J., Parsons, R., Baden-Tillson, H., Rogers, Y. H., and H. O. Smith. 2004. Environmental genome shotgun sequencing of the Sargasso Seas. Science. 304:66-74.
Vander Zanden, M. J., and J. D. Olden. 2008. A management framework for preventing
the secondary spread of aquatic invasive species. Can. J. Fish. Aquat. Sci. 65:1512-1522.
Villac, M. C., and I. Kaczmarska. 2011. Estimating propagule pressure and viability of
diatoms detected in ballast tank sediments of ships arriving at Canadian ports. Mar. Ecol. Prog. Ser. 425:47-61.
Wagner, D. M., Lemire, R. S., and D. W. Anderson. 1976. Water quality of sixteen
Minnesota rivers tributary to Lake Superior. J. Great Lakes Res. 2:111-123. Wakelin, S. A., Colloff, M. J., R. S. Kookana. 2008. Effect of wastewater treatment plant
effluent on microbial function and community structure in the sediment of a freshwater stream with variable seasonal flow. Appl. Environ. Microbiol. 74:2659-2668.
Wang, C., Hsu, M., and A. Y. Kuo. 2004. Residence time of Danshuei River estuary,
Taiwan. Estuar. Coast Shelf S. 60:381-393. Ward, B. B., and G. D. O’Mullan. 2002. Worldwide distribution of Nitrosococcus oceani,
a marine ammonia-oxidizing 𝛾–Proteobacterium, detected by PCR and sequencing of 16S rRNA and amoA genes. Appl. Environ. Microbiol. 68:4153-4157.
Warnecke, F., Amann, R., and J. Pernthaler. 2004. Actinobacterial 16S rRNA genes from
freshwater habitats cluster in four distinct lineages. Environ. Microbiol. 6:242.253.
Wasmund, N., Topp, I., and D. Schories. 2006. Optimising the storage and extraction of
chlorophyll samples. Oceanologia 48:125-144.
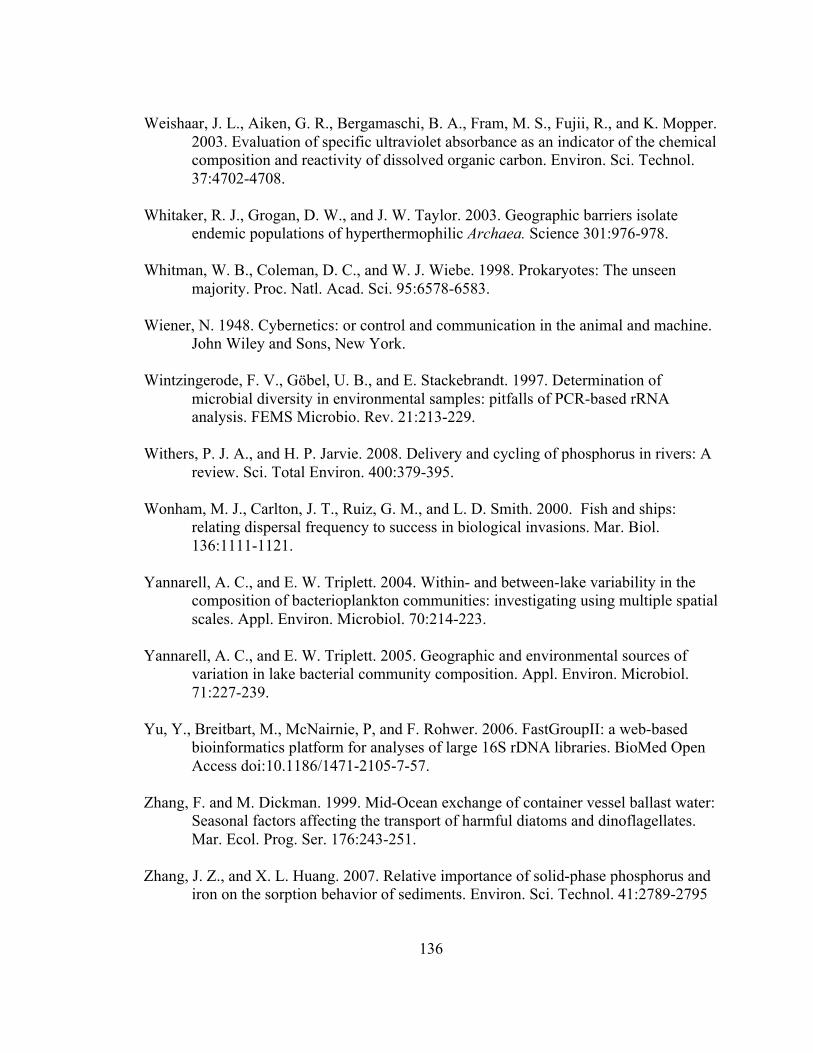
136
Weishaar, J. L., Aiken, G. R., Bergamaschi, B. A., Fram, M. S., Fujii, R., and K. Mopper. 2003. Evaluation of specific ultraviolet absorbance as an indicator of the chemical composition and reactivity of dissolved organic carbon. Environ. Sci. Technol. 37:4702-4708.
Whitaker, R. J., Grogan, D. W., and J. W. Taylor. 2003. Geographic barriers isolate
endemic populations of hyperthermophilic Archaea. Science 301:976-978. Whitman, W. B., Coleman, D. C., and W. J. Wiebe. 1998. Prokaryotes: The unseen
majority. Proc. Natl. Acad. Sci. 95:6578-6583. Wiener, N. 1948. Cybernetics: or control and communication in the animal and machine.
John Wiley and Sons, New York. Wintzingerode, F. V., Göbel, U. B., and E. Stackebrandt. 1997. Determination of
microbial diversity in environmental samples: pitfalls of PCR-based rRNA analysis. FEMS Microbio. Rev. 21:213-229.
Withers, P. J. A., and H. P. Jarvie. 2008. Delivery and cycling of phosphorus in rivers: A
review. Sci. Total Environ. 400:379-395. Wonham, M. J., Carlton, J. T., Ruiz, G. M., and L. D. Smith. 2000. Fish and ships:
relating dispersal frequency to success in biological invasions. Mar. Biol. 136:1111-1121.
Yannarell, A. C., and E. W. Triplett. 2004. Within- and between-lake variability in the
composition of bacterioplankton communities: investigating using multiple spatial scales. Appl. Environ. Microbiol. 70:214-223.
Yannarell, A. C., and E. W. Triplett. 2005. Geographic and environmental sources of
variation in lake bacterial community composition. Appl. Environ. Microbiol. 71:227-239.
Yu, Y., Breitbart, M., McNairnie, P, and F. Rohwer. 2006. FastGroupII: a web-based
bioinformatics platform for analyses of large 16S rDNA libraries. BioMed Open Access doi:10.1186/1471-2105-7-57.
Zhang, F. and M. Dickman. 1999. Mid-Ocean exchange of container vessel ballast water:
Seasonal factors affecting the transport of harmful diatoms and dinoflagellates. Mar. Ecol. Prog. Ser. 176:243-251.
Zhang, J. Z., and X. L. Huang. 2007. Relative importance of solid-phase phosphorus and
iron on the sorption behavior of sediments. Environ. Sci. Technol. 41:2789-2795

137
Zwart, G., Crump, B. C., Kamst-van Agterveld, M. P., Hagen, F, and S. Han. 2002. Typical freshwater bacteria: an analysis of available 16S rRNA gene sequences from plankton of lakes and rivers. Aquat. Microb. Ecol. 28:141-155.

138
APPENDIX
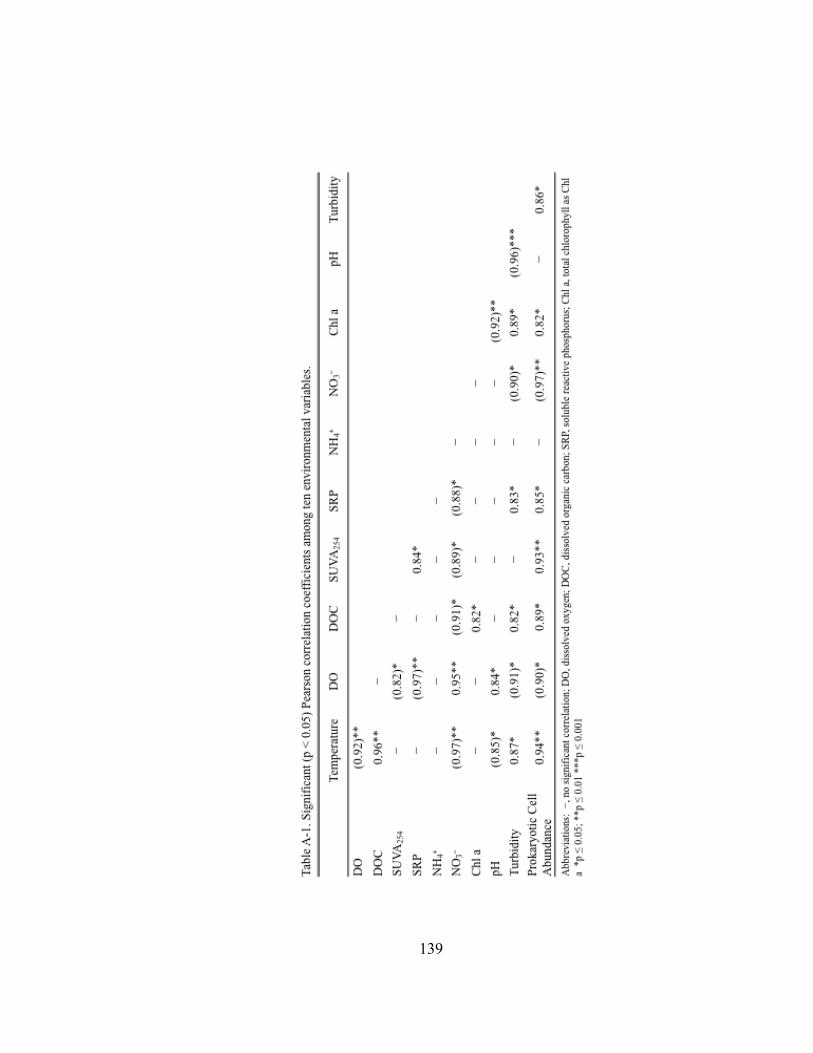
139
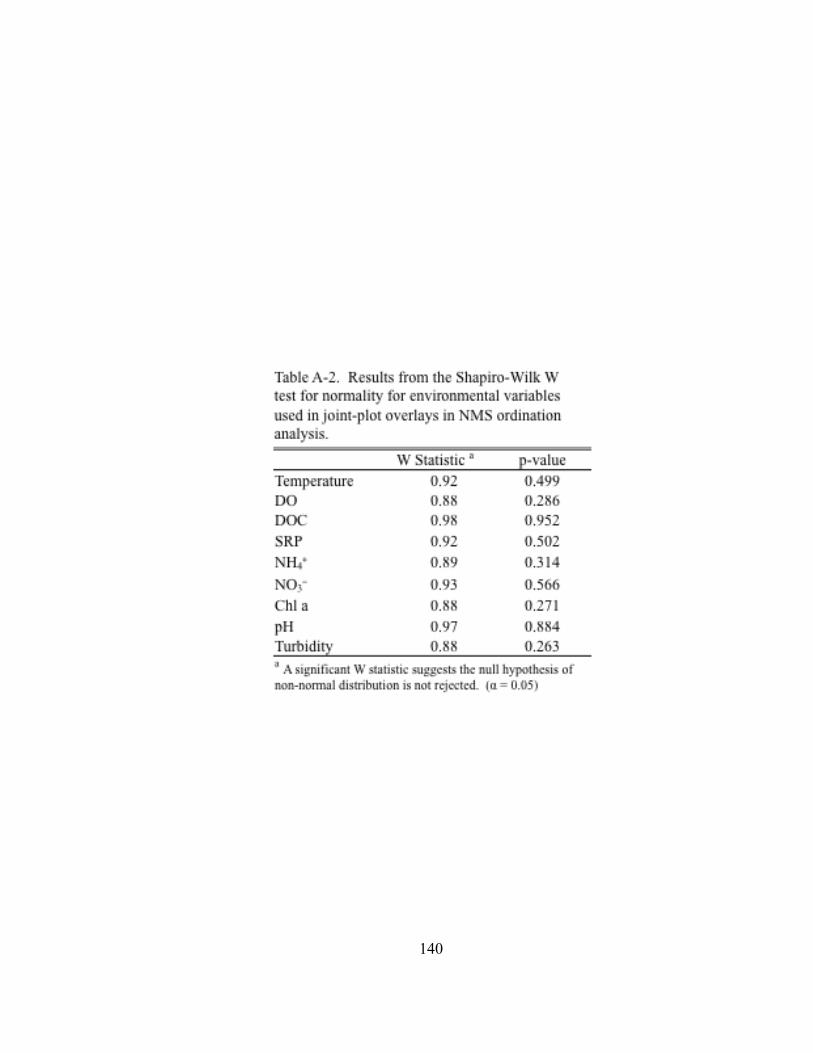
140
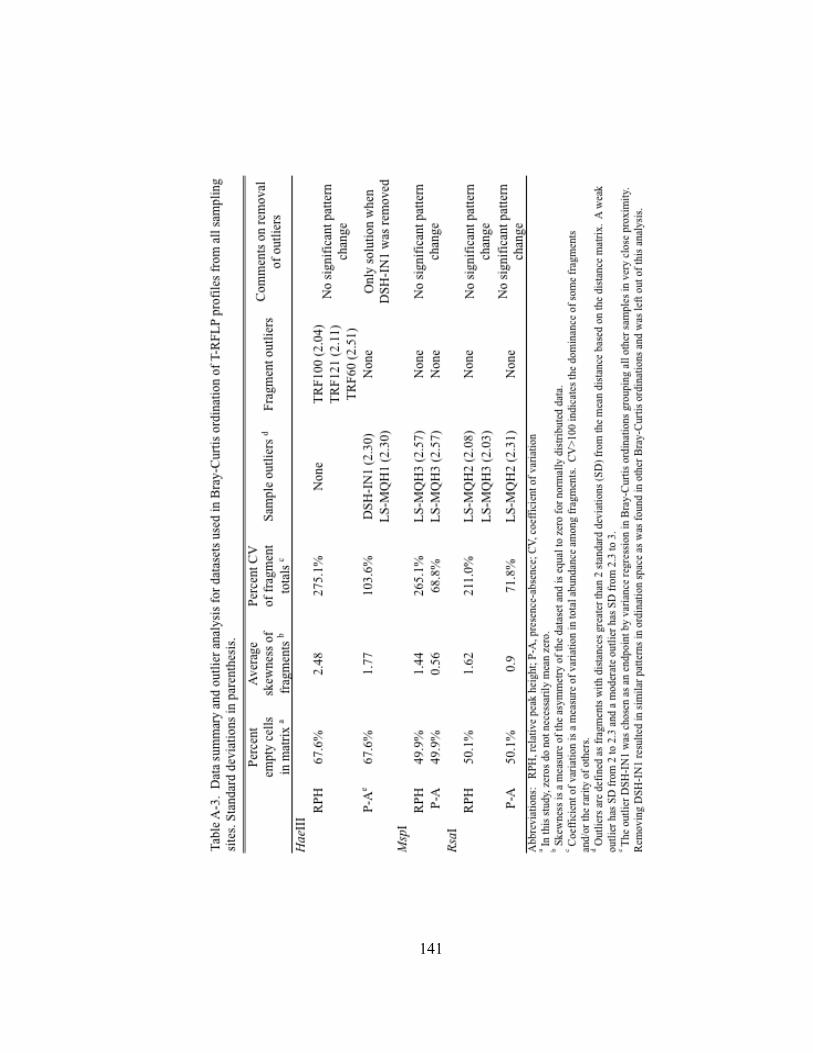
141
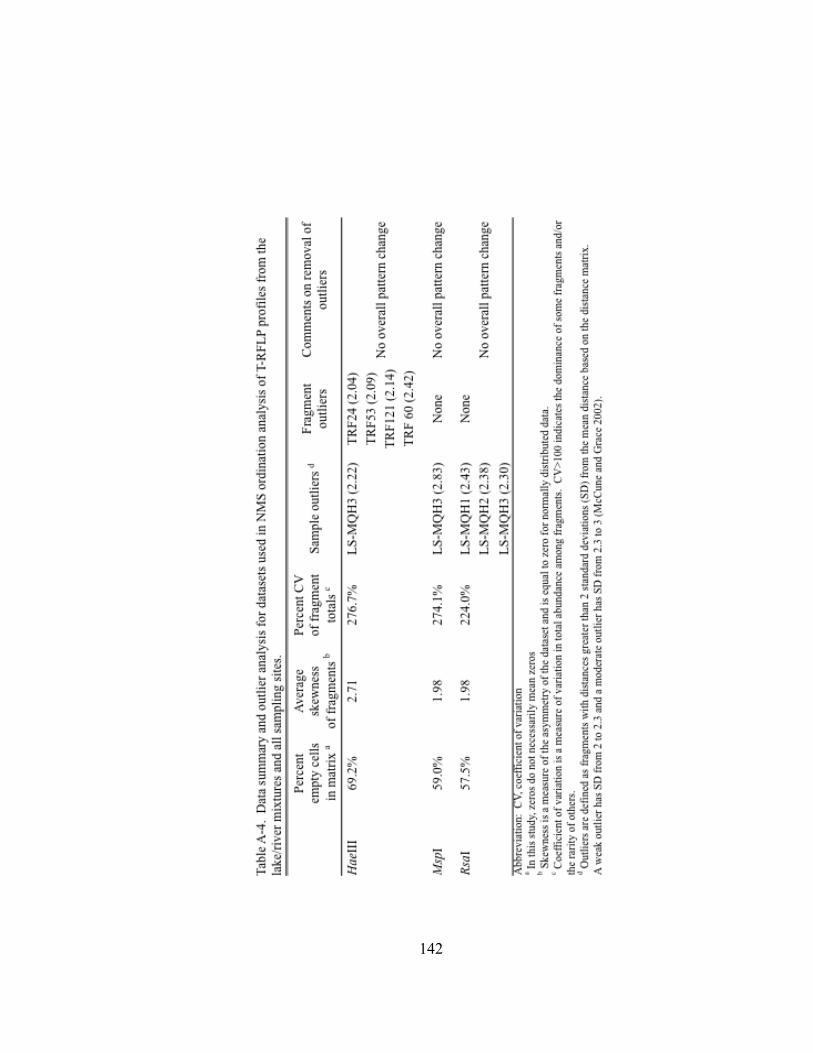
142
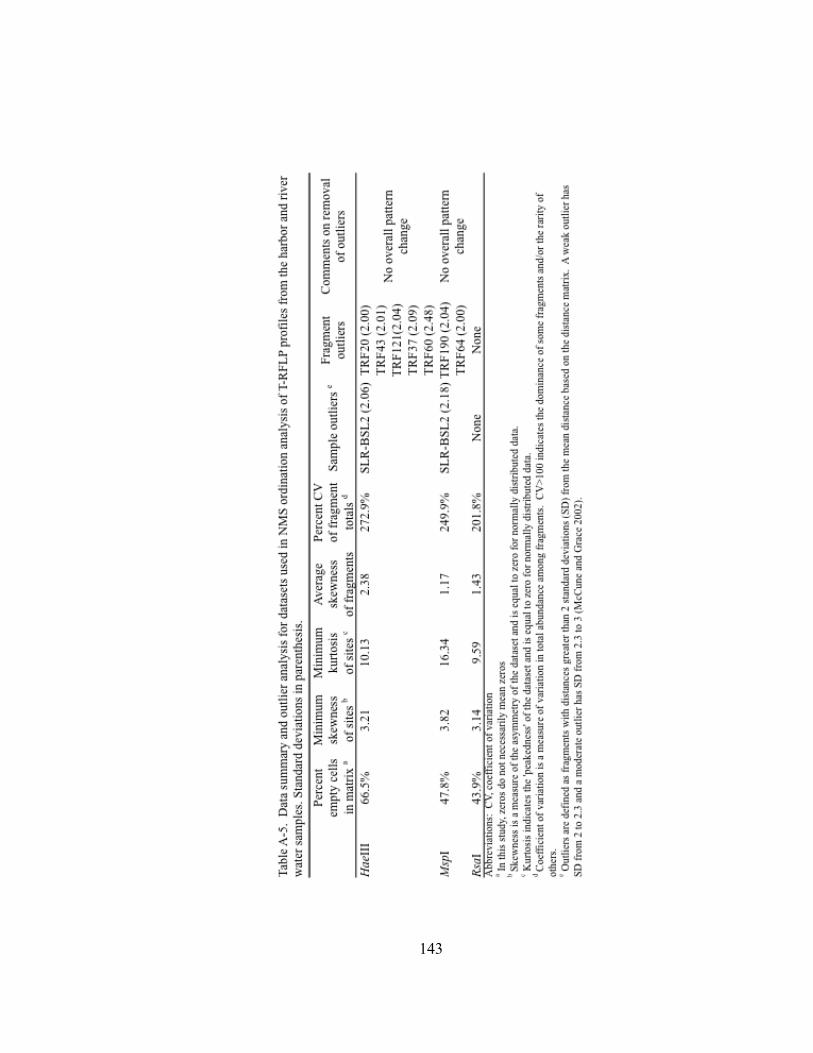
143

144

145
146
Figure A.1. Histogram showing the volume and source of ballast water (in metric tons, MT) that was discharged into the Duluth-Superior Harbor by commercial ships during the 2009-shipping season.
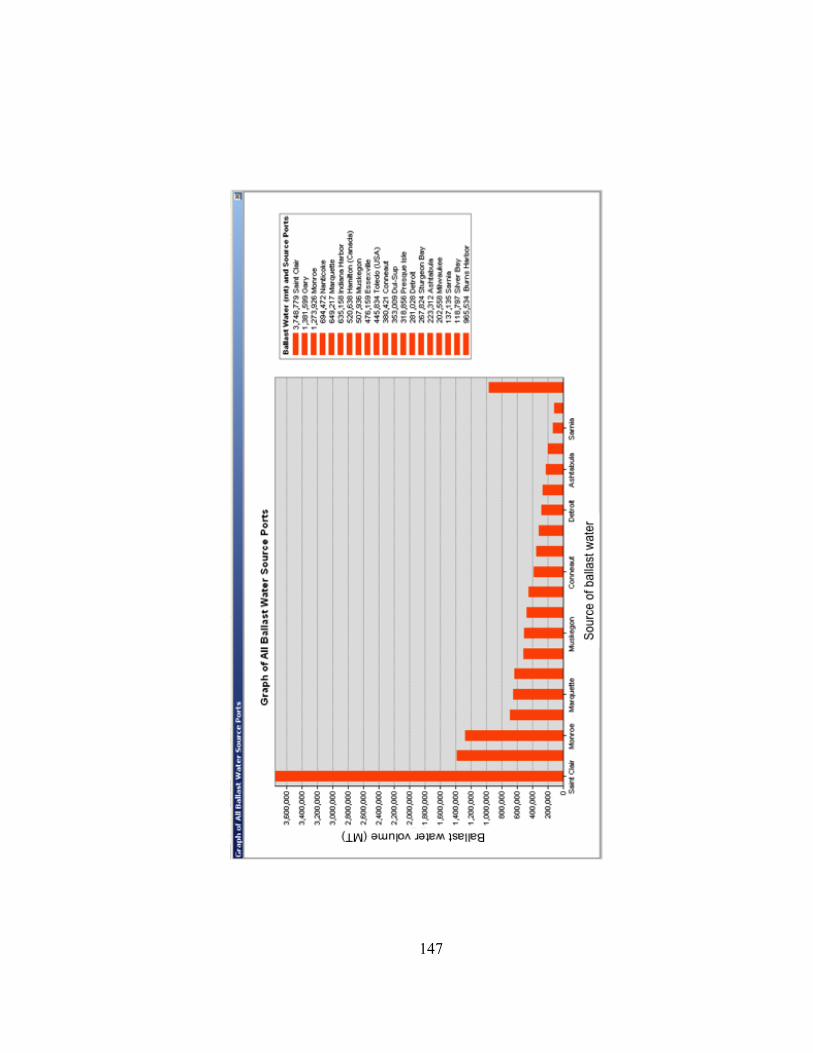
147
148
Figure A.2. Identity of the bacterial phylum for the BLAST library sequences that was the best match to clones in the four 16S rRNA gene clone libraries constructed for the three ballast water samples and the inner harbor of the Duluth-Superior Harbor.
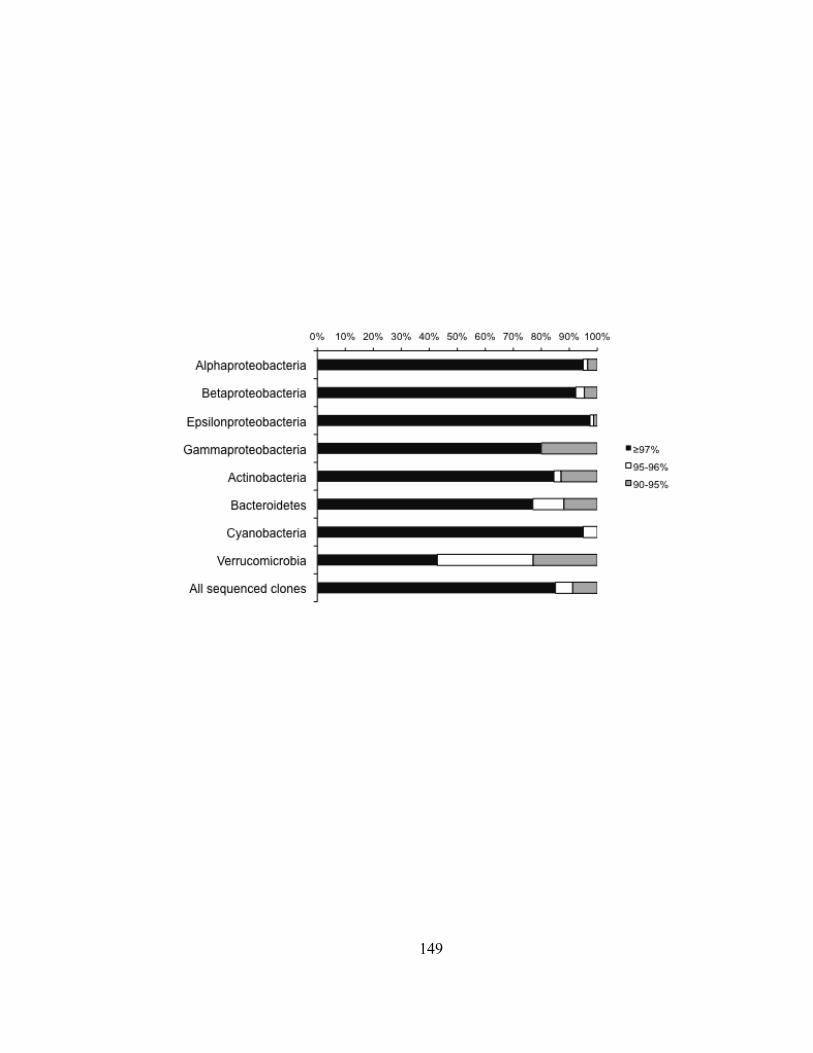
149