comparison of the dielectric response obtained from fluorescence upconversion measurements and...
TRANSCRIPT
Published: May 06, 2010
r 2010 American Chemical Society 3630 dx.doi.org/10.1021/jp1008225 | J. Phys. Chem. A 2011, 115, 3630–3641
ARTICLE
pubs.acs.org/JPCA
Comparison of the Dielectric Response Obtained from FluorescenceUpconversion Measurements and Molecular Dynamics Simulationsfor Coumarin 153-Apomyoglobin Complexes and Structural Analysisof the Complexes by NMR and Fluorescence MethodsSayantan Bose,† Ramkrishna Adhikary,† Charles A. Barnes,† D. Bruce Fulton,‡ Mark S. Hargrove,‡
Xueyu Song,† and Jacob W. Petrich*,†
†Department of Chemistry and ‡Department of Biochemistry, Biophysics, and Molecular Biology, Iowa State University, Ames, Iowa50011, United States
ABSTRACT: We present a comparison of the dielectric response obtained from fluo-rescence upconversion experiments and from molecular dynamics simulations of thecomplexes of coumarin 153 with five apomyoglobins (apoMbs): wild-type horse heart(HH-WT) and those of wild-type sperm whale (SW-WT); its two triple mutants, L29F/H64Q/V68F and H64L/V68F/P88A; and its double mutant, L29F/V68L. Compar-isons between experimental and simulated solvation relaxation functions, C(t)s, for thewild-type proteins range from very good to excellent. For the three mutants weinvestigated, however, agreement between experiment and simulation was considerablyinferior. Thus, an NMR study of the complex of the HH-WT complex apoMb, andfluorescence energy transfer and anisotropy studies of the five complexes, wereperformed to investigate the structures upon which the simulations were based. The NMR measurements confirm our earlierconclusions that the C153 lies in the heme pocket of the HH-WT apoMb. For the wild-type complexes, fluorescence energy transfermeasurements provide two rise times, suggesting a definite spatial relationship between the two Trp donors and the C153 acceptor.These results confirm the structural integrity of the wild-type complexes and validate the initial structures used for the moleculardynamics simulations. On the other hand, the three mutants provided single exponential rise times for energy transfer, suggestingthat the position of the C153 used in the simulations may have been in error or that the C153 is mobile on the time scale of theenergy transfer experiment. Fluorescence anisotropy studies also suggest that the double mutant was not structurally intact.Furthermore, examination of these systems demonstrates the sensitivity of C153 to its environment and permits the observation ofdifferences in the heme pockets. These results point to the importance of structural characterization of modified proteins used instudies of the dielectric response and suggest strategies for performing molecular dynamics simulations of modified proteins.
’ INTRODUCTION
The study of solvation dynamics is a powerful tool for under-standing the dielectric relaxation of solvating media. For homo-geneous dielectric fluids, solvation dynamics can be described bylinear response theory.1-12 A simple dielectric continuumtheory13-15 adequately describes their dielectric response, whichled to several successful comparisons between theory andexperiments.11,12,16,17 However, for inhomogeneous dielectricmaterials, such as proteins, dielectric fluctuations are severelyrestricted due to the inherent constraints of the materials. Thedelicate balance in the electrostatic interactions play an impor-tant role in controlling structure, function, and dynamics inproteins.18-22 The nature of the interactions is heterogeneousbecause the charged and polar groups in protein can interact overlong distances with each other and surrounding solvent mole-cules. A large protein can have its dielectric response vary fromplace to place.23-29 A sudden change in the charge distributionfor many elementary processes such as electron and energytransfer in a protein causes dielectric relaxation due to theadjustment of its structure in response to the new chargedistribution. Traditional dielectric continuum theory assumes
that there is only one intrinsic microscopic length scale. Hence,such theory is questionable when applied to inhomogeneousdielectric materials. As a result, understanding the dielectricresponse in proteins is very challenging due to the existence ofdifferent length scales of relaxation.
In a series of papers,30-33 we have discussed the extensiveliterature on this topic and have suggested the utility of using thefluorescent probe, coumarin 153 (C153), to study the dielectricresponse of monomeric hemoglobins, such as myoglobin. Thechoice of C153 was in large part inspired by the work of Coccoand Lecomte who characterized the complex of the fluorescentdye ANS (Figure 1a) with apomyoglobin (apoMb) using nuclearmagnetic resonance (NMR) spectroscopy and proved that ANSresides in the distal side of the heme pocket.34 Using 2D- DQF-COSY andNOESY experiments, they showed that theHa andHb
Special Issue: Graham R. Fleming Festschrift
Received: January 27, 2010Revised: April 2, 2010
3631 dx.doi.org/10.1021/jp1008225 |J. Phys. Chem. A 2011, 115, 3630–3641
The Journal of Physical Chemistry A ARTICLE
protons of ANS have cross peaks with heme pocket residues suchas His64, Val67, Val68, and Ala71.
We, thus, initially considered the probe ANS,34 for which thereis a structure of its complex with apoMb. This probe is not,however, ideal because its absorption spectrum is complicated byoverlapping electronic states.35 Even if internal conversion fromhigher-lying states to the lower fluorescent state is faster thansolvation dynamics, as has been suggested to be the case inTrp,36-39
an accurate determination of the reorganization energy40,41 based onthe steady-state spectra becomes very difficult. In addition, whileANS34,42 as well as other chromophores such as PRODAN,43
DANCA,44 and ANSDMA45 (Figure 1b-d) may bind to the hemepocket of apoMb, they are also capable of charge transfer in theexcited state, which could complicate the interpretation of thefluorescence upconversion results.46
On the other hand, C153 is exquisitely inert, structurally rigid,and is also associated with a large change of dipole moment uponoptical excitation. This is why it is has been so extensivelyemployed as a probe of solvation dynamics.30-33,47-59 We con-sequently opted for C153 as a probe for studying the dielectricresponse of proteins. Elsewhere, we have shown using Job’s plotexperiments that C153 binds to apoMb with a 1:1 stoichiometrywith KD = 6 � 10-6 M.30,31 The ANS-apoMb complex isreported to haveKD= 3� 10-6M.42 The anisotropy decay time(τrot) of C153 when bound to apoMb is 9.2 ns,30 which isconsistent with the slow rotational correlation time of apoMb,60
whereas free C153 exhibits a very fast depolarization time of∼100 ps in bulk solvent.30 More significantly, the anisotropydecay of bound C153 was single-exponential, which supportsrigid binding of coumarin in the heme pocket; because single-exponential decay would not be expected for a surface boundchromophore.61,62
These findings, suggesting that a 1:1, well-defined complex ofC153 and apoMb could be formed, authorized us to performa comparison of the solvation correlation functions (dielectric
responses) obtained from fluorescence upconversion experi-ments and molecular dynamics simulations32 of C153 withwild-type horse heart (HH-WT) apoMb and with apoleghemo-globin (apoLba). This comparison provided excellent agreementbetween experiment and theory and emboldened us to performthe similar set of comparisons presented here for the complexesof C153 with four apoMbs: those of wild-type sperm whale (SW-WT); its two triple mutants, L29F/H64Q/V68F and H64L/V68F/P88A; and its double mutant, L29F/V68L. All of thesemutant proteins do bind heme and fold to form stable holopro-teins. Mutations at each position have various effects on theoxygen binding properties of the holoprotein, and have variouseffects on the stability of the apoprotein. For example, mutationsof HisE7 to an apolar side chain lower oxygen affinity in theholoprotein and increase stability to denaturation. The effects ofmutations at other positions are generally milder. In general,when a polar side chain is introduced into the heme pocket, theresulting mutant apoprotein is less stable.
The intent of this comparison is to initiate a detailed study ofthe effects of individual amino acids on the dielectric responsewith the ultimate goal of developing a new type of model for theresponse.63 The basic philosophy behind such a model is toaccount for the dielectric inhomogeneity of a protein without fullatomistic details. Our previous results have indicated that amodel based on the polarizabilities at the residue level can offera universal description for proteins’ dielectric response.
Despite the encouraging, initial success on this path obtainedwith the horse heart system, the results for the sperm whalesystem revealed themselves to be more complicated. Althoughthe agreement between experiment and theory was excellent forthe SW-WT, the agreement varied for the mutants. Our previouswork suggests no reason to attribute such disagreement to theforce fields used in the simulation but rather to question thestructure of the complex used as the starting point for thesimulation. Thus, un esprit critique requires that painstakingattention be paid to structural details when comparisons arebeingmade between theory and experiment for different proteinsand, in particular, the same proteins with slight modifications.
Our work presents, in outline:1. a comparison of the dielectric response obtained from
fluorescence upconversion experiments and from molecu-lar dynamics simulations of the complexes of coumarin 153with five apoMbs (apoMbs): wild-type horse heart (HH-WT) and those of wild-type sperm whale (SW-WT); itstwo triple mutants, L29F/H64Q/V68F and H64L/V68F/P88A; and its double mutant, L29F/V68L;
2. an NMR study of the complex of C153 with HH-WTapoMb (we have used equine myoglobin, because it con-tains more resolved lines (especially from histidines)compared to the SW-WT64);
3. fluorescence energy transfer and anisotropy studies of thefive complexes to complement the NMR studies.
We believe that this is the most thorough structural character-ization to date of any system, whether it be based on nonnaturalfluorescence probes or mutants, employed for the investigationof the dielectric response of proteins.
’MATERIALS AND METHODS
Coumarin 153 (C153) was purchased from Exciton Inc.(Dayton, OH) and used without further purification. 4-Hydro-xy-2,2,6,6-tetramethylpiperidinyl-1-oxy (TEMPOL) (Figure 1e),
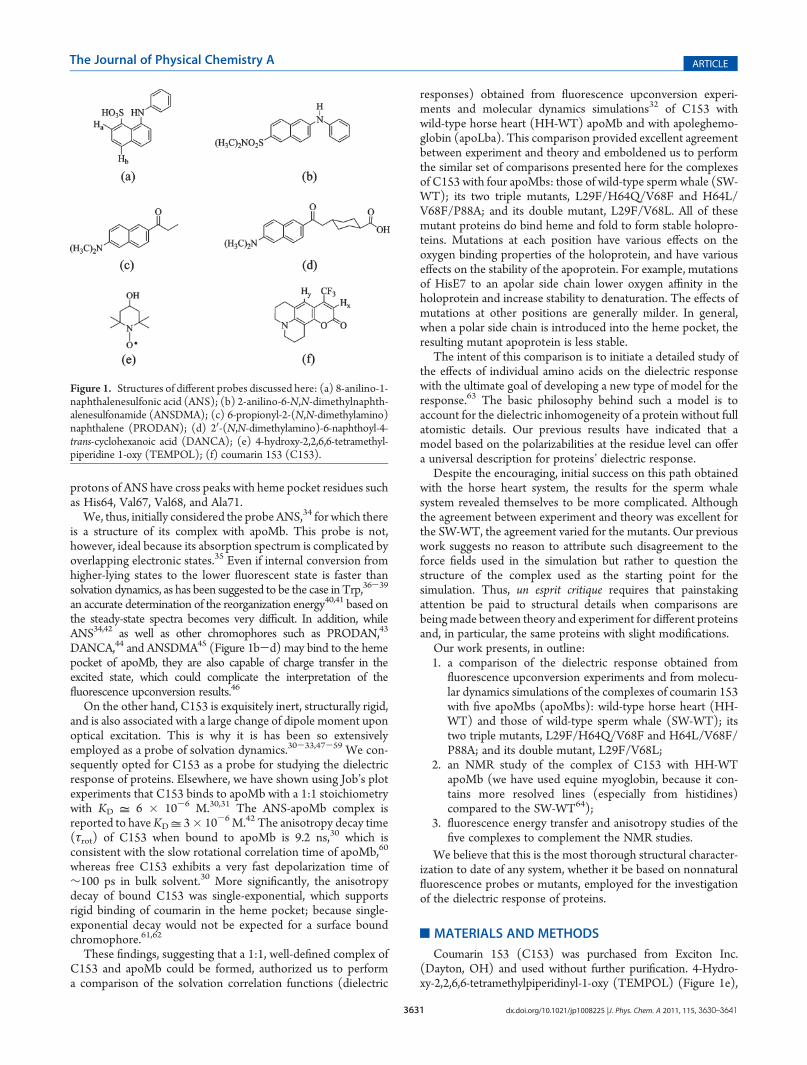
Figure 1. Structures of different probes discussed here: (a) 8-anilino-1-naphthalenesulfonic acid (ANS); (b) 2-anilino-6-N,N-dimethylnaphth-alenesulfonamide (ANSDMA); (c) 6-propionyl-2-(N,N-dimethylamino)naphthalene (PRODAN); (d) 20-(N,N-dimethylamino)-6-naphthoyl-4-trans-cyclohexanoic acid (DANCA); (e) 4-hydroxy-2,2,6,6-tetramethyl-piperidine 1-oxy (TEMPOL); (f) coumarin 153 (C153).
3632 dx.doi.org/10.1021/jp1008225 |J. Phys. Chem. A 2011, 115, 3630–3641
The Journal of Physical Chemistry A ARTICLE
deuterated water (D2O), dimethyl sulfoxide (DMSO-d6), andmethanol (HPLC grade) from Aldrich were used without furtherpurification. Equine myoglobin (Mb) was purchased from Sigma.Recombinant sperm whale myoglobins and its mutants wereconstructed, expressed, and purified as described elsewhere.65,66
Sample Preparation for NMR Experiments. Apoproteinswere prepared using a method described elsewhere.32,67 Proteinconcentrations were kept between ∼1.5 and 2.0 mM for theNMR experiments. Because C153 is sparingly soluble in water, astock solution of 40 mM was prepared in DMSO-d6 and thenadded to the apoMb, keeping the stoichiometry 1:1. The solutionwas shaken for 1 h and then dialyzed against 5 L of pH 7.0 bufferovernight at 4 �C. The solution was then centrifuged andconcentrated using Centricon-3 (Amicon) to 0.5 mL, and theprocess was repeated four times by adding D2O for deuteriumexchange. The protein samples were stored at -20 �C withoutlyophilization. A 0.05MTEMPOL solution was prepared inD2Oand the appropriate microliter volume was added to a 500 μLprotein solution and was equilibrated overnight at 4 �C beforedoing the NMR experiments.Sample Preparation for Fluorescence Measurements.
Concentrations of 1:1 C153/apoMb complexes were maintainedfrom 5.0 � 10-6 to 80 � 10-6 M by adding microliter amountsof 20 � 10
-3
M C153/MeOH to pH 7.0 buffer, keeping theorganic content <0.3% (v/v) in the final sample for all the steady-state and lifetime measurements. The resulting solution wassonicated. For fluorescence upconversion experiments a stocksolution of C153/MeOHwas added to 1.2 mL of∼1.0� 10
-3
Mapoprotein solution, keeping the organic content <3% (v/v) inthe final solution with a 1:1 protein to C153 ratio. The con-centrations of the apoproteins were determined spectrophoto-metrically using an extinction coefficient of 15.2 mM-1 cm-1 at280 nm.30 All samples were equilibrated overnight at 4 �C beforemaking the steady-state or time-resolved measurements.NMR Experiments. NMR spectra were recorded at a sample
temperature of 25 �C using a Bruker Avance 700 spectrometeroperating at a 1H frequency of 700.13 MHz and equipped with a5 mm H/C/N cryoprobe. Experiments were done in puredeuterated solvents in standard 5 mm NMR tubes (Wilmad).1D 1H and 2D 1H-1H NOESY spectra were acquired usingstandard experimental protocols. Very weak solvent saturation(B1 power of 5 Hz) was used during recycling delays and theNOESY mixing time to suppress the residual HOD signal. For1D spectra, 8 scans were accumulated with a sweep width of25252 Hz (36 ppm). For NOESY spectra 400 time incrementseach consisting of 80 scans were acquired with a sweep width inboth dimensions of 9803Hz (14 ppm). TheNOESYmixing timewas 150 ms.Steady-State Measurements. Steady-state absorption spec-
tra were obtained on a Hewlett-Packard 8453 UV-visiblespectrophotometer with 1 nm resolution. Steady-state fluores-cence spectra were obtained on a Spex Fluoromax-4 with a 2 nmbandpass and corrected for lamp spectral intensity and detectorresponse. For absorption and fluorescence measurements, a 3mmpath length quartz cuvette was used. The steady-state spectracan be used to compute the reorganization energy, λ68
λ ¼ p
R¥0 dν ½σaðνÞ - σf ðνÞ�νR¥0 dν ½σaðνÞ þ σf ðνÞ�
ð1Þ
The σa,f are the absorption (or excitation) and emission spectralline shapes, respectively. λ(¥) represents the total Stokes shift,
which is calculated using the steady-state excitation, νex, andemission, ν(¥), spectra. On the other hand, λ(“0”), which is themeasure of intramolecular contribution and not solvent relaxa-tion, is computed using steady-state excitation (νex) and calcu-lated “zero-time” spectra, ν(“0”). These values are collated inTable 3.Time-Resolved Measurements. Lifetime measurements
were made using the time-correlated single-photon counting(TCSPC) apparatus described elsewhere.33,41 The data wereacquired in 1024 channels with a time window of 3.33 ns. Theinstrument response function had a full width at half-maximum(fwhm) of ∼40 ps. A 3 mm path length quartz cuvette was usedfor all the time-resolved measurements. Fluorescence decayswere collected at the magic angle (polarization of 54.7�) withrespect to the vertical excitation light at 266 nm, with ∼40000counts in the peak channel. To obtain the rotational dynamics ofC153, samples were excited at 407 nm and emission wascollected parallel and perpendicular to the polarization of theexcitation light. Anisotropy data were aquired in 1024 channelswith a time window of 22 ns collecting 65530 counts in the peakchannel. The fluorescence upconversion measurements weredone with the apparatus described elsewhere.41 The instrumentresponse function had a full width at half-maximum (fwhm) of300 fs. A rotating sample cell was used. To construct the time-resolved spectra from upconversion measurements, a series ofdecays were collected, typically from 480 to 560 nm at 10 nmintervals, in a time window of 10 ps. The wavelength-resolvedfluorescence transients were fit to sums of exponentials (typically2 or 3, as necessary to fit the data), and time-resolved emissionspectra (TRES) were reconstructed as described elsewhere.33,41
We have employed the traditional approach of fitting the time-resolved emission spectra to a log-normal function,41,47,69 fromwhich we extract the peak frequency ν(t) as a function of time.We describe the solvation dynamics by the following normalizedcorrelation function:
CðtÞ ¼ νðtÞ-νð¥Þνð“0”Þ-νð¥Þ ð2Þ
BecauseC(t) is a normalized function, the accurate determinationof C(t) depends upon accurate values for ν(“0”) and ν(¥).ν(“0”) is the frequency at zero time, estimated using the methodof Fee and Maroncelli,70 who have described a robust, modelindependent, and simple procedure for generating this “zero-time” spectrum, ν(“0”). We have checked its validity using adifferent method for estimating the “zero-time” reorganizationenergy.68 ν(¥) is (usually71,72) the frequency at infinite time,obtained from the maximum of the steady-state spectrum. (Thisis not, however, true in the case of very slowly relaxing solvents, ashas been demonstrated in the case of certain ionic liquids:71-73
where the emission spectrum at ∼3 times the fluorescencelifetime of the probe is red-shifted to that of the equilibriumspectrum.) The ν(t)’s are determined from the maxima of thelog-normal fits of the TRES. In most of cases, however, thespectra are broad, so there is some uncertainty in the exactposition of the emission maxima. Thus, we have considered therange of the raw data points in the neighborhood of themaximum to estimate an error for the maximum obtained fromthe log-normal fit. Depending on the width of the spectrum (i.e.,“zero-time”, steady-state, or time-resolved emission spectrum),we have determined the typical uncertainties as follows: “zero-time” ∼ steady-state (∼(100 cm-1) < time-resolved emission
3633 dx.doi.org/10.1021/jp1008225 |J. Phys. Chem. A 2011, 115, 3630–3641
The Journal of Physical Chemistry A ARTICLE
(∼(200 cm-1). We use these uncertainties to compute errorbars for the C(t). Finally, in generating the C(t), the first pointwas obtained from the “zero-time” spectrum. The secondpoint was taken at the maximum of the instrument responsefunction. Fractional solvation at 300 fs is given by f300fs = 1 -C(t = 300 fs).Recently, we provided an analysis33 of various methods of
constructing C(t) and reviewed selected examples from theliterature.36-38,74-79 We demonstrated that it is possible toexaggerate the amplitudes of slower solvation phenomenon thatmay be attributed to “biological water”, water-protein interac-tions, or the protein itself.Molecular Dynamics Simulations. The starting configura-
tions of sperm whale myoglobin (SW-WT) are from the proteinDATA BANK (PDB id 1VXD) and with TIP3P water models.To have a reasonable starting point for the C153-proteincomplex, the heme is replaced by C153 and then energy mini-mization is used to obtain the starting configuration of the C153/apoMb complex. Standard constant pressure-temperature MDwas performed using the ORAC package80 with the Amber forcefield.81 In all simulations, short-range nonbonded interactionswere calculated up to a 10 Å cutoff, whereas long-range electro-static interactions were treated by the SPMEmethod using a veryfine grid, 128 points per axis, with periodic boundary conditions,and an Ewald convergence parameter of 0.43 Å-1. Threedifferent Nos�e-Hoover thermostats were coupled to solute,solvent, and total center of mass. An external pressure of 0.1 MPawas applied all along the trajectory. A five time-step rRESPA37
algorithm with times of 0.5-1.0-2.0-4.0-12.0 fs was usedwith bond constraints on hydrogen covalent bonds handled by ashake-rattle-like algorithm. The final system was first equili-brated with velocity rescaling for 60 ps at 50 K and 80 ps at 300 K.Following this initial equilibration, we ran the system for oneadditional nanosecond at constant temperature (T = 300 K) andpressure (P = 0.1MPa). To achieve full relaxation, the simulationbox was entirely flexible for the first 300 ps, whereas for theremainder of the run, only isotropic changes of the box wereallowed.35 Finally, the system was simulated for an additional 10ns. As we have demonstrated in our previous work,30 an equilib-rium configuration for C153 in the heme pocket of the protein canbe found and experimental measurements seem to support ourinterpretation. Using the equilibrated configuration, additional12 ns trajectories are generated and are used for the calculationof solvation correlations functions for horse heart apoMb com-plexes; and 30 ns trajectories are used for the correspondingcalculations for the sperm whale apoMb complexes.Using the charges of C153 in the ground and excited states,12
the solvation correlation function can be obtained within thelinear response theory82 as
CðtÞ ¼ δΔEðtÞ δΔEð0Þh iδΔEð0Þ δΔEð0Þh i ð3Þ
where δΔE(t) = ΔE(t) - ÆΔE(t)æ and ΔE(t) is the interactionenergy difference between C153 in its excited state and groundstate with surrounding protein and water molecules at time t. Thesymbol < 3 3 3 > denotes the ensemble average in the simulation.The reorganization energy λ is calculated using λ = Æ(δΔE)2æ/2kBT. For the simulations of the mutants, the residues of theequilibrated WT-apoMb/C153 complex are mutated to thedesired amino acids starting from the equilibrated wild typeand C153 complex structure. Then, an energy minimization and
1 ns equilibration run is performed. Using the equilibratedconfiguration, additional 30 s trajectories are generated and areused for the calculation of solvation correlations functions andthe reorganization energies.
’RESULTS AND DISCUSSIONS
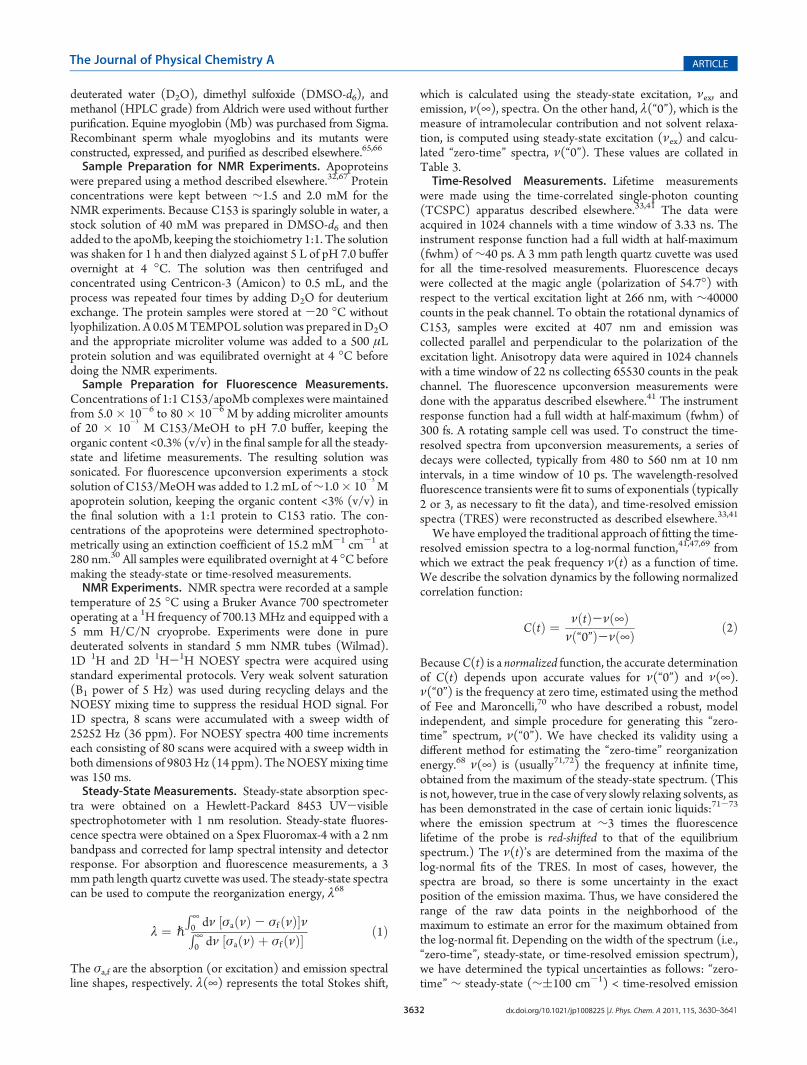
Dielectric Relaxation of the ApoMb Complexes. Repre-sentative wavelength-resolved decay traces of C153/apoMbcomplexes are presented in Figure 2. The solvation correlationfunction, C(t), obtained from spectral reconstruction fromfluorescence unpconversion traces and frommolecular dynamicssimulations for C153 in HH-WT and SW-WT apoMbs and itsmutants using eq 2 and 3 are given in Figures 3 and 4. There isremarkable agreement between the C(t)’s from fluorescenceupconversion experiments and those obtained from moleculardynamics simulations in the SW-WT apoMb, but deviations wereobserved in the mutants. The time constants for the dielectricrelaxation in all the systems are collated in Table 1. For all theapoMb complexes studied here, the experimentally obtainedsolvation response was best fit to two decaying exponentials, witha significant (∼60%) (Table 1) response being completed withinthe time resolution of our experimental apparatus (∼300 fs)succeeded by a slower response, which is also consistent with theMD results. This ultrafast relaxation suggests that water is playinga dominant role, which is consistent with the report by Flemingand co-workers40 that solvation in the lysozyme/eosin system isdominated by water. (Solvation in bulk water is characterizedlargely by an∼30 fs component and is complete in∼15 ps.17,83)The remainder of the solvation can be attributed to motions ofthe protein matrix or coupled protein-water84 motions. Theprotein’s contribution to solvation should not be neglected. Forexample, Nilsson and Halle have simulated the Stokes shift in theprotein monellin85 and have discussed how to separate therelative contributions of protein and water. They find a signifi-cant protein component, at least 25%. Li et al.84 find that the
Figure 2. Representative fluorescence upconversion traces obtained forC153 in H64L/V68F/P88A apoMb mutant at the indicated wave-lengths. The decay at the blue end of the spectrum decays faster thanthat of at the red end of the spectrum. The decay at the red end of thespectrum shows a growing component. The decays used to construct thetime-resolved emission spectra were typically collected over a range ofwavelengths from 480 to 560 nm at 10 nm intervals; a total of ninedecays were used to generate the time-resolved emission spectra, fromwhich the C(t) values were calculated.

3634 dx.doi.org/10.1021/jp1008225 |J. Phys. Chem. A 2011, 115, 3630–3641
The Journal of Physical Chemistry A ARTICLE
relative protein and water contributions can vary substantiallywith the conformational substate of myoglobin: sometimes theprotein contribution can even be larger than water. Both Nilssonand Halle85 and Li et al.84 find that the protein contribution alsohas an ultrafast component. In general, there will always be someslow relaxation due to the conformational motions of proteins. Inour case, the structures of C153/wild type complexes obtainedfrom NMR and FRET measurements are consistent with thoseobtained from simulations. For the mutants, the structures of theC153 complexes used in the simulations are not that certain, asindicated by the comparison with the experimental evidence.This may be the reason for less satisfactory agreements betweenthe C(t)’s.
Another example of agreement between experiment andtheory that has emerged in the study of solvation dynamics ofproteins is the recent work by Boxer and co-workers86 and byGolosov and Karplus.87 In our previous reports32 on solvationdynamics in HH-WT apoMb and apoLba (where the hemepockets differs significantly88,89), we have also found excellentagreement between the C(t) obtained from both experimentsandmolecular dynamics simulations. It is significant that the onlydifference between the heme pockets of the two WTMbs is thatVal67 in HH is replaced by Thr in SW. A close comparison of theC(t)’s for these two systems indicates small but significantdifferences that must arise from this single amino acid substitu-tion (Figure 3).The sensitivity of C153 to its local environment is also
reflected by the reorganization energies for each of the C153/apoMb complexes. The reorganization energies differed not onlybetween the WT and its mutants but also between the two WTapoMbs (sperm whale and horse heart, Table 3). The solvationresponse is thus critically dependent on the environment that theprobe (C153) experiences inside the heme pocket.While there is very good agreement between experiment and
simulation for the wild-types proteins, the agreement for themutant proteins is much less satisfactory. The origin of thisdiscrepancy for the mutants may be found by means of thestructural studies of the complexes that we now discuss.Structural Characterization of the Complex of C153 and
HH-WTApoMbbyNMR. One-dimensional 1HNMR spectra ofHH-WT apoMb and of the complex of 2 equiv of the para-magnetic dye, TEMPOL (Figure 1e), with 1 equiv of apoMb inD2O are shown in Figure 5. Although the overall spectralcharacteristics remain similar, specific signals are perturbed uponaddition of TEMPOL. In particular, the peak at 7.91 ppm arisingfrom Cε H of His64 in the E7-helix is broadened upon inser-tion of TEMPOL. Also the peak due to Cζ H of Phe33 isbroadened, which is consistent with the reports of Cocco andLecomte.34 Excess addition of TEMPOL, beyond 2 equiv, wasavoided to prevent attenuation of other signals by through-spacerelaxation.When, however, C153 is added to apoMb, several signals are
seen to have sharpened and shifted, as seen in Figure 6a, which
Figure 3. Comparison of C(t) for C153 in wild type sperm whale andhorse heart apoMb obtained from fluorescence upconversion experi-ments with those from molecular dynamics simulations. In bothproteins, the initial fast component occurs within the time resolutionof our instrument. There is a remarkable agreement between experimentand theory for both wild type apoproteins. There is only one changebetween the heme pockets of the horse heart and sperm whalemyoglobins: Val67 in HH is replaced by Thr in SW.
Table 1. C(t) Parameters Obtained from Upconversion Ex-periments and MD Simulationsa
system f300fs a1
τ1,
ps a2 τ2, ps a3
τ3,
ps
Æτsolvæ,ps
HH-WT expt 0.64 0.59 0.02 0.41 3.4 1.4
simul 0.73 0.14 0.27 9.3 2.6
SW-WT expt 0.61 0.69 0.14 0.31 15.2 4.8
simul 0.53 0.07 0.18 1.16 0.29 15 4.7
L29F/H64Q/ expt 0.56 0.61 0.12 0.39 15.4 6.1
V68F simul 0.47 0.07 0.17 1.6 0.34 28.0 10.3
H64L/V68F/ expt 0.64 0.68 0.12 0.32 5.5 1.8
P88A simul 0.43 0.06 0.18 1.0 0.39 40.0 15.8
L29F/V68L expt 0.60 0.60 0.10 0.40 3.8 1.6
simul 0.38 0.06 0.16 1.1 0.46 52.0 23.2aResults from experiments and simulations are fit to a sum of exponen-tials. Three exponentials are used to fit the results from simulations andonly two, those from experiments, are a consequence of the error bars forthe experimental results being larger than those for the data pointsresulting from the simulations.
Figure 4. Comparison of solvation correlation functions, C(t) for C153in sperm whale apoMb mutants obtained from fluorescence upconver-sion experiments (closed circles) with those obtained from moleculardynamics simulations (open circles). C(t)’s from experiments andsimulations were calculated using eqs 2 and 3, respectively, and werefitted with a sum of two and three exponentials respectively.

3635 dx.doi.org/10.1021/jp1008225 |J. Phys. Chem. A 2011, 115, 3630–3641
The Journal of Physical Chemistry A ARTICLE
indicates a decreased rate of backbone amide exchange and achange in the population of various conformers. A new peak at6.04 ppm arises in the C153-apoMb spectrum due to the proton(Hx, Figure 1f) adjacent to the carbonyl carbon in C153. Othersignals from coumarin could not be resolved due to their overlapwith other signals from the apoprotein residues.When TEMPOL was added to the C153/apoMb complex, no
changes in the signals from pocket residues, such as His64 andPhe33 were observed, as was the case when TEMPOL was addedto apoMb (Figure 6b). The peak at 7.45 ppm is considerablybroadened on addition of TEMPOL in both cases (with andwithout C153) showing that it arises from a solvent exposedresidue. These observations collectively suggest that C153provides certain rigidity to the flexible structure of the apoproteinand thus prevents TEMPOL from diffusing inside the hemepocket. This is consistent with our circular dichroism resultsreported elsewhere30 which showed that addition of C153 helpsto regain some of the secondary structure present in the nativeholo form of myoglobin.
On the basis of the assignments of Lecomte34,64,90-95 and co-workers, we have assigned selected NOEs from the heme pocketresidues in the 2DNMRspectra. Comparing the spectra of apoMbwith that of the C153/apoMb complex, new cross peaks can beinterpreted as follows (Figure 7). The resonance at 6.04 ppmarises from the proton (Hx, Figure 1f) adjacent to the carbonylcarbon in C153, which has cross peaks with methyl protons ofVal67 and also with those of Ala71. The peak at 7.93 ppm fromCε H of His64 is sharpened and slightly shifted downfield onaddition of C153. His64 shows strong NOEs with methylprotons of Val67 and Leu29 at 0.89 and 1.70 ppm, respectively.C153 selectively perturbed the residues on the distal side of theheme pocket. A complete characterization of the apoMb struc-ture is very difficult owing to its large size, partial unfolding, andexchange among different conformations. Chemical shifts, inter-nuclear distances, NOEs, and dihedral angles are inadequate toprovide correlation between various motions and interchangingconformations, because although the global unfolding of theapoprotein is cooperative, the local motions, like folding-unfold-ing processes occurs independently.64,94,95 Moreover, chemicalshift degeneracy of various protons hinders the assignments ofpeaks in the NMR spectra.On the basis of the above 1D and 2D NMR results, a tentative
location of C153 can be obtained. Considering the NOEs ofcoumarin with the pocket residues and inter-residue interactions,it can be confirmed that the fluorescent dye (C153) occupies thedistal side of the heme pocket, similar to the case of ANS, asshown in Figure 8, which illustrates the approximate distancesand location of C153 with respect to the distal heme pocketresidues. The Hx proton of C153 is <5 Å from the methylresidues of Val67 and Ala71. Accurate determination of inter-proton distances using theNOE cross peak intensity is unreliable95
because of the rapid to intermediate time scales of exchangeamong the related conformations within the apoprotein.Characterization of the Complexes of C153 and ApoMbs
by Fluorescence Energy Transfer and Fluorescence Anisot-ropy. Fluorescence Energy Transfer. To characterize the C153/apoMb complexes further, we performed steady-state and time-resolved fluorescence energy transfer experiments. Figure 9a
Figure 5. Representative 1D 1HNMR spectra of (a) equine apoMb and(b) its complex with 2 equiv of TEMPOL in D2O at 298 K and pH 7.0.Addition of TEMPOL selectively broadens signals (indicated by arrows)from Cε H of His64 and Cζ H of Phe33 in the heme pocket, whichconfirms that the paramagnetic dye binds to the distal side of the pocket.
Figure 6. (a) Representative 1D 1HNMR spectra of the 1:1 complex ofC153/equine apoMb. A new peak at 6.04 ppm arises due to the proton(Hx, Figure 1f) adjacent to the carbonyl carbon in C153. (b) Repre-sentative 1D 1H NMR spectra of complex of C153/equine apoMb with2 equiv of TEMPOL in D2O at 298 K and pH 7.0. There is noperturbation in either the His64 or the Phe33 signals (indicated byarrows) as was seen in Figure 5. Spectra a and b are almost identical,which indicates that coumarin occupies the heme pocket and prohibitsthe entry of TEMPOL.
Figure 7. NOESY spectrum of the C153/apoMb complex in D2O at298 K and pH 7.0. The resonance at 6.04 ppm arises fromHxC153, andthe cross peaks arise from Val67 and Ala 71. Other weaker cross peaksare unidentified. The assigned cross peaks show that C153 is in the distalside of the heme pocket, constituted by Leu29, His64, Val67, Val68, andAla71.
3636 dx.doi.org/10.1021/jp1008225 |J. Phys. Chem. A 2011, 115, 3630–3641
The Journal of Physical Chemistry A ARTICLE
presents quenching of the donor (D), Trp, fluorescence fromapoMb (ΦTrp
ApoMb = 0.11) after insertion of the acceptor (A),C153, into the heme pocket (ΦTrp
C153/ApoMb = 0.09). The fluo-rescence quantum yield of Trp (ΦTrp) in apoMb was calculatedusing Trp in buffer (pH 7.0) as a standard.62,96,97 There issignificant overlap of the Trp emission and C153 absorptionspectra (Figure 9b), which is a critical factor in energy trans-fer between D and A. With excitation at 266 nm, a shortening ofthe Trp lifetime was observed in all the C153/apoMb complexes
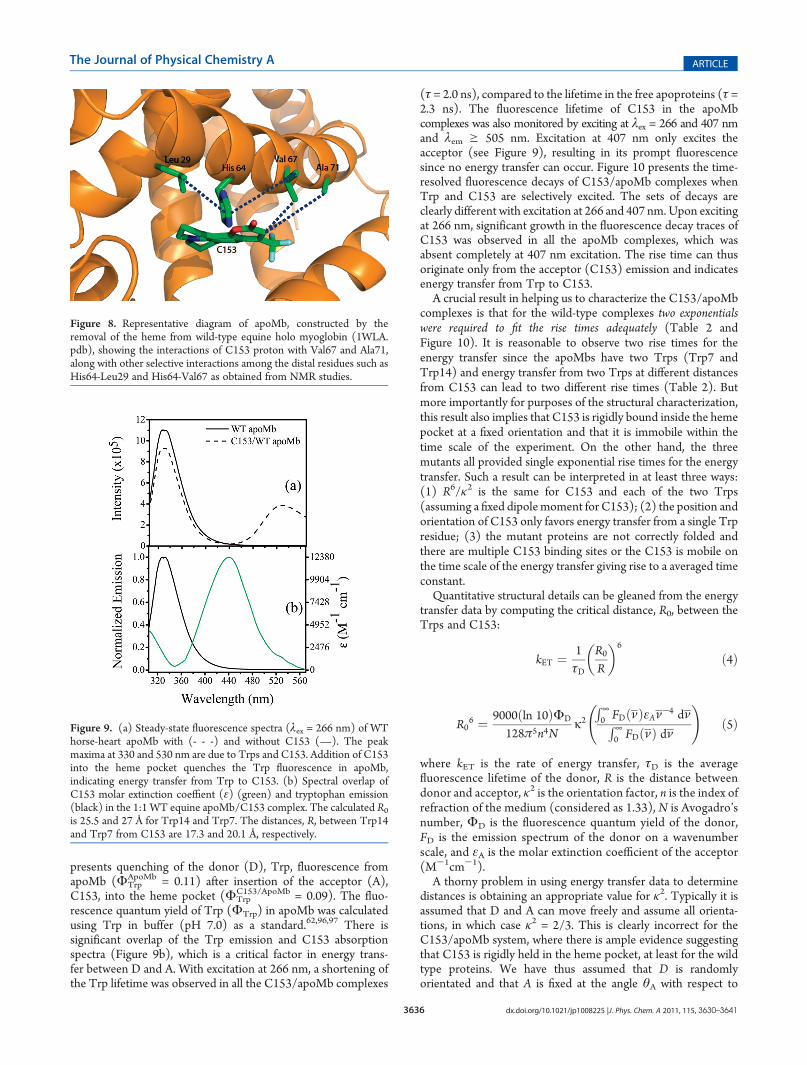
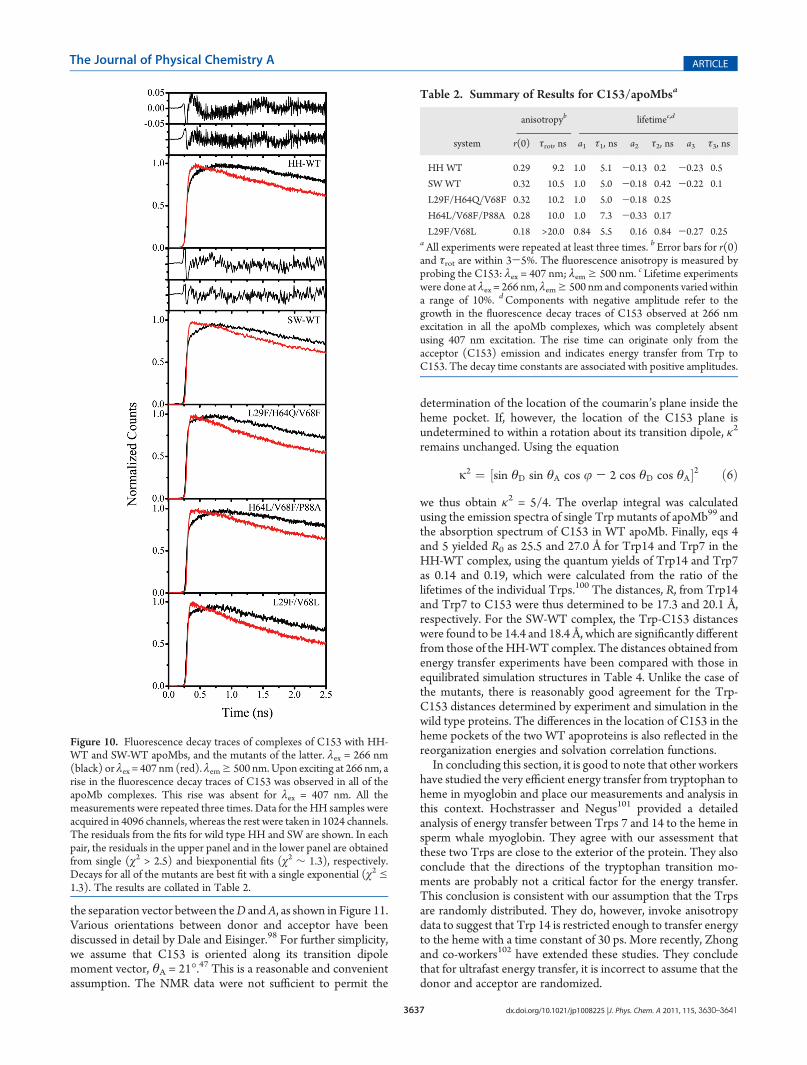
(τ = 2.0 ns), compared to the lifetime in the free apoproteins (τ =2.3 ns). The fluorescence lifetime of C153 in the apoMbcomplexes was also monitored by exciting at λex = 266 and 407 nmand λem g 505 nm. Excitation at 407 nm only excites theacceptor (see Figure 9), resulting in its prompt fluorescencesince no energy transfer can occur. Figure 10 presents the time-resolved fluorescence decays of C153/apoMb complexes whenTrp and C153 are selectively excited. The sets of decays areclearly different with excitation at 266 and 407 nm. Upon excitingat 266 nm, significant growth in the fluorescence decay traces ofC153 was observed in all the apoMb complexes, which wasabsent completely at 407 nm excitation. The rise time can thusoriginate only from the acceptor (C153) emission and indicatesenergy transfer from Trp to C153.A crucial result in helping us to characterize the C153/apoMb
complexes is that for the wild-type complexes two exponentialswere required to fit the rise times adequately (Table 2 andFigure 10). It is reasonable to observe two rise times for theenergy transfer since the apoMbs have two Trps (Trp7 andTrp14) and energy transfer from two Trps at different distancesfrom C153 can lead to two different rise times (Table 2). Butmore importantly for purposes of the structural characterization,this result also implies that C153 is rigidly bound inside the hemepocket at a fixed orientation and that it is immobile within thetime scale of the experiment. On the other hand, the threemutants all provided single exponential rise times for the energytransfer. Such a result can be interpreted in at least three ways:(1) R6/κ2 is the same for C153 and each of the two Trps(assuming a fixed dipolemoment for C153); (2) the position andorientation of C153 only favors energy transfer from a single Trpresidue; (3) the mutant proteins are not correctly folded andthere are multiple C153 binding sites or the C153 is mobile onthe time scale of the energy transfer giving rise to a averaged timeconstant.Quantitative structural details can be gleaned from the energy
transfer data by computing the critical distance, R0, between theTrps and C153:
kET ¼ 1τD
R0
R
� �6
ð4Þ
R06 ¼ 9000ðln 10ÞΦD
128π5n4Nk2R¥0 FDðνÞεAν-4 dνR¥
0 FDðνÞ dν
!ð5Þ
where kET is the rate of energy transfer, τD is the averagefluorescence lifetime of the donor, R is the distance betweendonor and acceptor, κ2 is the orientation factor, n is the index ofrefraction of the medium (considered as 1.33), N is Avogadro’snumber, ΦD is the fluorescence quantum yield of the donor,FD is the emission spectrum of the donor on a wavenumberscale, and εA is the molar extinction coefficient of the acceptor(M-1cm-1).A thorny problem in using energy transfer data to determine
distances is obtaining an appropriate value for κ2. Typically it isassumed that D and A can move freely and assume all orienta-tions, in which case κ
2 = 2/3. This is clearly incorrect for theC153/apoMb system, where there is ample evidence suggestingthat C153 is rigidly held in the heme pocket, at least for the wildtype proteins. We have thus assumed that D is randomlyorientated and that A is fixed at the angle θA with respect to
Figure 8. Representative diagram of apoMb, constructed by theremoval of the heme from wild-type equine holo myoglobin (1WLA.pdb), showing the interactions of C153 proton with Val67 and Ala71,along with other selective interactions among the distal residues such asHis64-Leu29 and His64-Val67 as obtained from NMR studies.
Figure 9. (a) Steady-state fluorescence spectra (λex = 266 nm) of WThorse-heart apoMb with (- - -) and without C153 (—). The peakmaxima at 330 and 530 nm are due to Trps and C153. Addition of C153into the heme pocket quenches the Trp fluorescence in apoMb,indicating energy transfer from Trp to C153. (b) Spectral overlap ofC153 molar extinction coeffient (ε) (green) and tryptophan emission(black) in the 1:1 WT equine apoMb/C153 complex. The calculated R0is 25.5 and 27 Å for Trp14 and Trp7. The distances, R, between Trp14and Trp7 from C153 are 17.3 and 20.1 Å, respectively.
3637 dx.doi.org/10.1021/jp1008225 |J. Phys. Chem. A 2011, 115, 3630–3641
The Journal of Physical Chemistry A ARTICLE
the separation vector between theD andA, as shown in Figure 11.Various orientations between donor and acceptor have beendiscussed in detail by Dale and Eisinger.98 For further simplicity,we assume that C153 is oriented along its transition dipolemoment vector, θA = 21�.47 This is a reasonable and convenientassumption. The NMR data were not sufficient to permit the
determination of the location of the coumarin’s plane inside theheme pocket. If, however, the location of the C153 plane isundetermined to within a rotation about its transition dipole, κ2
remains unchanged. Using the equation
k2 ¼ ½sin θD sin θA cos j - 2 cos θD cos θA�2 ð6Þwe thus obtain κ
2 = 5/4. The overlap integral was calculatedusing the emission spectra of single Trp mutants of apoMb99 andthe absorption spectrum of C153 in WT apoMb. Finally, eqs 4and 5 yielded R0 as 25.5 and 27.0 Å for Trp14 and Trp7 in theHH-WT complex, using the quantum yields of Trp14 and Trp7as 0.14 and 0.19, which were calculated from the ratio of thelifetimes of the individual Trps.100 The distances, R, from Trp14and Trp7 to C153 were thus determined to be 17.3 and 20.1 Å,respectively. For the SW-WT complex, the Trp-C153 distanceswere found to be 14.4 and 18.4 Å, which are significantly differentfrom those of theHH-WT complex. The distances obtained fromenergy transfer experiments have been compared with those inequilibrated simulation structures in Table 4. Unlike the case ofthe mutants, there is reasonably good agreement for the Trp-C153 distances determined by experiment and simulation in thewild type proteins. The differences in the location of C153 in theheme pockets of the two WT apoproteins is also reflected in thereorganization energies and solvation correlation functions.In concluding this section, it is good to note that other workers
have studied the very efficient energy transfer from tryptophan toheme in myoglobin and place our measurements and analysis inthis context. Hochstrasser and Negus101 provided a detailedanalysis of energy transfer between Trps 7 and 14 to the heme insperm whale myoglobin. They agree with our assessment thatthese two Trps are close to the exterior of the protein. They alsoconclude that the directions of the tryptophan transition mo-ments are probably not a critical factor for the energy transfer.This conclusion is consistent with our assumption that the Trpsare randomly distributed. They do, however, invoke anisotropydata to suggest that Trp 14 is restricted enough to transfer energyto the heme with a time constant of 30 ps. More recently, Zhongand co-workers102 have extended these studies. They concludethat for ultrafast energy transfer, it is incorrect to assume that thedonor and acceptor are randomized.
Table 2. Summary of Results for C153/apoMbsa
anisotropyb lifetimec,d
system r(0) τrot, ns a1 τ1, ns a2 τ2, ns a3 τ3, ns
HH WT 0.29 9.2 1.0 5.1 -0.13 0.2 -0.23 0.5
SW WT 0.32 10.5 1.0 5.0 -0.18 0.42 -0.22 0.1
L29F/H64Q/V68F 0.32 10.2 1.0 5.0 -0.18 0.25
H64L/V68F/P88A 0.28 10.0 1.0 7.3 -0.33 0.17
L29F/V68L 0.18 >20.0 0.84 5.5 0.16 0.84 -0.27 0.25aAll experiments were repeated at least three times. b Error bars for r(0)and τrot are within 3-5%. The fluorescence anisotropy is measured byprobing the C153: λex = 407 nm; λemg 500 nm. c Lifetime experimentswere done at λex = 266 nm, λemg 500 nm and components varied withina range of 10%. dComponents with negative amplitude refer to thegrowth in the fluorescence decay traces of C153 observed at 266 nmexcitation in all the apoMb complexes, which was completely absentusing 407 nm excitation. The rise time can originate only from theacceptor (C153) emission and indicates energy transfer from Trp toC153. The decay time constants are associated with positive amplitudes.
Figure 10. Fluorescence decay traces of complexes of C153 with HH-WT and SW-WT apoMbs, and the mutants of the latter. λex = 266 nm(black) or λex = 407 nm (red). λemg 500 nm.Upon exciting at 266 nm, arise in the fluorescence decay traces of C153 was observed in all of theapoMb complexes. This rise was absent for λex = 407 nm. All themeasurements were repeated three times. Data for the HH samples wereacquired in 4096 channels, whereas the rest were taken in 1024 channels.The residuals from the fits for wild type HH and SW are shown. In eachpair, the residuals in the upper panel and in the lower panel are obtainedfrom single (χ2 > 2.5) and biexponential fits (χ2 ∼ 1.3), respectively.Decays for all of the mutants are best fit with a single exponential (χ2e1.3). The results are collated in Table 2.

3638 dx.doi.org/10.1021/jp1008225 |J. Phys. Chem. A 2011, 115, 3630–3641
The Journal of Physical Chemistry A ARTICLE
We recognize that it is a gross approximation to assume thatthe Trps are completely randomly distributed. But we feel that itis a useful approximation and that it is unnecessary in the presentcase to assume that the Trps are not randomized. The point of ourenergy transfer experiments is not to assay the rigidity of thetryptophans but to verify the location of the coumarin, which iscrucial for a proper comparison with simulations. The mostimportant results of our experiments are that for theWT systemswe clearly resolve two different energy transfer events and thatthe distances computed from these time constants are consistentwith distances obtained from the simulations.Fluorescence Anisotropy. Time-resolved fluorescence anisot-
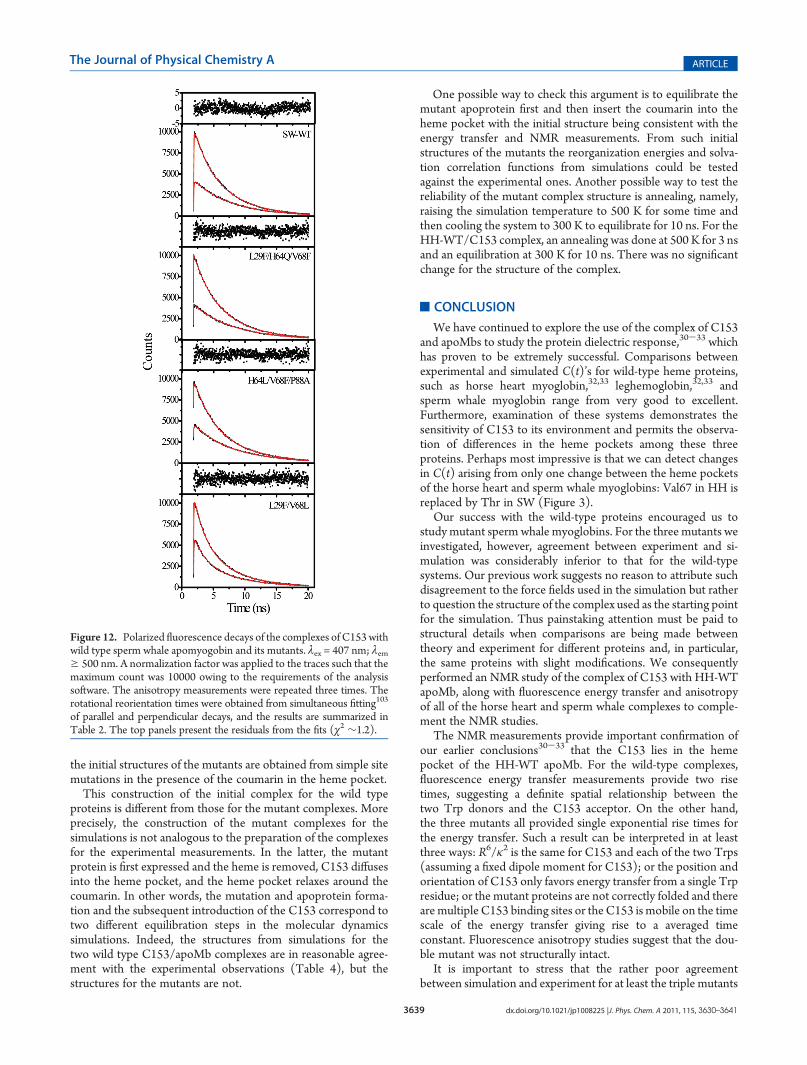
ropy data forC153/apoMb complexes are presented in Figure 12.The anisotropy decay of bound C153 in WT and the two triplemutants was single exponential with a rotational time of ∼10 ns
(Table 2), which supports rigid binding of the probe in the hemepocket; because a single-exponential decay would not be expectedfor a surface bound chromophore.61,62 The r(0) values for thesesystems were found to be similar (∼0.3). These results areconsistent with our previous reports with HH-WT apoMb, whichwas single exponential with a rotational time of 9.2 ns. On theother hand, the doublemutant L29F/V68L showed amuch higherrotational time (>20 ns), with a significantly lower r(0) of ∼0.2.These two values clearly impugn the structure integrity of thedouble mutant. The higher rotational diffusion time could arisefrom aggregation or improper folding of the protein. The reducedlimiting anisotropy could arise from multiple binding sites of theC153.Comparison of the Experimental and Simulated C(t)’s. As
suggested earlier, the origin of this discrepancy between theexperimental and simulated C(t)’s for the mutants may be foundfrom structural studies of the complexes. From a comparison ofthe C153-Trp distances obtained from equilibrated simulationstructures and energy transfer experiments (Table 4) and fromthe NMR measurements, it appears that the structural featuresfor the C153/WT complex obtained from simulations andexperimental measurements are in reasonable agreement. Again,this is not the case for the mutants.The way in which the initial structures for the simulations are
determined may provide a clue for understanding such discre-pancies. For the wild type, the apo structure is obtained directlyfrom the protein data bank, presumably the same structure as theone used in the experimental measurements. On the other hand,
Table 3. Steady-State Parameters for C153/apoMb Complexes
system νemmax,a cm-1 ν(“0”)max,a cm-1 νex
max,a cm-1 λ(“0”),b,c cm-1 λ(¥),b,c cm-1 λ(¥) - λ(“0”),c cm-1 λsimul,c cm-1
HH WT 22940 20260 18730 1850 2450 600 888
SW WT 18970 20322 22910 1815 2453 638 715
L29F/H64Q/V68F 19160 20307 22840 1786 2355 569 1094
H64L/V68F/P88A 19690 20660 23360 1847 2450 603 1252
L29F/V68L 19360 20600 23090 1743 2390 647 755a Peak maxima are obtained from log-normal fits of the spectra. b λ values from experiments are calculated using eq 1 and have an error of(5 cm-1 asdetermined from three different measurements. c λ(¥) is the total Stokes shift including intramolecular and solvent contribution, whereas λ(“0”)exclusively estimates the intramolecular vibrational contribution to the total Stokes shift. Their difference, λ(¥) - λ(“0”), is commensurate with thatobtained from simulations, λsimul, calculated as λ = Æ(δΔE)2æ/2kBT and which only accounts for the dynamic Stokes shift due to solvent contribution orrelaxation.
Figure 11. (a) Geometry used to calculate κ2 for the determination ofR0 for the energy transfer between Trp and C153 in the complexes. Thefigure presents the mutual orientation of the donor transition dipole ofTrp, θD, and the acceptor transition dipole of C153, θA. R is theseparation vector between the donor and acceptor. κ2 is calculated usingeq 6. θA is fixed at 21�, along the dipole moment of C153; and the donoris assumed to be isotropically oriented. The angles θD and φ are thusintegrated over the ranges 0-π and 0-2π, respectively. This geometrygives κ2 = 5/4. (b) D-A distances from the equilibrated structures fromthemolecular dynamics simulations computed with respect to the atomsillustrated. Distances obtained from energy transfer results and fromsimulations are summarized in Table 4.
Table 4. Distances (Å) from Trp7 and Trp14 to C153 in theComplexes
FRET
simulationsa R0b Rc
system Trp7 Trp14 Trp7 Trp14 Trp7 Trp14
HH WT 21.1 17.0 26.9 25.5 20.1 17.3
SW WT 16.7 11.6 25.3 23.9 18.4 14.4
L29F/H64Q/V68F 17.8 13.8 25.2 23.8 16.8 16.7
H64L/V68F/P88A 17.2 12.9 25.5 24.1 15.9 15.9
L29F/V68L 18.1 12.1 25.9 24.4 17.3 17.2aDistances between C153 and Trp are obtained from the equilibratedstructures shown in Figure 11b. b R0 is the so-called “critical distance”distance between donor and acceptor defined by eqs 4 and 5. c R is thedistance from the center of mass of donor (Trp) and acceptor (C153)shown in Figure 11a.
3639 dx.doi.org/10.1021/jp1008225 |J. Phys. Chem. A 2011, 115, 3630–3641
The Journal of Physical Chemistry A ARTICLE
the initial structures of the mutants are obtained from simple sitemutations in the presence of the coumarin in the heme pocket.This construction of the initial complex for the wild type
proteins is different from those for the mutant complexes. Moreprecisely, the construction of the mutant complexes for thesimulations is not analogous to the preparation of the complexesfor the experimental measurements. In the latter, the mutantprotein is first expressed and the heme is removed, C153 diffusesinto the heme pocket, and the heme pocket relaxes around thecoumarin. In other words, the mutation and apoprotein forma-tion and the subsequent introduction of the C153 correspond totwo different equilibration steps in the molecular dynamicssimulations. Indeed, the structures from simulations for thetwo wild type C153/apoMb complexes are in reasonable agree-ment with the experimental observations (Table 4), but thestructures for the mutants are not.
One possible way to check this argument is to equilibrate themutant apoprotein first and then insert the coumarin into theheme pocket with the initial structure being consistent with theenergy transfer and NMR measurements. From such initialstructures of the mutants the reorganization energies and solva-tion correlation functions from simulations could be testedagainst the experimental ones. Another possible way to test thereliability of the mutant complex structure is annealing, namely,raising the simulation temperature to 500 K for some time andthen cooling the system to 300 K to equilibrate for 10 ns. For theHH-WT/C153 complex, an annealing was done at 500 K for 3 nsand an equilibration at 300 K for 10 ns. There was no significantchange for the structure of the complex.
’CONCLUSION
We have continued to explore the use of the complex of C153and apoMbs to study the protein dielectric response,30-33 whichhas proven to be extremely successful. Comparisons betweenexperimental and simulated C(t)’s for wild-type heme proteins,such as horse heart myoglobin,32,33 leghemoglobin,32,33 andsperm whale myoglobin range from very good to excellent.Furthermore, examination of these systems demonstrates thesensitivity of C153 to its environment and permits the observa-tion of differences in the heme pockets among these threeproteins. Perhaps most impressive is that we can detect changesin C(t) arising from only one change between the heme pocketsof the horse heart and sperm whale myoglobins: Val67 in HH isreplaced by Thr in SW (Figure 3).
Our success with the wild-type proteins encouraged us tostudymutant sperm whale myoglobins. For the three mutants weinvestigated, however, agreement between experiment and si-mulation was considerably inferior to that for the wild-typesystems. Our previous work suggests no reason to attribute suchdisagreement to the force fields used in the simulation but ratherto question the structure of the complex used as the starting pointfor the simulation. Thus painstaking attention must be paid tostructural details when comparisons are being made betweentheory and experiment for different proteins and, in particular,the same proteins with slight modifications. We consequentlyperformed an NMR study of the complex of C153 with HH-WTapoMb, along with fluorescence energy transfer and anisotropyof all of the horse heart and sperm whale complexes to comple-ment the NMR studies.
The NMR measurements provide important confirmation ofour earlier conclusions30-33 that the C153 lies in the hemepocket of the HH-WT apoMb. For the wild-type complexes,fluorescence energy transfer measurements provide two risetimes, suggesting a definite spatial relationship between thetwo Trp donors and the C153 acceptor. On the other hand,the three mutants all provided single exponential rise times forthe energy transfer. Such a result can be interpreted in at leastthree ways: R6/κ2 is the same for C153 and each of the two Trps(assuming a fixed dipole moment for C153); or the position andorientation of C153 only favors energy transfer from a single Trpresidue; or the mutant proteins are not correctly folded and thereare multiple C153 binding sites or the C153 is mobile on the timescale of the energy transfer giving rise to a averaged timeconstant. Fluorescence anisotropy studies suggest that the dou-ble mutant was not structurally intact.
It is important to stress that the rather poor agreementbetween simulation and experiment for at least the triple mutants
Figure 12. Polarized fluorescence decays of the complexes of C153 withwild type sperm whale apomyogobin and its mutants. λex = 407 nm; λemg 500 nm. A normalization factor was applied to the traces such that themaximum count was 10000 owing to the requirements of the analysissoftware. The anisotropy measurements were repeated three times. Therotational reorientation times were obtained from simultaneous fitting103
of parallel and perpendicular decays, and the results are summarized inTable 2. The top panels present the residuals from the fits (χ2 ∼1.2).

3640 dx.doi.org/10.1021/jp1008225 |J. Phys. Chem. A 2011, 115, 3630–3641
The Journal of Physical Chemistry A ARTICLE
is not a suggestion that it is not possible to identify thecontribution of a single amino acid to the dielectric response.We reiterate that for HH-WT apoMb and apoLba (where theheme pockets differ significantly88,89), we have found excellentagreement between the C(t) obtained from both experimentsand simulations, and it is also significant that the only differencebetween the heme pockets of the two WT Mbs is that Val67 inHH is replaced by Thr in SW.32,33 The mutant results point,rather, to the importance of the structural characterization ofmodified proteins used in studies of the dielectric response andsuggest strategies for performing molecular dynamics simula-tions of modified proteins—i.e., starting perhaps with (limited)NMR data and employing more than one equilibration step. Webelieve that ours is the most thorough structural characterizationto date of any system, whether it be based on nonnaturalfluorescence probes or mutants, employed for the investigationof the dielectric response of proteins.
’AUTHOR INFORMATION
Corresponding Author*E-mail: [email protected].
’ACKNOWLEDGMENT
We thank Prof. John S. Olson at Rice University for providingthe sperm holomyoglobin and its mutants. X.S. is grateful forfinancial support from NSF grant CHE-0809431.
’REFERENCES
(1) Nandi, N.; Bhattacharyya, K.; Bagchi, B. Chem. Rev. 2000, 100,2013.(2) Simon, J. D. Acc. Chem. Res. 1988, 21, 128.(3) Fleming, G. R.; Wolynes, P. G. Phys. Today 1990, 43, 36.(4) Barbara, P. F.; Jarzeba, W. Ultrafast Photochemical Intramole-
cular Charge Transfer and Excited State Solvation. In Advances inPhotochemistry; Volman, D. H., Hammond, G. S., Gollnick, K., Eds.;John Wiley & Sons: New York, 1990.(5) Maroncelli, M. J. Mol. Liq. 1993, 57, 1.(6) Hynes, J. T. Charge Transfer Reactions and Solvation Dynamics.
InUltrafast Dynamics of Chemical Systems; Kluwer Academic: Dordrecht,1994; Vol. 7, pp 345.(7) Fleming, G. R.; Cho, M. H.Annu. Rev. Phys. Chem. 1996, 47, 109.(8) Stratt, R. M.; Maroncelli, M. J. Phys. Chem. 1996, 100, 12981.(9) Castner, E. W., Jr.; Maroncelli, M. J. Mol. Liq. 1998, 77, 1.(10) Mukamel, S. Principles of Nonlinear Optical Spectroscopy, 1st ed.;
Oxford University Press: New York, 1995.(11) Hsu, C. P.; Song, X. Y.;Marcus, R. A. J. Phys. Chem. B 1997, 101,
2546.(12) Song, X.; Chandler, D. J. Chem. Phys. 1998, 108, 2594.(13) Marcus, R. A.; Sutin, N. Biochim. Biophys. Acta 1985, 811, 265.(14) King, G.; Warshel, A. J. Chem. Phys. 1989, 91, 3647.(15) Bader, J. S.; Kuharski, R. A.; Chandler, D. Abstr. Pap. Am. Chem.
Soc. 1990, 199, 65.(16) Halder, M.; Headley, L. S.; Mukherjee, P.; Song, X.; Petrich,
J. W. J. Phys. Chem. A 2006, 110, 8623.(17) Lang, M. J.; Jordanides, X. J.; Song, X.; Fleming, G. R. J. Chem.
Phys. 1999, 110, 5884.(18) Perutz, M. F. Science 1978, 210, 1187.(19) Moser, C. C.; Keske, J. M.; Warncke, K.; Farid, R. S.; Dutton,
P. L. Nature 1992, 355, 796.(20) Warshel, A.; Russel, S. T. Q. Rev. Biol. 1984, 17, 283.(21) Sharp, K. A.; Honig, B. Ann. Rev. Biophys. Chem. 1990, 19, 301.(22) Nakamura, H. Q. Rev. Biophys. 1996, 29, 1.(23) King, G.; Lee, F. S.; Warshel, A. J. Chem. Phys. 1991, 95, 4366.
(24) Simonson, T.; Perahia, D.; Br€unger, A. T.Biophys. J. 1991, 59, 670.(25) Simonson, T.; Perahia, D. Proc. Natl. Acad. Sci. U.S.A. 1995, 92,
1082.(26) Simonson, T.; Brooks, C. L. J. Am. Chem. Soc. 1996, 118, 8452.(27) Simonson, T. J. Am. Chem. Soc. 1998, 120, 4875.(28) Simonson, T.; Archontis, G.; Karplus, M. J. Phys. Chem. B 1999,
103, 6142.(29) Warshel, A.; Sharma, P. K.; Kato, M.; Parson, W. W. Biochim.
Biophys. Acta, Proteins Proteomics 2006, 1764, 1647.(30) Chowdhury, P. K.; Halder, M.; Sanders, L.; Arnold, R. A.; Liu,
Y.; Armstrong, D. W.; Kundu, S.; Hargrove, M. S.; Song, X.; Petrich,J. W. Photochem. Photobiol. 2004, 79, 440.
(31) Mukherjee, P.; Halder, M.; Hargrove, M.; Petrich, J. W. Photo-chem. Photobiol. 2006, 82, 1586.
(32) Halder, M.; Mukherjee, P.; Bose, S.; Hargrove, M. S.; Song, X.;Petrich, J. W. J. Chem. Phys. 2007, 127, 055101/1.
(33) Bose, S.; Adhikary, R.; Mukherjee, P.; Song, X.; Petrich, J. W.J. Phys. Chem. B 2009, 113, 11061.
(34) Cocco, M. J.; Lecomte, J. T. J. Protein Sci. 1994, 3, 267.(35) Nemkovich, N. A.; Baumann, W.; Kruchenok, Y. V.; Reis, H.;
Rubinov, A. N. J. Appl. Spectrosc. 1999, 66, 415.(36) Pal, S. K.; Peon, J.; Bagchi, B.; Zewail, A. H. J. Phys. Chem. B
2002, 106, 12376.(37) Pal, S. K.; Peon, J.; Zewail, A. H. Proc. Natl. Acad. Sci. U.S.A.
2002, 99, 1763.(38) Peon, J.; Pal, S. K.; Zewail, A. H. Proc. Natl. Acad. Sci. U.S.A.
2002, 99, 10964.(39) Shen, X.; Knutson, J. R. J. Phys. Chem. B 2001, 105, 6260.(40) Jordanides, X. J.; Lang, M. J.; Song, X.; Fleming, G. R. J. Phys.
Chem. B 1999, 103, 7995.(41) Chowdhury, P. K.; Halder, M.; Sanders, L.; Calhoun, T.;
Anderson, J. L.; Armstrong, D. W.; Song, X.; Petrich, J. W. J. Phys.Chem. B 2004, 108, 10245.
(42) Stryer, L. J. Mol. Biol. 1965, 13, 482.(43) Pierce, D. W.; Boxer, S. G. J. Phys. Chem. 1992, 96, 5560.(44) Macgregor, R. B.; Weber, G. Nature 1986, 316, 70.(45) Bashkin, J. S.; Mclendon, G.; Mukamel, S.; Marohn, J. J. Phys.
Chem. 1990, 94, 4757.(46) Adhikary, R.; Barnes, C. A.; Petrich, J. W. J. Phys. Chem. B 2009,
113, 11999.(47) Maroncelli, M.; Fleming, G. R. J. Chem. Phys. 1987, 86, 6221.(48) Horng, M. L.; Gardecki, J. A.; Papazyan, A.; Maroncelli, M.
J. Phys. Chem. 1995, 99, 17311.(49) Lewis, J. E.; Maroncelli, M. Chem. Phys. Lett. 1998, 282, 197.(50) Maroncelli, M.; Fee, R. S.; Chapman, C. F.; Fleming, G. R.
J. Phys. Chem. 1991, 95, 1012.(51) Kovalenko, S. A.; Ruthmann, J.; Ernsting, N. P.Chem. Phys. Lett.
1997, 271, 40.(52) Muhlpfordt, A.; Schanz, R.; Ernsting, N. P.; Farztdinov, V.;
Grimme, S. Phys. Chem. Chem. Phys. 1999, 1, 3209.(53) Changenet-Barret, P.; Choma, C. T.; Gooding, E. F.; DeGrado,
W. F.; Hochstrasser, R. M. J. Phys. Chem. B 2000, 104, 9322.(54) Jiang, Y.; McCarthy, P. K.; Blanchard, D. J. Chem. Phys. 1994,
183, 249.(55) Flory, W. C.; Blanchard, D. J. Appl. Spectrosc. 1998, 52, 82.(56) Palmer, P. M.; Chen, Y.; Topp, M. R. Chem. Phys. Lett. 2000,
318, 440.(57) Chen, Y.; Palmer, P. M.; Topp, M. R. Int. J. Mass Spectrom.
2002, 220, 231.(58) Agmon, N. J. Phys. Chem. 1990, 94, 2959.(59) Chakrabarty, D.; Hazra, P.; Chakraborty, A.; Seth, D.; Sarkar,
N. Chem. Phys. Lett. 2003, 381, 697.(60) Tcherkasskaya, O.; Ptitsyn, O. B.; Knutson, J. R. Biochemistry
2000, 39, 1879.(61) Petrich, J. W.; Martin, J. L.; Breton, J. Springer Ser. Chem. Phys.
1988, 48, 576.(62) Das, K.; Smirnov, A. V.; Wen, J.; Miskovsky, P.; Petrich, J. W.
Photochem. Photobiol. 1999, 69, 633.
3641 dx.doi.org/10.1021/jp1008225 |J. Phys. Chem. A 2011, 115, 3630–3641
The Journal of Physical Chemistry A ARTICLE
(63) Song, X. J. Chem. Phys. 2002, 116, 9359.(64) Cocco, M. J.; Kao, Y.-H.; Phillips, A. T.; Lecomte, J. T. J.
Biochemistry 1992, 31, 6481.(65) Alayash, A. I.; Ryan, B. A. B.; Eich, R. F.; Olson, J. S.; Cashon,
R. E. J. Biol. Chem. 1999, 274, 2029.(66) Nguyen, B. D.; Zhao, X.; Vyas, K.; La Mar, G. N.; Lile, R. A.;
Brucker, E. A.; Phillips, G. N., Jr.; Olson, J. S.; Wittenberg, J. B. J. Biol.Chem. 1998, 273, 9517.(67) Hargrove, M. S.; Singleton, E. W.; Quillin, M. L.; Ortiz, L. A.;
Phillips, G. N.; Olson, J. S.; Mathews, A. J. J. Biol. Chem. 1994, 269, 4207.(68) Headley, L. S.; Mukherjee, P.; Anderson, J. L.; Ding, R.; Halder,
M.; Armstrong, D.W.; Song, X.; Petrich, J.W. J. Phys. Chem. A 2006, 110,9549.(69) Mukherjee, P.; Crank, J. A.; Halder, M.; Armstrong, D. W.;
Petrich, J. W. J. Phys. Chem. A 2006, 110, 10725.(70) Fee, R. S.; Maroncelli, M. Chem. Phys. 1994, 183, 235.(71) Arzhantsev, S.; Ito, N.; Heitz, M.; Maroncelli, M. Chem. Phys.
Lett. 2003, 381, 278.(72) Ito, N.; Arzhantsev, S.; Heitz, M.; Maroncelli, M. J. Phys. Chem.
B 2004, 108, 5771.(73) Mukherjee, P.; Crank, J. A.; Sharma, P. S.; Wijeratne, A. B.;
Adhikary, R.; Bose, S.; Armstrong, D. W.; Petrich, J. W. J. Phys. Chem. B2008, 112, 3390.(74) Zhong, D. P.; Pal, S. K.; Zhang, D. Q.; Chan, S. I.; Zewail, A. H.
Proc. Natl. Acad. Sci. U.S.A. 2002, 99, 13.(75) Lu,W.; Kim, J.; Qiu, W.; Zhong, D.Chem. Phys. Lett. 2004, 388,
120.(76) Qiu, W.; Kao, Y.-T.; Zhang, L.; Yang, Y.; Wang, L.; Stites,
W. E.; Zhong, D.; Zewail, A. H. Proc. Natl. Acad. Sci. U.S.A. 2006, 103,13979.(77) Qiu, W.; Zhang, L.; Okobiah, O.; Yang, Y.; Wang, L.; Zhong,
D.; Zewail, A. H. J. Phys. Chem. B. 2006, 110, 10540.(78) Zhang, L.; Wang, L.; Kao, Y.; Qiu, W.; Yang, Y.; Okobiah, O.;
Zhong, D. Proc. Natl. Acad. Sci. U.S.A. 2007, 104, 18461.(79) Zhang, L.; Yang, Y.; Kao, Y.-T.; Wang, L.; Zhong, D. J. Am.
Chem. Soc. 2009, 131, 10677.(80) Marchi, M.; Procacci, P. J. Chem. Phys. 1998, 109, 5194.(81) Pearlman, D. A.; Case, D. A.; Caldwell, J. W.; Ross, W. S.;
Cheatham, T. E., III; DeBolt, S.; Ferguson, D.; Seibel, S.; Kollman, P.Comput. Phys. Commun. 1995, 91, 1.(82) Maroncelli, M.; Fleming, G. R. J. Chem. Phys. 1988, 89, 5044.(83) Jimenez, R.; Fleming, G. R.; Kumar, P. V.; Maroncelli, M.
Nature 1994, 369, 471.(84) Li, T.; Hassanali, A. A.; Kao, Y.-T.; Zhong, D.; Singer, S. J. J. Am.
Chem. Soc. 2007, 129, 3376.(85) Nilsson, L.; Halle, B. Proc. Natl. Acad. Sci. U.S.A. 2005, 102,
13867.(86) Abbyad, P.; Shi, X.; Childs, W.; McAnaney, T. B.; Cohen, B. E.;
Boxer, S. G. J. Phys. Chem. B 2007, 111, 8269.(87) Golosov, A. A.; Karplus, M. J. Phys. Chem. B 2007, 111, 1482.(88) Kundu, S.; Snyder, B.; Das, K.; Chowdhury, P.; Park, J.; Petrich,
J. W.; Hargrove, M. S. Proteins: Struct. Funct. Genet. 2002, 46, 268.(89) Kundu, S.; Hargrove, M. S. Proteins: Struct. Funct. Genet. 2003,
50, 239.(90) Lecomte, J. T. J.; Cocco, M. J. Biochemistry 1990, 29, 11057.(91) Cocco, M. J.; Lecomte, J. T. J. Biochemistry 1990, 29, 11067.(92) Cocco, M. J.; Barrick, D.; Taylor, S. V.; Lecomte, J. T. J. J. Am.
Chem. Soc. 1990, 114, 11000.(93) Kao, Y.-H.; Lecomte, J. T. J. J. Am. Chem. Soc. 1993, 115, 9754.(94) Lecomte, J. T. J.; Kao, Y.-H.; Cocco, M. J. Proteins: Struct. Funct.
Genet. 1996, 25, 267.(95) Lecomte, J. T. J.; Sukits, S. F.; Bhattacharyya, S.; Falzone, C.
Protein Sci. 1999, 8, 1484.(96) Avouris, P.; Yang, L. L.; El-Bayoumi, M. A. Photochem. Photo-
biol. 1976, 24, 211.(97) Rich, R. L.; Gai, F.; Lane, J. W.; Petrich, J. W.; Schwabacher,
A. W. J. Am. Chem. Soc. 1995, 117, 733.(98) Dale, R. E.; Eisinger, J. Biopolymers 1974, 13, 1573.
(99) Glandieres, J.-M.; Twist, C.; Haouz, A.; Zentz, C.; Alpert, B.Photochem. Photobiol. 2000, 71, 382.
(100) Sirangelo, I.; Malmo, C.; Casillo, M.; Irace, G. Photochem.Photobiol. 2002, 76, 381.
(101) Negus, D. K.; Hochstrasser, R. M. Proc. Natl. Acad. Sci. U.S.A.1984, 81, 4399.
(102) Stevens, J. A.; Link, J. J.; Kao, Y.-T.; Zang, C.; Wang, L.;Zhong, D. J. Phys. Chem. B 2010, 114, 1498.
(103) Cross, A. J.; Fleming, G. R. Biophys. J. 1984, 46, 45.