comparison of the accuracy of classifications generated by interimage and by interimage integrated...
TRANSCRIPT

South-Eastern European Journal
of Earth Observa�on and Geoma�cs
Issue Vo3, Νο2S, 2014
93
®Aristotle University of Thessaloniki, Greece Published online May 2014
Comparison of the accuracy of classifica�ons generated by interimage and by interimage integrated with data mining
Denilson Passoa , Edilson Biasa,*, Ricardo Britesa , Gilson Costab
a Ins�tute of Geosciences , University of Brasília , Brazil b Department of Electrical Engineering , Pon�fical Catholic University of Rio de Janeiro, Brazil
*Corresponding author: [email protected], +556131076977, +556181317202
Abstract: The technological development in remote sensing has been providing a large increase in the quality of satellite imagery. A notable example is the WorldView II satellite that has a spa�al resolu�on of 46 cm. Despite this breakthrough, the classifica�on methods are s�ll very affected by the spectral mixture due to the mul�tude of features observed in high resolu�on images, especially in urban environments. In the search for a solu�on, so�ware packages that enable imagery classifica�on based on objects, facilita�ng the representa�on and processing of human knowledge about the specific characteris�cs of targets of interest, have appeared. These systems are based on rules and decision trees, where they seek to represent the mode of reasoning and knowledge used by experts in solving problems within its specialty. Among the classifica�on systems based on objects, the InterIMAGE is highlighted as an open source system developed by the Computer Vision Laboratory in the Department of Electrical Engineering of the Pon�fical Catholic University of Rio de Janeiro and the divisions of Image Processing and Remote Sensing in the Na�onal Ins�tute for Space Research. The so�ware has a specific graphical user interface to support the defini�on of decision rules. These rules define the structured and explicit knowledge of the user / analyst and are used by the system in the process of interpreta�on, where the values to be inserted in the structure of the rule can be obtained by visual analysis of a�ributes histograms calculated for image segments. Once appropriately constructed, its use is fast and computa�onally efficient in separa�ng the classes. In order to avoid errors in interpreta�on of visual a�ributes and to acquire greater efficiency and speed in construc�ng rules, authors have used data mining techniques, which help to check which a�ributes, from those available in the data set, are more relevant to describe classes automa�cally and to provide the thresholds to separate them . Finally, in order to evaluate the classifica�ons, the accuracy assessment was conducted making use of three indices: Global, Kappa and Tau. Keywords: WorldViewII, InterIMAGE, data mining, accuracy assessment.
1. Introduc�on
Over the past few years there was a significant increase in the use of satellite remote sensing imagery, which has contributed to new research, mainly targe�ng improvements in
classifiers methodologies.
Among these alterna�ves, the methodology for spa�al imagery analysis based on objects GEOBIA (Geographic Object - Based Image Analysis) (Hay and Cas�lla, 2008) has gained
importance in recent years. It emerges as a significant advance in the process of automa�c
classifica�on of satellite imagery, as it enables the modeling of human knowledge related to specific features of the targets, such as brightness, texture, shape, context, size,
neighborhood rela�ons, among others, with the focus on the classifica�on of image
segments instead of isolated pixels.

South-Eastern European Journal
of Earth Observa�on and Geoma�cs
Issue Vo3, Νο2S, 2014
94
®Aristotle University of Thessaloniki, Greece Published online May 2014
With respect to object-based so�ware, currently one can find proprietary and open source
systems, as is the case of InterIMAGE developed by the Computer Vision Laboratory,
Department of Electrical Engineering, Pon�fical Catholic University of Rio de Janeiro and the divisions of Image Processing and Remote Sensing of the Na�onal Ins�tute for Space
Research (Costa et al., 2008).
This study was conducted at the satellite city of Sobradinho - DF, distant about 30 miles from downtown Brasilia - DF, Figure 1, and aimed to compare the poten�al and accuracy of a
classifica�on generated by InterIMAGE with decision rules constructed through visual
analysis of histograms and classifica�on using decision rules built automa�cally by data mining and evaluated u�lizing accuracy assessment techniques.
Figure 1. Loca�on of test-area.
2. Methodological procedures Figure 2 depicts the methodological procedures for the analysis.
Figure 2. Methodological procedures.
3. Results and discussion The use of Analysis Manager resorces, available in the InterIMAGE so�ware, allowed the refinement of the results by the analysis of histograms. The separa�on of classes in InterIMAGE, with decision rules generated automa�cally by data mining, was possible based
South-Eastern European Journal
of Earth Observa�on and Geoma�cs
Issue Vo3, Νο2S, 2014
95
®Aristotle University of Thessaloniki, Greece Published online May 2014
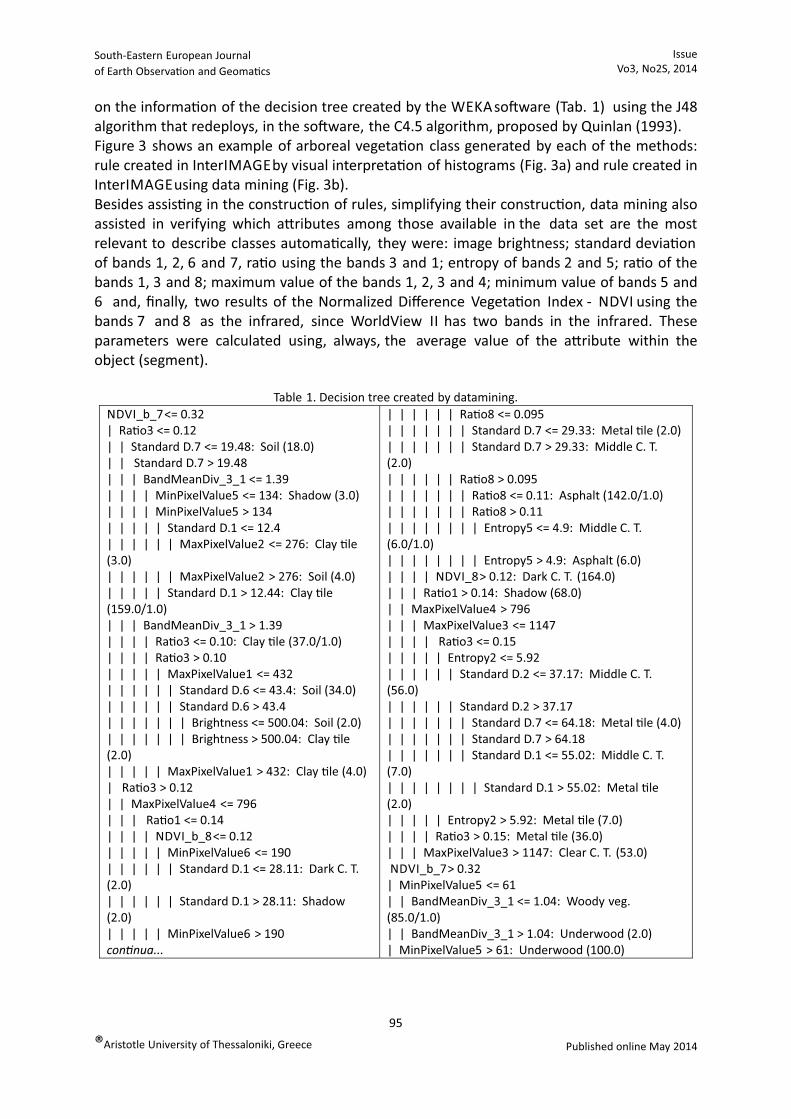
on the informa�on of the decision tree created by the WEKA so�ware (Tab. 1) using the J48 algorithm that redeploys, in the so�ware, the C4.5 algorithm, proposed by Quinlan (1993). Figure 3 shows an example of arboreal vegeta�on class generated by each of the methods: rule created in InterIMAGE by visual interpreta�on of histograms (Fig. 3a) and rule created in InterIMAGE using data mining (Fig. 3b). Besides assis�ng in the construc�on of rules, simplifying their construc�on, data mining also assisted in verifying which a�ributes among those available in the data set are the most relevant to describe classes automa�cally, they were: image brightness; standard devia�on of bands 1, 2, 6 and 7, ra�o using the bands 3 and 1; entropy of bands 2 and 5; ra�o of the bands 1, 3 and 8; maximum value of the bands 1, 2, 3 and 4; minimum value of bands 5 and 6 and, finally, two results of the Normalized Difference Vegeta�on Index - NDVI using the bands 7 and 8 as the infrared, since WorldView II has two bands in the infrared. These parameters were calculated using, always, the average value of the a�ribute within the object (segment).
Table 1. Decision tree created by datamining.
NDVI_b_7 <= 0.32 | Ra�o3 <= 0.12 | | Standard D.7 <= 19.48: Soil (18.0) | | Standard D.7 > 19.48 | | | BandMeanDiv_3_1 <= 1.39 | | | | MinPixelValue5 <= 134: Shadow (3.0) | | | | MinPixelValue5 > 134 | | | | | Standard D.1 <= 12.4 | | | | | | MaxPixelValue2 <= 276: Clay �le (3.0) | | | | | | MaxPixelValue2 > 276: Soil (4.0) | | | | | Standard D.1 > 12.44: Clay �le (159.0/1.0) | | | BandMeanDiv_3_1 > 1.39 | | | | Ra�o3 <= 0.10: Clay �le (37.0/1.0) | | | | Ra�o3 > 0.10 | | | | | MaxPixelValue1 <= 432 | | | | | | Standard D.6 <= 43.4: Soil (34.0) | | | | | | Standard D.6 > 43.4 | | | | | | | Brightness <= 500.04: Soil (2.0) | | | | | | | Brightness > 500.04: Clay �le (2.0) | | | | | MaxPixelValue1 > 432: Clay �le (4.0) | Ra�o3 > 0.12 | | MaxPixelValue4 <= 796 | | | Ra�o1 <= 0.14 | | | | NDVI_b_8 <= 0.12 | | | | | MinPixelValue6 <= 190 | | | | | | Standard D.1 <= 28.11: Dark C. T. (2.0) | | | | | | Standard D.1 > 28.11: Shadow (2.0) | | | | | MinPixelValue6 > 190 con�nua...
| | | | | | Ra�o8 <= 0.095| | | | | | | Standard D.7 <= 29.33: Metal �le (2.0) | | | | | | | Standard D.7 > 29.33: Middle C. T. (2.0) | | | | | | Ra�o8 > 0.095 | | | | | | | Ra�o8 <= 0.11: Asphalt (142.0/1.0) | | | | | | | Ra�o8 > 0.11 | | | | | | | | Entropy5 <= 4.9: Middle C. T. (6.0/1.0) | | | | | | | | Entropy5 > 4.9: Asphalt (6.0) | | | | NDVI_8 > 0.12: Dark C. T. (164.0) | | | Ra�o1 > 0.14: Shadow (68.0) | | MaxPixelValue4 > 796 | | | MaxPixelValue3 <= 1147 | | | | Ra�o3 <= 0.15 | | | | | Entropy2 <= 5.92 | | | | | | Standard D.2 <= 37.17: Middle C. T. (56.0) | | | | | | Standard D.2 > 37.17 | | | | | | | Standard D.7 <= 64.18: Metal �le (4.0) | | | | | | | Standard D.7 > 64.18 | | | | | | | Standard D.1 <= 55.02: Middle C. T. (7.0) | | | | | | | | Standard D.1 > 55.02: Metal �le (2.0) | | | | | Entropy2 > 5.92: Metal �le (7.0) | | | | Ra�o3 > 0.15: Metal �le (36.0) | | | MaxPixelValue3 > 1147: Clear C. T. (53.0) NDVI_b_7 > 0.32 | MinPixelValue5 <= 61 | | BandMeanDiv_3_1 <= 1.04: Woody veg. (85.0/1.0) | | BandMeanDiv_3_1 > 1.04: Underwood (2.0) | MinPixelValue5 > 61: Underwood (100.0)

South-Eastern European Journal
of Earth Observa�on and Geoma�cs
Issue Vo3, Νο2S, 2014
96
®Aristotle University of Thessaloniki, Greece Published online May 2014
Figure 2. Samples of decision rules created by visual interpreta�on of histogram (a) and by data mining (b).
Visually, one can observe a li�le difference between the two classifica�ons (Fig. 4). However, when looking at their confusion matrix (Tab. 2 and 3), it is percep�ble that in the classifica�on that used the rules created by visual interpreta�on of histograms, the class that got be�er separa�on was the Metal Tile, explained by its li�le mixture with the others, despite the reduced number of reference samples. The coverage classes Clear Cement Tile and Dark Ciment Tile also had good separa�on, contribu�ng significantly to percentage increase of accuracy indices. By analyzing the confusion matrix of the classifica�on that used decision rules created by data mining (Tab. 3), it is no�ced that, in general, there was li�le dispersion of values , i.e., the values were concentrated in the main diagonal, meaning li�le confusion between classes. However, there were s�ll mixing between classes Caly Tile and Bare Soil, and the la�er, in turn, with the Undergrowth vegeta�on class, which may have occurred due to some areas experiencing sparse distribu�on or dry leaves, due to the season, exposing soil and hindering the spectral separa�on of the classes. In both classifica�ons the Asphalt class, got good accuracy indices due to the use of a shapefile of roads which served as a mask.
Figure 3. Thema�c map resul�ng from the classifica�on created by visual interpreta�on of histograms (a) and
datamining (b).

South-Eastern European Journal
of Earth Observa�on and Geoma�cs
Issue Vo3, Νο2S, 2014
97
®Aristotle University of Thessaloniki, Greece Published online May 2014
Table 2. Confusion matrix of the classifica�on created by
InterIMAGE using interpreta�on of histograms. Table 3. Confusion matrix of the classifica�on
created by InterIMAGE using data mining.
4. Conclusions
The results showed that the classifica�on using data mining to build the decision rules was
more efficient to map the coverage of urban areas, than the classifica�on performed solely for the visual analysis of histograms generated in InterIMAGE itself. The percentages of
overall accuracy (global) for the classifica�on generated by InterIMAGE with rules generated
by visual interpreta�on of histograms achieved overall index, or gobal, (Hellden et al., 1980), Kappa index (Cohen, 1960) and Tau Index (Klečka, 1980) of 90.6%, 89.4% and 89.5%,
respec�vely, while the result of classifica�on rules generated by data mining reached values
of 92.6%, 91.6% and 91.7% respec�vely.
References
Cohen J., 1960, Coeficient of Agreement for Nominal Scales. Educa�onal and Measurment.
Volume XX, Issue 1: 37-46. Costa G., Pinho C., Feitosa R., Almeida C., Kux H., Fonseca L., Oliveira D., 2008, INTERIMAGE:
Uma Plataforma Cogni�va Open Source para a Interpretação Automá�ca de
Imagens Digitais. Brazilian Journal of Cartography, Volume 60: 331-337. Hay G., Cas�lla G., 2008, Geographic Object-based Image Analysis (GEOBIA): a new name for
a new discipline. In Object-based image analysis-spa�al concepts for knowledge-
driven remote sensing applica�ons, Blaschke T., Lang S., Hay G. (editors), Springer Verlag, Berlin.
Hellden U., Stern M., 1980, Evalua�on of Landsat Imagery and Digital Data for Monitoring Deser�fica�on Indicators in Tunisia. Proceedings 14th Int. Symp. on Rem. Sens. of
Environ., pp. 1601-1611.
Klecka W., 1980, Discriminant Analysis. SAGE Publica�ons, Inc., Beverly Hills, California, pp. 71.
Quinlan R., 1993, C4.5: Programs for Machine Learning Morgan Kaufmann Publishers. Inc.,
San Francisco, CA, USA.