comparison of punching shear requirements in bs8110, ec2 · pdf file · 2016-03-221...
TRANSCRIPT

1
COMPARISON OF PUNCHING SHEAR REQUIREMENTS IN BS8110, EC2 AND
MC2010
Soares LFS and Vollum RL
Department of Civil and Environmental Engineering
Imperial College London, London SW7 2AZ, United Kingdom
Corresponding author: Dr Robert L Vollum
Department of Civil and Environmental Engineering
Imperial College London, London SW7 2AZ, United Kingdom
Email: [email protected]
Phone +44 (0)20 75945992
Fax: +44(0)20 75945934

2
Abstract
This paper compares design provisions for punching shear at internal columns in the
superseded British Standard BS8110, Eurocode 2 (EC2) and fib Model Code 2010
(MC2010). The latter is based on the Critical Shear Crack Theory (CSCT) of Muttoni which
relates shear resistance to the width of the so called “critical shear crack” which depends on
slab rotation. Parametric studies are presented which show BS8110 to require significantly
less shear reinforcement within 1.5d (where d is the slab effective depth) of the loaded area
than EC2 and MC2010 both of which have been extensively calibrated against test data. This
raises the question of whether flat slabs designed with BS8110 have an adequate factor of
safety against punching failure. This question is explored using nonlinear finite element
modelling in conjunction with MC2010 Level IV. It is shown that punching resistance at
internal columns can be increased significantly by restraint from the surrounding slab but the
strength increase is variable and in the case of uniformly loaded slabs already largely
included in BS8110 and EC2.
Notation
Asl area of tensile reinforcement
Asw area of shear reinforcement in each perimeter
c side length of square column
d average effective depth of slab
db shear reinforcement diameter
dg maximum diameter of aggregate
dv reduced effective depth of slab
Es modulus of elasticity of reinforcement
F total load applied to each panel of flat slab
fc compressive cylinder strength of concrete

3
fck characteristic compressive cylinder strength of concrete at 28 days
fct tensile strength of concrete
fcu characteristic cube strength of concrete
fy yield strength of reinforcement
fyw yield strength of shear reinforcement
h slab thickness
kdg effectiveness coefficient dependent on maximum aggregate size
ke effectiveness coefficient for eccentric shear
ksys efficiency factor for punching shear reinforcement system
k coefficient relating shear resistance to slab rotation
L span between column centrelines
mR nominal moment capacity per unit width
ms average bending moment per unit width
Msup design support moment across panel width
rc radius of equivalent circular column (2c/π for square columns)
rq radius of load introduction
rs radius of an isolated slab element
so radial spacing to first perimeter of shear reinforcement from column face
sr radial spacing of shear reinforcement
u length of basic control perimeter
uout length of first control perimeter at which shear reinforcement is not required
V shear force
VR,c shear resistance of slab without shear reinforcement
VR,cs combined shear resistance of concrete and shear reinforcement
VR,max maximum possible shear resistance
4
VR,out shear resistance outside shear reinforced zone
VR,s shear resistance provided by shear reinforcement
Vtest measured failure load
coefficient to account for uneven shear
c partial factor for concrete
m BS8110 partial safety factor for shear
s partial factor for reinforcement
y reinforcement yield strain
ρ flexural tension reinforcement ratio
ρxl, ρyl flexural tension reinforcement ratio in x and y directions
sw shear reinforcement stress
ψ slab rotation outside critical shear crack
Introduction
The paper considers design for punching shear at the internal columns of solid flat
slabs. The relative economy of flat slabs depends on their thickness which is governed by
either deflection limits or punching resistance. Thinner slabs not only save on direct material
costs of the frame and supporting foundations but also reduce cladding costs due to reduced
floor-to-floor heights. There is no generally accepted theoretical treatment of punching and
design methods are calibrated with data from test specimens like that shown in Figure 1 in
which the line of radial contraflexure is fixed and compressive membrane effects are
minimal. Neither of these assumptions is realistic for flat slabs in which punching resistance
can be significantly increased by restraint from the surrounding slab (Ockelston, 1955). The
benefit of compressive membrane action on punching resistance has been demonstrated
experimentally by researchers including Rankin and Long (1987), Chana and Desai (1992a)
5
and Salim and Sebastian (2003). Regan (1986) carried out tests on cross shaped solid slab
specimens which showed that punching resistance is increased by rotational restraint at slab
edges. More recently, Choi and Kim (2012) tested three internal slab-column connections
with a complex setup intended to provide zero rotation at the slab edges. The punching
resistance was found to be almost independent of the percentage of moment redistribution
used in the calculation of design moments contrary to the recommendations of BS8110 (BSI,
1997) and EC2 (BSI, 2004a) which relate shear resistance to the flexural reinforcement ratio
over columns.
EC2 is the current UK standard for concrete structures having replaced BS8110:1997
(BSI, 1997) in 2010. Interestingly, BS8110: 1985 (BSI, 1985) could halve the area of shear
reinforcement required by the previous UK code CP110 (BSI, 1972). Unsurprisingly, this
caused concern which resulted in a test programme (Chana and Desai, 1992b), funded jointly
by the Department of Environment and British Cement Association, that led to BS8110 being
revised in 1992. EC2 and MC2010 (fib, 2012) typically require significantly more punching
shear reinforcement within 1.5d of columns than the 1992 amendment to BS8110. Therefore,
it is striking that there is no evidence of punching failure in flat slabs designed with BS8110.
The most recent international design recommendations for punching are found in MC2010,
which may influence future revisions of EC2. The MC2010 recommendations are based on
the critical shear crack theory (CSCT) of Muttoni (2008), which relates punching resistance
to the slab rotation, outside the so called critical shear crack. EC2 and BS8110 neglect any
increase in punching resistance due to restraint from the surrounding slab but its effect can be
modelled with the CSCT (Einpaul et al. 2015) using MC2010 Level IV (Muttoni and
Fernandez-Ruiz, 2012).

6
Comparison of design methods for punching in BS8110, EC2 and MC2010
All three methods take the punching resistance of slabs with shear reinforcement as
the least of VR,cs and VR,out but not greater than VR,max where:
i. VR,cs = VR,c+ VR,s ≥ VR,c is the combined shear resistance of concrete VR,c where
≤ 1 and shear reinforcement VR,s.
ii. VR,c = vcud is the strength of an otherwise similar slab without shear reinforcement
in which vc is the design concrete shear stress, u is the basic control perimeter and
d is the average slab effective depth.
iii. VR,out = vcuoutd ≥ VR,c is the shear resistance provided by concrete along a perimeter
of length uout just outside the shear reinforcement.
iv. VR,max is the maximum possible punching resistance for given column size, slab
effective depth and concrete strength.
BS8110 adopts rectangular perimeters for u and uout that are located respectively at
1.5d from the column face and 0.75d from the outer perimeter of shear reinforcement. EC2
locates u at 2d from the column face and uout at 1.5d from the outer perimeter of shear
reinforcement. MC2010 adopts a similar approach but locates u at 0.5d from the column face,
unless the loaded area is recessed into the slab, and uout at 0.5dv from the outer perimeter of
shear reinforcement where dv is the effective depth for shear which is taken as d-25 mm in the
parametric studies of this paper (where 25 mm is the cover to the shear studs). BS8110 and
EC2 multiply the design shear force by to account for the effects of uneven shear due the
support reaction being eccentric whereas MC2010 reduces the design shear resistance by the
multiple ke. At internal columns, in cases where lateral stability does not depend on frame
action, can be taken as 1.15 and ke as 0.9. The maximum shear stress in the slab around the
column is limited to 0.8√fcu in BS8110 and 0.3(1-fck/250)fck/c in the UK National Annex to

7
EC2 (BSI, 2004b) in which c is the partial factor for concrete which EC2 and MC2010 take
as 1.5. All three codes take the design yield strength of reinforcement as fyk/s where s =
1.15.
BS8110
The punching resistance without shear reinforcement is given by:
𝑉𝑅𝑑,𝑐 (𝐵𝑆8110) = 𝑣𝑅𝑑𝑐𝑢𝑑 = 0.27(100𝜌𝑓𝑐𝑢)13(
400
𝑑)
14𝑢𝑑/𝛾𝑚
(1)
where 𝜌 =𝐴𝑠𝑙
𝑏𝑑≤ 0.03 is the flexural reinforcement ratio, 𝑓𝑐𝑢 is the characteristic
compressive concrete cube strength and d is the effective depth. m has a design value of
1.25. BS8110 limits fcu to 40 Mpa in its design equations for shear but this limit is not applied
in this paper as it is unduly restrictive.
BS8110 requires shear reinforcement to be provided in rectangular perimeters centred
on the column. The required area of shear reinforcement is calculated in terms of the design
shear stress v as follows:
Σ1.5𝑑𝐴𝑠𝑤 ≥(𝑣 − 𝑣𝑅𝑑𝑐)𝑢𝑑
𝑓𝑦𝑤𝑑≥
0.4𝑢𝑑
𝑓𝑦𝑤𝑑 𝑓𝑜𝑟 𝑣 ≤ 1.6𝑣𝑅𝑑𝑐 (2)
Σ1.5𝑑𝐴𝑠𝑤 ≥5(0.7𝑣 − 𝑣𝑅𝑑𝑐)𝑢𝑑
𝑓𝑦𝑤𝑑 𝑓𝑜𝑟 1.6𝑣𝑅𝑑𝑐 ≤ 𝑣 ≤ 2𝑣𝑅𝑑𝑐
(3)
where 𝑣 = 𝛽𝑉𝐸𝑑
𝑢𝑑 and 𝑣𝑅𝑑𝑐 =
𝑉𝑅𝑑𝑐
𝑢𝑑. The required shear reinforcement Σ1.5𝑑𝐴𝑠𝑤 is provided
over at least two perimeters of which the first perimeter should not contain less than
0.4Σ1.5𝑑𝐴𝑠𝑤. The first perimeter of shear reinforcement is provided at 0.5d from the column
face with successive perimeters positioned at spacings of 0.75d. The spacing of shear
reinforcement around a perimeter must not exceed 1.5d. Equations (2) and (3) are
subsequently used to design the shear reinforcement on successive square perimeters spaced
at multiples of 0.75d from the basic control perimeter.

8
EC2
𝑉𝑅𝑑,𝑐 = 0.18(100𝜌𝑓𝑐𝑘)13(1 + (200 𝑑⁄ )0.5)𝑢𝑑/𝛾𝑐 (4)
where 𝜌 = (𝜌𝑥𝑙𝜌𝑦𝑙)0.5
≤ 0.02 in which 𝜌𝑥𝑙 and 𝜌𝑦𝑙 are the flexural tension reinforcement
ratios 𝐴𝑠𝑙
𝑏𝑑 within a slab width equal to the column plus 3d to each side.
The required area of shear reinforcement is calculated as follows:
1.5𝐴𝑠𝑤
𝑑
𝑠𝑟≥
𝛽𝑉𝐸𝑑 − 0.75𝑉𝑅𝑑𝑐
𝑓𝑦𝑤𝑑,𝑒𝑓 (5)
where 𝐴𝑠𝑤 is the area of shear reinforcement in each perimeter, sr is the radial spacing of the
shear reinforcement and 𝑓𝑦𝑤𝑑,𝑒𝑓 = (250 + 0.25𝑑) ≤ 𝑓𝑦𝑤𝑑.
In addition to limiting the maximum shear stress around the column, EC2 limits the
maximum possible design shear force to VRdc where is a Nationally Determined Parameter
with a recommended value of 1.5 that is increased to 2 in the UK National Annex (BSI,
2004b).
Figure 6.22 of EC2 shows shear reinforcement being provided in radial or cross type
configurations of which radial is most efficient. The radial spacing of the first perimeter of
shear reinforcement from the column must lie between 0.3 and 0.5d. The maximum radial
spacing of successive perimeters of shear reinforcement is 0.75d. The circumferential spacing
of vertical legs of shear reinforcement should not exceed 1.5d within the first control
perimeter and 2d outside where “that part of the perimeter is assumed to contribute to the
shear capacity”.
MC2010
MC2010 has four levels of design of which Levels I to III are intended for design and
Level IV for assessment. Level III is recommended for slabs with irregular geometry. The
shear resistance is calculated in terms of the slab rotation which Level II calculates as
follows:
9
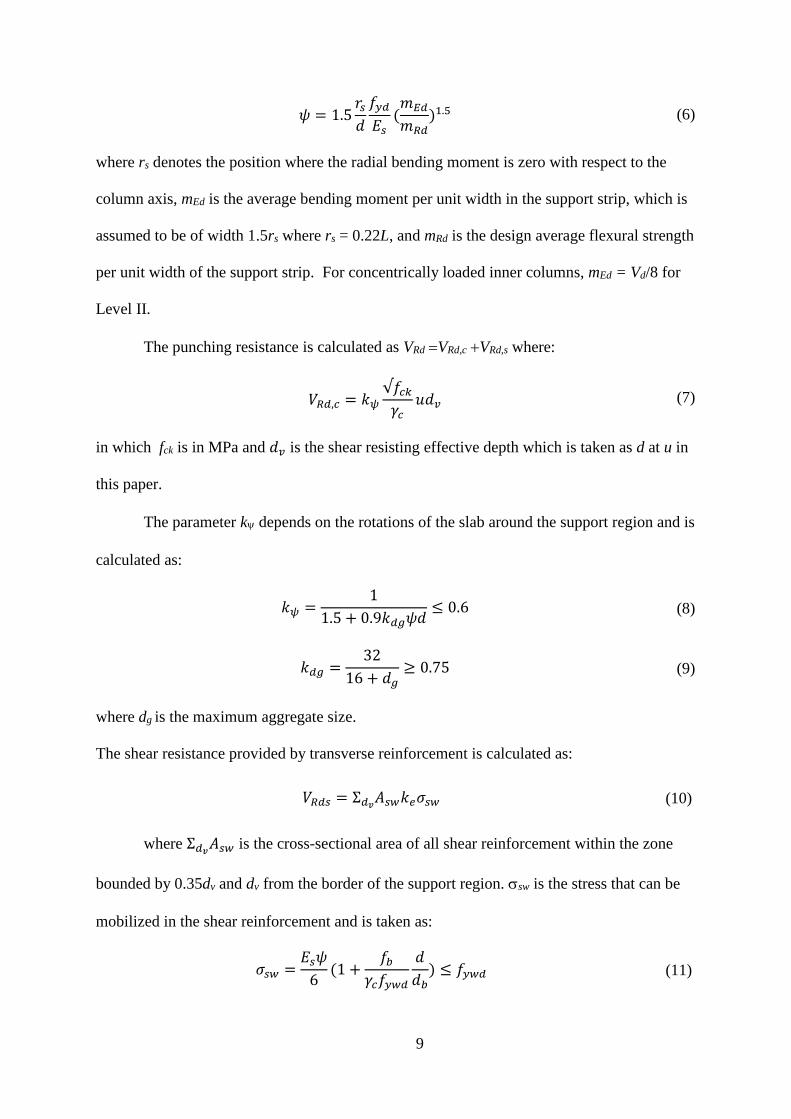
𝜓 = 1.5𝑟𝑠
𝑑
𝑓𝑦𝑑
𝐸𝑠(𝑚𝐸𝑑
𝑚𝑅𝑑)1.5 (6)
where rs denotes the position where the radial bending moment is zero with respect to the
column axis, mEd is the average bending moment per unit width in the support strip, which is
assumed to be of width 1.5rs where rs = 0.22L, and mRd is the design average flexural strength
per unit width of the support strip. For concentrically loaded inner columns, mEd = Vd/8 for
Level II.
The punching resistance is calculated as VRd VRd,c VRd,s where:
𝑉𝑅𝑑,𝑐 = 𝑘𝜓
√𝑓𝑐𝑘
𝛾𝑐𝑢𝑑𝑣 (7)
in which fck is in MPa and 𝑑𝑣 is the shear resisting effective depth which is taken as d at u in
this paper.
The parameter kdepends on the rotations of the slab around the support region and is
calculated as:
𝑘𝜓 =1
1.5 + 0.9𝑘𝑑𝑔𝜓𝑑≤ 0.6 (8)
𝑘𝑑𝑔 =32
16 + 𝑑𝑔≥ 0.75 (9)
where dg is the maximum aggregate size.
The shear resistance provided by transverse reinforcement is calculated as:
𝑉𝑅𝑑𝑠 = Σ𝑑𝑣𝐴𝑠𝑤𝑘𝑒𝜎𝑠𝑤 (10)
where Σ𝑑𝑣𝐴𝑠𝑤 is the cross-sectional area of all shear reinforcement within the zone
bounded by 0.35dv and dv from the border of the support region. sw is the stress that can be
mobilized in the shear reinforcement and is taken as:
𝜎𝑠𝑤 =𝐸𝑠𝜓
6(1 +
𝑓𝑏
𝛾𝑐𝑓𝑦𝑤𝑑
𝑑
𝑑𝑏) ≤ 𝑓𝑦𝑤𝑑 (11)

10
where db is the shear reinforcement diameter and 𝑓𝑏 is the bond strength which is taken as 4.5
MPa in this paper as allowed by MC2010.
The maximum punching resistance is limited by crushing of concrete struts near the
support region such that:
𝑉𝑅𝑑,𝑚𝑎𝑥 = 𝑘𝑠𝑦𝑠𝑘𝜓
√𝑓𝑐𝑘
𝛾𝑐𝑢𝑑𝑣 ≤
√𝑓𝑐𝑘
𝛾𝑐𝑢𝑑𝑣 (12)
The coefficient ksys accounts for the performance of punching shear reinforcing
systems and is taken as 2.4 for stirrups and 2.8 for studs provided the radial spacing to the
first perimeter of shear reinforcement from the column face so is less than or equal to 0.5dv
and the spacing of successive perimeters of shear reinforcement is less than 0.6dv. The
spacing of vertical legs of shear reinforcement around a perimeter should not exceed 3dv
where that part of the perimeter is assumed to contribute to the shear capacity.
Evaluation of BS8110, EC2 and MC2010 design methods for punching with test data
It is well established that EC2 and the CSCT (Muttoni, 2008), on which MC2010 is
based, give similar and reasonable predictions of the punching resistance of test specimens
like Figure 1. For example, Ferreira et al. (2014) compared the predictions of EC2 and the
CSCT, with partial factors of 1.0, for 45 tests with shear reinforcement. They found the mean
() and covariance (COV) of Vtest/Vcalc to be =1.19:COV=0.136 for EC2 and
=1.16:COV=0.121 for the CSCT. Closer inspection shows the similarity of these statistics to
be misleading since in 14 cases EC2 falsely predicts failure to occur outside the shear
reinforcement compared with only 5 cases for the CSCT. This is concerning because the
introduction of partial factors c = 1.5 and s = 1.15 into EC2 makes failure outside the shear
reinforcement unlikely because it causes a 50% increase in uout which is not matched by a
corresponding increase in punching resistance within the shear reinforcement VRcs as
discussed by Vollum et. al. (2010).

11
The BS8110 design provisions are not strictly applicable to the test specimens
considered by Ferreira et al. (2014) as the detailing of shear reinforcement did not comply
with the onerous requirement of BS8110 that the transverse spacing of vertical legs should
not exceed 1.5d. Nevertheless, an analysis was carried out to determine the accuracies of
BS8110, EC2 and MC2010 at predicting the punching resistance inside the shear
reinforcement Vin. Each method was used to calculate Vtest/Vin for 40 specimens that failed
within the shear reinforcement. The analysis considered 25 specimens of Ferreira et al.
(2014), specimens PL6 to PL12 inclusive of Lips et al. (2012) and specimens 2 to 9 of Chana
and Desai (1992b) which formed the basis of the 1992 amendment to BS8110. All the
specimens were reinforced with studs except those of Chana and Desai which were
reinforced with stirrups. In the case of MC2010, slab rotations were calculated as follows
(Muttoni, 2008):
𝜓 = 1.5𝑟𝑠
𝑑
𝑓𝑦
𝐸𝑠(
𝑉
𝑉𝑓𝑙𝑒𝑥)
32⁄ (13)
Vflex was calculated in accordance with the recommendations of Muttoni (2008) as:
𝑉𝑓𝑙𝑒𝑥 = 2𝜋𝑚𝑅
𝑟𝑠
𝑟𝑞 − 𝑟𝑐 (14)
in which rs is the radius of the slab, rq is the radius of load introduction and rc is the radius of
a circular column with the same perimeter as the column under consideration. The coefficient
ksys was taken as 2.8 in the calculation of VRdmax with equation (12).
Results are shown without and with partial factors in Figures 2a and b which also
show mean and lower characteristic (5%) values of Vtest/Vin. MC2010 gives conservative
estimates of Vin with c = s = 1.0 unlike BS8110 and EC2 of which BS8110 is least safe. The
BS8110 5% values of Vtest/Vin increase from 0.60 to 0.72 for c = s = 1.0 and from 0.74 to
0.89 for c = 1.5 and s = 1.15 when the limit on VRd,max is omitted due to reduction in scatter.

12
Modelling of restraint from surrounding slab with MC2010 Level IV
MC2010 Level IV was used to investigate whether restraint from the surrounding slab
is sufficient to explain the satisfactory performance of flat slabs designed to BS8110.
Consideration of equations (6) to (12) shows that the calculated shear resistance is
independent of the axial force in the slab which implies increases in strength from
compressive membrane action result from reductions in rotation. Justification for this
assumption is provided by analysis of tests on prestressed slabs (Clément et al., 2014). The
first step involved the development of a nonlinear finite element (NLFEA) procedure for
calculating slab rotations. The procedure was calibrated with data from the internal slab-
column punching tests of Guandalini et al. (2009) and Lips et al. (2012). All the slabs
measured 3 m square on plan. The flexural reinforcement ratios ranged between 0.33% and
1.63% as shown in Table 1 which gives details of the test specimens including geometry,
material properties, failure loads and ultimate rotations. The rotations were measured with
inclinometers positioned at 1.38m from the column centreline at the positions depicted with
small triangles in Figure 1.
The slabs were modelled with four-node quadrilateral isoparametric curved shell
elements incorporating embedded reinforcement bars. A 2 × 2 × 9 integration scheme was
adopted for the curved shell elements, where 9 denotes the number of integration points
through the slab thickness, as recommended by Vollum and Tay (2007). Following a mesh
sensitivity study, the element size was chosen to be around 50 mm square, with the exact
dimensions dependent on the column size over which the nodes of the slab were vertically
restrained.
The concrete was modelled with the ‘total strain fixed crack model’ in DIANA which
evaluates stress-strain relationships in the directions of the principal axes at first cracking. A
linear tension softening stress-strain relationship was used for concrete. Following the

13
recommendations of Vollum and Tay (2007), the tensile stress was assumed to reduce from a
peak value of 0.5fct, where fct is the mean indirect tensile strength calculated in accordance
with EC2 (see Table 1), to zero at half the reinforcement yield strain y. The Thorenfeldt
model (Thorenfeldt et al., 1987) was used to model concrete in compression. The reduction in
concrete compressive strength due to lateral cracking was modelled as recommended by
Vecchio and Collins (1993). A sensitivity study showed the calculated rotations to be almost
independent of the shear retention factor which was taken as 0.9. The concrete elastic
modulus was calculated in accordance with EC2.
The NLFEA includes the effect of compressive membrane action unlike equation (6)
(Muttoni, 2008). The measured and calculated rotations agreed well up to around 50% of the
failure load when calculated with the full short term concrete elastic modulus but the
measured slopes were significantly underestimated at failure. Figure 3 shows that much better
estimates were obtained of the ultimate rotations when the concrete elastic modulus was
reduced to half its short term value.
Assessment of Chana and Desai (1992a) punching tests with membrane action
The tests of Chana and Desai (1992a) are particularly pertinent to this investigation.
They tested five 9 m square by 250 mm thick slabs which were supported at their centre on a
400 mm square plate and by block walls along all four edges. All the slabs had the same
flexural reinforcement and the cube strengths were similar at around 40 MPa. Four slabs had
shear reinforcement. The slabs were loaded at eight equally spaced points which were centred
on the loading plate at a radius of 1.2 m. The tests showed that restraint from the surrounding
slab increased the punching resistance by 30-50% compared with Chana and Desai’s (1992b)
punching specimens of the type shown in Figure 1.
The punching resistances of Chana and Desai’s (1992a) slabs FPS1 (without shear
reinforcement) and FPS5 (with shear reinforcement) were evaluated with MC2010 Level IV.

14
Comparisons were also made with the shear resistance of Chana and Desai’s (1992b) 3 m
square punching specimens. Rotations were calculated with NLFEA, using the procedure
described previously. The 3 m square panels were modelled with 50 mm square elements and
the 9 m square panels with 100 mm square elements. Figure 4a shows that the measured and
calculated deflections agree well which is significant as MC2010 attributes the increase in
punching resistance from restraint to the reduction in rotation and hence deflection. The
resulting load rotation responses are shown in Figure 4b along with the MC2010 punching
resistances for slabs FPS1 and FPS5. Rotations are shown along the slab centreline at the
loading radius, as measured in the tests of Lips et al. (2012), and additionally in the 9 m
square slab at 0.7 m from the column centreline where rotations were greatest. For
comparison, Figure 4b also shows rotations calculated with equation (13) which is applicable
to the 3 m square panels. The calculated failure load is given by the intersection of the
rotation and resistance curves. When the effect of continuity is included, the ratio Vtest/Vcalc
for maximum rotations is 1.12 for FPS1 and 1.41 for FPS5. A measure of the influence of
continuity is the ratio of the shear resistances given by the Level IV analysis with continuity
and equation (13). This ratio is 1.52 for FPS1, which is close to the measured ratio of 1.4, and
1.07 for FPS5 which is significantly less than the measured ratio of 1.4. The underestimate in
strength of FPS5 is a consequence of MC2010 neglecting shear deformation in the
calculation of shear reinforcement stress.
Parametric studies to compare shear reinforcement requirements of BS8110, EC2 and
MC2010
A parametric study was undertaken to investigate how the required areas of shear
reinforcement vary at the internal columns of flat slabs according to BS8110, EC2 and
MC2010 Level II. The span L between the column centrelines was taken as 7.5m and the
internal columns as 450 mm square. The superimposed dead load was taken as 1.5 kN/m2 and

15
the superimposed live load was varied between 2.5 kN/m2 and 10 kN/m2. Dead and imposed
load factors of 1.35 and 1.5 were used with EC2 and MC2010 and corresponding load factors
of 1.4 and 1.6 with BS8110. Characteristic material strengths of fck = 30 MPa and fyk = 500
MPa were adopted in conjunction with code recommended material partial factors. The slab
thickness was related to the design imposed loading in accordance with Goodchild’s (2009)
recommendations for economic frame construction. The resulting slab thicknesses and mean
effective depths are given in Table 2.
BS8110 and the UK National Annex to EC2 allow design moments for slabs to be
calculated using a single load case in which all spans are fully loaded provided the support
moments are redistributed downwards by 20% and span moments increased accordingly. The
parametric study investigates the effect of this moment redistribution on the amount of shear
reinforcement required by each code. Consequently, the hogging moment at the column
centreline was taken as either its elastic value of 0.083FL or 0.063FL from Table 3.12 of
BS8110 which includes the 20% moment redistribution mentioned above (F is the total load
on each panel). In each case the design span moment was taken as 0.063FL as given in Table
3.12 of BS8110 for interior panels. However, the same areas of hogging and sagging
reinforcement were provided in the panels designed for Msup = 0.083FL to simulate the
common practice of adding surplus flexural reinforcement in the span to control deflection
(Vollum, 2009). To maximise the difference between the two cases, the design hogging
moment for flexural reinforcement was taken at the centreline of the column for elastically
designed slabs and at hc/3 from the column centreline for slabs designed for Msup = 0.063FL.
The latter moments satisfy the BS8110 requirement that the sum of the maximum span
moment and average support moments across the panel width should exceed F(L-2hc/3)2/8.
Additionally, the calculated areas of flexural reinforcement were increased by 4% in the slabs
designed for Msup = 0.083FL to allow for rationalisation of the reinforcement arrangement.

16
The design hogging moment was proportioned between the column and middle strips in the
ratio 75:25 with two thirds of the column strip reinforcement placed in its central half in
accordance with the requirements of BS8110 and EC2. The design shear force was multiplied
by = 1.15 in accordance with the recommendations of BS8110 and EC2. In the case of
MC2010, the control perimeter u was multiplied by ke = 0.9 and the maximum possible shear
resistance was calculated with ksys = 2.8 in equation (12) as recommended for studs.
The punching shear reinforcement was arranged radially in the EC2 and MC2010
designs but in square perimeters for the BS8110 designs. In the BS8110 and EC2 designs, the
spacing of perimeters of shear reinforcement was taken as 0.5d, 1.25d, 2.0d etc. from the
column face in accordance with UK practice. The perimeter spacing was reduced to 0.5d in
the MC2010 designs as the required area of shear reinforcement doubles for spacings of 0.5d,
1.25d, 2.0d etc. since only one perimeter crosses the critical shear crack.
Figure 5 shows the variation in V/ VRmax EC2 (where VRmax EC2 = 2VRdc EC2) with design
imposed load, and hence slab thickness, according to BS8110, EC2 and MC2010 for design
hogging moments of 0.063FL and 0.083FL. The economic slab thicknesses of Goodchild
(2009) are seen to comply with the BS8110 and UK National Annex to EC2 restrictions on
VRmax = 2VRdc but not the recommended code limit of VRmax = 1.5VRd,c which is intended for
stirrups. In the case of MC2010, VRmax is critical for all slabs with Msup = 0.063FL.
Figure 6a compares the total areas of shear reinforcement required by each code
within 1.5d of the column face neglecting the limit on VRmax which invalidates the MC2010
designs with Msup = 0.063FL. BS8110 requires the least area of shear reinforcement and
MC2010 the most. The difference between BS8110 and the other codes is greatest for slabs
designed for Msup = 0.083FL as the design shear force is less than 1.6VRd,c making equation
(2) of BS8110 applicable.
The shear reinforcement installation time depends on the total number of shear studs,

17
which is governed by uout, and spacing rules rather than Asw which determines the stud
diameter for a given shear reinforcement arrangement. Therefore, the required normal
distances from the column face to the outer row of shear reinforcement are compared for each
method in Figure 6b which shows remarkable disparities between the extents of shear
reinforcement required by each code particularly for Msup = 0.063FL where the extent of
shear reinforcement required by MC2010 is much greater than for BS8110 or EC2. The
difference is in part due to MC2010 basing shear resistance at uout on the critical shear crack
width around the column which is particularly unrealistic once reinforcement yields over the
column.
The minimum possible slab thickness can be limited by VRmax in thin slabs with edge
and corner columns being most critical. In this case, VRmax can be increased by providing
surplus hogging flexural reinforcement as shown in Figure 7a for a 265 mm thick slab. The
shear resistances in Figure 7a are normalised by VRdc EC2 calculated with Asprovided=Asrequired for
design support moments of 0.063FL and 0.083FL respectively. Figure 7a shows that MC2010
(with ksys = 2.8) gives significantly lower maximum possible shear resistances than BS8110
or the UK National Annex to EC2 which limit VRmax to 2VRdc. Figure 7b compares the areas of
shear reinforcement required by each code, within 1.5d of the column face, for a design
imposed load of 5 kN/m2. EC2 and MC2010 require greatly more shear reinforcement than
BS8110 particularly in cases where increasing Asprovided/Asrequired makes equation (2) govern.
Influence of restraint from surrounding slab
MC2010 Level IV was used to assess the influence of restraint from surrounding bays
on the punching resistance of the slabs designed in the previous section. Rotations were
calculated with NLFEA using the procedure described previously. The boundary conditions
were varied as shown in Figure 8 of which 8a represents a conventional punching shear
specimen of width 0.44L. Figure 8b represents 1/4 of an internal panel of a flat slab of span L

18
with rotational restraint at mid-span and 8c a slab with in-plane and rotational restraint at
mid-span. The isolated slab of Figure 8a was loaded at eight points around its perimeter to
simulate a conventional punching test whereas the continuous slabs were loaded uniformly.
The rotations were extracted from the NLFEA along the slab centreline at around 0.2L from
the column centre as measured by Lips et al. (2012). This position was chosen because it was
used in the calibration of the NLFEA and is close to the position of maximum rotation as
shown in Figure 9 for Msup =0.063FL and qk = 2.5 kN/m2. Figures 10a to d present the
calculated load versus rotation responses for slabs designed for Msup = 0.063FL and 0.083FL
with design imposed loads of 2.5 kN/m2 and 7.5 kN/m2. Additionally to NLFEA, rotations
were calculated with equations (6), (13) and Muttoni’s (2008) quadrilinear moment-curvature
relationship which includes tension stiffening. The NLFEA rotations are denoted as follows
in Figures 9 and 10:
Conventional: NLFEA of isolated slab (see Figure 8a);
Continuous: NLFEA of continuous slab with rotational restraint (see Figure 8b);
Continuous + Axial: NLFEA of continuous slab with rotational and in-plane restraint
(see Figure 8c).
Figure 10 also shows the punching resistances according to MC2010 for the areas of shear
reinforcement required by BS8110, EC2 and MC2010 (respectively denoted “BS8110
resistance”, “EC2 resistance” and “MC2010 resistance”) as well as VRmax = 2.8VR,dc where
critical. The punching resistances were calculated with c = s = 1.0, ke = 0.9 and db = 12 mm.
Failure loads are given by the intersection of the resistance and rotation curves. The design
ultimate shear force VEd = F is shown for comparison as is the flexural failure load of a
comparable conventional test specimen which is denoted “PYL test specimen”. The rotations
given by Muttoni’s quadrilinear relationship compare well with those given by NLFEA of
isolated slabs up to around 70% of the flexural capacity given by equation (14). Figure 10

19
shows that rotational restraint at the panel edges increases punching resistance above that
given by Muttoni’s quadrilinear relationship or equation (13). Even greater resistances are
obtained with rotational and full in-plane restraint but the latter is not generally available in
flat slabs. Equation (6) is seen to conservatively estimate the benefit of rotational restraint
from surrounding panels.
The calculated punching resistances are summarized in Table 3 which also shows the
areas of shear reinforcement included in the calculation of punching resistance with MC2010.
Strikingly when rotational restraint is included, Vcalc/F is only around 20% greater for
MC2010 than BS8110 despite MC2010 requiring 2.25 to 4 times the area of shear
reinforcement within d of the column face. The ratio of resistances calculated with rotational
restraint (continuous) and equation (13) gives an upper bound to the increase in strength due
to rotational restraint. Table 3 shows this ratio varies between 1.12 and 1.49 and is typically
less than the 30-50% found by Chana and Desai (1992a). Despite this, rotational restraint
appears sufficient to explain the satisfactory performance of internal slab-column connections
designed with BS8110 though according to MC2010, which tends to underestimate strength,
the factor of safety is close to 1.0. The EC2 designs appear optimum from the view of
economy and safety.
Influence of continuity on punching resistance of nine panel flat slab
The effect of structural continuity on the punching resistance of uniformly loaded flat
slabs can be seen by analysing the 3/4 scale 9 panel flat slab tested by Guralnick and Fraugh
(1963). The slab was 133 mm thick, with a mean effective depth of 109.5 mm, and spanned
4.57 m between column centrelines. The internal columns were 457 mm square. No shear
reinforcement was provided. Deformed reinforcement bars were used with mean yield
strength of 276 MPa. The concrete cylinder strength was 32.5 MPa. The slab was loaded to
20
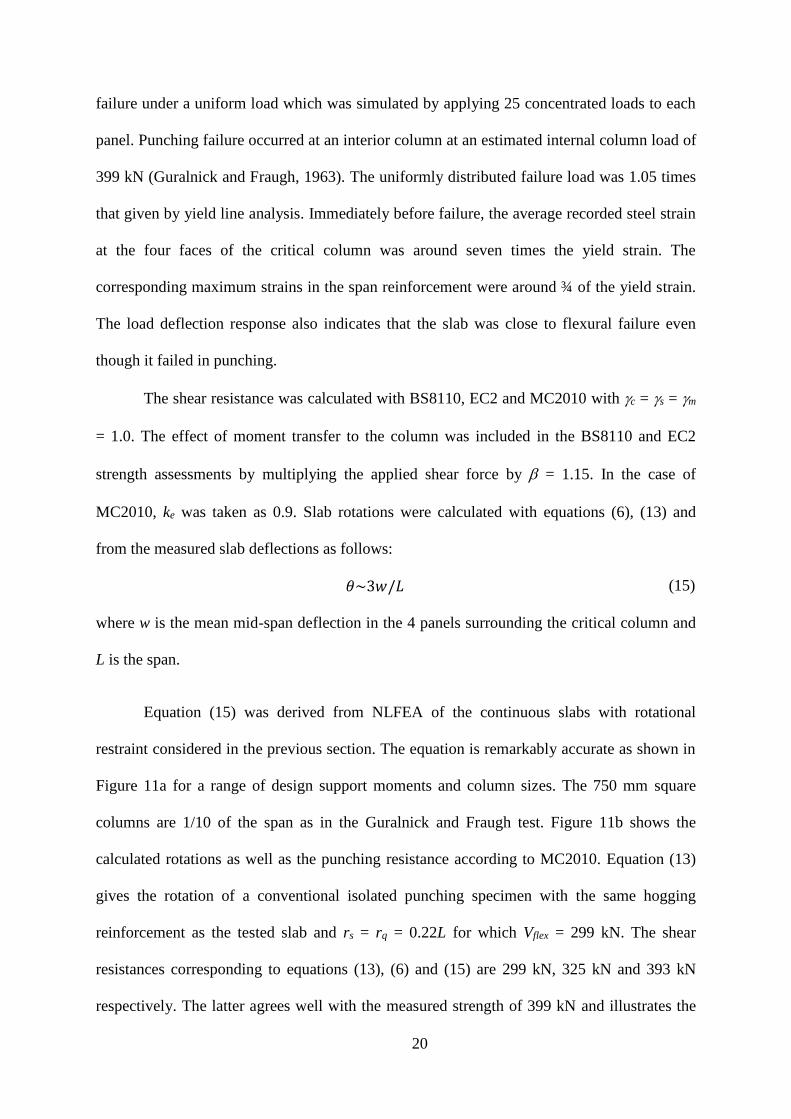
failure under a uniform load which was simulated by applying 25 concentrated loads to each
panel. Punching failure occurred at an interior column at an estimated internal column load of
399 kN (Guralnick and Fraugh, 1963). The uniformly distributed failure load was 1.05 times
that given by yield line analysis. Immediately before failure, the average recorded steel strain
at the four faces of the critical column was around seven times the yield strain. The
corresponding maximum strains in the span reinforcement were around ¾ of the yield strain.
The load deflection response also indicates that the slab was close to flexural failure even
though it failed in punching.
The shear resistance was calculated with BS8110, EC2 and MC2010 with c = s = m
= 1.0. The effect of moment transfer to the column was included in the BS8110 and EC2
strength assessments by multiplying the applied shear force by = 1.15. In the case of
MC2010, ke was taken as 0.9. Slab rotations were calculated with equations (6), (13) and
from the measured slab deflections as follows:
𝜃~3𝑤/𝐿 (15)
where w is the mean mid-span deflection in the 4 panels surrounding the critical column and
L is the span.
Equation (15) was derived from NLFEA of the continuous slabs with rotational
restraint considered in the previous section. The equation is remarkably accurate as shown in
Figure 11a for a range of design support moments and column sizes. The 750 mm square
columns are 1/10 of the span as in the Guralnick and Fraugh test. Figure 11b shows the
calculated rotations as well as the punching resistance according to MC2010. Equation (13)
gives the rotation of a conventional isolated punching specimen with the same hogging
reinforcement as the tested slab and rs = rq = 0.22L for which Vflex = 299 kN. The shear
resistances corresponding to equations (13), (6) and (15) are 299 kN, 325 kN and 393 kN
respectively. The latter agrees well with the measured strength of 399 kN and illustrates the

21
benefit of flexural continuity which is only partly included in equation (6) which is used in
MC2010 Level II. The shear resistances given by BS8110 and EC2 are 413 kN and 377 kN
respectively which suggests that punching resistance was increased by rotational restraint but
not compressive membrane action due to the high utilisation of flexural reinforcement in
surrounding panels.
Conclusion
The paper compares the relative safety of the design rules for punching shear in
BS8110, EC2 and MC2010. Both BS8110 and EC2 are shown to overestimate strength
within the shear reinforced zone with BS8110 being least conservative. MC2010 performs
noticeably better in this respect which is significant because failure outside the shear
reinforcement is unlikely in practice since analysis shows that the introduction of partial
factors tends to make failure inside the shear reinforced zone critical.
Parametric studies (see Figure 5) show that limiting VRmax to ksysVR,dc in MC2010
prevents 20% downwards moment redistribution over the columns of flat slabs, which has
been allowed in the UK for many years. Assessment with MC2010 Level 4 shows that
punching resistance is increased by rotational continuity at mid-span and even more so by
combined in-plane and rotational restraint. The increase in calculated punching resistance due
to rotational continuity is best seen by comparing strengths calculated with rotations from
equation (13) and NLFEA of a complete panel with rotational restraint at mid-span. The
increase in strength due to rotational continuity is partially included in MC2010 Level II if
rotations are calculated with equation (6).
It is necessary to invoke flexural continuity to explain the observed strength of the
Guralnick and Fraugh slab with MC2010, but not BS8110 or EC2, as it increases punching

22
resistance by reducing rotations below those in comparable isolated punching specimens with
which MC2010 is calibrated. The wide variation in calculated failure loads of identical slabs
evident in Figure 10 suggests that the adoption of a rotational based failure criterion could
lead to disagreements between designers and checking engineers. Consequently, the more
empirical design methods of BS8110 and EC2 seem better suited for normal design though
MC2010 is useful for assessment. Rotational restraint from surrounding panels, along with
rounding up of calculated areas of reinforcement, seem sufficient to explain the satisfactory
performance of flat slabs designed to BS8110.
References
BSI (British Standards Institution) (1972) CP 110: The structural use of reinforced concrete
in buildings. BSI, London.
BSI (British Standards Institution) (1985 and 1997) BS 8110: Structural Use of Concrete.
BSI, London.
BSI (2004a) EN 1992-1-1:2004, Eurocode 2, Design of Concrete Structures – Part 1-1:
General Rules and Rules for Buildings. BSI, London.
BSI (British Standards Institution) (2004b) UK National Annex to Eurocode 2, “Design of
Concrete Structures – Part 1-1: General Rules and Rules for Buildings”, CEN, EN 1992-1-1.
Chana PS and Desai SB (1992a) Membrane action, and design against punching shear, The
Structural Engineer 1992, 70 (19): 339-343.
Chana PS and Desai SB (1992b) Design of shear reinforcement against punching, The
Structural Engineer 1992, 70(9): 159-164.
23
Choi J-W and Kim J-H J (2012) Experimental Investigations on Moment Redistribution and
Punching Shear of Flat Plates. ACI Structural Journal 109(3): 329-337.
Clément T, Ramos AP, Fernández Ruiz M , Muttoni A, (2014) Influence of prestressing on
the punching strength of post-tensioned slabs, Engineering Structures, 72(1): 56–69
Einpaul J, Fernández Ruiz M, Muttoni A (2015), Influence of moment redistribution and
compressive membrane action on punching strength of flat slabs, Engineering structures,
86:43-57.
Fernández Ruiz M and Muttoni A (2009) Applications of Critical Shear Crack Theory to
Punching of Reinforced Concrete Slabs with Transverse Reinforcement. ACI Structural
Journal 106(4): 485-494.
Ferreira MP, Melo GS, Regan PE and Vollum RL (2014) Punching of Reinforced Concrete
Flat Slabs with Double-Headed Shear Reinforcement. ACI Structural Journal 111(2): 363-
374.
fib Bulletin 66 (2012), Model Code 2010 Final Draft Volume 2. fédération international du
béton, Lausanne, Switzerland.
Goodchild CH, Webster RM and Elliot KS (2009) Economic concrete Frame Elements to
Eurocode 2. The Concrete Centre, ISBN 978-1-9046818-69-4.
Guandalini S, Burdet OL and Muttoni A (2009) Punching Tests of Slabs with Low
Reinforcement Ratios. ACI Structural Journal 106(1): 87-95.
Guralnick SA and Fraugh RW (1963) Laboratory Study of a 45-Foot Square Flat Plate
Structure. Journal of the American Concrete Institute 60(9), 1107-1185.

24
Lips S, Fernández Ruiz M, and Muttoni A (2012) Experimental Investigation on Punching
Strength and Deformation Capacity of Shear-Reinforced Slabs. ACI Structural Journal
109(6): 889-900
Muttoni A (2008) Punching shear strength of reinforced concrete slabs without transverse
reinforcement. ACI Structural Journal 105(4): 440–450.
Muttoni A and Fernandez-Ruiz MA (2012), The levels-of-approximation approach in MC
2010: application to punching shear provisions, Structural Concrete, 13(1): 32-41.
Ockleston AJ (1955) Load Tests on a three-storey reinforced concrete building in
Johannesburg. The Structural Engineer, 33: 304-322.
Rankin GIB and Long AE (1987) Predicting the enhanced punching strength of interior slab-
column connections, Proc. Institution of Civil Engineers, Part 1, 82, 1165-1186.
Regan PE (1986) Symmetric punching of reinforced concrete slabs. Magazine of Concrete
Research 38(136): 115-128.
Salim W and Sebastian WM (2003) Punching Shear Failure in Reinforced Concrete Slabs
with Compressive Membrane Action. ACI Structural Journal 100(4): 471-479.
Thorenfeldt E, Tomaszewicz A and Jensen JJ (1987) Mechanical properties of high-strength
concrete and applications in design. In Proc. Symp. Utilization of High-Strength Concrete
(Stavanger, Norway) (Trondheim), Tapir.
Vecchio FJ, Collins MP (1993), Compression response of cracked reinforced concrete.
Journal of Structural Engineering, ASCE 119(12): 3590-3610

25
Vollum RL and Tay UL (2007), Modelling tension stiffening in reinforced concrete with
NLFEA, Concrete, 41(1): 40-41.
Vollum RL, Comparison of deflection calculations and span-to-depth ratios in BS8110 and
EC2 (2009), Magazine of Concrete Research, 61(6): 465-476.
Vollum RL, Abdel Fattah T, Eder M and Elghazouli AY (2010), Design of ACI type
punching shear reinforcement to Eurocode 2, Magazine of Concrete Research, 62(1): 3-16.

26
List of Tables
Table 1: Properties of slabs used in calibration of NLFEA
Table 2: Properties of slabs used in parametric studies
Table 3: Influence of continuity on shear strengths calculated with MC2010 with c = s = 1.0
and ke = 0.9
Table 1: Properties of slabs used in calibration of NLFEA
Specimen h
(mm)
ca
(mm)
d
(mm)
fc
(MPa)
fct
(MPa)
ρ
(%)
fy
(MPa)
Vr,test
(kN)
ψ
(‰)
PL1 250 130 x 130 193 36.2 2.272 1.63 583 682 6.0
PV1 250 260 x 260 210 34.0 2.16 1.50 709 974 7.6
PL4 320 340 x 340 267 30.5 2.02 1.58 531 ø20
580 ø26 1625 6.5
PL5 400 440 x 440 353 31.9 2.076 1.5 580 2491 4.7
PG10 250 260 x 260 210 28.5 1.94 0.33 577 540 22.3
PG11 250 260 x 260 210 31.5 2.06 0.75 570 763 10.0
Notes: a Dimension of loaded area in mm
Table 2: Properties of slabs used in parametric studies
Design Hogging Moment 0.063FL 0.083FLa
Design imposed live load [kN/m2] 2.5 5.0 7.5 10.0 2.5 5.0 7.5 10.0
Slab thickness [mm] 239 265 324 363 239 265 324 363
F [kN] 779 1039 1362 1647 779 1039 1362 1647
Average effective depth [mm] 194 220 279 318 194 220 279 318
Mhog As Centre column strip [mm2] 1917 2259 2316 2451 3255 3845 3897 4111
As Edge column strip [mm2] 959 1130 1158 1226 1627 1922 1949 2056
Mhog - As Middle strip [mm2] 959 1130 1158 1226 1627 1922 1949 2056
Mspan As Column strip [mm2] 2498 2943 3017 3193 3580 4229 4287 4523
As Middle strip [mm2] 2043 2408 2469 2613 2929 3460 3508 3700
L = 7.5m, columns 450 mm square, fck = 30 MPa, design imposed dead load 1.5 kN/m2
Note: a Asprovided/Asrequired =1.04 to allow for rationalisation of reinforcement arrangement.

27
Table 3: Influence of continuity on shear strengths calculated with MC2010 with c = s = 1.0
and ke = 0.9
Vcalc/F
Design method
for shear
reinforcement
Boundary
conditions
Msup = 0.063FL Msup = 0.083FL
qk = 2.5
kN/m2
qk = 7.5
kN/m2
qk = 2.5
kN/m2
qk = 7.5
kN/m2
BS8110 Σ𝑑𝑣𝐴𝑠𝑤 [mm2] 433b 1200c 368d 534c
Equations 13 &14 0.74 0.79e 0.80 0.94
Equation 6 0.77 0.83 0.87 0.96
Conventional a 0.82 0.85 0.96 1.05
Continuous a 0.95 0.99 1.01 1.10
Continuous/Eq 13f 1.28 1.25 1.26 1.17
Continuous + axiala 1.22 1.17 1.16 1.21
EC2 Σ𝑑𝑣𝐴𝑠𝑤 [mm2] 878 1538 758 1365
Equations 13 &14 0.79 e 0.79e 0.93 1.01
Equation 6 0.92 0.90 0.99 1.03
Conventional a 0.90 0.89 1.08 1.11
Continuous a 1.06 1.05 1.14 1.13
Continuous/Eq 13f 1.34 1.33 1.23 1.12
Continuous + axiala 1.36 1.20 1.25 1.25
MC2010 Σ𝑑𝑣𝐴𝑠𝑤 [mm2] 1508 2710 1161 2156
Equations 13 &14 0.79 e 0.79e 1.07 1.18
Equation 6 1.04 0.99 1.13 1.20
Conventional a 0.93 0.92 1.19 1.26
Continuous a 1.18 1.16 1.26 1.34
Continuous/Eq 13f 1.49 1.47 1.18 1.14
Continuous + axiala 1.68 1.38 1.39 1.31
Note: a Rotation calculated with NLFEA, b 50:50 split of Σ1.5𝑑𝐴𝑠𝑤 between 1st and 2nd
perimeters, c 40:60 split of Σ1.5𝑑𝐴𝑠𝑤 between 1st and 2nd perimeters, d Asw BS8110min, e flexural
failure, f upper bound of enhancement in strength of isolated test specimen due to rotational
restraint.

28
List of Figures
Figure 1: Conventional punching shear specimen
Figure 2: Influence of shear reinforcement ratio on Vtest/VRcs calc for BS8110, EC2 and
MC2010 Level 2 with a) c = s = 1.0 [5% = -1.64sd] and b) with code recommended partial
factors m, c and s.
Figure 3: Comparison of measured and calculated load versus rotation response for slabs
PL1, PV1, PL5, PL4, PG10 and PG11
Figure 4: Analysis of Chana and Desai (1992a) slabs FPS1 (no stirrups) and FPS5 (with
stirrups) a) comparison of measured and predicted deflections and b) calculation of resistance
with MC2010.
Figure 5: Influence of design imposed load on VEd/VRmax for design support moments of
0.063FL and 0.083FL
Figure 6: Comparison of a) areas of shear reinforcement required within 1.5d of column and
b) required minimum distance to outer shear reinforcement for design support moments of
0.063FL and 0.083FL
Figure 7: Influence of surplus flexural reinforcement of a 265 mm thick slab with 450 mm
square column on a) maximum possible shear resistance and b) area of shear reinforcement
for F = 1039 kN.
Figure 8: Boundary conditions for MC2010 Level 4 analysis of interior panels of flat slab.
Figure 9: Variation in rotation along slab centreline for M= 0.063FL and qk = 2.5 kN/m2.
Figure 10: Influence of slab continuity on shear resistance for a) Msup = 0.063FL and qk = 2.5
kN/m2, b) Msup = 0.063FL and qk = 7.5 kN/m2, c) Msup = 0.083FL and qk = 2.5 kN/m2 and d)
Msup = 0.083FL and qk = 7.5 kN/m2.

29
Figure 11: Calculation of MC2010 shear resistance of Guralnick and Fraugh slab (1963) a)
calibration of equation (15) (columns 750 square unless noted otherwise) and (b) calculation
of MC2010 shear resistance.
Figure 1: Conventional punching shear specimen

30
a)
b)
Figure 2: Influence of shear reinforcement ratio on Vtest/VRcs calc for BS8110, EC2 and
MC2010 Level 2 with a) c = s = 1.0 [5% = -1.64sd] and b) with code recommended partial
factors m, c and s.
0
0.2
0.4
0.6
0.8
1
1.2
1.4
1.6
1.8
2
0 0.1 0.2 0.3 0.4 0.5 0.6
Vte
st/V
Rcs
SAswfy/(udfc0.5)
EC2
BS8110
MC2010
BS8110 Mean 0.85: 5% 0.73EC2 Mean 0.98: 5% 0.70MC2010 Level 2: Mean 1.25 5% 1.07
0
0.5
1
1.5
2
2.5
0 0.1 0.2 0.3 0.4 0.5 0.6
Vte
st/V
Rcs
Aswfy/(udfc0.5)
EC2
BS8110
MC2010
BS8110 Mean 1.04: 5% 0.89 EC2 Mean 1.27: 5% 0.87 MC2010 Level 2: Mean 1.56
5% 1.23

31
Figure 3: Comparison of measured and calculated load versus rotation response for slabs
PL1, PV1, PL5, PL4, PG10 and PG11
0
0.1
0.2
0.3
0.4
0.5
0.6
0 0.002 0.004 0.006
ψ
PL1
Experimental
Failure Load
FEA -- Ec
FEA -- 0.5Ec0
0.1
0.2
0.3
0.4
0.5
0.6
0 0.002 0.004 0.006 0.008
ψ
PV1
Experimental
Failure Load
FEA -- Ec
FEA -- 0.5Ec
0
0.1
0.2
0.3
0.4
0.5
0.6
0 0.002 0.004 0.006
ψ
PL4
Experimental
Failure Load
FEA -- Ec
FEA -- 0.5Ec0
0.1
0.2
0.3
0.4
0.5
0.6
0 0.002 0.004 0.006
ψ
PL5
Experimental
Failure Load
FEA -- Ec
FEA -- 0.5Ec
0
0.1
0.2
0.3
0.4
0.5
0.6
0 0.02 0.04
ψ
PG10
Experimental
Failure Load
FEA -- Ec
FEA -- 0.5Ec0
0.1
0.2
0.3
0.4
0.5
0.6
0 0.005 0.01 0.015
ψ
PG11
Experimental
Failure Load
FEA -- Ec
FEA -- 0.5Ec
V/(
ud
f c0.5
) M
Pa
0.5
V/(
ud
f c0.5
) M
Pa
0.5
V
/(u
df c
0.5
) M
Pa
0.5

32
a)
b)
0
200
400
600
800
1000
1200
1400
1600
1800
2000
0 2 4 6 8 10 12 14 16 18 20
Lo
ad
[k
N]
Deflection [mm]
Experimental
Continuous
Conventional
Resistance FPS1
Resistance FPS5
0
0.1
0.2
0.3
0.4
0.5
0.6
0.7
0.8
0.9
0 0.01 0.02 0.03
V/(
ud
f ck0
.5)
ψ [Radians]
Vtest FPS1
Vtest FPS5
3 m square
9 m square (r =1200mm)
9 m square (r =700mm) -max rotation
Eq 13

33
Figure 4: Analysis of Chana and Desai (1992a) slabs FPS1 (no stirrups) and FPS5 (with
stirrups) a) comparison of measured and predicted deflections and b) calculation of resistance
with MC2010.
Figure 5: Influence of design imposed load on VEd/VRmax for design support moments of
0.063FL and 0.083FL
0
0.2
0.4
0.6
0.8
1
1.2
1.4
1.6
1.8
0 2 4 6 8 10 12
VEd
/VR
max
Design imposed load kN/m2
EC2 M=0.063FL EC2 M=0.083FL
BS8110 M=0.063FL BS8110 M=0.083FL
MC2010 M=0.063FL MC2010 M=0.083FL

34
a)
b)
0
1000
2000
3000
4000
5000
6000
0 2 4 6 8 10 12
SA
swin
1.5
d z
on
e ar
ou
nd
co
lum
n [
mm
2]
Design imposed load [kN/m2]
EC2 M=0.063FL
EC2 M=0.083FL
BS8110 M=0.63FL
BS8110 M=0.083FL
MC2010 M=0.063FL
MC2010 M=0.083FL
0
1
2
3
4
5
6
7
8
0 5 10 15
Dis
tan
nce
to
ou
ter
rin
g o
f sh
ear
rein
forc
em
en
t/d
Design imposed load [kN/m2]
EC2 M=0.063FL
EC2 M=0.083FL
BS8110 M=0.063FL
BS8110 M=0.083FL
MC2010 M=0.063FL
MC2010 M=0.083FL

35
Figure 6: Comparison of a) areas of shear reinforcement required within 1.5d of column and
b) required minimum distance to outer shear reinforcement for design support moments of
0.063FL and 0.083FL

36
a)
b)
0
0.5
1
1.5
2
2.5
3
1 1.25 1.5 1.75 2
VR
max
/VcE
C2
Asp
rov
= A
sre
q
Asprov/Asreq
BS8110 0.063FL
BS8110 0.083FL
EC2 0.063FL
EC2 0.083FL
MC2010 0.063FL
MC2010 0.083FL
0
500
1000
1500
2000
2500
3000
3500
1 1.2 1.4 1.6 1.8 2
SA
swin
1.5
d z
on
e ar
ou
nd
co
lum
n [
mm
2]
Asprov/Asreq
BS8110 0.063FL
BS8110 0.083FL
EC2 0.063FL
EC2 0.083FL
MC2010 0.063FL
MC2010 0.083FL

37
Figure 7: Influence of surplus flexural reinforcement for 265 mm thick slab with 450 mm
square column on a) maximum possible shear resistance and b) area of shear reinforcement
for F = 1039 kN.
Figure 8: Boundary conditions for MC2010 Level 4 analysis of interior panels of flat slab
Figure 9: Variation in rotation along slab centreline
Rotational
Fixity
0.22L
0.5L
Rotational
and
Axial
Fixity
Conventional
0.22L
0.5L
A A'
AA'
1/4 Slab
Symmetry
Sym
met
ry
Column
a)
b)
c)8
0
0.2
0.4
0.6
0.8
1
1.2
0 0.1 0.2 0.3 0.4 0.5
No
rmal
ised
ro
tati
on
r / L
Column face
c+d
0.2L
Conventional
Continuous
Continuous + axialrestraint

38
a)
BS8110 resistance
EC2 resistance
MC2010 resistance
0
0.1
0.2
0.3
0.4
0.5
0.6
0 0.01 0.02 0.03 0.04 0.05 0.06
V/(
ud
f ck0.
5)
Rotation ψ [Radians]
Design load
PYL test specimen
Conventional
Continuous
Continuous + axial
Eq 6
Eq 13
Muttoni quadrilinear
VRmax

39
b)
BS8110 resistance
EC2 resistance
MC2010 resistance
0
0.1
0.2
0.3
0.4
0.5
0.6
0 0.01 0.02 0.03 0.04 0.05 0.06
V/(
ud
f ck0.
5)
Rotation ψ [Radians]
Design load
PYL test specimen
Conventional
Continuous
Continuous + axial
Eq 6
Eq 13
Muttoni quadrilinear
VRmax

40
c)
BS8110 resistance
EC2 resistance
MC2010 resistance
0
0.1
0.2
0.3
0.4
0.5
0.6
0 0.01 0.02 0.03 0.04 0.05 0.06
V/(
ud
f ck0.
5)
Rotation ψ [Radians]
Design load
PYL test specimen
Conventional
Continuous
Continuous + axial
Eq 6
Eq 13
Muttoni quadrilinear

41
d)
Figure 10: Influence of slab continuity on shear resistance for a) Msup = 0.063FL and qk = 2.5
kN/m2, b) Msup = 0.063FL and qk = 7.5 kN/m2, c) Msup = 0.083FL and qk = 2.5 kN/m2 and d)
Msup = 0.083FL and qk = 7.5 kN/m2.
BS8110 resistance
EC2 resistance
MC2010 resistance
0
0.1
0.2
0.3
0.4
0.5
0.6
0 0.01 0.02 0.03 0.04
V/(
ud
f ck0.
5)
Rotation ψ [Radians]
Design load
PYL test specimen
Conventional
Continuous
Continuous + axial
Eq 6
Eq 13
Muttoni quadrilinear

42
a)
b)
Figure 11: Calculation of MC2010 shear resistance of Guralnick and Fraugh slab (1963) a)
calibration of equation (15) (columns 750 square unless noted otherwise) and (b) calculation
of MC2010 shear resistance.
0
500
1000
1500
2000
2500
3000
0 0.01 0.02 0.03 0.04 0.05 0.06 0.07 0.08
Load
[kN
]
ψ [Radians]
NLFEA M=0.063FL q=2.5 450 col
Equation (15) M = 0.063FL 450colNLFEA M=0.063FL & q=2.5
Equation (15) M=0.063FL &q=2.5
393
0
100
200
300
400
500
600
700
0 10 20 30 40 50 60
Load
[k
N]
Rotation [miliradians]
Resistance
Equation (6)
Equation (13)
Equation (15)