comparison of post-marketing surveillance …
TRANSCRIPT

University of New MexicoUNM Digital Repository
Pharmaceutical Sciences ETDs Electronic Theses and Dissertations
Summer 7-1-2017
COMPARISON OF POST-MARKETINGSURVEILLANCE APPROACHESREGARDING INFECTIONS RELATED TOTUMOR NECROSIS FACTOR (TNF)INHIBITORSCheng ChenUniversity of New Mexico
Follow this and additional works at: https://digitalrepository.unm.edu/phrm_etds
Part of the Pharmacy and Pharmaceutical Sciences Commons
This Thesis is brought to you for free and open access by the Electronic Theses and Dissertations at UNM Digital Repository. It has been accepted forinclusion in Pharmaceutical Sciences ETDs by an authorized administrator of UNM Digital Repository. For more information, please [email protected].
Recommended CitationChen, Cheng. "COMPARISON OF POST-MARKETING SURVEILLANCE APPROACHES REGARDING INFECTIONSRELATED TO TUMOR NECROSIS FACTOR (TNF) INHIBITORS." (2017). https://digitalrepository.unm.edu/phrm_etds/17

i
Cheng Chen Candidate
Pharmaceutical Sciences
Department
This thesis is approved, and it is acceptable in quality and form for publication:
Approved by the Thesis Committee:
Dennis W. Raisch, PhD, MS, RPh, Chairperson
Matthew E. Borrego, PhD, MS, RPh
Melissa H. Roberts, PhD, MS

ii
COMPARISON OF POST-MARKETING SURVEILLANCE
APPROACHES REGARDING INFECTIONS RELATED TO
TUMOR NECROSIS FACTOR (TNF) INHIBITORS
by
CHENG CHEN
B.A., 2014
CHINA PHARMACEUTICAL UNIVERSITY
THESIS
Submitted in Partial Fulfillment of the
Requirements for the Degree of
Master of Science
Pharmaceutical Sciences
The University of New Mexico
Albuquerque, New Mexico
July, 2017
iii
DEDICATION
This effort and all of my academic achievements are dedicated to my beloved
parents, Xuequn Chen and Liping Wu, whose unconditional love and support
always motivate me to set higher goals and keep moving forward.

iv
ACKNOWLEDGEMENT
The completion of this thesis project could not have been possible without
the guidance and the help of several individuals, to whom I would like to take this
opportunity to express my sincere gratitude.
I am tremendously fortunate to have my committee members Dr. Dennis
Raisch, Dr. Matthew Borrego and Dr. Melissa Roberts. My deepest appreciation
goes to my committee chair and my primary advisor, Dr. Dennis Raisch, for his
invaluable guidance and unwavering support throughout the course of this
project and my graduate education. He has been and will always remain my role
model.
I would also like to express my deepest thanks to my committee members,
Dr. Matthew Borrego and Dr. Melissa Roberts for their constant guidance and
encouragement on my thesis and at various stages of graduate school. I was
fortunate enough to work with these highly experienced researchers, and would
like to thank them for their insightful comments and keen interest in this project.
Last but not the least, I would like to thank my colleagues and friends –
Shikhar Shrestha, Akshay Kharat, John Rafi, Adriana Bautista and Rasha
Arabyat – for their constant encouragement and support. You guys are one of the
best things that ever happened to me! I owe all my achievements to you all!

v
COMPARISON OF POST-MARKETING SURVEILLANCE
APPROACHES REGARDING INFECTIONS RELATED TO
TUMOR NECROSIS FACTOR (TNF) INHIBITORS
by
Cheng Chen
B.A., China Pharmaceutical University, 2014
ABSTRACT
Objective: Both spontaneous (voluntary) reporting systems and observational
approaches serve as important tools in post-marketing surveillance for adverse
drug events, however, each has its own advantages. The primary purpose of this
project was to compare and contrast the FDA Adverse Event Reporting System
(FAERS) data and findings from observational studies in post-marketing
surveillance through examining TNF inhibitors (etanercept, adalimumab,
infliximab, certolizumab and golimumab) related infections, and secondarily, to
examine the applicability of additional analyses in FAERS, such as multiple
logistic regressions and time to onset of event analysis.
Methods: Using MedDRA® preferred terms (PTs), infection and infestation cases
in FAERS with each TNF inhibitor as the primary suspect drug were extracted

vi
through EvidexTM. PubMed was searched for post-marketing observational
studies that reported data on infections related to any of the studied TNF
inhibitors. Completed observational studies with results reported on
ClinicalTrials.gov (OS-CTs) were also extracted. Exclusion criteria for
observational studies were: 1) did not assess safety, 2) contained duplicate data
from another observational study and 3) reported only pre-specified adverse
events. For each infection PT, the percentage of the total number of infections
from each source was determined. We contrasted FAERS and observational
studies in post-marketing surveillance for TNF inhibitor related infections on
duplicates and timeliness, and examined the level of incompleteness and
inaccuracy in FAERS data. We then compared the number and level of
specificity of identified infections between 3 data sources. We also assessed the
consistency in most commonly reported infections through generated rankings
from each data source for each TNF inhibitor. Multiple logistic regressions were
performed to determine significant predictors of having a more severe event
outcome. Kaplan-Meier curves were generated to examine the difference in time
to onset of event among different TNF inhibitors.
Results: In FAERS, 163,789 cases were found for all 5 TNF inhibitors with
etanercept having the greatest number of cases (n=68,807, 42.0%) and
adalimumab having the greatest number of reported PTs (n=824). A total of 53
observational studies from our PubMed search and 52 observational studies from
ClinicalTrials.gov were included in our final data synthesis. FAERS rendered the

vii
greatest number and level of specificity of reported TNF inhibitor related
infections, followed by ClinicalTrials.gov.
For adalimumab, 4 of 10 infection terms matched between all three data
sources (sinusitis, pneumonia, upper respiratory tract infection, and herpes
zoster), among which none was reported at rates within 1% of each other. Seven
of the top 10 infection terms matched between evidence from FAERS and
ClinicalTrials.gov. For etanercept, 4 of 10 infection terms matched between all
three data sources (nasopharyngitis, pneumonia, upper respiratory tract
infection, and herpes zoster), among which herpes zoster was reported at rates
within 1% of each other. Seven of the top 10 infection terms matched between
evidence from FAERS and ClinicalTrials.gov. For infliximab, 2 of 10 infection
terms matched between all three data sources (pneumonia and urinary tract
infection), among which none was reported at rates within 1% of each other. Six
of the top 10 infection terms matched between evidence from FAERS and
ClinicalTrials.gov. For, certolizumab pegol, 1 of the top 5 infection terms matched
all three data sources (urinary tract infection). Three of the top 5 infection terms
matched between evidence from FAERS and ClinicalTrials.gov. For golimumab,
two of the top 5 infection terms matched between evidence from FAERS and
ClinicalTrials.gov
Our results from multiple logistic regressions showed that certolizumab
pegol, golimumab, younger ager, being female and less weight were associated
with less severe event outcomes (p-values <0.01). A statistically significant
difference in the survival rates was observed between different TNF inhibitors
viii
(p<0.001) in our time to onset of event analysis. Etanercept and infliximab had
better survival rates among all TNF inhibitors.
Conclusion: Our analyses demonstrated the beneficial attribute of FAERS to
provide specific infection terms regarding the amount and specific level of terms.
Our analyses also showed the usefulness of ClinicalTrials.gov, as one of the data
source of observational studies, of offering more detailed information on adverse
events compared to studies identified in the literature. Results indicate that
passive (FAERS) and active (observational studies) pharmacovigilance provide
similar results for common infections associated with TNF inhibitors. This finding
supports the usefulness of FAERS in post-marketing drug safety assessment.

ix
TABLE OF CONTENTS
CHAPTER ONE: INTRODUCTION .................................................................................. 1
Background and Problem Statement ..................................................................................1
The FDA's Adverse Event Reporting System (FAERS) .............................................................. 4
Tumor Necrosis Factor (TNF) Inhibitors .................................................................................. 7
Inflammatory Arthritis and Inflammatory Bowel Diseases ..................................................... 7
TNF Inhibitors and Infections .................................................................................................. 8
Significance........................................................................................................................9
Purpose ........................................................................................................................... 12
Specific Aims .................................................................................................................... 13
Specific Aim 1: To describe and contrast features of FAERS and observational studies in
post-marketing surveillance for TNF inhibitor related infections ......................................... 13
Specific Aim 2: To examine and compare the number of TNF inhibitor related infections
identified and the level of specificity of identified TNF inhibitor related infections using
FAERS and an observational approach.................................................................................. 13
Specific Aim 3: To examine the consistency between FAERS and an observational approach
in the type and reporting rates of common infections associated with TNF inhibitors ....... 14
Specific Aim 4: To examine the applicability of additional analyses (i.e. multiple logistic
regressions and time to onset of adverse events analyses) using FAERS data on TNF
inhibitor related infections.................................................................................................... 14
CHAPTER TWO: REVIEW OF LITERATURE ................................................................... 16
Overview of TNF Inhibitors ............................................................................................... 16
x
Effectiveness of TNF Inhibitors .............................................................................................. 19
Common Adverse Events Related to TNF Inhibitors ............................................................. 21
Issues with Spontaneous Adverse Event Reporting Systems .............................................. 22
Underreporting ..................................................................................................................... 23
Stimulated Reporting ............................................................................................................ 24
The Weber Effect .................................................................................................................. 25
Duplication of Reports .......................................................................................................... 27
Inability to Provide Incidence Rates ...................................................................................... 28
Incompleteness and Inaccuracy ............................................................................................ 28
Signal Detection Algorithms .................................................................................................. 29
Review of Studies Comparing FAERS Data and Findings from Observational Studies .......... 31
Additional Analyses for FAERS Data .................................................................................. 38
Summary ......................................................................................................................... 39
CHAPTER THREE: METHODS ...................................................................................... 41
Overall Research Design ................................................................................................... 41
Data Source ..................................................................................................................... 41
FAERS ..................................................................................................................................... 41
Post-marketing Observational Studies .................................................................................. 42
Analyses .......................................................................................................................... 44
Human Research Review Committee (HRRC) Approval ...................................................... 53
CHAPTER FOUR: RESULTS ......................................................................................... 54
Description of Retrieved Data .......................................................................................... 54
FAERS Cases ........................................................................................................................... 54
Data Extracted from Systematic Literature Review .............................................................. 55

xi
Data Extracted from ClinicalTrials.gov .................................................................................. 56
Issues of FAERS and Observational Studies Data ............................................................... 62
Duplication of Cases .............................................................................................................. 62
Timeliness .............................................................................................................................. 63
Incompleteness and Inaccuracy ............................................................................................ 63
Comparison of the Number and Specificity of Infection Terms ........................................... 64
Consistency in the Types and Reporting Rates of the Most Common Infections ................. 70
Etanercept (Table 12) ............................................................................................................ 70
Adalimumab (Table 13) ......................................................................................................... 74
Infliximab (Table 14) .............................................................................................................. 77
Certolizumab Pegol (Table 15) .............................................................................................. 80
Golimumab (Table 16) ........................................................................................................... 83
Multiple Logistic Regressions and Time to Onset of Event Analysis .................................... 85
Results of Multiple Logistic Regressions ............................................................................... 94
Time to Onset of Event Analysis .......................................................................................... 104
CHAPTER FIVE: DISCUSSION .................................................................................... 108
Features of FAERS and Observational Data ..................................................................... 108
Issues of FAERS and Observational Studies Data ................................................................ 109
Number and Specific Level of Infection Terms Identified ................................................... 110
Effects of Difference in Approval Dates and Market Share on Our Summary Results ....... 113
Consistency in the Most Commonly Reported Infections ................................................. 115
Application of Additional Analyses ................................................................................. 116
Limitations of our study ................................................................................................. 119
Strengths of Our Study ................................................................................................... 122

xii
Conclusion ..................................................................................................................... 124
References ............................................................................................................. 126

xiii
List of Tables
Table 1 Labeled Indications for Each TNF Inhibitor ............................................ 18
Table 2 2x2 Contingency Table for PRR and ROR Calculations ........................ 30
Table 3 Independent Variables for Multiple Logistic Regression Models ............ 51
Table 4 Dependent Variables for Multiple Logistic Regression Models .............. 52
Table 5 Data Retrieval Dates and Number of Primary Suspect Cases in FAERS
by Each TNF Inhibitor ......................................................................................... 57
Table 6 Distribution of Primary Suspect Cases by Each TNF Inhibitor
Before/After 4/22/2008 ....................................................................................... 58
Table 7 Distribution of Included Studies from PubMed by TNF Inhibitor and
Indication ............................................................................................................ 60
Table 8 Distribution of Included Studies from ClinicalTrials.gov by TNF Inhibitor
and Indication ..................................................................................................... 61
Table 9 Distribution of Primary Suspect Cases in FAERS by TNF Inhibitor after
Eliminating “Infection” Cases .............................................................................. 67
Table 10 Number of Identified Infection Terms by TNF Inhibitor and Data Source
........................................................................................................................... 68
Table 11 Comparison of the Number of Infection Cases and Infection Terms
Reported in the Literature and ClinicalTrials.gov for the Same Study ................ 69
Table 12 Top 10 Reported Infections Related to Etanercept from Each Data
Source ................................................................................................................ 73
Table 13 Top 10 Reported Infections Related to Adalimumab from Each Data
Source ................................................................................................................ 76

xiv
Table 14 Top 10 Reported Infections Related to Infliximab from Each Data
Source ................................................................................................................ 79
Table 15 Most Frequently Reported Infections Related to Certolizumab Pegol
from Each Data Source ...................................................................................... 82
Table 16 Most Frequently Reported Infections Related to Golimumab from Each
Data Source........................................................................................................ 84
Table 17 Demographic Characteristics and Time to Onset of Event of the Study
Sample in FAERS ............................................................................................... 87
Table 18 Distribution of Primary Suspect Cases in FAERS by FDA-Approved
Indication and TNF Inhibitor ............................................................................... 89
Table 19 Distribution of Primary Suspect Cases in FAERS by Case Outcome and
TNF Inhibitor ....................................................................................................... 92
Table 20 Distribution of Primary Suspect Cases in FAERS by Case Outcome and
TNF Inhibitor (After Excluding Cases with Missing Values in Covariates for
Multiple Logistic Regression) .............................................................................. 93
Table 21 Results of Multiple Logistic Regression 1 (n=9,187, Outcome=Death) 95
Table 22 Results of Multiple Logistic Regression 2 (n=8,506, Outcome=Life-
Threatening) ....................................................................................................... 98
Table 23 Results of Multiple Logistic Regression 3 (n=9,187, Outcome=Death or
Life-Threatening) .............................................................................................. 101
Table 24 Results of Multiple Logistic Regression 4 (n=8,058,
Outcome=Hospitalization) ................................................................................ 103
Table 25 Results of Log Rank Test .................................................................. 106

xv
Table 26 Summary of Results for Each Specific Aim ....................................... 107

xvi
List of Figures
Figure 1 Example of MedDRA Terminology ......................................................... 6
Figure 2 Flow Diagram of Literature Review of Comparison on FAERS Data and
Observational Studies ........................................................................................ 33
Figure 3 PRISMA Flowchart of Included Studies from PubMed ......................... 59
Figure 4 Kaplan-Meier Estimates of Time to Onset of Infections Related to Each
TNF Inhibitor ..................................................................................................... 105
1
CHAPTER ONE: INTRODUCTION
Background and Problem Statement
Post-marketing surveillance refers to the practice of collecting information
and monitoring the safety of a product after it has been marketed.1,2 It is an
essential part of pharmacovigilance, which is the science of detecting, assessing,
understanding and preventing adverse drug events.3 . An adverse event (AE) is
defined as “any untoward medical occurrence associated with the use of a drug
in humans, whether or not considered drug related.”4 A serious adverse event is
defined based on the patient outcome. Any adverse event is by regulatory
definitions described as serious if the patient outcome results in “(1) death (2)
life-threatening (3) hospitalization (initial or prolonged) (4) disability or permanent
damage (5) congenital anomaly/birth defect and (6) required intervention to
prevent permanent impairment or damage.”5
AEs pose a significant burden on society. Approximately 5% of hospital
admissions are caused by adverse events.6 The incidence of AE-related death
ranges from 0.009% to 6.3%, depending on the data source, drug, and other
factors.7–9 A systematic review by Taché et al. reported a median prevalence of
AEs of 12.8% for ambulatory care-based studies and a median prevalence of
AEs of 5.1% for hospital-based studies.10 The cost of all AE-related morbidity and
mortality as well as the management of AEs in the United States (U.S.) is
estimated to be up to 30 billion dollars annually.11
2
In order to fully assess the safety of drugs, FDA regulations require both
pre-marketing studies and post-marketing surveillance. Pre-marketing studies
consist of preclinical testing (in vivo and in vitro studies) and clinical testing
(Phase 1-2 trials if a drug receives accelerated approval (although some
accelerated approval drugs undergo Phase 3 testing as well), and Phase 1-3 if a
drug receives regular approval by FDA). Although phase 3 trials require a larger
group of participants (1,000-3,000), it is still difficult to identify rare but important
adverse events due to more homogeneous population, shorter duration of study
follow up period and inability to include data on concomitant medications.12 Pre-
marketing studies may not reflect the real-world situation where a drug may be
widely used among patients with varied characteristics for long periods. Post-
marketing surveillance, as a continued step to monitor drug safety, takes up an
important part of pharmacovigilance.2 Common types of post-marketing
surveillance include spontaneous (voluntary) reporting systems and
epidemiological approaches.13,14
Spontaneous reporting systems are designed and employed to collect and
analyze suspected adverse events observed after drugs have been approved for
the market. Healthcare professionals, consumers, the general public and
manufacturers usually submit spontaneous reports. Although the word
“spontaneous” is used for such systems, manufacturers are mandated to notify
the monitoring agencies (such as the U.S. FDA) of any adverse events that the
companies have been aware of.13 For healthcare professionals and consumers,
the reporting is spontaneous as it is completely voluntary to contact the

3
manufacturer and/or relevant agencies about their experience of adverse
events.12–15
Analyses of spontaneous reports data often involve detecting potential
safety signals for suspected drugs and adverse events. A signal indicates how
frequently an adverse event is reported in association with the suspect drug
compared to other drugs. Common methods used for signal detection include
Bayesian statistical methods (e.g. empirical Bayes geometric mean (EBGM)) and
frequentist-based methods (e.g. the proportional reporting ratio (PRR)). The
signal detection allows one to determine if any disproportionality exists in the
reporting of a particular adverse event and a given drug when comparing with
other drugs and adverse events.16,17
Epidemiological (observational) approaches (here defined as studies
using epidemiological study designs, such as case-control studies, cohort studies
or electronic database researches, excluding case reports and case series) are
also important ways of conducting post-marketing surveillance as these can
provide information on prevalence and incidence of adverse events and examine
associations between adverse events and suspected treatments.
Rarely, randomized clinical trials are used in the post-marketing
surveillance phase, but only when additional evidence is needed for policy
decisions as existing evidence from previous randomized clinical trials is
insufficient or evidence from new observational studies are not enough for policy
decisions or if the purpose is to study a non-approved indication.18 Sometimes

4
such trials are also conducted to provide needed evidence that cannot be
obtained from prospective observational studies.18 For example, if an adverse
event can be pre-specified and have immediate impact on patients, a
randomized clinical trial would be more appropriate. However, such trials are not
common and tend to have homogeneous study population in a controlled study
environment and conditions, which are not aligned with our study purposes. Thus
randomized clinical trials were not included in our study.
The FDA's Adverse Event Reporting System (FAERS)
In the U.S., the FDA is responsible for monitoring post-marketing drug
safety. Post-marketing surveillance work conducted by the FDA is primarily done
through maintaining and monitoring reports to its adverse event reporting system.
In 1993, the FDA launched a Safety Information and Adverse Event Reporting
Program – MedWatch – as its primary tool of post-marketing surveillance.19 This
program aims to increase the reporting of adverse events and to provide a
convenient and confidential way to report and share information on adverse
events. All spontaneous reports submitted through MedWatch are entered in a
standardized way into a computerized information database – the FDA's Adverse
Event Reporting System (FAERS). Adverse events in FAERS are coded to terms
in the Medical Dictionary for Regulatory Activities terminology (MedDRA®), which
is an internationally accepted medical terminology for drug regulations and
consists of 5 levels of terms depending on specificity (an example is provided in
Figure 1; detailed explanations on MedDRA® terminology can be found through
the link:

5
http://www.who.int/medical_devices/innovation/MedDRAintroguide_version14_0_
March2011.pdf). A drug may be reported as a primary suspect drug, a secondary
suspect drug, an interacting drug or a concomitant drug, depending on the
degree of judgement of the person reporting the AE. FAERS has received over 9
million reports, and the number of reports has been largely increasing.20 The total
number of reports in 2014 was around 1.2 million, a 3.5-fold increase from
2006.21 Since the FAERS database contains information on individual cases, it
allows for further quantitative analyses such as logistic regression and time-to-
onset of event analysis.22–24
Among all reports in FAERS, etanercept (ENBREL®), a TNF-α inhibitor,
has the greatest number of primary suspect cases (n=243,937) as of August
2016. Other marketed TNF inhibitors are also associated with a large number of
adverse events cases as the primary suspect drug, such as adalimumab
(HUMIRA®, n=185,511) and infliximab (REMICADE®, n=72,641). These large
numbers indicate that adverse events related to TNF inhibitors have become
major safety concerns.

6
Figure 1 Example of MedDRA Terminology (Source: www.meddra.org/how-to-use/basics/hierarchy)
7
Tumor Necrosis Factor (TNF) Inhibitors
TNF inhibitors are an important class of biologics for the treatment of
inflammatory conditions, such as Crohn's disease, ankylosing spondylitis, and
rheumatoid arthritis. TNF inhibitors work by suppressing the physiologic
response to tumor necrosis factor produced by the immune system.25 Since the
first TNF inhibitor was approved in the 1990s, there are five TNF inhibitors
currently available on the market: etanercept, infliximab, adalimumab,
certolizumab pegol, and golimumab. TNF inhibitors have revolutionized the
treatment for immune-mediated inflammatory diseases, but TNF inhibitors are
still subject to features of biologics, such as complex substances and structures,
and their interference with the immune system, which may increase the risk for
opportunistic and viral infections, etc. Thus, TNF inhibitors require more
extensive scrutiny.
Inflammatory Arthritis and Inflammatory Bowel Diseases
Inflammatory arthritis (IA) and inflammatory bowel diseases (IBD) are
labeled indications for all of the FDA-approved TNF inhibitors. IA includes
diseases involving inflammation of the joints and often other tissues, such as
rheumatoid arthritis, ankylosing spondylitis and psoriatic arthritis and can result in
activity limitations due to clinical features such as joint swelling, pain, stiffness
and deformity. RA represents the most common type of IA.26 IBD is characterized
by chronic inflammation of all or part of the digestive tract, and is accompanied
8
by symptoms such as diarrhea, fever, abdominal pain and weight loss. Crohn’s
disease and ulcerative colitis are the two primary types of IBD. Although the
causes of IA and IBD remain unknown, the discovery of the role played by TNF
in inflammation has advanced our understanding and has led to the production of
TNF inhibitors, which have revolutionized the treatment of IA and IBD. Clinical
trials showed that TNF inhibitors were overall well tolerated by rheumatoid
arthritis patients and effectively reduce disease activity.27,28 A meta-analysis by
Lee et al. showed that TNF inhibitors combined with methotrexate were
significantly better than methotrexate monotherapy in the disease improvement
among patients with active rheumatoid arthritis.29 Another meta-analysis by
Gartlehner et al. compared the efficacy of biologics for rheumatoid arthritis
treatment and found that TNF inhibitors overall were more efficacious than
anakinra (a non-TNF biologic).27 Superior effect of TNF inhibitors to conventional
therapies in IBD was also demonstrated from a systematic review.30 The authors
concluded that TNF inhibitors were associated with effective remission
maintenance and reduced risk of disease relapse after withdrawal of TNF
inhibitors.
TNF Inhibitors and Infections
The association between TNF inhibitors and infections has been
extensively studied. Infections and serious infections (which can lead to
permanent damage or death if untreated) have been observed in patients with
rheumatoid arthritis, psoriatic arthritis, ankylosing spondylitis, Crohn’s disease
and ulcerative colitis, who were on TNF inhibitors.31–38 Common infections that

9
have been reported include tuberculosis and fungal infections.39–41 Serious
infections are displayed as boxed warning information in package inserts for all
five TNF inhibitors as: “Increased risk of serious infections leading to
hospitalization or death, including tuberculosis, bacterial sepsis, invasive fungal
infections (such as histoplasmosis), and infections due to other opportunistic
pathogens.”25 One explanation of the association between increased risks for
infections and TNF inhibitors could be the important role that TNF-α plays in the
host immune responses to pathogens.42 TNF inhibitors work by reducing the
TNF- α levels and potentially make patients more vulnerable to opportunistic
infections such as tuberculosis.43
The risk of opportunistic, viral, fungal, and mycobacterial infections may
vary due to multiple factors. Older age, disease severity and use of glucocorticoid
drugs are associated with higher risk of infections.44,45 Previous experience with
infections is also significantly associated with increased risk of infections,
especially tuberculosis, which is primarily linked to increased risk of progression
or reactivation of latent tuberculosis infection as TNF-α plays an essential role in
protection against human tuberculosis.46
Significance
According to a weekly report from the Centers for Disease Control and
Prevention (CDC) in 2013, around 52.5 million (23%) of U.S. adults have been
diagnosed with any type of arthritis, and 3% of the total population were affected
by IA.47–49 The prevalence of IBD is estimated to be 1 to 1.3 million in the US.50

10
Adalimumab, etanercept and infliximab are among top 10 selling drugs in the
U.S. in 2013 with annual sales ranging from $5.4 billion to $3.9 billion.51 A study
in 2008 estimated that the mean total direct medical expenditure for an
rheumatoid arthritis patient would be approximately $13,000 per year.52 Although
TNF inhibitors have revolutionized IA and IBD treatment, they pose a huge
financial burden on patients.
As mentioned previously, spontaneous reporting systems and
observational studies can serve as useful tools in post-marketing surveillance for
TNF inhibitors. Both approaches provide advantages of including a broad
spectrum of patients, longer study duration, and allowing assessment on more
factors than solely medications of interest, thus, they have a higher probability to
identify rare and serious adverse events. However, each approach has its
disadvantages.
FAERS data often raise a controversy over the underreporting of adverse
events and missing data due to the unique method of data collection. The extent
to which the data is underreported is hard to quantify.12 FAERS data cannot
provide information on prevalence or incidence rates because there is no
information about the overall population exposed to the medication and thus
denominators for the rates cannot be estimated. Case reporting does not require
clinical validation and highly depends on the reporter’s judgment.
Observational studies, as an active drug surveillance approach, have the
advantage of being able to provide both a numerator and a denominator, so one

11
can calculate event rates from the data and obtain higher quality data (less
incomplete information).53 However, observational studies may generate different
findings depending on study design, for instance, case-control versus cohort
studies. Methods used to adjust for confounders and bias also may determine
the results of observational studies.13 Unlike spontaneous reporting systems,
observational studies, in which researchers collect primary data, are often much
more expensive and may include much smaller population. Observational studies
also employ secondary data to conduct a retrospective examination, however, it
is usually hard to guarantee that all information is accurate and not subject to
issues like recall bias or measurement error. Besides, the number of sufficiently
large databases is limited and, for very rare events, the study sample needed
may be larger than what is available after data cleaning.12,13
Since both spontaneous reporting systems and observational studies have
their own advantages and disadvantages, each one could be potentially
complementary or provide insights that might be contradictory. However, the
quality and consistency of data that each approach provides and the ability to
identify rare adverse events of these post-marketing monitoring approaches have
not been sufficiently studied or compared. Without a comprehensive assessment
on each approach, researchers may not be able to develop an optimal procedure
for the most efficient and responsive AE surveillance.

12
Purpose
FAERS data are subject to issues inherent to spontaneous reporting
systems, such as underreporting, missing data, and inability to provide
prevalence and incidence, while observational studies have relatively smaller
population and may generate different findings that are influenced by study
design and confounders selected for evaluation. Although both approaches play
major roles in post-marketing surveillance, these two are very different
approaches. Questions often raised but not yet adequately addressed include: Is
evidence from both approaches comparable or consistent? What is needed to
consider when interpreting findings from both approaches? Can these two
approaches be complementary to each other? Therefore, we conducted this
study to answer these questions using TNF inhibitor related infections as the
reported AE.
The primary purpose of this project was to compare and contrast FAERS
data and findings from observational studies in post-marketing surveillance of
TNF inhibitor related infections, and secondarily, to examine the applicability of
additional analyses in FAERS, such as multiple logistic regression and time to
onset of event analysis. The study goal is to provide researchers with a better
understanding of different post-marketing surveillance approaches and to get the
most use out of FAERS. The study attempted to provide an understanding of
how FAERS data can be utilized and instructions on the interpretation of FAERS
data within its inherent limitations.

13
Specific Aims
Specific Aim 1: To describe and contrast features of FAERS and
observational studies in post-marketing surveillance for TNF inhibitor
related infections
Research Hypothesis 1: We would observe differences between FAERS data
and observational studies data regarding infections related to TNF inhibitors in
terms of duplication of cases, completeness and timeliness.
Rationale: As one of the most representative spontaneous reporting systems,
FAERS is also subject to weaknesses that are inherent to spontaneous reporting
systems, such as underreporting and incompleteness. As observational studies
usually take a longer time to follow patients to identify associations between a
drug and adverse events, FAERS may provide more timely evidence.
Specific Aim 2: To examine and compare the number of TNF inhibitor
related infections identified and the level of specificity of identified TNF
inhibitor related infections using FAERS and an observational approach
Research hypothesis 2: We would observe differences in the number of TNF
inhibitor related infections identified and the level of specificity of identified TNF
inhibitor related infections using FAERS and an observational approach.
Rationale: FAERS database uses MedDRA® hierarchical terminology for
infections, from the most general level – System Organ Classes (SOCs) to the
most detailed one – MedDRA® Preferred terms, while observational studies often

14
reported more general terms for infections. It is important to examine whether
through the use of FAERS, researchers can identify more unexpected infections
related to TNF inhibitors. More specific terms for infections are also important, as
they are more useful to clinical practice.
Specific Aim 3: To examine the consistency between FAERS and an
observational approach in the type and reporting rates of common
infections associated with TNF inhibitors
Research Hypothesis 3: We would observe a difference in the type of infections
most commonly reported in FAERS and observational studies. The reporting
rates of cases (patients) for the same TNF inhibitor-infection combination would
differ as well.
Rationale: FAERS and observational studies are inherently different approaches
and both provide their own evidence on association between TNF inhibitors and
infections. However, the differences in their evidence have not been examined or
described.
Specific Aim 4: To examine the applicability of additional analyses (i.e.
multiple logistic regressions and time to onset of adverse events analyses)
using FAERS data on TNF inhibitor related infections
Research Hypothesis 4: Additional analyses would be successfully applied to
render more evidence on the association between TNF inhibitors and infections
and information on predictors of death cases.

15
Rationale: Commonly used data mining algorithms in FAERS often solely focus
on disproportionality and ignore case-level evidence. Novel methods have been
developed to address such issues in data mining in spontaneous reporting
systems and to help draw an association with the underlying effect between
suspect drugs and adverse events.

16
CHAPTER TWO: REVIEW OF LITERATURE
In this chapter, we present the effectiveness and common adverse events
of TNF inhibitors, discuss general issues with spontaneous reporting systems
and provide results from our literature review regarding studies that compared
FAERS and other post-marketing surveillance approaches, and additional
analyses that could be applied to FAERS data.
Overview of TNF Inhibitors
TNF inhibitors are biologics that work through lowering the concentration
of TNF at targeted sites of inflammation. TNF inhibitors are widely used for the
treatment of rheumatoid arthritis, psoriasis, psoriatic arthritis, Crohn's disease
and ankylosing spondylitis.25 There are five TNF inhibitors approved for
marketing by the US FDA: etanercept, infliximab, adalimumab, certolizumab
pegol and golimumab. Infliximab, adalimumab and golimumab are anti-TNF α
monoclonal antibodies; etanercept is an Fc-fusion protein; and certolizumab
pegol currently the only PEGylated anti-TNFα biologic. Although TNF inhibitors
all work by binding TNF, patients may respond variably to different TNF
inhibitors.
Each TNF inhibitor can be used for several inflammatory diseases.
Indications for each TNF inhibitor are summarized in Table 1. TNF inhibitors can
be used as monotherapy or in combination with immunosuppressant drugs, such

17
as methotrexate or corticosteroids, depending on patient disease indication and
disease severity. For instance, for patients with established rheumatoid arthritis,
TNF inhibitors are often used as the second-line treatment, especially if the
patient has moderate to high disease activity.26 Patients are sometimes
recommended to switch to another TNF inhibitor if they failed to respond or
inadequately responded to the initial TNF inhibitor. For the treatment of Crohn’s
disease, adalimumab, infliximab, and certolizumab pegol, are used among
patients with moderate to severe disease activity who failed to respond to a
corticosteroid therapy or an immunosuppressive agent (such as azathioprine).
TNF inhibitors may also be used when corticosteroids are not desired or
contraindicated.54

18
Table 1 Labeled Indications for Each TNF Inhibitor*
Etanercept (ENBREL®)
Adalimumab (HUMIRA®)
Infliximab (REMICADE®)
Certolizumab Pegol (CIMZIA®)
Golimumab (SIMPONI®)
Approval Date
11/02/1998 12/31/2002 08/24/1998 04/22/2008 04/24/2009
Rheumatoid Arthritis
√ √ √ √ √
Juvenile Idiopathic Arthritis
√ √
Psoriatic Arthritis
√ √ √ √ √
Crohn’s Disease
√ √ √
Ulcerative Colitis
√ √ √
Plaque Psoriasis
√ √ √
Hidradenitis Suppurativa
√
Uveitis √
Ankylosing Spondylitis
√ √ √ √ √
*Information was extracted from FDA Drug databases
(http://www.accessdata.fda.gov/scripts/cder/daf/index.cfm); Approval date is the earliest FDA
approval date for any indication.
19
Effectiveness of TNF Inhibitors
TNF inhibitors are overall well tolerated and have showed superior
effectiveness compared to traditional treatment as discussed in the following
paragraphs.
Rheumatoid Arthritis: A long-term prospective observational study
compared the survival rate of rheumatoid arthritis patients treated with TNF
inhibitors and that of patients on traditional disease-modifying anti-rheumatic
drugs (DMARDs).55 The study used data from the British Society of
Rheumatology Biologics Register (BSRBR) and all patients included were
followed for up to 10 years. The study concluded that patients on etanercept had
a better survival than patients on conventional DMARDs with an adjusted hazard
ration of 0.72 (95%CI 0.54-0.96). A retrospective observational study examined
the effectiveness of etanercept in reducing disease activity and health-related
quality of life (HRQoL).56 The authors found that compared to traditional
DMARDs, etanercept is associated with a significant greater decrease in disease
activity and better HRQoL among patients with rheumatoid arthritis at 6 months
after initiating the treatment. Infliximab was also found to substantially help to
reduce disease activity with an average decrease of 8.4 in SJC28 (swollen joint
count in 28 joints) and 2.5 in DAS28 (Disease Activity Score in 28 joints) at 36
months.57
Crohn’s Disease: Superior treatment effects were seen among children
and adults with Crohn’s disease treated with TNF inhibitors. Walters and

20
colleagues compared the effectiveness of early treatment with a TNF inhibitor
(adalimumab or infliximab) versus an immunomodulator (standard therapy)
among children who were newly diagnosed with Crohn’s disease.58 They found
that early treatment with a TNF inhibitor was associated with higher rate of
remission compared to an immunomodulator at 1 year (relative risk: 1.41 95%CI
(1.14-1.75)). Echarri and colleagues examined clinical effectiveness of
adalimumab at 2 years of treatment among adult patients with Crohn’s disease.59
They concluded that adalimumab was able to provide sustained clinical
remission with a remission rate of 87.5% among included patients at the 2-year
endpoint. Lindsay et al. conducted a retrospective study using medical records to
assess health resource utilization pre- and post-infliximab treatment. The results
demonstrated that infliximab significantly reduced the number of hospitalizations
and surgical procedures.60
Other Disease Conditions: de Vlam et al. examined the effectiveness of
etanercept among patients with psoriatic arthritis.61 They followed patients for 66
months and found a significant decrease in the mean total Health Assessment
Questionnaire score from 27 at baseline to 7.7 at endpoint (lower score means
less difficulty in daily movement and activities). Escudero-Vilaplana and
colleagues investigated the effectiveness of adalimumab, etanercept and
infliximab among patients with ankylosing spondylitis and identified significant
improvement in disease activity as well.62

21
Common Adverse Events Related to TNF Inhibitors
There are numerous studies that have examined adverse events related
to TNF inhibitors. Major safety concerns that are related to TNF inhibitors include
infections and malignancies. Serious infections and malignancies are also listed
as boxed warnings for all TNF inhibitors. Bongartz and colleagues performed a
systematic review and meta-analysis on the risk for infections and malignancies
among patients with rheumatoid arthritis who were treated with TNF inhibitors.33
They extracted evidence from randomized, placebo-controlled trials of
adalimumab or infliximab. The pooled odds ratio for serious infections among
patients on TNF inhibitors was 2.0 (95%CI 1.3-3.1) compared with patients on
placebo. The pooled odds ratio for malignancies among TNF inhibitor-treated
patients was 3.3 (95%CI 1.2-9.1). Several observational studies reported
increased risk for infections among TNF inhibitor users with rheumatoid
arthritis.63,64 Increased risk for infections was also identified among patients with
other disease conditions. Ford and Peyrin-Biroulet conducted a meta-analysis
using data from randomized controlled trials to assess the risk of opportunistic
infections among patients with Crohn’s disease and ulcerative colitis who were
treated with TNF inhibitors.65 They obtained a relative risk of 2.05 (95% CI 1.10–
3.85) when compared TNF inhibitors and placebo. However, some studies did
not find significantly increased risk for infections or malignancy associated with
TNF inhibitors.36,66–68
22
Issues with Spontaneous Adverse Event Reporting Systems
During the past decades, spontaneous reporting systems have been
utilized as the major tool to monitor post-marketing drug safety and to provide
sources for drug safety alerts in many countries and areas. Systems such as
U.S. FAERS, U.S. Vaccine Adverse Event Reporting System (VAERS), the
World Health Organization (WHO) Programme for International Drug Monitoring,
and EudraVigilance have served as primary sources for information on new,
unusual or rare adverse drug events.
Spontaneous report data have two main advantages: they are relatively
inexpensive compared to other post-marketing surveillance approaches and
have the potential to capture ongoing and timely safety data of all
populations.13,69,70 Unlike prospective observational studies, which require a large
sample size, long follow-up period and researchers’ continuous involvement in
interviews and assessment, spontaneous reporting systems work in a less costly
manner.71 The maintenance cost of spontaneous reporting systems was found to
be the lowest among all the sources of data for pharmacovigilance, yet provide
the largest amount of information for drug safety monitoring.72 Although it is
mandated by U.S. law that phase IV post-marketing studies should include either
clinical trials that are similar to those conducted before approval or
epidemiological studies which use clinical or claims data, less than 50% of the
“expected” post-marketing studies were begun on time, or even started at all.70,73
Spontaneous reports data, received from healthcare professionals, patients or

23
manufacturers, are able to reflect the real word situation in a much timelier
endeavor.
Despite the advantages stated above, spontaneous reporting systems, as
passive surveillance systems, have been questioned for years for several issues,
including underreporting, stimulated reporting, the Weber effect (explained in a
following section), duplication of reports, inability to provide incidence rates and
incompleteness.
Underreporting
Underreporting is the top issue with spontaneous reporting systems.
Because the reporting of adverse events for physicians and patients is voluntary
by law in many countries (e.g. U.S. and U.K.), the underreporting issue is not
unexpected.70 A systematic review published in 2006 by Hazell and Shakir
examined to what extent underreporting existed in spontaneous reporting
systems and if reporting rates varied by types of adverse events.74 The review
found a median underreporting rate of 94% for all adverse events based on
numerical estimates from 37 included studies and a median underreporting rate
of 85% across specific serious adverse events from 19 studies.74 A study by
Aagaard et al. found that reporting rates also varied by countries. High-income
countries had higher AE reporting rates while low-income countries had lower
rates. However, the number still significantly varied across countries in each
group: for high-income countries, the range of annual reports is from 3 to 613 per

24
million inhabitants; for low-income countries, this range is between 0 and 21
reports per million inhabitants.75
Researchers have looked into reasons for underreporting and potential
strategies to improve reporting rates. In developing countries, lack of
knowledge/awareness of spontaneous reporting system seems to be the major
reason for underreporting.76–78 Having received relevant training and working in a
clinical setting are positively associated with adverse events reporting.79
Continuous training and incentives may be helpful in increasing the reporting
rate.79 Combined strategies that can improve professionals’ attitudes and
knowledge, as well as their relationship with patients and the medical
environment will also help with their participation in spontaneous reporting.80
Stimulated Reporting
Stimulated reporting is another major limitation of spontaneous reporting
systems. It refers to the concept that the number of adverse events reported
might increase due to elevated public disclosure or media attention. For example,
the reporting of a certain pair of drug and adverse event may increase after FDA
issued a safety alert. An article published in 2013 by Southworth et al.
questioned an unusually higher reports rate of bleeding for dabigatran than that
for warfarin in FAERS. They later compared the rates of bleeding incidents with
warfarin and dabigatran using claims data and evidence from clinical trials and
found contrary results. They argued that stimulated reporting could be one of the
explanations for this unusual reporting rate in FAERS since this drug was new to

25
the market and had more media disclosure.81 However, a study by Hoffman et
al., which examined 100 drugs using FAERS data, did not find evidence of FDA
alerts’ influence on stimulated reporting.82 More studies are needed to determine
whether or not and to what extent the length of time since approval and media
exposure increase reporting rates. Besides, other types of exposure may also
contribute to the increase in reporting, such as publications of peer reviewed
journal articles or media exposure.82 It is difficult to delineate the effect of a
specific factor.
The Weber Effect
The Weber effect was named after Dr. JCP Weber for his discovery of a
reporting trend of adverse events. In 1984, Dr. Weber published his study on
reported adverse events regarding nine oral non-steroidal anti-inflammatory
drugs (NSAIDs) marketed in the United Kingdom (UK). He found that the number
of reported adverse events increased during the first two years, reached the
highest point near the end of the second year, and then the number dropped.83
Weber stated, “This decline is due to a reduction in the reporting of clinically mild
or trivial reactions. The more serious ADR, such as hematemesis, perforation of
peptic ulcers, blood dycrasias, etc. are reported from year to year in a quite
constant manner”.83 Based on his study, the Weber effect is understood as a
certain reporting pattern of adverse events for a drug during the first several
years after the drug has been approved. Another important point that needs to be
considered when generalizing Weber’s finding is that Weber’s studied period was
during the implementation of the U.K.’s ‘Black Triangle’ reporting guidelines,

26
which encourage healthcare professionals to intensively monitor the black
triangle symbol assigned drug and to report suspected adverse events.84 Any
drug that contains a new active substance or has a new route of administration,
or medication that has a new combination of ingredients or a new delivery
system would be assigned with a black triangle symbol.85
Several publications have replicated the Weber effect or examined the
existence of such effect in other reporting systems. Hartnell et al. replicated
Weber’s original study using FAERS data.86 They examined whether the
reporting trend characterized by Weber existed. Five NSAIDs that studied in
Weber’s original study and marketed in the U.S. were included. For each drug,
the Weber effect was observed. Hartnell’s study indicates that the Weber effect
may affect both UK and US adverse events reports, even though there exist
some differences between the reporting systems in these two countries (e.g.
FAERS is a centralized reporting system while UK’s reporting system consists of
4 regional ones). However, Hartnell et al.’s study did not examine the Weber
effect on adverse event reports of other classes of drugs.
In 2014, Hoffman and his colleagues published the results of their study
using more current FAERS data (2006-2012) for 62 FDA-approved drugs.84 They
concluded that most of the reporting in FAERs did not demonstrate a Weber
effect and suggested that the Weber effect may not exist in modern-day FAERS
as now adverse event reports come from multiple sources and FDA has taken
additional action to improve the reporting of AEs. Hoffman et al.’s finding is

27
consistent with other two previous studies, and suggest that the Weber effect
should not be assumed during analysis of AE reports.87,88
Duplication of Reports
Duplicates are often found in spontaneous reports for two major reasons.
The first reason is that reports come from different sources (health professionals,
patients and manufacturers), and the same incident may be reported from a
different source as a separate case. The second reason is that sometimes
multiple reports may be submitted as follow-up updates to an initial case.
However, not all follow-ups are successfully identified and linked up to the
original report.89,90 Duplication of reports has a potential to cause misleading
interpretations of data and inaccurate conclusions, especially in disproportionality
analysis. False positive signals may occur and influence physicians’ and
pharmacists’ prescribing patterns, which could prevent patients from receiving
effective and safe treatment.
Hauben and colleagues published an article in 2007 on their experience of
encountering an “extreme duplication” in the FAERS database.91 They ran signal
detections for all adverse events for a randomly selected drug, and found a very
strong signal of disproportionate reporting for “aortic dissection” as 20 out of a
total of 66 cases were related to the drug of interest. However, they found that all
of the 20 cases had the same event date and co-suspect medications, and none
of which had age reported. Although the FAERS data they used were
downloaded through software vendors, this work demonstrated a good example

28
of how duplication could have huge influence on signal detection analysis and
such limitation should always be taken into account during data mining
analyses.91
Inability to Provide Incidence Rates
The issues stated above help to explain why spontaneous reports do not
provide valid estimates of incidence rates for patients who experienced a certain
adverse event. The denominator – the total number of patients who are taking
the drug of interest – is unknown.13,89 Without such quantitative measures, it is
difficult to directly compare the relative risk between drugs. Additionally, type and
severity of reactions also affect reporting rates. Acute adverse events are more
likely to be recognized and reported than adverse events showing latent effects
of drugs.13. Reporting rates may also vary by the length of time that a drug has
been approved. Newly approved drugs tend to attract more attention and usually
have higher reporting rates in the first three years.13 All of these factors limit the
comparability of risk data for different drugs.
Incompleteness and Inaccuracy
Although in spontaneous reports, information such as basic demographic
characteristics of patients (age, gender), suspect and concomitant drugs,
indications, and length of treatment are supposed to be listed, missing data may
still exist for these items. In 2011, Getz et al. examined the completeness and
accuracy of over 10 million adverse event reports in FAERS and found that
information regarding patient age, gender, and adverse event starting date and

29
outcome were generally complete (completion rate ranged between 75%-96%).92
Information on suspect drugs had much lower rates of completion. For example,
primary suspect therapy start and end dates had a completion rate of only 37%
and 23%, respectively. The dosage of suspect drugs was also missing for almost
70% of reports. Product name, manufacturer name, and product lot number are
also supposed to be filled out in spontaneous reports to FAERS, however, the
completion rate of the product lot numbers was only 9%. The study also found
that more than one-fourth of reports had inaccurate suspect drug names, and
about one-third of suspect drug start dates were inaccurate based on
examination of reasonableness. Low rates of completion and inaccuracy of
information pose concerns when utilizing spontaneous reports data, especially in
the post-marketing context where other potential important confounding variables
such as patients’ multiple health issues and behavioral risk factors are usually
not captured.92
Signal Detection Algorithms
Signal detection algorithms have been developed and utilized to identify
potential associations between suspected medications and adverse events with
large spontaneous report data. Commonly used algorithms include the
proportional reporting ratio (PRR), the reporting odds ratio (ROR), and the
empirical Bayes geometric mean (EBGM).16 The PRR and ROR are based on
frequentist methods, while EBGM is a Bayesian method. The numerators and
denominators for calculating the PRR and the ROR can be explained by a 2x2
contingency table.

30
Table 2 2x2 Contingency Table for PRR and ROR Calculations
With an adverse event of interest
Without an adverse event of interest
Total
With a drug of interest
n11 n10 n11+n10
Without a drug of interest
n01 n00 n01+n00
Total n11+n01 n10+n00 n11+n10+n01+n00
n11: the number of co-occurrences of interest. n11+n10: the total number of co-occurrences with
a drug of interest. n11+n01: the total number of co-occurrences with an adverse event of interest.
n11+n10+n01+n00: the total number of co-occurrences in the database.93
The PRR and ROR are computed as:93,94
PRR = [n11 x (n01 + n00)] / [n01 x (n11 + n10)]
ROR = (n11 x n00) / (n10 x n01)
The expected number of co-occurrences of interest, n11(expected), is defined
as:93
n11(expected) = [(n11 + n10) x (n11 + n01)] / (n11 + n10 + n01 + n00)
The EBGM is computed as the observed-to-expected ratio:93
EBGM= n11/n11(expected)
There are certain scoring thresholds to determine a significant signal when
using each algorithm. A significant signal suggests a drug with potential
increased risk for an adverse event. For analysis using the PRR, a signal is
observed for a drug-adverse event pair if: (1) the number of cases is 3 or more,
(2) the PRR is greater than 2, (3) the chi-square value for the statistical
association is greater than 4.0.93,94 When using ROR, if the lower bound of the

31
95% confidence interval (CI, two-sided) is greater than 1.0, a signal was
considered.93. For the EBGM, a signal is detected if the value for EBGM is equal
to or greater than 2.0 and the lower bound of the two-sided 95% CI is also
≥2.0.93,95
These different methods for signal detection are reported to be broadly
comparable and widely accepted.96,97 Empirical Bayesian methods may be a
better choice if there is variability introduced by small number of reports, while
the PRR has the advantages of being straightforward to calculate and
interpret.16,94
Review of Studies Comparing FAERS Data and Findings from
Observational Studies
A literature review was performed in PubMed to identify studies that
compared spontaneous reported data from FAERS with evidence from
observational studies. The purpose of this review was to assess the findings from
previous studies that either qualitatively or quantitatively examined the quality
and applicability of FAERS data through comparison with data from observational
studies. We utilized related terms of FAERS, combined with a series of terms
regarding other approaches for post-marketing surveillance. The search terms
that we used included: (FDA Adverse event reporting system OR MedWatch)
AND (published studies OR literature OR epidemiological OR observational OR
clinical trials OR case series OR registry OR electronic data) AND (rate OR
incidence OR number OR ratio OR rank).

32
The inclusion criteria for the literature review included: (1) analyses using
FAERS data and other post-marketing surveillance approaches, (2) review and
comparison of evidence generated from FAERS and other study designs, and (3)
published in English. The exclusion criteria for studies were: (1) solely focused
on adverse events detection using FAERS, (2) used FAERS as supplementary
evidence and no comparisons were made, (3) focused on devices and vaccines,
(4) linked evidence from FAERS to biomedical mechanisms, and (5) the full text
was not available.
The initial search generated a total of 310 articles (as of July 2016) using
our search terms. There were two articles that were not published in English and
13 articles of which full text was not available in PubMed. The abstracts of
studies were then examined to determine relevance to the purpose of our review.
After the examination, a total of 11 studies remained after applying exclusion
criteria and were included in our final review (Figure 2). Although none of these
studies quantitatively compared FAERS data with results from other sources of
post-marketing surveillance, these studies rendered evidence of relative
comparability and consistency of findings between FAERS data and other
approaches.

33
Figure 2 Flow Diagram of Literature Review of Comparison on FAERS Data and Observational Studies

34
Four studies utilized and compared multiple databases. Mammo et al.
published an article in 2016 on their findings on the risk of age related macular
degeneration (AMD) with oral bisphosphonates (alendronate, ibandronate, and
risedronate).98 They utilized the FAERS database and 2 patient cohorts, and
employed 3 distinct study designs: disproportionality analysis (RORs were
computed), case-control study, and a self-controlled case series (SCCS). Higher
ROR was observed in the disproportionality analysis for alendronate and had the
highest number of cases with greater than 3 years of bisphosphonates use. This
indicated a potential association between higher risk of AMD and longer duration
of bisphosphonates use, which was also demonstrated in the case control and
SCCS studies.
Fujimoto et al. examined the association of stain use and cancer using
FAERS database and a claims database.99 Reported cases of atorvastatin,
fluvastatin, simvastatin, rosuvastatin, pitavastatin, and pravastatin were searched
and around 8,000 preferred terms of adverse events were identified. Consistent
findings were seen in analyses using both databases – statins, as a class, were
significantly associated with two types of cancers: colorectal cancer and
pancreatic cancer.
Edwards and her colleagues compared the strengths and limitations of
three databases through evaluating the completeness and accuracy of safety
information regarding nephrogenic systemic fibrosis (NSF).100 The three
databases studied were: the International Centre for Nephrogenic Systemic
Fibrosis Registry (ICNSFR), FAERS, and a legal data set. The FAERS offered

35
the largest number (n = 1,395) of NSF reports, however, shared the limitations
that were inherent to spontaneous report data such as incompleteness and
inability to avoid redundant reporting. A similar study was also conducted to
examine pediatric cases of NSF in FAERS, ICNSFR, and published literature.
Data mining of three data sources gave the consistent conclusion that NSF is
rare in children.101 Both studies emphasized the necessity of looking into multiple
data sources to identify more information on rare but important adverse events.
Other studies examined evidence from FAERS by comparing it with
published literature or clinical findings. Edwards et al. published a study in 2013
on their findings on the association between bisphosphonates and non-healing
femoral fractures.102 They utilized FAERS data to detect significant signals
between bisphosphonates and non-healing femoral fractures and found strong
association with a PRR of 4.51. Additionally, they performed a systematic review
to support the findings from FAERS and made similar conclusions.
Sakaeda et al. reviewed FAERS cases and detected signals using
multiple algorithms to examine platinum agents related adverse events and to
compare the rank of studied agents (cisplatin, carboplatin, and oxaliplatin) based
on signals for each adverse event with clinical findings.103 The results
demonstrated that platinum agents might cause adverse events such as nausea,
vomiting, and neutropenia. The rank-order of studied agents in terms of many
adverse events were all confirmed to be consistent with clinical findings,
suggesting the usefulness of FAERS data and reproducibility of clinical findings.

36
Evens et al. looked into rituximab related hepatitis B virus reactivation
(HBV-R) cases from published literature and the FAERS database, and
compared the completeness of FAERS and literature cases based on pre-
specified covariates.104 Evidence from both FAERS and literature indicated
strong association between rituximab and HBV-R; however, cases identified from
literature tended to be much more complete. Belknap et al. investigated clinical
features of gemcitabine related lung injury through clinical trial reports, literature
case reports and FAERS.105 McKoy JM and her colleagues summarized
information on gemtuzumab ozogamicin associated sinusoidal obstructive
syndrome from variable sources, including peer-reviewed articles, an
observational registry and FAERS database.106 Evidence from FAERS provided
relatively consistent findings as well.
Reese et al. employed three different methods to identify drugs that may
contribute to drug-induced immune thrombocytopenia.107 The three methods
included: (1) case reports from published literature, (2) serum samples tests, and
(3) FAERS data mining. Five hundred seventy-three drugs were found to have
significant signals with thrombocytopenia in FAERS. Drugs identified in FAERS
covered 327 (93%) of 351 drugs described in literature and or serum sample
tests. However, only 16% of these 573 drugs were reported to be associated with
thrombocytopenia in literature or serum tests. This indicated the superior ability
of FAERS database to identify potentially related drugs in a more comprehensive
manner.

37
Not all studies found consistent results. A review study by Suarez et al.
examined evidence from observational studies on the association between
incretin-based therapies and potential increased risk of acute pancreatitis and
pancreatic cancer.108 Although signals detected from FAERS database
suggested GLP-1 receptor agonist and DPP-4 inhibitor use may lead to acute
pancreatitis and pancreatic cancer, the findings of their review showed conflicting
evidence. However, as mentioned in the article, it is noteworthy that the studies
reviewed by Suarez and colleagues provided limited evidence to make any
conclusions.
In summary, findings from these 11 studies demonstrate relative
consistency between the evidence from FAERS data and evidence from
observational studies (either through databases or clinical trials), although one
study (Suarez et al.) suggests potential conflicting evidence between FAERS and
observational studies. Of note, only one study searched for specific adverse
event terms (preferred terms) and compared evidence from the FAERS database
and a claims database with that information (Fujimoto et al.). Our literature
review identified consistency between evidence from FAERS and observational
studies regarding adverse events related to specific drugs. The review also
indicated a need for quantitative examination and comparison of FAERS data to
observational studies.

38
Additional Analyses for FAERS Data
Common data mining in spontaneous reported data only generates
descriptive statistics and reporting signals, which often ignore individual-level
variations. Researchers have been trying to develop additional analytic methods
that can be applied to FAERS data to help better understand and compare the
effect of drugs in question and to adjust for issues in spontaneously reported
data. One important element to incorporate is the time to onset of adverse
events.
Maignen F et al. proposed a method to employ hazard functions using
time to onset of adverse events.24 Their idea was based on the assumption that
“the estimation of the hazard of occurrence of a reaction is directly connected to
the underlying mechanism of the toxicity”. They examined both non-parametric
analysis using Kaplan-Meier estimates and parametric distributions to model the
time to onset of event and develop the hazards functions. They selected two
drug-adverse events combinations to assess their models: (1) bosentan and liver
injuries, (2) TNF inhibitors and infections. Their study found some consistency of
the associations between TNF inhibitors and occurrences of infections,
suggesting that their parametric modeling might be a potentially useful tool to
detect a casual association between drugs and adverse events. However, the
parametric method was limited in that it required a minimum number of reports,
which were sufficiently complete to satisfy an acceptable fit of distributions. They
also reinforced that the results should be interpreted with caution due to
limitations in the data and lack of comparators.

39
Another study by Van Holle L and Bauchau V looked into an approach to
predict adverse events following the initiation of immunization.109 They also
included the time to onset of event distributions as a predictive variable along
with stratified PRR, and found that the relative unexpectedness of the time-to-
onset of event seemed to be the best predictor of a potential safety alert.
However, the study was conducted using VAERS data, which focused on
vaccines, and set a 60-day post-vaccination window for assessment, the method
developed in this study is not applicable to our project since we are looking at
long-term safety and the time to onset of event varies widely between cases and
events.
Another novel method that addressed potential biases in FAERS data is a
likelihood ratio test-based method, developed by Huang and colleagues.110 This
method aims to control for family-wise type 1 error and offer a way to, as the
authors stated, “(1) identify the AEs with high reporting rates compared with other
AEs associated with a particular drug, (2) identify drugs associated with high
reporting rates of a particular AE compared to the other drugs.”110 However, the
methodology proposed in this article was very experimental and beyond the
scope of our study, thus such methods were not be examined here.
Summary
Spontaneous reporting systems often raise a controversy due to their
inherent issues and limitations. Issues or limitations that have been discussed in
this chapter include underreporting, stimulated reporting, the Weber effect,

40
duplication of reports, inability to provide incidence rates, and incompleteness.
The FAERS database is very likely also subject to such issues, which need to be
taken into account when conducting data mining in FAERS.
In our study, we examined some of the issues in FAERS cases on
infections related to TNF inhibitors, since they may introduce bias or lead to
misinterpretation to our study results. However, we did not assess stimulated
reporting and the Weber effect because such issues are not pertinent to the
purpose of this study. Stimulated reporting is often assessed when there is a new
boxed warning on a specific adverse event for a drug, while the focus of our
study is to identify more infections instead of studying one specific infection type.
The Weber effect is irrelevant to our study purpose as well because it is a
proposed trend describing an overall reporting pattern while our study is to
identify specific infections in order to facilitate clinical practice.

41
CHAPTER THREE: METHODS
This chapter discusses the main data sources that were used for the
assessment of FAERS reports and the comparison between evidence from
FAERS and observational approaches on TNF inhibitor related infections. Data
extraction methods and relevant statistical analyses are presented as well.
Overall Research Design
Our study examined the features and consistency in the evidence of
common TNF inhibitors related infections from FAERS and observational studies.
We compared evidence from different data sources through evaluation of
summarized data and generated rankings of most commonly reported infections
related to TNF inhibitors. We performed statistical analyses to examine the
applicability of additional analyses for FAERS data. All statistical analyses were
conducted using Stata (version 14, Stata Corp, College Station, Texas, USA).
Data Source
FAERS
We accessed the FAERS database through Evidex™, a web-based
platform, provided by Advera Health Analytics, Inc.
(http://www.adverahealth.com/). Evidex™ contains information on adverse event
reports to FAERS, and provides detailed case reports and data mining signals.
Case reports in FAERS contained information on report/case identification

42
(individual safety report number, case number, report date), patients’
demographic characteristics including age, gender and weight, patients’
conditions, adverse events defined by different levels and outcomes, information
regarding primary suspect drug such as brand name, verbatim dosage (exactly
as entered in the report), route of administration, primary suspect therapy start
date, date adverse event began and manufacturer, brand names of secondary
suspect drug and concomitant drugs, and information about report/reporter
(report code, date manufacturer received report, date report sent, and reporter
occupation and country). We searched infection cases by using System Organ
Class level term “infections and infestations” for each TNF inhibitor.
Post-marketing Observational Studies
Literature Review
PubMed was searched for post-marketing studies that reported
observational data on infections related to any of the studied TNF inhibitors:
etanercept, infliximab, adalimumab, certolizumab pegol, and golimumab. Search
terms combined generic names of the five TNF inhibitors and terms relevant to
post-marketing observational studies, specified as: ("Observational Study"
[Publication Type]) OR ("Clinical Trial, Phase IV" [Publication Type]) and
(adalimumab OR etanercept OR infliximab OR golimumab OR certolizumab
pegol). Identified articles were then screened on their titles and abstracts for
eligibility.
43
Inclusion/Exclusion Criteria: Articles that were included in our final review
must meet all of the following requirements: (1) a peer-reviewed article, (2) phase
4 trials or observational/epidemiological studies on one or more of the five TNF
inhibitors, (3) studies reporting data on TNF inhibitor-associated infections and
(4) articles that were written in English. No restriction on publication date was
applied. If findings from one study were reported in multiple publications, only
latest data were used. Articles were filtered out if any of the following exclusion
criteria were present: (1) study that was irrelevant to our review objective, (2)
studies that only focuses on one specific infection, (3) studies of which the type
was misclassified (such as reviews or pre-marketing studies) and (4) studies of
which full text could not be retrieved.
ClinicalTrials.gov
ClinicalTrials.gov was also searched for observational studies on TNF
inhibitors. This website is a service of the National Institutes of Health (NIH) and
maintained by the National Library of Medicine at the NIH. It contains information
on registered clinical trials, either publicly or privately funded.111 All information
from this website is up-to-date along with the progress of each clinical trial and
can be freely accessed by the public. The search in this website for eligible
studies was conducted through the Advanced Search webpage
(https://clinicaltrials.gov/ct2/search/advanced). Search terms that were used
included “adalimumab OR etanercept OR infliximab OR golimumab OR
certolizumab”. Search results were then narrowed down by selecting only
observational studies and studies with results. We only included studies with
44
reported results because adverse events were displayed on the website as part
of study results. Studies identified from the search were first checked for related
publications though reviewing the “study results” section. Data on infections were
extracted directly from the “study results” section in the website.
Inclusion/Exclusion Criteria: Studies that were included in our final review
must meet all of the following requirements: (1) observational studies on one or
more of the five TNF inhibitors, (2) studies reporting data on specific infections
related to TNF inhibitors and (3) study purpose was pertinent to evaluation of
TNF inhibitor treatments. Studies were filtered out if any of the following
exclusion criteria were present: (1) study that was irrelevant to our review
objective, (2) studies of which the study population was already included in
another study (in this case, we used data from the most recent study or the study
with a bigger sample size).
For each study included in the final review, information extracted for our
summary purpose included (if available): author, year, country, study type, study
size, disease condition, follow-up period, study treatment and data on reported
infections. Summary tables were created for each data source on distribution of
included studies by different TNF inhibitor and disease condition.
Analyses
For each data source, we summarized included studies (cases in FAERS)
by TNF inhibitor and indication. We also examined the distribution of cases in
FAERS before and after 4/22/2008 (approval date of certolizumab pegol) based

45
on each case’s primary suspect therapy start date, as infliximab, adalimumab
and etanercept were approved almost 10 years earlier than certolizumab pegol
and golimumab, which may have masked the current distribution with large
amount cases from period before certolizumab pegol and golimumab were
approved.
Specific Aim 1: Specific Aim 1 was to describe and contrast features of FAERS
and observational studies in post-marketing surveillance for TNF inhibitor related
infections. We hypothesized that we would observe differences between FAERS
data and observational studies data regarding infections related to TNF inhibitors
in terms of duplication of cases, incompleteness and timeliness. General issues
with spontaneous reporting systems stated in Chapter 2 were addressed and
examined for FAERS data and for observational studies if feasible.
Duplication of Cases
FAERS: Duplicates were excluded from the summary of case reports. A
case was considered as a duplicate if it had identical information with another
case on patient characteristics (such as age, gender, weight, and country),
product names and treatment date and/or date adverse event began.
Observational studies: Duplicates were considered as same study
cohorts. If multiple articles were published on the results from the same study
cohort (often seen in extended study or follow up study), only the latest data were
used in our analysis. If a published report only used a subgroup of the data of

46
another published study, we used the one with the bigger study population in our
final analysis.
Timeliness
In order to compare the timeliness of FAERS reports and observational
findings, we searched in PubMed for articles published on TNF inhibitor-
associated infections with FAERS data. Search terms used were: (adalimumab
OR etanercept OR infliximab OR golimumab OR certolizumab pegol) and
(Medwatch or FDA adverse event reporting system or Food and Drug
administration adverse event reporting system). Inclusion Criteria were: (1) a
peer-reviewed article, (2) published in English and (3) studies used FAERS
evidence and examined TNF inhibitor-associated infections. No restriction on
publication date was applied. Exclusion criteria were: (1) study that was irrelevant
to our review objective, (2) study that was based on cases from non-US country
and (3) studies of which the full text could not be retrieved.
First online availability or the publication dates of studies using FAERS
data and observational studies included in our systematic literature review were
extracted for comparison based on the median of publication year. Although the
publication date is usually months after the completion of a study and often
subject to delays due to factors such as manuscript revisions, we still used the
publication date as the measure to examine timeliness, as studies can only make
an impact after being published. If multiple publications were found on the same
study, only the earliest publication date was used for comparison.

47
Incompleteness and Inaccuracy in FAERS
Any information that was vacant in a report was considered as missing
data. The rates of missing data were calculated for cases’ demographic
information, such as age, gender, and weight. The rates of missing values in
primary suspect therapy start date and event began date were also examined.
Specific Aim 2: Specific aim 2 was to examine and compare the number of TNF
inhibitor related infections identified and the specific level of identified TNF
inhibitor related infections using FAERS and observational approach. We
hypothesized that we would observe differences in the number and the specific
level of identified TNF inhibitor related infections using FAERS and observational
studies identified in the literature or ClinicalTrials.gov.
In FAERS, we searched for all primary suspect cases of infections related
to each TNF inhibitor. We excluded cases for which the MedDRA® preferred term
coded as “Infection” as this term was not specific and compromised large
proportion of our total cases, which would bias our summary of preferred terms
and our analyses for specific aim 3. We then filtered through the preferred terms
reported for all cases and identified unique terms in Excel.
For each observational study included in our literature review, we
extracted all reported infection terms from the body of text of individual article
and recorded the terms for each article in Excel in a cumulative manner with the
same term only recorded once.

48
For each observational study identified from ClinicalTrials.gov, we
extracted all reported infection terms from the “Serious Adverse Events” and
“Other Adverse Events” sections for each study and the terms for each study in
Excel in a cumulative manner as well with the same term only recorded once
The total number of all identified unique infection terms were then
summarized for each data source and compared for its number and specificity.
Specific Aim 3: Specific aim 3 was to examine the consistency between FAERS
and an observational approach in the type and reporting rates of common
infections associated with TNF inhibitors. We hypothesized that we would
observe a difference in the type of most common infections reported in FAERS
and observational studies. The reporting rates of cases (patients) for the same
TNF inhibitor-infection combination would differ as well.
For each approach, 5 rankings were generated for identified infections
related to each TNF inhibitor (adalimumab, etanercept, infliximab, certolizumab
pegol and golimumab) respectively. Rankings from observational studies were
based on the rate of each infection using pooled frequency of each infection
divided by the total number of patients with any infection. The ranking of
infections from FAERS data was based on the percentage of primary suspect
cases for each infection among all TNF inhibitor related infection cases after
eliminating “Infection” cases.
The generated rankings were then compared to examine whether these
data sources provided relatively consistent findings by subjective examination.

49
For infections that were among top 10 on both rankings, we further checked if the
reporting rates were similar.
Specific Aim 4: Specific aim 4 was to examine the applicability of additional
analyses using FAERS data. Analyses were performed on all infections cases
related to TNF inhibitors.
Only cases that were appropriately documented were used in our
analyses. That is, any missing values or values that did not make sense were
excluded from our analyses. For instance, age or weight was documented less
than or equals to 0, or primary suspect therapy start date was later than the
infection event began date. We also excluded patients who were older than 80
years old, as age older than this would highly confound our analyses results.
Descriptive statistics were summarized on patient age, gender, TNF
inhibitor, weight, and time to onset of adverse events. Time to onset of adverse
events was calculated in days using “Date Adverse Event Began” minus “Primary
Suspect Therapy Start Date”. Age and time to onset of adverse events were kept
as continuous variables and the mean and median value for each TNF inhibitor
was calculated (Table 3).
Multiple logistic regressions were performed to explore the relationship
between case endpoint outcome (death, life-threatening, hospitalization or other)
and patient demographic and treatment characteristics (Table 4). Patient
demographic characteristics included age (years), gender (male/female) and
weight (lbs.); treatment characteristics included TNF inhibitors (etanercept,

50
infliximab, adalimumab, certolizumab pegol, or golimumab), and time to onset of
adverse event (days). Bivariate logistic regression analyses were conducted by
taking each independent variable, one at a time, to examine its impact on case
outcomes. Four regression models with different case outcomes were used to
examine the influence of independent variables. A p-value < 0.2 was the criterion
for a variable to be included in the multiple logistic regression model. A p-value
<0.05 was considered of statistical significance in the multiple logistic regression
analyses.

51
Table 3 Independent Variables for Multiple Logistic Regression Models
Variable Type Levels
Age Continuous Years (0-80)
Gender Categorical Male, female
Weight Continuous Lbs.
TNF inhibitors Categorical Etanercept, adalimumab, infliximab, certolizumab pegol, golimumab
Time to onset of adverse event
Continuous Days

52
Table 4 Dependent Variables for Multiple Logistic Regression Models
Dependent variable Case Definition
Regression 1 Death All death cases
Regression 2 Life-threatening
All cases reported with an outcome labeled as life-threatening, excluding death cases
Regression 3 Death or life-threatening Cases with an outcome of death or life–threatening or both.
Regression 4 Hospitalization
Cases with an outcome of hospitalization, excluding any case with a outcome record of death or life-threatening

53
Time to onset analysis was conducted to examine differences in survival
distributions between TNF inhibitors. For the purpose of the analysis, reports
without adverse event began date or therapy start date were excluded from
analysis; reports with a therapy start date before drug approval date was
excluded as well. In our case, the event time was the infection began date, thus
all of the people in our analysis had the event.
The analysis was performed for each TNF inhibitor for all infections
(defined by SOC “infections and infestations”, as a whole class) first and
differences between drugs for all infections were examined. The survival
distribution was estimated using Kaplan-Meier method. The estimates of survival
functions from Kaplan-Meier method for five TNF inhibitors were then compared
using the log-rank test to examine whether there was a significant difference (p-
value < 0.05) in the survival across the five groups.
Human Research Review Committee (HRRC) Approval
Analyses proposed in this study do not require UNM HRRC approval as
the FAERS database is available for public inquiries and no identifiable private
information can be obtained. According to the federal regulations for human
subject research (45 CFR Part 46), IRB review of analysis of publicly available
de-identified data is not required.

54
CHAPTER FOUR: RESULTS
This chapter presents the results from our analyses for each of the
specific aims of the study. Descriptions and general summaries of the data
retrieved from FAERS, literature and ClinicalTrials.gov are first displayed.
Detailed description and comparisons of evidence from each type of data source
are then presented, followed by results of rankings for assessing consistency in
reported infections between the three data sources. Lastly, we report results from
logistic regressions on predictors and outcomes of infection cases, as well as the
results of Kaplan-Meier functions comparing the time to onset of event between
different TNF inhibitors.
Description of Retrieved Data
FAERS Cases
A total of 163,789 primary suspect cases of infections and infestations
were identified in FAERS database for all TNF inhibitors of interest as of
November 2016. The number of retrieved cases and retrieval dates are
summarized in Table 5 for each TNF inhibitor. Etanercept has the largest number
of cases (n=68,807), while golimumab has the least number of cases (n=4,884).
We further checked the proportion of each TNF inhibitor related infection
cases before 4/22/2008 (the approval date of certolizumab) and after 4/22/2008,
based on the reported primary suspect therapy start date (cases with available

55
therapy start date and event began date, n=68,881). The number and proportion
of each TNF inhibitor are displayed in Table 6. The proportion of available cases
among all cases for each TNF inhibitor is also presented in Table 6. Etanercept
still had the largest number of cases (n=14,770, 53.3%) for the period before
4/22/2008, while adalimumab was the dominant one (n=17,383, 42.2%) after
4/22/2008. The combined proportion of certolizumab pegol and golimumab
increased to 12.7% for the period after 4/22/2008.
Data Extracted from Systematic Literature Review
We identified a total of 225 articles from our initial search in PubMed in
November 2016. After applying inclusion and exclusion criteria, thirty articles
remained for our final analysis. The reference lists of included articles were
reviewed for additional relevant articles and 23 articles were considered eligible
for our final review. Thus, we have a total of 53 articles in our final data
synthesis. The PRISMA flow diagram of included articles is presented in Figure
3.
Among included studies, two were extended phase 4 studies of
randomized clinical trials and fifteen studies used registry data or chart records.
The number of participants in each individual study ranged from 12 to 1879 and
the length of study period ranged from 8 weeks to 72 months. Eight studies
reported adverse events on multiple TNF inhibitors. The number of included
studies on each disease condition and TNF inhibitor is presented in Table 7.

56
Data Extracted from ClinicalTrials.gov
We located 78 observational studies in the ClinicalTrials.gov website in
December 2016, of which 18 studies were excluded for having irrelevant study
purposes (such as focusing on patients’ work productivity) and not reporting any
infection adverse events (n=5). Another 3 studies were further excluded because
their study populations were contained in included studies. A total of 52 studies
were included in our final review. Seven of the included studies were found with
related publications on study results, among which 5 were included in our
systematic literature review in PubMed. Of included studies from
ClinicalTrials.gov, one study was on three TNF inhibitors (adalimumab, infliximab
and etanercept). Besides that study, twenty-four studies were on adalimumab,
sixteen studies were on etanercept and eleven studies were on infliximab. Two
studies were on certolizumab pegol and only one study was on golimumab. The
study population of included studies ranged from 25 to 7740 and the length of
study period ranged from 14 weeks to 72 months. The number of included
studies on each disease condition and TNF inhibitor is presented in Table 8.

57
Table 5 Data Retrieval Dates and Number of Primary Suspect Cases in FAERS by Each TNF Inhibitor
Data retrieval date
Number of primary
suspect cases %
Etanercept 11/05/2016 68807 42.0%
Adalimumab 11/01/2016 60649 37.0%
Infliximab 11/02/2016 22499 13.7%
Certolizumab
Pegol 11/03/2016 6950 4.2%
Golimumab 11/03/2016 4884 3.0%
Total 163789 100%

58
Table 6 Distribution of Primary Suspect Cases by Each TNF Inhibitor Before/After 4/22/2008
Before 4/22/2008 After 4/22/2008
Total (% of All Extracted
Cases)
n % n %
Etanercept 14,770 53.3% 15,440 37.5% 30,210 (43.9%)
Adalimumab 9,401 33.93% 17,383 42.22% 26,784 (44.2%)
Infliximab 3,539 12.77% 3,138 7.62% 6,677 (29.7%)
Certolizumab Pegol 0 0 3,874 9.41%
3,874 (55.7%)
Golimumab 0 0 1,336 3.25% 1,336 (27.4%)
Total (n=68,881)* 27,710 100% 41,171 100%
68,881 (42.1%)
*Total number is different due to limited number of cases with information on primary suspect therapy date and event began date

59
Figure 3 PRISMA Flowchart of Included Studies from PubMed

60
Table 7 Distribution of Included Studies from PubMed by TNF Inhibitor and Indication
Etanercept
(n=22)
Adalimumab
(n=17)
Infliximab
(n=23)
Certolizumab
Pegol
(n=1)
Golimumab
(n=0)
Crohn’s
Disease
0 7112–118 360,119,120 1121 0
Rheumatoid
Arthritis
663,122–126 2125,126 957,63,125–131 0 0
Lupus
Arthritis
1132 0 0 0 0
Ulcerative
Colitis
0 3133–135 4136–139 0 0
Uveitis 0 2140,141 1141 0 0
Psoriasis 861,142–148 1142 3142,149,150 0 0
Juvenile
Idiopathic
Arthritis
5151–155 2153,155 1155 0 0
Hidradenitis
Suppurativa
0 0 0 0 0
Ankylosing
spondylitis
2156,157 0 0 0 0
Behçet's
Disease
0 0 2158,159 0 0
Total 22 17 23 1 0
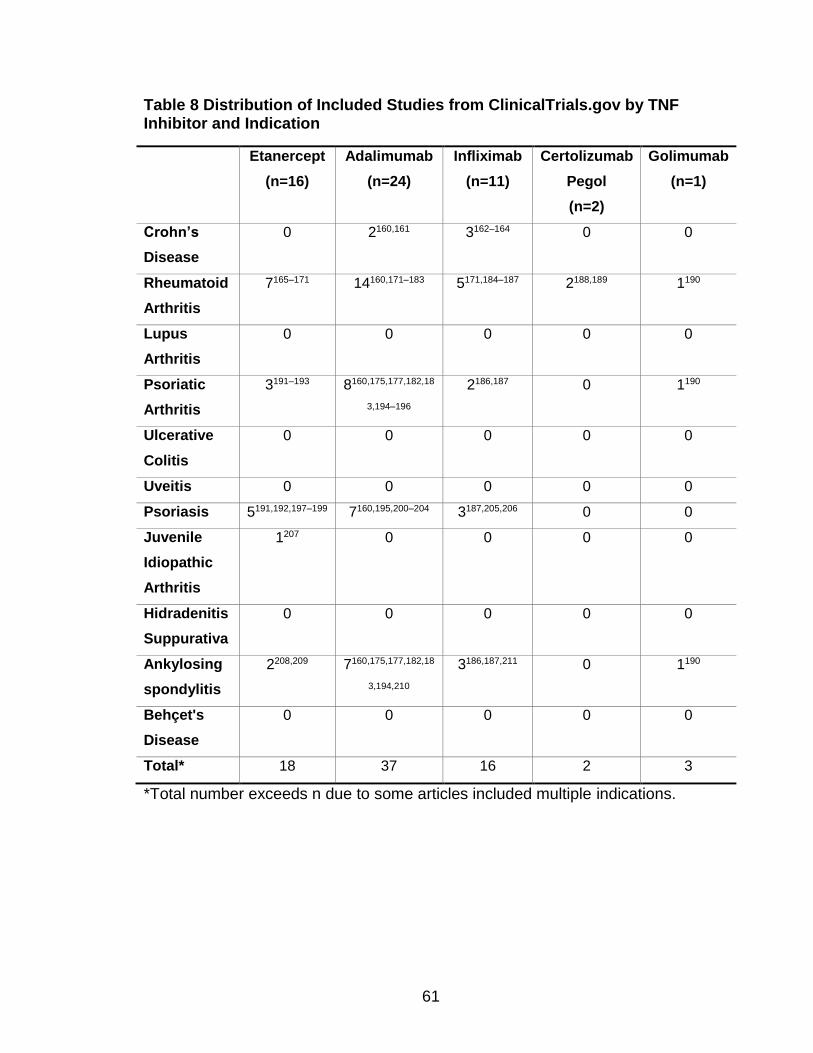
61
Table 8 Distribution of Included Studies from ClinicalTrials.gov by TNF Inhibitor and Indication
Etanercept
(n=16)
Adalimumab
(n=24)
Infliximab
(n=11)
Certolizumab
Pegol
(n=2)
Golimumab
(n=1)
Crohn’s
Disease
0 2160,161 3162–164 0 0
Rheumatoid
Arthritis
7165–171 14160,171–183 5171,184–187 2188,189 1190
Lupus
Arthritis
0 0 0 0 0
Psoriatic
Arthritis
3191–193 8160,175,177,182,18
3,194–196
2186,187 0 1190
Ulcerative
Colitis
0 0 0 0 0
Uveitis 0 0 0 0 0
Psoriasis 5191,192,197–199 7160,195,200–204 3187,205,206 0 0
Juvenile
Idiopathic
Arthritis
1207 0 0 0 0
Hidradenitis
Suppurativa
0 0 0 0 0
Ankylosing
spondylitis
2208,209 7160,175,177,182,18
3,194,210
3186,187,211 0 1190
Behçet's
Disease
0 0 0 0 0
Total* 18 37 16 2 3
*Total number exceeds n due to some articles included multiple indications.

62
Issues of FAERS and Observational Studies Data
Duplication of Cases
FAERS: Our retrieved data from Evidex™ did not contain duplicates, as
we were notified that the data on the Evidex™ platform had duplicate case
reports removed (more details can be found at
http://www.adverahealth.com/assets/pdf/rxfilter_publication_min.pdf).
Literature Review: After applying inclusion and exclusion criteria, we
identified two studies that published multiple articles on the same study
cohorts.121,144,212,213 One study published before and after the long-term follow-up
results; another study published results on its interim analysis and its final
results.
ClinicalTrials.gov: After applying inclusion and exclusion criteria, we
identified three observational studies of which the study cohort was already
included in other two studies (NCT01077258 was included in NCT01078090;
NCT01163318 and NCT01163292 was included in NCT01346501).
NCT01077258 was a 2-year prospective observational study on patients from
303 clinics in German and NCT01078090 was a 5-year prospective observational
study on patients from 370 clinics in German, which included the clinics in
NCT01077258 and overlapped with the study period of NCT01077258.

63
Timeliness
We identified a total of 38 articles from our initial search with the search
terms. Two of these articles were first excluded for not having full text available in
PubMed. After applying inclusion and exclusion criteria, a total of 6 articles
remained in our analysis.214–219 The publication dates (first online availability
dates) of articles on FAERS evidence ranged from 2001 to 2013 with a median of
2007. The publication dates (first online availability dates) of articles included in
our systematic review of observational studies ranged from 2005 to 2016 with a
median of 2012.
Incompleteness and Inaccuracy
We checked the amount of missing values for cases’ demographic
information, such as age, gender and weight, as well as some unreasonable
values (e.g. age≤0 years or weight≤0 lbs.). For age variable, we identified 27.4%
of the total cases with a missing value or an unreasonable value. For gender, we
identified 4.1% of total cases with a missing value. For weight, we identified
29.9% of total cases with a missing value. The rates of missing values for
primary suspect therapy start date and event began date were higher (48.3% and
51.7%).

64
Comparison of the Number and Specificity of Infection Terms
The number of eliminated “infection” (preferred term level) cases for each
TNF inhibitor in FAERS is summarized in Table 9. The number of unique
identified infection terms from each approach (FAERS, published articles and
ClinicalTrials.gov) for each TNF inhibitor is presented in Table 10. For all TNF
inhibitors, the FAERS data contains the largest amount of identified terms
(ranged from 399 to 824), followed by ClinicalTrials.gov (ranged from 23 to 271)
and literature review (ranged from 0 to 90). Adalimumab was found to be
associated with the largest number of reported infection types based on the
evidence from FAERS (n=824) and ClinicaTrials.gov (n=271), but had the third
largest number based on literature review (n=52). Infliximab was associated with
the largest number of types of infections based on literature review (n=90), but
had the second largest number in FAERS data (n=798) and the third largest
number in ClinicalTrials.gov (n=122). Etanercept was associated with the second
largest number of types of infections based on evidence from both literature
review (n=87) and ClinicalTrials.gov (n=238). Certolizumab pegol had the fourth
largest number of infections types from all three data sources, although the
numbers were much smaller compared to adalimumab, infliximab and etanercept
(FAERS: n=423, literature review: n=3 and ClinicalTrials.gov: n=34). For
golimumab, we didn’t find any study reporting specific infections in PubMed.
Since certolizumab pegol and golimumab received US FDA approval in 2008 and
2009, respectively, which was less than 10 years from today, there has been
very limited number of observational studies published or completed. Despite a

65
short period of the marketing of certolizumab pegol and golimumab, FAERS
database still rendered many more specific infection types than observational
studies – the number was over 10 times more than that from observational
studies (either literature review or ClinicalTrials.gov).
Most of the observational studies identified from the ClinicalTials.gov
website reported adverse events in a standardized manner and often used
MedDRA® preferred terms. The number of non-serious infection terms may have
been underreported in ClinicalTrials.gov, because some studies only reported
serious adverse events and some reported non-serious adverse events that
occurred in more than 1%, 2% or 5% of study population. Among studies
included from ClinicalTrial.gov, one study had a threshold of 0.5%
(NCT01298648), one study had a threshold of 2% (NCT01558089) and 15
studies had a threshold of 5% in reporting non-serious adverse events
(NCT01083121, NCT01078402, NCT01316224, NCT01155570, NCT00725452,
NCT00988832, NCT00705289, NCT00727298, NCT00779675, NCT00725621,
NCT00725543, NCT00724958, NCT00705614, NCT00322439 and
NCT01313858). One study measured non-serious adverse events at >1%
frequency level but no non-serious adverse event had a frequency above this
threshold, thus no non-serious adverse events were reported (NCT01111240).
Two studies specifically stated that non-serious adverse events were not
collected (NCT01646385 and NCT01557322).
Underreporting of non-serious events also existed in observational studies
identified through our PubMed search. Some articles only reported serious
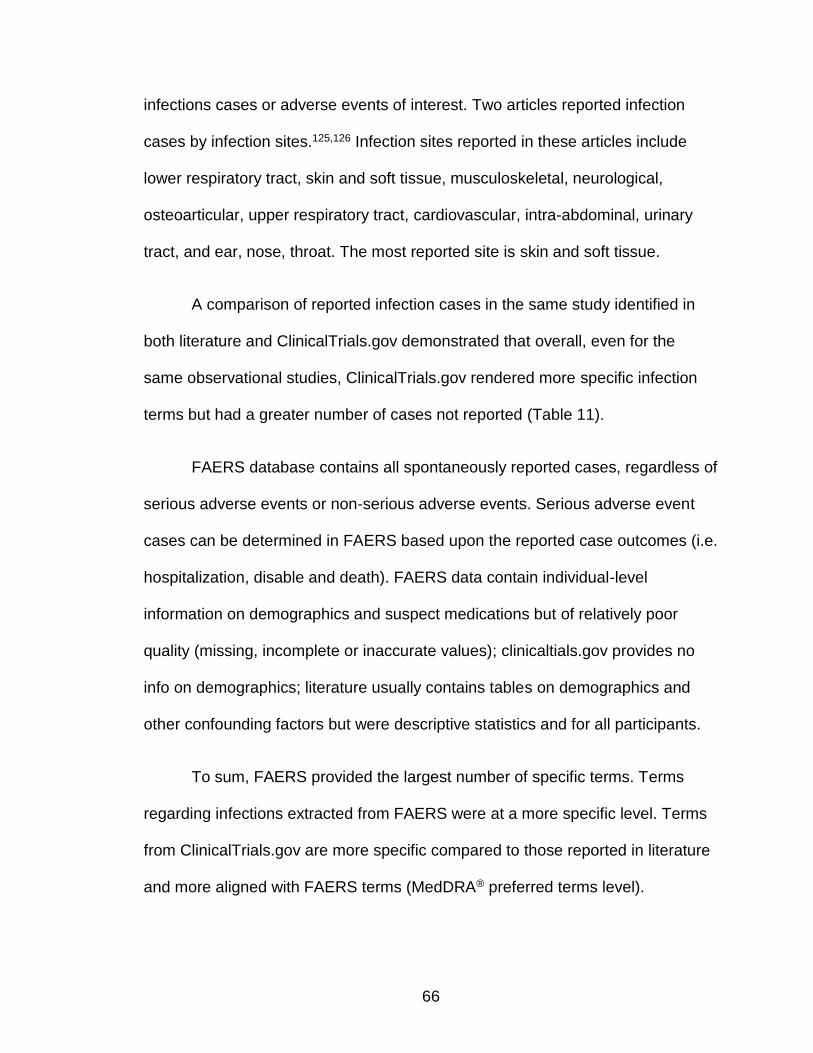
66
infections cases or adverse events of interest. Two articles reported infection
cases by infection sites.125,126 Infection sites reported in these articles include
lower respiratory tract, skin and soft tissue, musculoskeletal, neurological,
osteoarticular, upper respiratory tract, cardiovascular, intra-abdominal, urinary
tract, and ear, nose, throat. The most reported site is skin and soft tissue.
A comparison of reported infection cases in the same study identified in
both literature and ClinicalTrials.gov demonstrated that overall, even for the
same observational studies, ClinicalTrials.gov rendered more specific infection
terms but had a greater number of cases not reported (Table 11).
FAERS database contains all spontaneously reported cases, regardless of
serious adverse events or non-serious adverse events. Serious adverse event
cases can be determined in FAERS based upon the reported case outcomes (i.e.
hospitalization, disable and death). FAERS data contain individual-level
information on demographics and suspect medications but of relatively poor
quality (missing, incomplete or inaccurate values); clinicaltials.gov provides no
info on demographics; literature usually contains tables on demographics and
other confounding factors but were descriptive statistics and for all participants.
To sum, FAERS provided the largest number of specific terms. Terms
regarding infections extracted from FAERS were at a more specific level. Terms
from ClinicalTrials.gov are more specific compared to those reported in literature
and more aligned with FAERS terms (MedDRA® preferred terms level).

67
Table 9 Distribution of Primary Suspect Cases in FAERS by TNF Inhibitor after Eliminating “Infection” Cases
Number of dropped
“infection” cases
Number of primary suspect cases (excluding “infection”
cases)
N N %
Etanercept 3528 65279 41.8%
Adalimumab 2637 58012 37.1%
Infliximab 854 21645 13.9%
Certolizumab
Pegol 363
6587 4.2%
Golimumab 216 4668 3.0%
Total 7598 156191 100%

68
Table 10 Number of Identified Infection Terms by TNF Inhibitor and Data Source
FAERS Literature ClinicalTrials.gov
Adalimumab 824 52 271
Infliximab 798 90 122
Etanercept 788 87 238
Certolizumab
Pegol
423 4 34
Golimumab 399 NA 23

69
Table 11 Comparison of the Number of Infection Cases and Infection Terms Reported in the Literature and ClinicalTrials.gov for the Same Study
Literature
ClinicalTrials.gov
Author (Year)
Number of reported infection
cases
Number of identified terms
Registry Number
Number of reported infection
cases
Number of identified
terms
Shear et al. (2014)
16 7 NCT00779675 13 11
Westhovens et al. (2014)
52 10 NCT00705289 13 12
Kimball et al. (2015)
231 11 NCT00322439 149 58
de Vlam et al. (2015)
66 3 NCT00938015 225 65

70
Consistency in the Types and Reporting Rates of the Most Common
Infections
We generated rankings of reported infections with most cases for each
TNF inhibitor based on the pooled frequency of each type of infection from data
source (FAERS, literature and ClinicalTrials.gov). The top 10 infection types from
each approach are summarized in Table 12-16 for each TNF inhibitor (top 5 for
certolizumab pegol and golimumab due to limited data for these two TNF
inhibitors from observational studies included from the literature and
ClinicalTrials.gov). The rankings and comparisons between different data
sources are summarized below.
Etanercept (Table 12)
In FAERS, 65,279 infection cases were found for etanercept. The 10 most
frequently reported preferred terms related to infections in FAERS were
nasopharyngitis (n=9,128, 13.9%), sinusitis (n=6,673, 10.2%), bronchitis
(n=4,504, 6.9%), pneumonia (n=3,960, 6.1%), influenza (n=3,615, 5.5%), upper
respiratory tract infection (n=2,380, 3.7%), urinary tract infection (n=2,322, 3.6%),
herpes zoster (n=2,282, 3.5%), cellulitis (n=1,731, 2.7%) and lower respiratory
tract infection (n=1,389, 2.1%). The top 10 reported infections compromised
58.2% of all patients with any type of infections.
In the literature review, a total of 1,376 infection cases were pooled for our
evaluation of most frequently reported infection terms. The 10 most frequently
reported terms regarding infections were upper respiratory tract infection (n=297,

71
21.6%), pneumonia (n=284, 20.6%), cellulitis (n=76, 5.5%), viral infection (n=69,
5.0%), nasopharyngitis (n=59, 4.3%), herpes zoster (n=42, 3.1%), flu syndrome
(n=38, 2.8%), gastroenteritis (n=33, 2.4%), diverticulitis (n=33, 2.4%), varicella
zoster (n=32, 2.3%) and otitis media (n=32, 2.3%). The top 10 reported infections
compromised 72.3% of all patients with any type of infections.
For observational studies identified in ClinicalTrials.gov, a total of 1,998
infection cases were pooled for our evaluation of most frequently reported
infection terms. The 10 most frequently reported infections were nasopharyngitis
(n=354, 17.7%), bronchitis (n=191, 9.6%), upper respiratory tract infection
(n=130, 6.5%), pneumonia (n=85, 4.3%), sinusitis (n=82, 4.1%), respiratory tract
infection (n=81, 4.1%), urinary tract infection (n=66, 3.3%), herpes zoster (n=57,
2.9%), cystitis (n=36, 1.8%), gastrointestinal infection (n=32, 1.6%) and
gastroenteritis (n=32, 1.6%). The top 10 reported infections compromised 57.4%
of all patients with any type of infections.
To sum, 4 of 10 infection terms matched between all three data sources
(nasopharyngitis, pneumonia, upper respiratory tract infection, and herpes
zoster), among which herpes zoster was reported at rates within 1% of each
other. Seven of the top 10 infection terms matched between evidence from
FAERS and ClinicalTrials.gov (nasopharyngitis, sinusitis, bronchitis, pneumonia,
upper respiratory tract infection, urinary tract infection and herpes zoster); 2 were
reported at rates within 1% of each other (urinary tract infection and herpes
zoster). Respiratory cases accounted for 6 of the top 10 infection terms in both

72
FAERS and observational studies from ClinicalTrials.gov. Nasopharyngitis was
ranked the first place in both as well.

73
Table 12 Top 10 Reported Infections Related to Etanercept from Each Data Source
Rank
FAERS
(n=65,279)
Literature
(n=1,376)
ClinicalTrials.gov
(n=1,998)
1 Nasopharyngitis 9,128 (13.9%) Upper Respiratory Tract
Infection
297 (21.6%) Nasopharyngitis 354 (17.7%)
2 Sinusitis 6,673
(10.2%)
Pneumonia 284 (20.6%) Bronchitis 191 (9.6%)
3 Bronchitis 4,504 (6.9%) Cellulitis 76 (5.5%) Upper Respiratory
Tract Infection
130 (6.5%)
4 Pneumonia 3,960 (6.1%) Viral Infection 69 (5.0%) Pneumonia 85 (4.3%)
5 Influenza 3,615 (5.5%) Nasopharyngitis 59 (4.3%) Sinusitis 82 (4.1%)
6 Upper Respiratory
Tract Infection
2,380 (3.7%) Herpes Zoster 42 (3.1%) Respiratory Tract
Infection
81 (4.1%)
7 Urinary Tract
Infection
2,322 (3.6%) Flu Syndrome 38 (2.8%) Urinary Tract
Infection
66 (3.3%)
8 Herpes Zoster 2,282 (3.5%) Gastroenteritis 33 (2.4%) Herpes Zoster 57 (2.9%)
9 Cellulitis 1,731 (2.7%) Diverticulitis 33 (2.4%) Cystitis 36 (1.8%)
10 Lower Respiratory
Tract Infection
1,389 (2.1%) Varicella Zoster
Infection
32 (2.3%) Gastrointestinal
Infection
32 (1.6%)
Otitis Media 32 (2.3%) Gastroenteritis 32 (1.6%)
*n is the total number of patients with any infection

74
Adalimumab (Table 13)
In FAERS, 58,012 infection cases were found for adalimumab. The 10
most frequently reported preferred terms related to infections in FAERS were
nasopharyngitis (n=8,992, 15.5%), sinusitis (n=4,540, 7.8%), pneumonia
(n=3,613, 6.2%), bronchitis (n=3,251, 5.6%), influenza (n=2,583, 4.5%), urinary
tract infection (n=2,286, 3.9%), herpes zoster (n=1,918, 3.3%), upper respiratory
tract infection (n=1,514, 2.6%), cellulitis (n=1,278, 2.2%) and ear infection
(n=1,062, 1.8%). The top 10 reported infections compromised 53.5% of all
patients with any type of infections.
In the literature review, a total of 193 infection cases were pooled for our
evaluation of most frequently reported infection terms. The 10 most frequently
reported terms regarding infections upper respiratory tract infection (n=43,
22.3%), lower respiratory tract infection (n=22, 11.4%), bacterial infection (n=15,
7.8%), bacteremia (n=12, 6.2%), viral infection (n=8, 4.1%), otitis media (n=7,
3.6%), pneumonia (n=5, 2.6%), tonsillitis (n=5, 2.6%), sinusitis (n=5, 2.6%),
sepsis (n=4, 2.1%) and herpes zoster (n=4, 2.1%). The top 10 reported infections
compromised 67.4% of all patients with any type of infections.
For observational studies identified in ClinicalTrials.gov, a total of 2,284
infection cases were pooled for our evaluation of most frequently reported
infection terms. The 10 most frequently reported infections were nasopharyngitis
(n=359, 15.7%), bronchitis (n=314, 13.7%), urinary tract infection (n=246,
10.8%), pneumonia (n=131, 5.7%), respiratory tract infection (n=97, 4.2%), upper

75
respiratory tract infection (n=64, 2.8%), herpes zoster (n=51, 2.2%), sinusitis
(n=44, 1.9%), sepsis (n=39, 1.7%) and pharyngitis (1.7%). The top 10 reported
infections compromised 60.6% of all patients with any type of infections.
To sum, 4 of 10 infection terms matched between all three data sources
(sinusitis, pneumonia, upper respiratory tract infection, and herpes zoster),
among which none was reported at rates within 1% of each other. Seven of the
top 10 infection terms matched between evidence from FAERS and
ClinicalTrials.gov (nasopharyngitis, sinusitis, pneumonia, bronchitis, urinary tract
infection, upper respiratory tract and herpes zoster); 3 were reported at rates
within 1% of each other (nasopharyngitis, pneumonia and upper respiratory tract
infection). Respiratory cases accounted for 6 and 7 of the top 10 infection terms
in FAERS and observational studies from ClinicalTrials.gov, respectively, and
nasopharyngitis was ranked the first place in both.
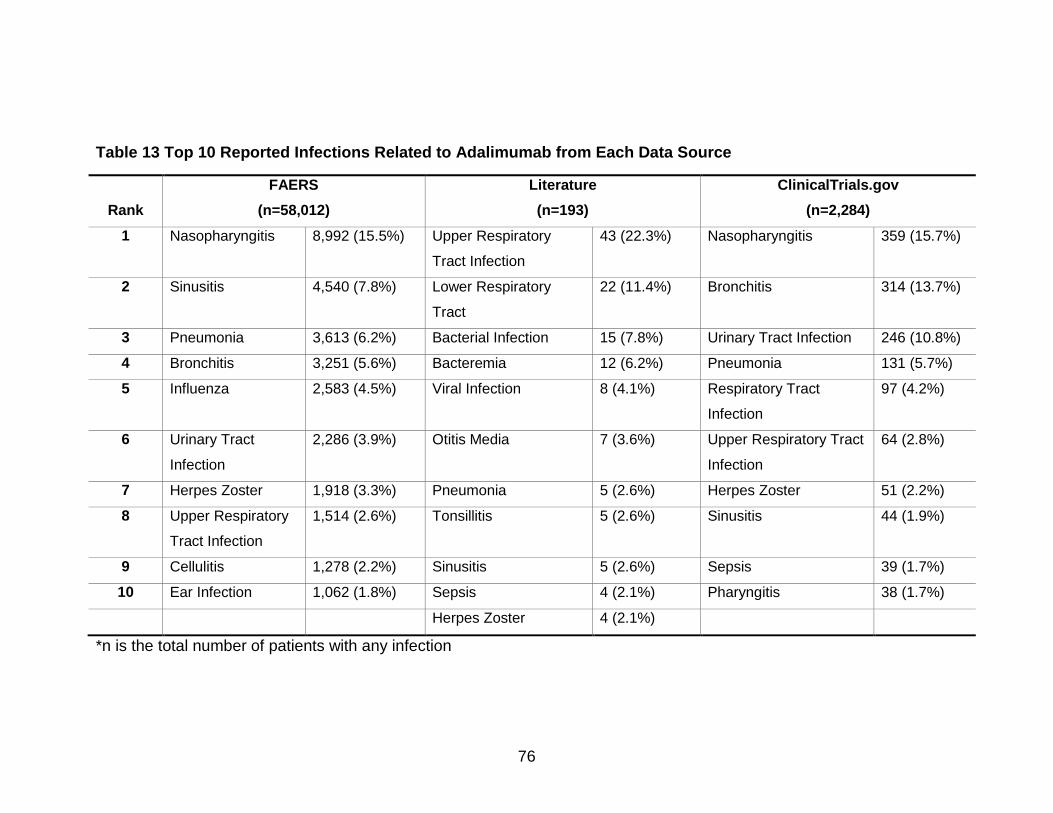
76
Table 13 Top 10 Reported Infections Related to Adalimumab from Each Data Source
Rank
FAERS
(n=58,012)
Literature
(n=193)
ClinicalTrials.gov
(n=2,284)
1 Nasopharyngitis 8,992 (15.5%) Upper Respiratory
Tract Infection
43 (22.3%) Nasopharyngitis 359 (15.7%)
2 Sinusitis 4,540 (7.8%) Lower Respiratory
Tract
22 (11.4%) Bronchitis 314 (13.7%)
3 Pneumonia 3,613 (6.2%) Bacterial Infection 15 (7.8%) Urinary Tract Infection 246 (10.8%)
4 Bronchitis 3,251 (5.6%) Bacteremia 12 (6.2%) Pneumonia 131 (5.7%)
5 Influenza 2,583 (4.5%) Viral Infection 8 (4.1%) Respiratory Tract
Infection
97 (4.2%)
6 Urinary Tract
Infection
2,286 (3.9%) Otitis Media 7 (3.6%) Upper Respiratory Tract
Infection
64 (2.8%)
7 Herpes Zoster 1,918 (3.3%) Pneumonia 5 (2.6%) Herpes Zoster 51 (2.2%)
8 Upper Respiratory
Tract Infection
1,514 (2.6%) Tonsillitis 5 (2.6%) Sinusitis 44 (1.9%)
9 Cellulitis 1,278 (2.2%) Sinusitis 5 (2.6%) Sepsis 39 (1.7%)
10 Ear Infection 1,062 (1.8%) Sepsis 4 (2.1%) Pharyngitis 38 (1.7%)
Herpes Zoster 4 (2.1%)
*n is the total number of patients with any infection

77
Infliximab (Table 14)
In FAERS, 21,645 infection cases were found for infliximab. The 10 most
frequently reported preferred terms related to infections in FAERS were
pneumonia (n=1,664, 7.7%), tuberculosis (n=1,332, 6.2%), herpes zoster
(n=1,022, 4.7%), pulmonary tuberculosis (n=547, 2.5%), sepsis (n=539, 2.5%),
abscess (n=496, 2.3%), disseminated tuberculosis (n=492, 2.3%), pneumocystis
jirovecii pneumonia (n=481, 2.2%), cellulitis (n=473, 2.2%) and urinary tract
infection (n=431, 2.0%). The top 10 reported infections compromised 34.5% of all
patients with any type of infections.
In the literature review, a total of 704 infection cases were pooled for our
evaluation of most frequently reported infection terms. The 10 most frequently
reported terms regarding infections upper respiratory tract infection (n=200,
28.4%), bronchitis (n=55, 7.8%), lower respiratory tract infection (n=37, 5.3%),
nasopharyngitis (n=36, 5.1%), tonsillitis (n=31, 4.4%), otitis media (n=31, 4.4%),
pneumonia (n=29, 4.1%), sinusitis (n=27, 3.8%), urinary tract infection (n=26,
3.7%), gastroenteritis (n=23, 3.3%) and bacterial infection (n=23, 3.3%). The top
10 reported infections compromised 73.6% of all patients with any type of
infections.
For observational studies identified in ClinicalTrials.gov, a total of 419
infection cases were pooled for our evaluation of most frequently reported
infection terms. The 10 most frequently reported infections were anal abscess
(n=65, 15.5%), pneumonia (n=23, 5.5%), abdominal abscess (n=20, 4.8%),

78
gastroenteritis (n=20, 4.8%), abscess (n=13, 3.1%), cellulitis (n=11, 2.6%),
sepsis (n=11, 2.6%), subcutaneous abscess (n=8, 1.9%), urinary tract infection
(n=8, 1.9%), herpes zoster (n=8, 1.9%) and nasopharyngitis (n=8, 1.9%). The top
10 reported infections compromised 46.5% of all patients with any type of
infections.
To sum, 2 of 10 infection terms matched between all three data sources
(pneumonia and urinary tract infection), among which none was reported at rates
within 1% of each other. Six of the top 10 infection terms matched between
evidence from FAERS and ClinicalTrials.gov (pneumonia, herpes zoster, sepsis,
abscess, cellulitis and urinary tract infection); 4 were reported at rates within 1%
of each other (abscess, cellulitis, sepsis and urinary tract infection). Respiratory
cases accounted for 5 and 2 of the top 10 infection terms in FAERS and
observational studies from ClinicalTrials.gov, respectively.

79
Table 14 Top 10 Reported Infections Related to Infliximab from Each Data Source
Rank
FAERS
(n=21,645)
Literature
(n=704)
ClinicalTrials.gov
(n=419)
1 Pneumonia 1,664 (7.7%) Upper Respiratory Tract
Infection
200 (28.4%) Anal Abscess 65 (15.5%)
2 Tuberculosis 1,332 (6.2%) Bronchitis 55 (7.8%) Pneumonia 23 (5.5%)
3 Herpes Zoster 1,022 (4.7%) Lower Respiratory Tract 37 (5.3%) Abdominal Abscess 20 (4.8%)
4 Pulmonary
Tuberculosis
547 (2.5%) Nasopharyngitis 36 (5.1%) Gastroenteritis 20 (4.8%)
5 Sepsis 539 (2.5%) Tonsillitis 31 (4.4%) Abscess 13 (3.1%)
6 Abscess 496 (2.3%) Otitis Media 31 (4.4%) Cellulitis 11 (2.6%)
7 Disseminated
Tuberculosis
492 (2.3%) Pneumonia 29 (4.1%) Sepsis 11 (2.6%)
8 Pneumocystis
Jirovecii Pneumonia
481 (2.2%) Sinusitis 27 (3.8%) Subcutaneous
Abscess
8 (1.9%)
9 Cellulitis 473 (2.2%) Urinary Tract Infection 26 (3.7%) Urinary Tract Infection 8 (1.9%)
10 Urinary Tract Infection 431 (2.0%) Gastroenteritis 23 (3.3%) Herpes Zoster 8 (1.9%)
Bacterial Infection 23 (3.3%) Nasopharyngitis 8 (1.9%)
*n is the total number of patients with any infection

80
Certolizumab Pegol (Table 15)
In FAERS, 6,587 infection cases were found for certolizumab pegol. The
10 most frequently reported preferred terms related to infections in FAERS were
pneumonia (n=635, 9.6%), nasopharyngitis (n=384, 5.8%), herpes zoster (n=384,
5.8%), urinary tract infection (n=313, 4.8%), bronchitis (n=292, 4.4%), sinusitis
(n=251, 3.8%), influenza (n=194, 3.0%), lower respiratory tract infection (n=183,
2.8%), abscess (n=180, 2.7%) and cellulitis (n=177, 2.7%). The top 10 reported
infections compromised 45.4% of all patients with any type of infections.
For observational studies identified in ClinicalTrials.gov, a total of 166
infection cases were pooled for our evaluation of most frequently reported
infection terms. The 5 most frequently reported infections were nasopharyngitis
(n=111, 66.9%), pneumonia (n=10, 6.0%), pulmonary tuberculosis (n=4, 2.4%),
sepsis (n=4, 2.4%) and Urinary tract infection (n=3, 1.8%). The top 5 reported
infections compromised 79.5% of all patients with any type of infections.
Because only 1 study reported information on infection cases from the
literature review, a total of 4 infection cases were pooled. These 4 infection cases
included 2 urinary tract infections, 1 case with clostridium difficile colitis and 1
case with skin infection. Urinary tract infection compromised half of the total
cases.
To sum, 1 of the top 5 infection terms matched all three data sources
(urinary tract infection). Three of the top 5 infection terms matched between
evidence from FAERS and ClinicalTrials.gov (pneumonia, nasopharyngitis,

81
urinary tract infection); nasopharyngitis was reported at rates within 1% of each
other. Respiratory cases accounted for 3 of the top 5 infection terms in both
FAERS and observational studies from ClinicalTrials.gov.

82
Table 15 Most Frequently Reported Infections Related to Certolizumab Pegol from Each Data Source
Rank
FAERS
(n=6,587)
Literature
(n=4)
ClinicalTrials.gov
(n=166)
1 Pneumonia 635 (9.6%) Urinary Tract Infection 2 (50.0%) Nasopharyngitis 111 (66.9%)
2 Nasopharyngitis 384 (5.8%) Clostridium Difficile Colitis 1 (25.0%) Pneumonia 10 (6.0%)
3 Herpes Zoster 384 (5.8%) Skin Infection 1 (25.0%) Pulmonary tuberculosis 4 (2.4%)
4 Urinary Tract
Infection
313 (4.8%) Sepsis 4 (2.4%)
5 Bronchitis 292 (4.4%) Urinary tract infection 3 (1.8%)
6 Sinusitis 251 (3.8%)
7 Influenza 194 (3.0%)
8 Lower Respiratory
Tract Infection
183 (2.8%)
9 Abscess 180 (2.7%)
10 Cellulitis 177 (2.7%)
*n is the total number of patients with any infection

83
Golimumab (Table 16)
In FAERS, 4,668 infection cases were found for golimumab. The 10 most
frequently reported preferred terms related to infections in FAERS were
pneumonia (n=620, 13.3%), lower respiratory tract infection (n=399, 8.6%),
influenza (n=226, 4.8%), urinary tract infection (n=221, 4.7%), cellulitis (n=181,
3.9%), herpes zoster (n=156, 3.3%), bronchitis (n=150, 3.2%), nasopharyngitis
(n=126, 2.7%), sinusitis (n=77, 1.7%) and diverticulitis (n=65, 1.4%). The top 10
reported infections compromised 47.6% of all patients with any type of infections.
Because only 1 observational study reported information on infection
cases included from ClinicaTrials.gov, a total of 35 infection cases were pooled.
The 5 most frequently reported infections were pneumonia (n=7, 20.0%),
subcutaneous abscess (n=4, 11.4%), bronchitis (n=2, 5.7%), bronchopneumonia
(n=2, 5.7%) and cellulitis (n=2, 5.7%). The top 5 reported infections compromised
48.6% of all patients with any type of infections. Because no study reported
infection cases for golimumab in our literature review, no ranking was generated
for golimumab for this data source.
To sum, two of the top 5 infection terms matched between evidence from
FAERS and ClinicalTrials.gov (pneumonia and cellulitis); none was reported at
rates within 1% of each other. Respiratory cases accounted for 2 and 3 of the top
5 infection terms in FAERS and observational studies from ClinicalTrials.gov,
respectively.

84
Table 16 Most Frequently Reported Infections Related to Golimumab from Each Data Source
Rank
FAERS
(n=4,668)
ClinicalTrials.gov
(n=35)
1 Pneumonia 620 (13.3%) Pneumonia 7 (20.0%)
2 Lower
Respiratory
Tract Infection
399 (8.6%) Subcutaneous
abscess
4 (11.4%)
3 Influenza 226 (4.8%) Bronchitis 2 (5.7%)
4 Urinary Tract
Infection
221 (4.7%) Bronchopneumonia 2 (5.7%)
5 Cellulitis 181 (3.9%) Cellulitis 2 (5.7%)
6 Herpes Zoster 156 (3.3%)
7 Bronchitis 150 (3.2%)
8 Nasopharyngitis 126 (2.7%)
9 Sinusitis 77 (1.7%)
10 Diverticulitis 65 (1.4%)
*n is the total number of patients with any infection

85
Multiple Logistic Regressions and Time to Onset of Event Analysis
Table 17 presents the characteristics of the study sample after checking
for missing values and unreasonable values. The total sample included persons
with a mean age of 51.9 years (SD=15.4) and the interquartile range of the
sample aged from 43 to 63 years, which suggested that our sample were mainly
middle-aged patients. Cases with golimumab as the primary suspect therapy had
the highest mean age (56.5 years old, SD=14.5) of all cases with TNF inhibitors
and certolizumab pegol cases had the youngest mean age (49.1 years old,
SD=16.0). The result of ANOVA showed a significant difference age between
different TNF inhibitor groups (p-value<0.001).
Females were the majority of the study sample (72.3%) and were
dominant across all TNF inhibitor groups. Etanercept had the largest proportion
of females (75.0%), while infliximab has the smallest proportion of females
(60.8%). For all the other 3 TNF inhibitors, females constituted more than 70% of
the sample. The result of chi-square test suggested a significant difference in the
proportions of gender between different TNF inhibitors (p-value<0.001).
The mean weight in our study sample was 163.4 lbs. (SD=48.2), with the
first quartile being 129.8 lbs. and the third quartile being 189.2 lbs. Cases on
golimumab had the lowest mean weight of 148.2 lbs. (SD=41.9) and cases on
etanercept had the highest mean weight of 165.6 lbs. (SD=52.5). A statistically
significant difference was also observed in the mean weight for different TNF
inhibitors (p-value<0.001).

86
We calculated the time period between primary suspect therapy start date
and the date when adverse event began, after checking the accuracy and
completeness of dates. The median of time to onset of event was 160 days in the
total sample. However, the data was quite skewed for the whole sample and also
for each TNF inhibitor. Cases related to etanercept was found to have the
longest median time to onset of infection event (214 days), which was 3 months
longer compared to cases related to adalimumab (median=122 days). Etanercept
also had the largest number for its third quartile (879 days), which was almost
twice as many as that for adalimumab group and golimumab group. The result of
t-test indicated a significant difference in the time to onset of event between
different TNF inhibitor groups (p-value<0.001).

87
Table 17 Demographic Characteristics and Time to Onset of Event of the Study Sample in FAERS
*P-value from ANOVA or chi-square tests; Total number of females and males may not add up to the total number of cases for all/each TNF
inhibitor due to missing values.
All
(n=68,881)
Etanercept
(n=30,210)
Adalimumab
(n=26,784)
Infliximab
(n=6,677)
Certolizumab pegol
(n=3,874)
Golimumab
(n=1,336)
p-value
Age (Years)
Mean (SD)
51.9 (15.4)
53.4 (14.0)
51.3 (15.5)
48.5 (19.2)
49.1 (16.0)
56.5 (14.5)
<0.001
Q1 (25%) 43 46 41 34 37 48
Q2 (50%) 54 55 53 52 51 59
Q3 (75%) 63 63 63 64 61 67
NA 18020 (26.2%) 8600 (28.5%) 6991 (26.1%) 1077 (16.1%) 1009 (26.0%) 343 (25.7%)
Gender
Female
47777 (63.4%)
20869 (69.1%)
19083 (71.2%)
4014 (60.1%)
2829 (73.1%)
982 (74.3%)
<0.001
Male 18319 (26.6%) 6940 (23.0%) 7438 (27.8%) 2587 (38.8%) 1015 (26.2%) 339 (25.7%)
NA 2785 (4.0%) 2401 (7.9%) 263 (1.0%) 76 (1.1%) 30 (0.7%) 15 (1.1%)
Weight (lbs.)
Mean (SD)
163.4 (48.2)
165.6 (52.5)
165.8 (46.7)
157.6 (48.8)
160.1 (50.0)
148.2 (41.9)
<0.001
Q1 (25%) 129.8 132 132 125.4 125.4 116.6
Q2 (50%) 157 162.8 160 151.8 151.8 143
Q3 (75%) 189.2 195.8 191.4 184.8 184.8 174.9
NA 46937 (68.1%) (90.7%) 13972 (52.2%) 2608 (39.1%) 2168 (55.9%) 780 (58.4%)
Time to onset of
event
Mean (SD)
466.3 (690.5)
598.5 (821.2)
343.1 (514.3)
526.3 (752.3)
295.1 (400.9)
299.1 (376.9)
<0.001
Q1 (25%) 31 32 26 39 42 31
Q2 (50%) 160 214 122 197 153 149
Q3 (75%) 611 879 435 690.5 365 441

88
Table 18 shows the distribution of primary suspect TNF inhibitors by
disease condition. Overall, rheumatoid arthritis was the most common condition
for all TNF inhibitor groups (49.7%), followed by Crohn’s disease (14.5%) and
Psoriasis (12.9%). Hidradenitis Suppurativa was the least common condition
identified across all TNF inhibitor groups and was only 0.06% of our study
sample. The distribution was overall consistent with the labeled indications for
each TNF inhibitor (see Table 1 for labeled indications). For example, according
to the labeling information, only etanercept and adalimumab have been approved
for juvenile idiopathic arthritis, which was reflected in the distribution table as
well. Etanercept and adalimumab compromised 93.2% of all cases related to
juvenile idiopathic arthritis. Although all TNF inhibitors have been approved for
treatment of rheumatoid arthritis, psoriatic arthritis and ankylosing spondylitis,
etanercept was the most common primary suspect drug.

89
Table 18 Distribution of Primary Suspect Cases in FAERS by FDA-Approved Indication and TNF Inhibitor
All Etanercept Adalimumab Infliximab Certolizumab
pegol
Golimumab
Rheumatoid
Arthritis
34267 17439 (58.6%) 12239 (46.4%) 2332 (41.4%) 1452 (44.7%) 805 (70.6%)
Juvenile Idiopathic
Arthritis
775 539 (1.8%) 183 (0.7%) 33 (0.6%) 9 (0.3%) 11 (1. 0%)
Psoriatic Arthritis 7319 4633 (15.6%) 2301 (8.7%) 226 (4.0%) 41 (1.3%) 118 (10.4%)
Crohn's Disease 9965 6 (0.0 %) 6295 (23.9%) 1982 (35.0%) 1675 (51.6%) 7 (0.6%)
Ulcerative Colitis 1400 2 (0.0 %) 798 (3.0%) 555 (9.8%) 10 (0.3%) 35 (3.1%)
Psoriasis 8906 5378 (18.1%) 3313 (12.6%) 197 (3.5%) 7 (0.2%) 11 (1.0%)
Hidradenitis
Suppurativa
44 4 (0.0 %) 30 (0.1%) 10 (0.2%) 0 (0.0%) 0 (0.0%)
Uveitis 65 3 (0.0 %) 46 (0.2%) 13 (0.2%) 2 (0.1%) 1 (0.1%)
Ankylosing
Spondylitis
3437 1755 (5.9%) 1160 (4.4%) 320 (5.6%) 50 (1.5%) 152 (13.3%)
Total 66178 30210 26784 6677 3874 1336
*A patient may have multiple indications.

90
Table 19 presents the distribution of primary suspect TNF inhibitor by case
outcome of interest reported in the FAERS database. We observed a significant
difference between TNF inhibitor groups for all three types of outcomes studied
(p-value<0.001). Adalimumab was associated with the highest number of death
cases and also the highest proportion of death cases (n=1,366, 11.1%), followed
by infliximab (n=611, 9.7%) and etanercept (n=788, 6.6%). Golimumab had the
smallest number of death cases (n=45, 3.4%) and certolizumab had the lowest
proportion of death cases (n=86, 3.2%).
The number of cases with a life-threatening outcome by TNF inhibitor
(after excluding death cases) is also presented in Table 19. Adalimumab was
associated with the highest number of cases with life-threatening outcomes
(n=417), followed by infliximab (n=340) and etanercept (n=313). However,
infliximab had the highest proportion of life-threatening cases (6.0%), followed by
adalimumab (3.8%) and etanercept (2.8%). Golimumab had the smallest number
of life-threatening cases (n=22) but certolizumab pegol had the lowest proportion
(n=82, 1.7% (1.73% vs. 1.74% for golimumab)).
Distribution of cases with an outcome of hospitalization was also
examined from each TNF inhibitor, after excluding death and life-threatening
cases (Table 19). Adalimumab had the highest number of cases with an outcome
of hospitalization (n=7,802), followed by etanercept (n=6,221) and infliximab
(n=3,300). Adalimumab also had the largest proportion of hospitalization cases
(74.4%), followed by infliximab (61.5%) and etanercept (57.4%). Golimumab had

91
the smallest number and smallest proportion of hospitalization cases (n=567,
45.5%).
Table 20 presents the distribution of primary suspect TNF inhibitor by case
outcomes of interest reported in the FAERS database after excluding
observations with a missing value in any of our covariates for multiple logistic
regressions. We observed a significant difference between TNF inhibitor groups
for all three types of outcomes studied (p-value<0.001). Etanercept was
associated with the highest number of death cases and also the highest
proportion of death cases (n=106, 9.4%), followed by adalimumab (n=373, 9.1%)
and infliximab (n=168, 6.5%). Golimumab had the smallest number of death
cases (n=11, 3.4%) and certolizumab had the lowest proportion of death cases
(n=23, 2.3%).
Adalimumab was associated with the highest number of cases with life-
threatening outcomes (n=163), followed by infliximab (n=155) and etanercept
(n=102). However, etanercept had the highest proportion of life-threatening
cases (10.0%), followed by infliximab (6.4%) and adalimumab (4.3%).
Golimumab had the smallest number of life-threatening cases the lowest
proportion (n=6, 1.9%). Adalimumab had the highest number of cases with an
outcome of hospitalization the largest proportion of hospitalization cases
(n=2,715, 75.7%), followed by infliximab (n=1,448, 63.7%) and certolizumab
pegol (n=662, 68.1%). Golimumab had the smallest number of hospitalization
cases (n=192, 61.9%).
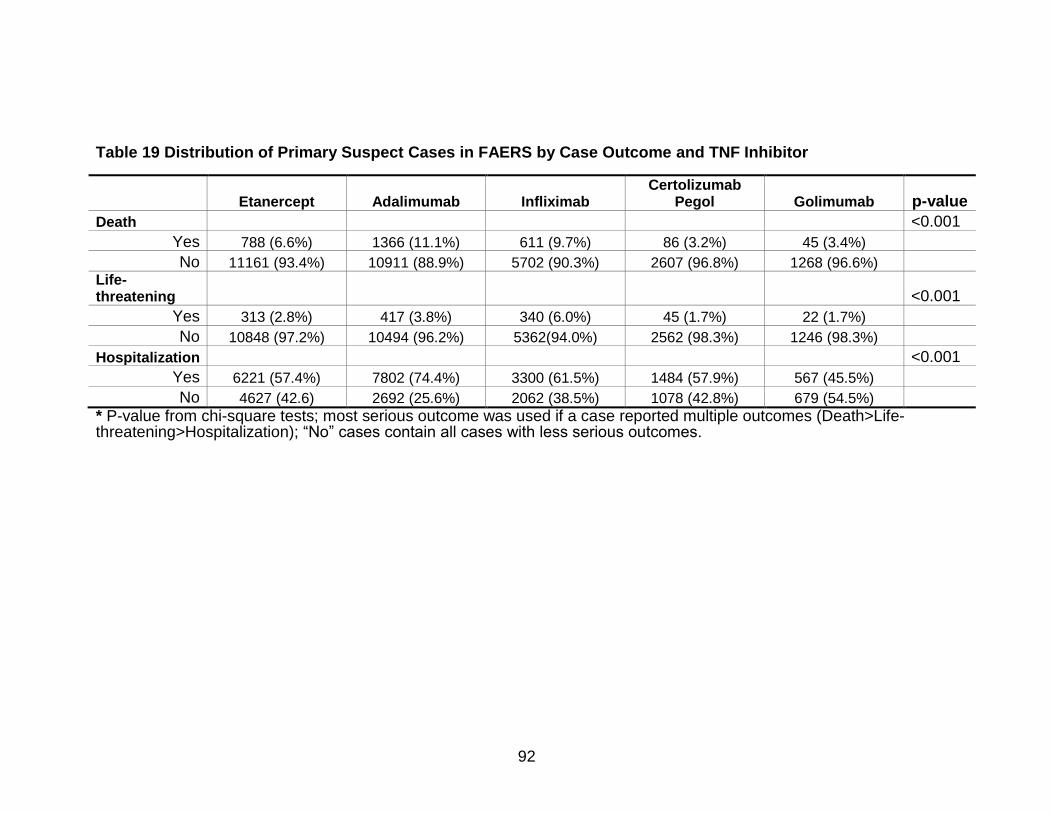
92
Table 19 Distribution of Primary Suspect Cases in FAERS by Case Outcome and TNF Inhibitor
Etanercept Adalimumab Infliximab
Certolizumab Pegol Golimumab p-value
Death <0.001
Yes 788 (6.6%) 1366 (11.1%) 611 (9.7%) 86 (3.2%) 45 (3.4%) No 11161 (93.4%) 10911 (88.9%) 5702 (90.3%) 2607 (96.8%) 1268 (96.6%) Life-
threatening <0.001
Yes 313 (2.8%) 417 (3.8%) 340 (6.0%) 45 (1.7%) 22 (1.7%) No 10848 (97.2%) 10494 (96.2%) 5362(94.0%) 2562 (98.3%) 1246 (98.3%)
Hospitalization <0.001
Yes 6221 (57.4%) 7802 (74.4%) 3300 (61.5%) 1484 (57.9%) 567 (45.5%) No 4627 (42.6) 2692 (25.6%) 2062 (38.5%) 1078 (42.8%) 679 (54.5%) * P-value from chi-square tests; most serious outcome was used if a case reported multiple outcomes (Death>Life-
threatening>Hospitalization); “No” cases contain all cases with less serious outcomes.

93
Table 20 Distribution of Primary Suspect Cases in FAERS by Case Outcome and TNF Inhibitor (After Excluding Cases with Missing Values in Covariates for Multiple Logistic Regression)
Etanercept Adalimumab Infliximab
Certolizumab Pegol Golimumab p-value
Death <0.001
Yes 106 (9.4%) 373 (9.1%) 168 (6.5%) 23 (2.3%) 11 (3.4%) No 1020 (90.6%) 3748 (90.9%) 2428 (93.5%) 994 (97.7%) 316 (96.6%) Life-
threatening <0.001
Yes 102 (10.0%) 163 (4.3%) 155 (6.4%) 22 (2.2%) 6 (1.9%) No 918 (90.0%) 3585 (95.7%) 2273(93.6%) 972 (97.8%) 310 (98.1%)
Hospitalization <0.001
Yes 567 (61.8%) 2715 (75.7%) 1448 (63.7%) 662 (68.1%) 192 (61.9%) No 351 (38.2%) 870 (24.3%) 825 (36.3%) 310 (31.9%) 118 (38.1%) * P-value from chi-square tests; most serious outcome was used if a case reported multiple outcomes (Death>Life-
threatening>Hospitalization); “No” cases contain all cases with less serious outcome

94
Results of Multiple Logistic Regressions
Multiple Logistic Regression 1 (Outcome=Death)
The results of the multiple logistic regression on the association between
case outcome death and predictors (TNF inhibitors, demographics and time to
onset of event) are presented in Table 21. Compared to the reference TNF
inhibitor group (etanercept), the odds of death was 0.251 with a p-value <0.001 in
the certolizumab pegol group, which indicated a significant difference in the
probability of death cases between certolizumab pegol group and etanercept
group. A significant difference was also observed for the golimumab group. The
odds of death was 0.282 with a p-value <0.001 in the golimumab group,
compared to the etanercept group.
The logistic regression results also showed that there was a statistically
significant difference in the odds of death between males and females. The odds
of death in males was 1.499 times that in females with a p-value <0.001. Older
age seemed to be associated with a higher odds of death, but the effect was very
minimal (OR=1.048, p<0.001). With every unit (lbs.) increase in weight, the odds
of death was 0.993, which was almost 1.0, meaning there is no difference as one
unit change in weight (although the p-value is <0.001). No difference was
observed in the odds of death as one-day change in time-to-onset of infection
event (OR=1, p=0.304).

95
Table 21 Results of Multiple Logistic Regression 1 (n=9,187, Outcome=Death)
Odds Ratio 95% CI P-value
Intercept 0.017 (0.010, 0.028) <0.001
TNF Inhibitors
Etanercept Ref. - -
Adalimumab 1.023 (0.811, 1.291) 0.846
Infliximab 0.818 (0.630, 1.061) 0.130 Certolizumab
Pegol 0.251 (0.158, 0.401) <0.001
Golimumab 0.282 (0.148, 0.536) <0.001
Age (Years) 1.048 (1.042, 1.054) <0.001
Gender
Female Ref. - -
Male 1.460 (1.229, 1.743) <0.001
Weight (lbs.) 0.993 (0.991, 0.995) <0.001 Time to onset of event (Days) 1.000 (0.999, 1.000) 0.304
Pseudo R2=0.089

96
Multiple Logistic Regression 2 (Outcome=Life-Threatening, Excluding
Death Cases)
The results of the multiple logistic regression on the association between
life-threatening outcomes and predictors (TNF inhibitors, demographics and time
to onset of event) are presented in Table 22. Compared to the reference TNF
inhibitor group (etanercept), all other TNF inhibitors were associated with less
severe outcomes. The odds of a life-threatening event (excluding death) was
0.404 with a p-value less than 0.001 in the adalimumab group, which indicated a
significant difference in the probability of life-threatening cases between
adalimumab group and etanercept group. Significant differences were also
observed for the infliximab, certolizumab pegol and golimumab groups when
comparing to the etanercept group (infliximab vs. etanercept: OR=0.620,
p<0.001; certolizumab pegol vs. etanercept: OR=0.204, p<0.001; golimumab vs.
etanercept: OR=0.155, p<0.001).
The logistic regression results also showed that there was a statistically
significant difference in the odds of life-threatening cases between males and
females. The odds of having a case with a life-threatening outcome was 1.775
with a p-value less than 0.001 in males when comparing that to females. Older
age had a greater odds of death, but such difference was not clinically important
in practice settings (OR=1.012, p<0.001). With every unit (lbs.) increase in
weight, the odds of having a life-threating outcome was 0.996, which was also
not very clinically meaningful, although the p-value is less than 0.001. A
statistically significant difference was observed in the odds of having a life-
97
threatening outcome as one-day change in time-to-onset of infection event,
although the odds ratio approached 1.0 (OR=0.999, p=0.021).

98
Table 22 Results of Multiple Logistic Regression 2 (n=8,506, Outcome=Life-Threatening)
Odds Ratio 95% CI P-value
Intercept 0.102 (0.064, 0.163) <0.001
TNF Inhibitors
Etanercept Ref. - -
Adalimumab 0.404 (0.312, 0.524) <0.001
Infliximab 0.620 (0.475, 0.810) <0.001 Certolizumab
Pegol 0.204 (0.127, 0.328) <0.001
Golimumab 0.155 (0.067, 0.358) <0.001
Age (Years) 1.012 (1.007, 1.018) <0.001
Gender
Female Ref. - -
Male 1.775 (1.453, 2.168) <0.001
Weight (lbs.) 0.996 (0.994, 0.998) <0.001 Time to onset of event (Days) 0.999 (0.999, 1.000) 0.021
Pseudo R2=0.039

99
Multiple Logistic Regression 3 (Outcome=Death or Life-threatening)
The results of the multiple logistic regression on the association between
cases with either death or a life-threatening outcome and predictors (TNF
inhibitors, demographics and time-to-onset of event) are presented in Table 23.
Compared to the reference TNF inhibitor group (etanercept), all other TNF
inhibitors were associated with less severe outcomes. The odds of death/life-
threatening outcome was 0.676 with a p-value less than 0.001 in the adalimumab
group, which indicated a significant difference in the probability of death/life-
threatening cases between adalimumab group and etanercept group. Significant
differences were also observed for the infliximab, certolizumab pegol and
golimumab groups when comparing to the etanercept group (infliximab vs.
etanercept: OR=0.713, p=0.001; certolizumab pegol vs. etanercept: OR=0.219,
p<0.001; golimumab vs. etanercept: OR=0.206, p<0.001).
The logistic regression results also showed that there was a statistically
significant difference in the odds of death/life-threatening outcome between
males and females. The odds of having a case with an outcome being death or
life-threatening was 1.632 with a p-value less than 0.001 in males when
comparing to that of females. Older age seemed to have a greater odds of
death/life-threatening outcome, but the effect was also negligible (OR=1.032,
p<0.001). With every unit (lbs.) increase in weight, the odds of having a
death/life-threating outcome was 0.994 (p-value<0.001). No statistically
significant difference was observed in the odds of having a death/life-threatening

100
outcome as one-day change in time-to-onset of infection event (OR=1.0,
p=0.623).

101
Table 23 Results of Multiple Logistic Regression 3 (n=9,187, Outcome=Death or Life-Threatening)
Odds Ratio 95% CI P-value
Intercept 0.089 (0.063 0.127) <0.001
TNF Inhibitors
Etanercept Ref. - -
Adalimumab 0.676 (0.565, 0.809) <0.001
Infliximab 0.713 (0.586, 0.868) 0.001 Certolizumab
Pegol 0.219 (0.156, 0.307) <0.001
Golimumab 0.206 (0.123, 0.346) <0.001
Age (Years) 1.032 (1.028, 1.036) <0.001
Gender
Female Ref. - -
Male 1.632 (1.425, 1.869) <0.001
Weight (lbs.) 0.994 (0.992, 0.995) <0.001 Time to onset of event (Days) 1.000 (0.999, 1.000) 0.623
Pseudo R2=0.064
102
Multiple Logistic Regression 4 (Outcome=Hospitalization, Excluding Death
and Life-Threatening Cases)
The results of the multiple logistic regression on the association between
the outcome hospitalization and predictors (TNF inhibitors, demographics and
time to onset of event) are presented in Table 24. Compared to the reference
TNF inhibitor group (etanercept), the odds of hospitalization was 1.925 with a p-
value less than 0.001 in the adalimumab group, which indicated a significant
difference in the odds of having an outcome of hospitalization between
adalimumab group and etanercept group. A significant difference was also
observed for the certolizumab pegol group. The odds of hospitalization was
1.341 with a p-value of 0.003 in the certolizumab pegol group, compared to the
etanercept group.
The logistic regression results also showed that there was a statistically
significant difference in the odds of hospitalization between males and females.
The odds of having a case with an outcome being hospitalization was 1.634 with
a p-value less than 0.001 in males when comparing that to females. With every
unit (lbs.) increase in weight, the odds of having a hospitalization case was 0.996
(p-value<0.001). No statistical significant difference was observed in the odds of
having a hospitalization case with one-year change in age (OR=1, p=0.877) or
one-day change in time-to-onset of infection event (OR=1, p=0.784).

103
Table 24 Results of Multiple Logistic Regression 4 (n=8,058, Outcome=Hospitalization)
Odds Ratio 95% CI P-value
Intercept 2.607 (2.038, 3.335) <0.001
TNF Inhibitors
Etanercept Ref. - -
Adalimumab 1.925 (1.649, 2.248) <0.001
Infliximab 0.998 (0.849, 1.173) 0.976 Certolizumab
Pegol 1.341 (1.106, 1.625) 0.003
Golimumab 0.976 (0.746, 1.277) 0.861
Age (Years) 1.000 (0.997, 1.003) 0.877
Gender
Female Ref. - -
Male 1.634 (1.466, 1.821) <0.001
Weight (lbs.) 0.996 (0.995, 0.997) <0.001 Time to onset of event (Days) 1.000 (0.999, 1.000) 0.784
Pseudo R2=0.024

104
Time to Onset of Event Analysis
The Kaplan-Meier estimates (unadjusted) of survivor function of time to
infection event reported in FAERS for the five TNF inhibitors are presented in
Figure 4. We observed that cases related to etanercept had an overall longest
time before an infection event occurred and the highest survival rate, followed by
infliximab and adalimumab. The Kaplan-Meier curves for certolizumab pegol and
golimumab cases were very close with golimumab having a better survival rate
between 200 and 800 days and certolizumab pegol having a slightly better
survival rate after 800 days. However, both certolizumab pegol and golimumab
had the lowest survival rates compared to the other three TNF inhibitors.
The results of the log-rank test are displayed in Table 25. The p-value of
the log-rank test was less than 0.001, which indicated that there is a statistically
significant difference in survival between different TNF inhibitors. By comparing
the number of observed events to the number of expected events, we can see
that the etanercept and infliximab had fewer events than expected events,
suggesting better survival probabilities than adalimumab, certolizumab pegol and
golimumab.
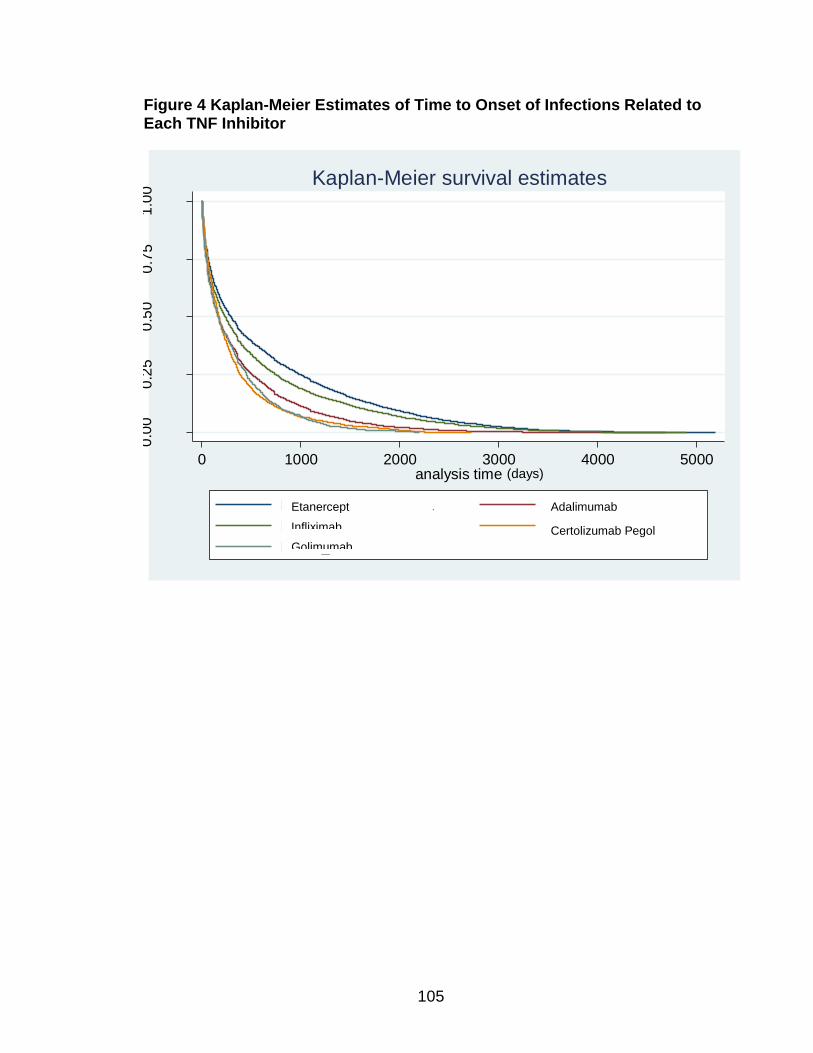
105
Figure 4 Kaplan-Meier Estimates of Time to Onset of Infections Related to Each TNF Inhibitor
0.0
00
.25
0.5
00
.75
1.0
0
0 1000 2000 3000 4000 5000analysis time
BNPS_calc = ENBREL BNPS_calc = HUMIRA
BNPS_calc = REMICADE BNPS_calc = CIMZIA
BNPS_calc = SIMPONI
Kaplan-Meier survival estimates
Etanercept
Infliximab
Golimumab
Adalimumab
Certolizumab Pegol
(days)

106
Table 25 Results of Log Rank Test
Events Observed Events Expected
TNF Inhibitors
Etanercept 17926 21505.55
Adalimumab 17222 14139.26
Infliximab 4503 4767.53
Certolizumab Pegol 2210 1638.23
Golimumab 701 511.43
Total 42562 42562.00
Chi2 (4) = 1629.32 Pr>Chi2 = 0.0000

107
Table 26 Summary of Results for Each Specific Aim
Specific Aims Results
Specific Aim 1 FAERS provided timelier evidence; differences were observed in terms of duplicated reports; incompleteness and inaccuracy exist in FAERS while it was not possible to assess in observational studies.
Specific Aim 2 FAERS rendered the greatest number and level of specificity of reported TNF inhibitor related infections; FAERS > ClinicalTrials.gov > Literature
Specific Aim 3 Moderate consistency was observed, especially between FAERS and ClinicalTrials.gov
Specific Aim 4 Multiple logistic regressions and time to onset of event analysis were applicable with FAERS data

108
CHAPTER FIVE: DISCUSSION
This chapter presents the discussion regarding the study results and our
recommendations for future research on adverse events. The chapter begins
with discussions of the results from analyses with respect to each of the study
aims, followed the limitations in our study design. Lastly, we provide our
recommendations for future research in our conclusions, along with the strengths
of our study.
Features of FAERS and Observational Data
FAERS data and observational data (either from the literature or from
ClinicalTrials.gov) demonstrated considerable differences in the method of
extracting data, summarizing data and assessing data. Due to the spontaneous
nature of FAERS, it provides many more adverse event terms and terms of
higher specificity. Individual patient level data in FAERS also allow for additional
analyses. Published articles usually serve as a venue for researchers to present
their findings, convey their opinions and provide a direction for further research,
thus they often do not present complete or detailed information on the data
collected for individuals. ClinicalTrials.gov, compared to the literature, rendered
much more detailed information on adverse events as safety information is a
mandatory element to report for registered studies, although data are still not at
the individual patient level. However, it is important to have comparable data

109
from each source for the most efficient data synthesis of information regarding
adverse events. By using standardized terminology (such as MedDRA®
terminology) and reporting specific adverse event terms (such as preferred terms
in MedDRA®) in publications and records for registered studies, it would be more
efficient to extract and compare data regarding adverse events from all data
sources.
Issues of FAERS and Observational Studies Data
The difference in the number of publications between observational
studies and studies using FAERS data was very significant in our summaries.
Only 6 studies identified in PubMed reported TNF inhibitor related infections
using FAERS. The initial search for any study on any TNF inhibitor using FAERS
data also generated a limited number of articles (n=38), compared to 225 articles
from the initial search for observational studies. This may reflect researcher’s
lack of awareness about the ability to use FAERS data or potential concerns that
researchers may have with FAERS data.
FAERS data indeed are subject to several issues as we examined in our
study, such as incompleteness and inaccuracy, which is an inherent issue from
the special data collecting process used in FAERS. We examined the amount of
missing values for cases’ demographics and our findings on the completeness of
demographics are consistent with the findings by Getz et al., however, the
missing rates of dates are lower than the rates reported in their article.92
Duplicated cases are another issue with FAERS or other spontaneous reporting

110
system. However, this issue may be addressed and solved through filtering
process with the help of open source technologies.220 Duplicated cohorts also
exist in publications of observational studies. We identified a few publications in
PubMed on the same study and a few registered studies on ClinicalTrials.gov
that shared the same study cohort as well. Such issues need to be considered
and examined carefully when conducting systematic reviews or meta-analysis.
Despite the issues with the quality of the FAERS data, we found that
FAERS provided more timely evidence compared with observational studies.
Although the assessment of timeliness of FAERS was based on only 6 articles
identified in PubMed, both the range and the median of the publication dates
suggest that FAERS may provide preliminary evidence on adverse events almost
4 years earlier than observational studies (range: 2001-2013 vs. 2005-2016;
median: 2007 vs. 2012). Findings from studies using FAERS could potentially be
reported in an even timelier manner as awareness and utilization of FAERS
increases.
Number and Specific Level of Infection Terms Identified
In this study, we identified a total of 824 preferred terms related to
infection for adalimumab, 798 preferred terms for infliximab, 788 preferred terms
for etanercept, 423 preferred terms for certolizumab and 399 preferred terms for
golimumab in FAERS. The number was on average 8 times more than that from
ClinicalTrial.gov and 35 times more than that from the literature. FAERS

111
demonstrated its usefulness in identifying more types of and more on specific
infections.
Compared to the literature, ClinicalTrials.gov, as another source of
observational data, provided more detailed information on adverse event cases
as an adverse event profile is a mandatory requirement for registered studies
and often times the events are recorded in a more standardized manner (such as
MedDRA® terminology). Comparisons of the reported infection cases for the
same study between the literature and its record in ClinicalTrials.gov
demonstrated that ClinicalTrials.gov could be a better data source to extract data
on adverse events if specific adverse event terms were desired. It was out of our
expectation that only 5 studies overlapped between studies from
ClinicalTrials.gov and articles included in our review. Most of the registered
studies in ClinicalTrials.gov did not publish their findings. Adverse events profiles
from published observational studies could be potential supplementary materials
to information extracted from ClinicalTrials.gov.
Of note, even among the preferred terms in FAERS data, which are of
relatively high level of specificity, there still are terms that are more general and
terms that are more specific. This issue also exists among observational studies.
As healthcare professionals have different ways to record medical information
and often times they need to make a judgment in a short period of time, the level
of detail of the report or reported adverse event terms may largely vary. This
issue reflects a lack of standardization in recording and reporting adverse events,

112
which poses potential difficulty for the most efficient data extraction and safety
assessment.
Only 7 out of 52 (13.5%) observational studies that were identified from
ClinicalTrials.gov were found to have been published. This percentage is much
lower compared to the finding from Ross and colleagues on US National
Institutes of Health (NIH) funded clinical trials.221 The authors conducted a cross-
sectional analysis to describe the publication patterns of clinical trials funded by
NIH and registered on ClinicalTrials.gov. They identified 635 NIH funded clinical
trials which were registered on or after September 13th, 2005 and were
completed as of December 31st, 2008. These studies were then searched for
publication in Medline and 68% of these studies were found to have been
published. One explanation for the low publication rate of observational studies
identified in our study is that most of the studies were funded by pharmaceutical
companies rather than NIH. Funding source could be a factor influencing
publication of research results and non-commercial funded studies were more
likely to be published.222,223 Publication bias could be another explanation for the
low publication rate, however, a study found that publication bias more likely
originates with investigators instead of journal editors.222 Further investigation on
the low rate of publication of observational studies identified in our study is
needed as timely and informed decisions require public dissemination of
research results and unbiased reporting of study outcomes. Share of research
evidence prevents redundant efforts and is a commitment to the use of our
limited medical and financial resources.

113
The difference observed in our study in the reporting of infections between
ClinicalTrials.gov and the published paper on the same study suggested a
disconnect in the reporting of adverse events between study profiles and
publications. According to the FDA’s Guideline for Industry on the Structure and
Content of Clinical Study Reports, it is required for investigators to report all
adverse events for each patient in both preferred term and the reported term
(original term used by investigator) as well as the rate for each observed adverse
event. However, it is rare to find a published article that provides a list of all
specific adverse events or reports adverse events using preferred terms. Such
disconnect between clinical trial archived data and published data impedes
efficient data synthesis and examination of adverse events and keeps the public
from getting comprehensive and transparent information from studies, which is
contradictory to the purpose of making informed decisions. Thus, we recommend
the use of a standardized terminology system of adverse events (e.g. MedDRA®)
as well as a full report on observed adverse events along with the publication of
study results in any journal.
Effects of Difference in Approval Dates and Market Share on Our Summary
Results
In this study, we identified a total of 163,789 primary suspect cases of
infections and infestations in the FAERS database for all TNF inhibitors (Table 5
& 6). Etanercept had the largest number of cases (n=68,807), which accounted
for 42% of our total cases, while golimumab had the smallest number of cases
(n=4,884), accounting for 3%. Etanercept (Enbrel®), adalimumab (Humira®) and

114
infliximab (Remicade®), which were the first three TNF inhibitors approved in the
US, together accounted for 92.8% of our total cases. Certolizumab pegol
(Cimzia®) and golimumab (Simponi®), which are the most recently approved
TNF inhibitors (approval date: 4/22/2008 and 4/24/2009), accounted for only
7.2% of our cases of infections and infestations data. It was not unexpected that
etanercept, adalimumab and infliximab were related to a higher number of cases
as they were approved prior to the other two TNF inhibitors by almost a decade.
Additionally, these three earlier approved TNF inhibitors have been used for the
treatment of more disease conditions than the other two. After examination of the
proportions of each TNF inhibitor related infection cases before 4/22/2008 (the
approval date of certolizumab) and after 4/22/2008, we observed some changes
in the proportions of earlier approved TNF inhibitors and a larger proportion of
certolizumab pegol and golimumab. The proportion of etanercept cases
decreased by 15% (although the number of cases was close to the number
before the cut-off date) and adalimumab cases increased by almost 10%,
representing a doubling of cases. This could be potentially explained by the
increased number of patients’ uptake of adalimumab a few years after it was
approved for multiple indications. The current sales and market shares of TNF
inhibitors also suggests the leading position of adalimumab, followed by
etanercept and infliximab.224,225 The large difference in the case numbers
between TNF inhibitors was directly associated with the difference in the number
of infection terms reported. The number of infection terms identified for
adalimumab in FAERS was over as twice as many as that for golimumab.

115
Imbalance in the number of identified observational studies and reported
infection terms was also evident. Only one observational study was identified for
certolizumab pegol with 4 reported infection terms and none for golimumab from
our literature review. Two studies were identified for certolizumab pegol 34
reported infection terms) and 1 study for golimumab (23 reported infection terms)
from ClinicalTrials.gov.
Consistency in the Most Commonly Reported Infections
Our study found that 20-40% of the most reported infections summarized
in the rankings matched between all three data sources. FAERS and
ClinicalTrials.gov rankings have a better consistency in the top reported
infections compared to either FAERS vs. literature or literature vs.
ClinicalTrials.gov. Respiratory infections accounted for the majority of the terms
listed in the ranking for all three data sources. The lack of consistency between
the literature vs. FAERS or literature vs. ClinicalTrials.gov was probably due to
the limited number of observational studies identified and the limited sample size
in individual observational study. The majority of the included articles only
reported serious infections or infections of their study’s interest, which led to the
underreporting of infection cases. FAERS and ClinicalTrials.gov require
standardized reporting using MedDRA terms, which helps with a more complete
safety profile.
The relative consistency between FAERS evidence and evidence from
observational studies registered on ClinicalTrials.gov shows that both data

116
source provide reliable evidence. It also indicates the utility of using FAERS data
as a primary source of examining drug associated adverse events and the
potential important role that ClinicalTrials.gov could play in tracking the safety
profile from observational studies.
Application of Additional Analyses
The individual patient level information for each adverse event case in
FAERS allows researchers to perform quantitative analyses identify potential risk
factors for different types of adverse events and different adverse event
outcomes. We performed logistic regression on the predictors of interest and
case outcomes (death, life-threatening outcome, hospitalization and other less
severe outcomes). Specific TNF inhibitor, gender and age were associated with
the case outcome in all of our logistic regression models. Certolizumab pegol and
golimumab, younger age and being female were found to be associated with less
severe event outcomes. However, the pseudo R-squared values for our
regression models were very small, varying from 0.024 to 0.089, which means a
limited model fit and that only 2.4% to 8.9% of the variation in the outcome could
be explained by our models. One important confounder that we did not include in
these models was the groups of infections based on the severity of infections. A
patient may have developed a serious infection such as pneumonia, which was
often associated with hospitalization or more sever outcome, while another
patient may have had rhinitis, which usually only requires medications. Such
variety in the severity of infections may have significant implications regarding
differences in case outcomes.

117
Of note, almost 90% of the included cases were eliminated in the multiple
logistic regressions due to missing values in the covariates, especially the weight
variable (Table17). Among all 5 TNF inhibitors, etanercept was the one with the
largest proportion and number of cases with missing values. Such large amount
of missing values in our data may have resulted in the odds ratios of having a
life-threatening outcome for TNF inhibitors not aligning with the distribution
shown in Table 19 but aligning with Table 20 where we presented the distribution
by outcome and TNF inhibitor after removing cases with any missing value in the
covariates. In Table 19, we observed that infliximab is associated with the largest
proportion of cases with a life-threatening outcome, however, after removing
cases with missing values in the covariates, etanercept became the one with the
largest proportion of cases with a life-threatening outcome (Table 20). The odds
ratios for TNF inhibitors from our second multiple logistic regression model
showed that etanercept is significantly associated with a life-threatening outcome
compared to other TNF inhibitors while controlling for covariates (Table 22). This
finding was more aligned with the distribution presented in Table 20. We
acknowledge the effect of elimination of cases with missing values as well as
adjustment of covariates.
We also conducted the time to onset of event analysis. We employed
survival analysis and plotted the Kaplan-Meier curves for all infection cases by
TNF inhibitor. A statistically significant difference in the survival rates was
observed between different TNF inhibitors (p<0.001). Etanercept and infliximab
had better survival rates. However, considering the approval dates of

118
certolizumab pegol and golimumab were almost a decade later than the approval
of infliximab, etanercept and adalimumab, our analysis might not be “unbiased”
to certolizumab pegol and golimumab, as cases related to these two TNF
inhibitors with long time to onset of event may have not even been reported yet in
FAERS data. Additionally, all cases were spontaneously reported when an
infection event occurred, which means all cases had an “event”. The survival
analysis conducted using FAERS data was not a typical survival analysis and
may not provide unbiased information. Log rank test was performed in our study
and a significant difference in the survival rates was observed between TNF
inhibitors, however, the log rank test was an overall test and could not provide
information on between which TNF inhibitors the significant difference existed.
Further analyses are needed to break down results to specific TNF inhibitors.
Besides, the survival rates obtained in our analysis were not adjusted for
determining factors such as demographic characteristics and infection types. The
results may differ if adjusted for potential confounders and etanercept and
infliximab may not be associated with better survival rates when comparing with
adalimumab, certolizumab pegol and golimumab.
Our study shows that it is feasible to perform advanced analyses with
FAERS data but the advanced methodology needs to be applied to adjust for the
limitations in FAERS database and unique features of spontaneously reported
information.

119
Limitations of our study
Our study results should be considered in light of several limitations. First,
we did not further check potential duplicate cases in the FAERS dataset.
Duplicate cases are very common in FAERS data, however, to our knowledge,
there is no standardized systematic way to check duplicate cases or control for
duplicate cases that can be performed by individual researchers. We were also
informed that all cases from the web platform where we retrieved our data have
been de-duplicated. Duplicate cases are often checked though individual detailed
objective review on available information in the case report, which is only feasible
if the data contained small number of cases. Our data set contained 167,389
infection cases and it was not feasible to check the details of all these cases. The
existence of duplicate cases may bias our ranking results of most frequently
reported infection terms, as well as the results of our additional analyses.
However, based on our previous experience, the issue of duplicate cases exists
regardless of the drug or the type of adverse events, thus its effect may have
balanced out across all infection terms and TNF inhibitors.
The second limitation of our study exists in process of data extraction and
synthesis. The literature review results are subject to the reviewer’s knowledge
and judgment. Other eligible studies may have not been included in our literature
review and data synthesis. This limitation also applies to results based on the
observational studies identified from ClinicalTrials.gov.

120
The third limitation in our study is that we did not examine the difference
between the most commonly reported infections for TNF inhibitors between
patients with different indications, as the mechanism of TNF inhibitor related
infections may differ between patients with different conditions.226 However, due
to the limited number of observational studies identified in either literature or
ClinicalTrials.gov, we had limited number of reported infection cases, among
which the majority were on patients with the most common indications, such as
rheumatoid arthritis, Crohn’s disease and psoriasis. The sample size would be
too small for us to generate meaningful summaries and rankings if we further
divide our analysis by disease condition. We did not identify any observational
studies in which the participants were with hidradenitis Suppurativa, due to the
limited number of cases with this condition.
Besides controlling for different indications, our study is also limited in that
we did not take into account the effect of different dosing, activity of disease,
patients’ previous experience with TNF inhibitors and concomitant drugs, which
are also important predictors for infections.226 Although in FAERS dataset,
information on the dosage of primary suspect drug was available, such
information was recorded verbatim (exactly the same as entered in the individual
report) and with a large proportion of missing values (70%).92 Information on
secondary suspect drug and concomitant drug was also available in FAERS,
however, given the large number of cases in FAERS, it was very challenging to
summarize all secondary suspect drugs and concomitant drugs.

121
Another limitation of our study is that in the logistic regression analyses
and time to onset of event analysis, we did not specify general infection types
(higher level than preferred terms). Firstly, different types of infections have
different etiology, which is also directly associated with infection outcome.
Secondly, different TNF inhibitors are also likely to be associated with different
types of infections or incidence of a certain infection type. The time to onset of
event also differ by infection type.
Our study did not examine the potential effect from stimulated reporting
associated with factors such as FDA boxed warnings. The FDA updated the
boxed warning in September 2007 on all TNF inhibitors regarding the risk of
infections from two bacteria: Legionella and Listeria.227 Stimulated reporting of
infection cases in FAERS associated with these two bacteria or even other
infection types could be possible after the boxed warning was issued. However,
we do not think that this boxed warning would have significant impact on the
reported number of cases of specific infections nor biased our study results
because (1) the information of the boxed warning was specific to two bacteria not
to infections, while preferred terms on infections are usually not specified by type
of bacteria, (2) multiple infections can be related to these two bacteria and this
boxed warning would not lead to an increase of the number of reported cases
with any particular infection and (3) even if the stimulated reported existed, the
effect would not have been pronounced in our data as the FDA boxed warning
was issued 10 years ago.

122
Strengths of Our Study
Our study provides valuable information and adds a unique contribution to
current knowledge on TNF inhibitors related infections and post-marketing
surveillance approaches on adverse events. To our knowledge, our study was
the first study that examined the consistency in the evidence from different post-
marketing surveillance approaches through systematic review and detailed
summaries.
Our study is also one of the few studies that employed FAERS data to
assess common infections related to TNF inhibitors. Despite the over two
decades’ existence of the FAERS database, few studies have been published on
the potential association between TNF inhibitors and infections using FAERS
data, which also indicates that FAERS has been underused by researchers. Our
study demonstrates the utility of FAERS in terms of providing specific level
information regarding adverse events and consistency in its evidence compared
to findings from observational studies.
Our study also assessed the feasibility of multiple logistic regression and
survival analyses using the individual level information in FAERS. Despite the
general issues with FAERS data, such as large amount of missing values, the
results from both analyses rendered interesting preliminary findings and suggest
the potential of employing additional statistical analyses to FAERS data.
The findings in our study provide support regarding the reliability and use
of FAERS data. We hope our findings would enhance the understanding of how

123
to use FAERS data, what to expect from FAERS data and what to take into
account when conducting data mining in FAERS.

124
Conclusion
These analyses demonstrated the beneficial attribute of FAERS to provide
specific infection terms regarding the amount and specific level of terms. Our
analyses also showed the usefulness of ClinicalTrials.gov, as one of the data
source of observational studies, of offering much detailed information on adverse
events compared to studies identified in the literature. Overall, the literature was
not an optimal source for extracting information regarding specific infections as it
contained much fewer reported terms and very limited studies on certain
indications and relative newly approved TNF inhibitors (certolizumab pegol and
golimumab).
Overall, the evidence of most commonly reported infections were
somewhat consistent between FAERS and observational studies. The evidence
was more similar between FAERS and ClinicalTrials.gov. Among the top ranked
(most frequently reported) infections, respiratory infections accounted for the
majority. Other frequently reported infections included urinary tract infection,
herpes zoster and abscess, etc.
The individual level information on each case in FAERS distinguished
itself from observational studies and allows for additional statistical analysis such
as regressions and survival analysis. It is feasible to perform such analyses but
advanced methodology may be needed to control for limitations inherent in the
FAERS data.

125
Researchers that are interested in drugs’ adverse events profile should
consider using FAERS as a primary source to identify adverse events if
specificity was desired. ClinicalTrial.gov could be a valuable resource for
obtaining evidence on adverse events from observational studies. Researchers
should always consider limitations of each data source. When using FAERS,
incompleteness and inaccuracy should be examined first. Underreporting issue
should be in mind when using data from either source.
Future studies should further examine the consistency of evidence on
most common infections related to TNF inhibitors when stratifying the cases by
indication. Multiple logistic regressions and time to onset of event analysis should
also be further stratified by indication as well as infection type. It would also be
interesting to examine the survival function between TNF inhibitors by year so
that we can control for the bias introduced by different approval dates of TNF
inhibitors and predict the occurrence of infections based on previous trends.

126
References
1. Hennessy S. Postmarketing drug surveillance: an epidemiologic approach. Clin Ther 1998;20:C32–9.
2. Pitts PJ, Louet HL, Moride Y, Conti RM. 21st century pharmacovigilance: efforts, roles, and responsibilities. Lancet Oncol 2016;17(11):e486–92.
3. The Importance of Pharmacovigilance - Safety Monitoring of Medicinal Products: Chapter 4 - Pharmacovigilance in Drug Regulation [Internet]. [cited 2016 Sep 29];Available from: http://apps.who.int/medicinedocs/en/d/Js4893e/5.html
4. CFR - Code of Federal Regulations Title 21 [Internet]. [cited 2016 Jun 19];Available from: http://www.accessdata.fda.gov/scripts/cdrh/cfdocs/cfcfr/CFRSearch.cfm?fr=312.32
5. Commissioner O of the. Reporting Serious Problems to FDA - What is a Serious Adverse Event? [Internet]. [cited 2016 Jun 17];Available from: http://www.fda.gov/safety/medwatch/howtoreport/ucm053087.htm
6. Beijer HJM, Blaey CJ de. Hospitalisations caused by adverse drug reactions (ADR): a meta-analysis of observational studies. Pharm World Sci 2002;24(2):46–54.
7. Chyka PA. How many deaths occur annually from adverse drug reactions in the united states? Am J Med 2000;109(2):122–30.
8. Lazarou J, Pomeranz BH, Corey PN. Incidence of adverse drug reactions in hospitalized patients: A meta-analysis of prospective studies. JAMA 1998;279(15):1200–5.
9. Wester K, Jönsson AK, Spigset O, Druid H, Hägg S. Incidence of fatal adverse drug reactions: a population based study. Br J Clin Pharmacol 2008;65(4):573–9.
10. Taché SV, Sönnichsen A, Ashcroft DM. Prevalence of Adverse Drug Events in Ambulatory Care: A Systematic Review. Ann Pharmacother 2011;45(7–8):977–89.
11. Sultana J, Cutroneo P, Trifirò G. Clinical and economic burden of adverse drug reactions. J Pharmacol Pharmacother 2013;4(5):73.

127
12. Berlin JA, Glasser SC, Ellenberg SS. Adverse Event Detection in Drug Development: Recommendations and Obligations Beyond Phase 3. Am J Public Health 2008;98(8):1366–71.
13. Strom BL, Kimmel SE, Hennessy S. Pharmacoepidemiology. John Wiley & Sons; 2012.
14. Waning B, Montagne M, McCloskey WW. Pharmacoepidemiology: Principles and Practice. McGraw-Hill; 2001.
15. Ahmad SR. Adverse Drug Event Monitoring at the Food and Drug Administration. J Gen Intern Med 2003;18(1):57–60.
16. Almenoff JS, DuMouchel W, Kindman LA, Yang X, Fram D. Disproportionality analysis using empirical Bayes data mining: a tool for the evaluation of drug interactions in the post-marketing setting. Pharmacoepidemiol Drug Saf 2003;12(6):517–21.
17. DuMouchel W. Bayesian Data Mining in Large Frequency Tables, with an Application to the FDA Spontaneous Reporting System. Am Stat 1999;53(3):177–90.
18. Committee on Ethical and Scientific Issues in Studying the Safety of Approved Drugs D, Practice B on PH and PH, Medicine I of. Ethical and Scientific Issues in Studying the Safety of Approved Drugs. National Academies Press; 2012.
19. Couig MP, Merkatz RB. MedWatch: the new medical products reporting program. Am J Nurs 1993;93(8):65–8.
20. Research C for DE and. FDA Adverse Events Reporting System (FAERS) - FDA Adverse Event Reporting System (FAERS) Statistics [Internet]. [cited 2016 Jun 19];Available from: http://www.fda.gov/Drugs/GuidanceComplianceRegulatoryInformation/Surveillance/AdverseDrugEffects/ucm070093.htm
21. Research C for DE and. FDA Adverse Events Reporting System (FAERS) - Reports Received and Reports Entered into FAERS by Year [Internet]. [cited 2016 Jun 19];Available from: http://www.fda.gov/Drugs/GuidanceComplianceRegulatoryInformation/Surveillance/AdverseDrugEffects/ucm070434.htm
22. Fong JJ, Sylvia L, Ruthazer R, Schumaker G, Kcomt M, Devlin JW. Predictors of mortality in patients with suspected propofol infusion syndrome. Crit Care Med 2008;36(8):2281–7.
23. Commissioner O of the. Data Mining at FDA - Data Mining at FDA -- White Paper [Internet]. [cited 2017 Mar 2];Available from:

128
https://www.fda.gov/ScienceResearch/DataMiningatFDA/ucm446239.htm#changepoint
24. Maignen F, Hauben M, Tsintis P. Modelling the time to onset of adverse reactions with parametric survival distributions: a potential approach to signal detection and evaluation. Drug Saf 2010;33(5):417–34.
25. Research C for DE and. Postmarket Drug Safety Information for Patients and Providers - Information on Tumor Necrosis Factor (TNF) Blockers (marketed as Remicade, Enbrel, Humira, Cimzia, and Simponi) [Internet]. [cited 2016 Jul 24];Available from: http://www.fda.gov/Drugs/DrugSafety/PostmarketDrugSafetyInformationforPatientsandProviders/ucm109340.htm
26. Singh JA, Saag KG, Bridges SL, et al. 2015 American College of Rheumatology Guideline for the Treatment of Rheumatoid Arthritis. Arthritis Care Res 2016;68(1):1–25.
27. Gartlehner G, Hansen RA, Jonas BL, Thieda P, Lohr KN. The comparative efficacy and safety of biologics for the treatment of rheumatoid arthritis: a systematic review and metaanalysis. J Rheumatol 2006;33(12):2398–408.
28. Albert DA. Are All Biologics the Same? Optimal Treatment Strategies for Patients With Early Rheumatoid Arthritis: Systematic Review and Indirect Pairwise Meta-Analysis. J Clin Rheumatol Pract Rep Rheum Musculoskelet Dis 2015;21(8):398–404.
29. Lee YH, Woo JH, Rho YH, Choi SJ, Ji JD, Song GG. Meta-analysis of the combination of TNF inhibitors plus MTX compared to MTX monotherapy, and the adjusted indirect comparison of TNF inhibitors in patients suffering from active rheumatoid arthritis. Rheumatol Int 2008;28(6):553–9.
30. Oussalah A, Danese S, Peyrin-Biroulet L. Efficacy of TNF antagonists beyond one year in adult and pediatric inflammatory bowel diseases: a systematic review. Curr Drug Targets 2010;11(2):156–75.
31. Ramiro S, Gaujoux-Viala C, Nam JL, et al. Safety of synthetic and biological DMARDs: a systematic literature review informing the 2013 update of the EULAR recommendations for management of rheumatoid arthritis. Ann Rheum Dis 2014;73(3):529–35.
32. Katikireddi VS, Whittle SL, Hill CL. Tumour necrosis factor inhibitors and risk of serious infection in rheumatoid arthritis. Int J Rheum Dis 2010;13(1):12–26.
33. Bongartz T, Sutton AJ, Sweeting MJ, Buchan I, Matteson EL, Montori V. Anti-TNF antibody therapy in rheumatoid arthritis and the risk of serious infections and malignancies: systematic review and meta-analysis of rare
129
harmful effects in randomized controlled trials. JAMA 2006;295(19):2275–85.
34. Scrivo R, Armignacco O. Tuberculosis risk and anti-tumour necrosis factor agents in rheumatoid arthritis: a critical appraisal of national registry data. Int J Rheum Dis 2014;17(7):716–24.
35. Dommasch ED, Abuabara K, Shin DB, Nguyen J, Troxel AB, Gelfand JM. The risk of infection and malignancy with tumor necrosis factor antagonists in adults with psoriatic disease: a systematic review and meta-analysis of randomized controlled trials. J Am Acad Dermatol 2011;64(6):1035–50.
36. Fouque-Aubert A, Jette-Paulin L, Combescure C, Basch A, Tebib J, Gossec L. Serious infections in patients with ankylosing spondylitis with and without TNF blockers: a systematic review and meta-analysis of randomised placebo-controlled trials. Ann Rheum Dis 2010;69(10):1756–61.
37. Nanau RM, Cohen LE, Neuman MG. Risk of infections of biological therapies with accent on inflammatory bowel disease. J Pharm Pharm Sci Publ Can Soc Pharm Sci Société Can Sci Pharm 2014;17(4):485–531.
38. Andersen NN, Jess T. Risk of infections associated with biological treatment in inflammatory bowel disease. World J Gastroenterol WJG 2014;20(43):16014–9.
39. Rahiman MA, van der Merwe BpE. Adverse effects and other issues with the use of anti-TNF therapy. SA Pharm J 2008;48.
40. Antoni C, Braun J. Side effects of anti-TNF therapy: current knowledge. Clin Exp Rheumatol 2002;20(6 Suppl 28):S152-157.
41. Kılıç E. The Reported Adverse Effects Related to Biological Agents Used for the Treatment of Rheumatic Diseases in Turkey. Turk J Rheumatol 2013;28(3):149–62.
42. Johnston B, Conly J. Tumour necrosis factor inhibitors and infection: What is there to know for infectious diseases physicians? Can J Infect Dis Med Microbiol 2006;17(4):209–12.
43. Ali T, Kaitha S, Mahmood S, Ftesi A, Stone J, Bronze MS. Clinical use of anti-TNF therapy and increased risk of infections. Drug Healthc Patient Saf 2013;5:79–99.
44. Kaplan G, Freedman VH. The role of cytokines in the immune response to tuberculosis. Res Immunol 1996;147(8):565–72.

130
45. Clay H, Volkman HE, Ramakrishnan L. TNF signaling mediates resistance to mycobacteria by inhibiting bacterial growth and macrophage death but not tuberculous granuloma formation. Immunity 2008;29(2):283–94.
46. Gardam MA, Keystone EC, Menzies R, et al. Anti-tumour necrosis factor agents and tuberculosis risk: mechanisms of action and clinical management. Lancet Infect Dis 2003;3(3):148–55.
47. Prevalence of Doctor-Diagnosed Arthritis and Arthritis-Attributable Activity Limitation — United States, 2010–2012 [Internet]. [cited 2016 Jun 20];Available from: http://www.cdc.gov/mmwr/preview/mmwrhtml/mm6244a1.htm
48. Estimates of the prevalence of arthritis and other rheumatic conditions in the United States: Part I - RheumatologyPrevalenceStatistics-one.pdf [Internet]. [cited 2016 Jun 20];Available from: http://www.rheumatology.org/Portals/0/Files/RheumatologyPrevalenceStatistics-one.pdf
49. Mj B. Social and economic impact of inflammatory arthritis. Postgrad Med 2006;Spec No:5–11.
50. CDC - Epidemiology of the IBD - Inflammatory Bowel Disease [Internet]. [cited 2016 Aug 5];Available from: http://www.cdc.gov/ibd/ibd-epidemiology.htm
51. Top 100 Drugs for 2013 by Sales - U.S. Pharmaceutical Statistics [Internet]. [cited 2016 Jun 20];Available from: https://www.drugs.com/stats/top100/2013/sales
52. Kawatkar AA, Jacobsen SJ, Levy GD, Medhekar SS, Venkatasubramaniam KV, Herrinton LJ. Direct medical expenditure associated with rheumatoid arthritis in a nationally representative sample from the medical expenditure panel survey. Arthritis Care Res 2012;64(11):1649–56.
53. Medicine I of. Adverse Drug Event Reporting: The Roles of Consumers and Health-Care Professionals: Workshop Summary [Internet]. 2007 [cited 2017 Apr 14]. Available from: https://www.nap.edu/catalog/11897/adverse-drug-event-reporting-the-roles-of-consumers-and-health
54. Lichtenstein GR, Hanauer SB, Sandborn WJ. Management of Crohn’s Disease in Adults. Am J Gastroenterol 2009;104(2):465–83.
55. Morgan CL, Emery P, Porter D, et al. Treatment of rheumatoid arthritis with etanercept with reference to disease-modifying anti-rheumatic drugs: long-term safety and survival using prospective, observational data. Rheumatol Oxf Engl 2014;53(1):186–94.

131
56. Kotak S, Mardekian J, Horowicz-Mehler N, et al. Impact of Etanercept Therapy on Disease Activity and Health-Related Quality of Life in Moderate Rheumatoid Arthritis Patients Population from a National British Observational Cohort. Value Health 2015;18(6):817–23.
57. Thorne C, Bensen WG, Choquette D, et al. Effectiveness and safety of infliximab in rheumatoid arthritis: analysis from a Canadian multicenter prospective observational registry. Arthritis Care Res 2014;66(8):1142–51.
58. Walters TD, Kim M-O, Denson LA, et al. Increased effectiveness of early therapy with anti-tumor necrosis factor-α vs an immunomodulator in children with Crohn’s disease. Gastroenterology 2014;146(2):383–91.
59. Echarri A, Ollero V, Barreiro-de Acosta M, et al. Clinical, biological, and endoscopic responses to adalimumab in antitumor necrosis factor-naive Crohn’s disease: predictors of efficacy in clinical practice. Eur J Gastroenterol Hepatol 2015;27(4):430–5.
60. Lindsay JO, Chipperfield R, Giles A, Wheeler C, Orchard T, The INDIGO study investigators. A UK retrospective observational study of clinical outcomes and healthcare resource utilisation of infliximab treatment in Crohn’s disease. Aliment Pharmacol Ther 2013;38(1):52–61.
61. de Vlam K, Boone C, The Prove Study Group A. Treatment adherence, efficacy, and safety of etanercept in patients with active psoriatic arthritis and peripheral involvement in Belgium for 66 months (PROVE study). Clin Exp Rheumatol 2015;33(5):624–31.
62. Escudero-Vilaplana V, Ramírez-Herráiz E, Alañón-Plaza E, et al. Efficiency of adalimumab, etanercept and infliximab in ankylosing spondylitis in clinical practice. Int J Clin Pharm 2015;37(5):808–14.
63. Listing J, Strangfeld A, Kary S, et al. Infections in patients with rheumatoid arthritis treated with biologic agents. Arthritis Rheum 2005;52(11):3403–12.
64. Askling J, Fored CM, Brandt L, et al. Time‐dependent increase in risk of hospitalisation with infection among Swedish RA patients treated with TNF antagonists. Ann Rheum Dis 2007;66(10):1339–44.
65. Ford AC, Peyrin-Biroulet L. Opportunistic Infections With Anti-Tumor Necrosis Factor-α Therapy in Inflammatory Bowel Disease: Meta-Analysis of Randomized Controlled Trials. Am J Gastroenterol 2013;108(8):1268–76.
66. van der Heijde D, Kivitz A, Schiff MH, et al. Efficacy and safety of adalimumab in patients with ankylosing spondylitis: Results of a multicenter, randomized, double-blind, placebo-controlled trial. Arthritis Rheum 2006;54(7):2136–46.

132
67. Peyrin–Biroulet L, Deltenre P, de Suray N, Branche J, Sandborn WJ, Colombel J. Efficacy and Safety of Tumor Necrosis Factor Antagonists in Crohn’s Disease: Meta-Analysis of Placebo-Controlled Trials. Clin Gastroenterol Hepatol 2008;6(6):644–53.
68. Lichtenstein GR, Feagan BG, Cohen RD, et al. Serious infection and mortality in patients with Crohn’s disease: more than 5 years of follow-up in the TREATTM registry. Am J Gastroenterol 2012;107(9):1409–22.
69. Goldman SA. Limitations and strengths of spontaneous reports data. Clin Ther 1998;20 Suppl C:C40-44.
70. Mann JM. FDA Adverse Event Reporting System: Recruiting Doctors to Make Surveillance a Little Less Passive. Food Drug Law J 2015;70(3):371–394, i.
71. Song JW, Chung KC. Observational Studies: Cohort and Case-Control Studies. Plast Reconstr Surg 2010;126(6):2234–42.
72. Pal SN, Duncombe C, Falzon D, Olsson S. WHO Strategy for Collecting Safety Data in Public Health Programmes: Complementing Spontaneous Reporting Systems. Drug Saf 2013;36(2):75–81.
73. Baciu A, Stratton K, Burke SP, others. The future of drug safety: promoting and protecting the health of the public [Internet]. National Academies Press; 2007 [cited 2016 Jun 26]. Available from: https://books.google.com/books?hl=en&lr=&id=1B6dAgAAQBAJ&oi=fnd&pg=PT17&dq=The+Future+of+Drug+Safety:+Promoting+and+Protecting+the+Health+of+the+Public&ots=LB13DWB9oR&sig=jrvxhgxqHM98IGsgk3q4MKYwoh0
74. Hazell L, Shakir SAW. Under-Reporting of Adverse Drug Reactions. Drug Saf 2012;29(5):385–96.
75. Aagaard L, Strandell J, Melskens L, Petersen PSG, Holme Hansen E. Global patterns of adverse drug reactions over a decade: analyses of spontaneous reports to VigiBaseTM. Drug Saf 2012;35(12):1171–82.
76. Palaian S, Ibrahim MI, Mishra P. Health professionals’ knowledge, attitude and practices towards pharmacovigilance in Nepal. Pharm Pract 2011;9(4):228–35.
77. Aziz Z, Siang TC, Badarudin NS. Reporting of adverse drug reactions: predictors of under-reporting in Malaysia. Pharmacoepidemiol Drug Saf 2007;16(2):223–8.
78. Pérez García M, Figueras A. The lack of knowledge about the voluntary reporting system of adverse drug reactions as a major cause of

133
underreporting: direct survey among health professionals. Pharmacoepidemiol Drug Saf 2011;20(12):1295–302.
79. Liu J, Zhou Z, Yang S, et al. Factors that affect adverse drug reaction reporting among hospital pharmacists in Western China. Int J Clin Pharm 2015;37(3):457–64.
80. Herdeiro MT, Ribeiro-Vaz I, Ferreira M, Polónia J, Falcão A, Figueiras A. Workshop- and telephone-based interventions to improve adverse drug reaction reporting: a cluster-randomized trial in Portugal. Drug Saf 2012;35(8):655–65.
81. Southworth MR, Reichman ME, Unger EF. Dabigatran and Postmarketing Reports of Bleeding. N Engl J Med 2013;368(14):1272–4.
82. Hoffman KB, Demakas AR, Dimbil M, Tatonetti NP, Erdman CB. Stimulated Reporting: The Impact of US Food and Drug Administration-Issued Alerts on the Adverse Event Reporting System (FAERS). Drug Saf 2014;37(11):971–80.
83. Weber JCP. Epidemiology of adverse reactions to nonsteroidal antiinflammatory drugs. Adv Inflamm Res Inflamm RES 1984 1984;
84. Hoffman KB, Dimbil M, Erdman CB, Tatonetti NP, Overstreet BM. The Weber Effect and the United States Food and Drug Administration’s Adverse Event Reporting System (FAERS): Analysis of Sixty-Two Drugs Approved from 2006 to 2010. Drug Saf 2014;37(4):283–94.
85. The Black Triangle Scheme (▼ or ▼*) Drug Safety Update - GOV.UK [Internet]. [cited 2016 Jul 4];Available from: https://www.gov.uk/drug-safety-update/the-black-triangle-scheme-or
86. Hartnell NR, Wilson JP. Replication of the Weber effect using postmarketing adverse event reports voluntarily submitted to the United States Food and Drug Administration. Pharmacotherapy 2004;24(6):743–9.
87. McAdams MA, Governale LA, Swartz L, Hammad TA, Dal Pan GJ. Identifying patterns of adverse event reporting for four members of the angiotensin II receptor blockers class of drugs: revisiting the Weber effect. Pharmacoepidemiol Drug Saf 2008;17(9):882–9.
88. Chhabra P, Chen X, Weiss SR. Adverse event reporting patterns of newly approved drugs in the USA in 2006: an analysis of FDA Adverse Event Reporting System data. Drug Saf 2013;36(11):1117–23.
89. Rawson NSB. Canada’s Adverse Drug Reaction Reporting System: A Failing Grade. J Popul Ther Clin Pharmacol J Thérapeutique Popul Pharamcologie Clin 2015;22(2):e167-172.

134
90. Hauben M, Reich L, Gerrits CM, Younus M. Illusions of objectivity and a recommendation for reporting data mining results. Eur J Clin Pharmacol 2007;63(5):517–21.
91. Hauben M, Reich L, Micco JD, Kim K. “Extreme Duplication” in the US FDA Adverse Events Reporting System Database. Drug Saf 2012;30(6):551–4.
92. Getz KA, Stergiopoulos S, Kaitin KI. Evaluating the Completeness and Accuracy of MedWatch Data: Am J Ther 2014;21(6):442–6.
93. Sakaeda T, Tamon A, Kadoyama K, Okuno Y. Data mining of the public version of the FDA Adverse Event Reporting System. Int J Med Sci 2013;10(7):796–803.
94. Evans SJW, Waller PC, Davis S. Use of proportional reporting ratios (PRRs) for signal generation from spontaneous adverse drug reaction reports. Pharmacoepidemiol Drug Saf 2001;10(6):483–6.
95. Szarfman A, Machado SG, O’Neill RT. Use of screening algorithms and computer systems to efficiently signal higher-than-expected combinations of drugs and events in the US FDA’s spontaneous reports database. Drug Saf 2002;25(6):381–92.
96. van Puijenbroek EP, Bate A, Leufkens HGM, Lindquist M, Orre R, Egberts ACG. A comparison of measures of disproportionality for signal detection in spontaneous reporting systems for adverse drug reactions. Pharmacoepidemiol Drug Saf 2002;11(1):3–10.
97. Bate A, Evans SJW. Quantitative signal detection using spontaneous ADR reporting. Pharmacoepidemiol Drug Saf 2009;18(6):427–36.
98. Mammo Z, Guo M, Maberley D, Matsubara J, Etminan M. Oral Bisphosphonates and Risk of Wet Age-Related Macular Degeneration. Am J Ophthalmol 2016;168:62–7.
99. Fujimoto M, Higuchi T, Hosomi K, Takada M. Association between Statin Use and Cancer: Data Mining of a Spontaneous Reporting Database and a Claims Database. Int J Med Sci 2015;12(3):223–33.
100. Edwards BJ, Laumann AE, Nardone B, et al. Advancing pharmacovigilance through academic–legal collaboration: the case of gadolinium-based contrast agents and nephrogenic systemic fibrosis—a research on adverse drug events and reports (RADAR) report. Br J Radiol [Internet] 2014 [cited 2016 Jul 5];87(1042). Available from: http://www.ncbi.nlm.nih.gov/pmc/articles/PMC4170864/

135
101. Nardone B, Saddleton E, Laumann AE, et al. Pediatric nephrogenic systemic fibrosis is rarely reported: a RADAR report. Pediatr Radiol 2014;44(2):173–80.
102. Edwards BJ, Bunta AD, Lane J, et al. Bisphosphonates and Nonhealing Femoral Fractures: Analysis of the FDA Adverse Event Reporting System (FAERS) and International Safety Efforts. J Bone Joint Surg Am 2013;95(4):297–307.
103. Sakaeda T, Kadoyama K, Okuno Y. Adverse Event Profiles of Platinum Agents: Data Mining of the Public Version of the FDA Adverse Event Reporting System, AERS, and Reproducibility of Clinical Observations. Int J Med Sci 2011;8(6):487–91.
104. Evens AM, Jovanovic BD, Su Y-C, et al. Rituximab-associated hepatitis B virus (HBV) reactivation in lymphoproliferative diseases: meta-analysis and examination of FDA safety reports. Ann Oncol 2011;22(5):1170–80.
105. Belknap SM, Kuzel TM, Yarnold PR, et al. Clinical features and correlates of gemcitabine-associated lung injury: findings from the RADAR project. Cancer 2006;106(9):2051–7.
106. McKoy JM, Angelotta C, Bennett CL, et al. Gemtuzumab ozogamicin-associated sinusoidal obstructive syndrome (SOS): An overview from the research on adverse drug events and reports (RADAR) project. Leuk Res 2007;31(5):599–604.
107. Reese JA, Li X, Hauben M, et al. Identifying drugs that cause acute thrombocytopenia: an analysis using 3 distinct methods. Blood 2010;116(12):2127–33.
108. Suarez EA, Koro CE, Christian JB, Spector AD, Araujo AB, Abraham S. Incretin-mimetic therapies and pancreatic disease: a review of observational data. Curr Med Res Opin 2014;30(12):2471–81.
109. Van Holle L, Bauchau V. Use of logistic regression to combine two causality criteria for signal detection in vaccine spontaneous report data. Drug Saf 2014;37(12):1047–57.
110. Huang L, Zalkikar J, Tiwari RC. Likelihood ratio test-based method for signal detection in drug classes using FDA’s AERS database. J Biopharm Stat 2013;23(1):178–200.
111. ClinicalTrials.gov Background - ClinicalTrials.gov [Internet]. [cited 2017 Mar 5];Available from: https://clinicaltrials.gov/ct2/about-site/background
112. Kotze PG, Abou-Rejaile VR, Uiema LA, et al. Adalimumab for maintenance therapy for one year in Crohn’s disease: results of a Latin

136
American single-center observational study. Arq Gastroenterol 2014;51(1):39–45.
113. Cozijnsen M, Duif V, Kokke F, et al. Adalimumab therapy in children with Crohn disease previously treated with infliximab. J Pediatr Gastroenterol Nutr 2015;60(2):205–10.
114. Bouguen G, Laharie D, Nancey S, et al. Efficacy and safety of adalimumab 80 mg weekly in luminal Crohn’s disease. Inflamm Bowel Dis 2015;21(5):1047–53.
115. Navas-López VM, Blasco-Alonso J, Girón-Fernández-Crehuet F, Serrano-Nieto MJ, Sierra-Salinas C. Efficacy and safety of adalimumab in the treatment of Crohn´s disease in children. Rev Espanola Enfermedades Dig Organo Of Soc Espanola Patol Dig 2013;105(10):579–84.
116. Rosh JR, Lerer T, Markowitz J, et al. Retrospective Evaluation of the Safety and Effect of Adalimumab Therapy (RESEAT) in Pediatric Crohn’s Disease. Am J Gastroenterol 2009;104(12):3042–9.
117. Ho GT, Mowat A, Potts L, et al. Efficacy and complications of adalimumab treatment for medically-refractory Crohn’s disease: analysis of nationwide experience in Scotland (2004–2008). Aliment Pharmacol Ther 2009;29(5):527–34.
118. Swoger JM, Loftus EV, Tremaine WJ, et al. Adalimumab for Crohnʼs disease in clinical practice at Mayo clinic: The first 118 patients: Inflamm Bowel Dis 2010;16(11):1912–21.
119. Miheller P, Lakatos PL, Horváth G, et al. Efficacy and safety of infliximab induction therapy in Crohn’s Disease in Central Europe - a Hungarian nationwide observational study. BMC Gastroenterol 2009;9:66.
120. Hyams JS, Lerer T, Griffiths A, et al. Long-term outcome of maintenance infliximab therapy in children with Crohnʼs disease: Inflamm Bowel Dis 2009;15(6):816–22.
121. Vavricka SR, Schoepfer AM, Bansky G, et al. Efficacy and safety of certolizumab pegol in an unselected crohn’s disease population: 26-week data of the FACTS II survey. Inflamm Bowel Dis 2011;17(7):1530–9.
122. Emery P, Gallo G, Boyd H, et al. Association between disease activity and risk of serious infections in subjects with rheumatoid arthritis treated with etanercept or disease-modifying anti-rheumatic drugs. Clin Exp Rheumatol 2014;32(5):653–60.
123. Bingham CO, Ince A, Haraoui B, Keystone EC, Chon Y, Baumgartner S. Effectiveness and safety of etanercept in subjects with RA who have failed
137
infliximab therapy: 16-week, open-label, observational study. Curr Med Res Opin 2009;25(5):1131–42.
124. Feltelius N, Fored CM, Blomqvist P, et al. Results from a nationwide postmarketing cohort study of patients in Sweden treated with etanercept. Ann Rheum Dis 2005;64(2):246–52.
125. Favalli EG, Desiati F, Atzeni F, et al. Serious infections during anti-TNFα treatment in rheumatoid arthritis patients. Autoimmun Rev 2009;8(3):266–73.
126. Dartel SAA van, Fransen J, Kievit W, et al. Difference in the risk of serious infections in patients with rheumatoid arthritis treated with adalimumab, infliximab and etanercept: results from the Dutch Rheumatoid Arthritis Monitoring (DREAM) registry. Ann Rheum Dis 2013;72(6):895–900.
127. Kvalvik AG, Lefsaker L, Dyvik S, Brun JG. Anti-tumor necrosis factor-alpha therapy in the ordinary clinical setting: Three-year effectiveness in patients with rheumatoid arthritis. Jt Bone Spine Rev Rhum 2007;74(6):606–11.
128. Nam JL, Villeneuve E, Hensor EMA, et al. Remission induction comparing infliximab and high-dose intravenous steroid, followed by treat-to-target: a double-blind, randomised, controlled trial in new-onset, treatment-naive, rheumatoid arthritis (the IDEA study). Ann Rheum Dis 2014;73(1):75–85.
129. Westhovens R, van Vollenhoven RF, Boumpas DT, et al. The early clinical course of infliximab treatment in rheumatoid arthritis: results from the REMARK observational study. Clin Exp Rheumatol 2014;32(3):315–23.
130. Ducoulombier V, Solau E, Coquerelle P, et al. Long-term results of infliximab therapy in rheumatoid arthritis: Experience acquired by the North-Pas-de-Calais hospital network. Joint Bone Spine 2007;74(1):56–9.
131. Schnitzler F, Fidder H, Ferrante M, et al. Long-term outcome of treatment with infliximab in 614 patients with Crohn’s disease: results from a single-centre cohort. Gut 2009;58(4):492–500.
132. Cortés-Hernández J, Egri N, Vilardell-Tarrés M, Ordi-Ros J. Etanercept in refractory lupus arthritis: An observational study. Semin Arthritis Rheum 2015;44(6):672–9.
133. García-Bosch O, Gisbert JP, Cañas-Ventura A, et al. Observational study on the efficacy of adalimumab for the treatment of ulcerative colitis and predictors of outcome. J Crohns Colitis 2013;7(9):717–22.
134. Italian Group for the Study of Inflammatory Bowel Disease, Armuzzi A, Biancone L, et al. Adalimumab in active ulcerative colitis: a “real-life”

138
observational study. Dig Liver Dis Off J Ital Soc Gastroenterol Ital Assoc Study Liver 2013;45(9):738–43.
135. Russell RK, Wilson ML, Loganathan S, et al. A British Society of Paediatric Gastroenterology, Hepatology and Nutrition survey of the effectiveness and safety of adalimumab in children with inflammatory bowel disease. Aliment Pharmacol Ther 2011;33(8):946–53.
136. Sjöberg M, Magnuson A, Björk J, et al. Infliximab as rescue therapy in hospitalised patients with steroid-refractory acute ulcerative colitis: a long-term follow-up of 211 Swedish patients. Aliment Pharmacol Ther 2013;38(4):377–87.
137. Kohn A, Daperno M, Armuzzi A, et al. Infliximab in severe ulcerative colitis: short-term results of different infusion regimens and long-term follow-up. Aliment Pharmacol Ther 2007;26(5):747–56.
138. Lees CW, Heys D, Ho GT, et al. A retrospective analysis of the efficacy and safety of infliximab as rescue therapy in acute severe ulcerative colitis. Aliment Pharmacol Ther 2007;26(3):411–9.
139. Monterubbianesi R, Aratari A, Armuzzi A, et al. Infliximab three-dose induction regimen in severe corticosteroid-refractory ulcerative colitis: early and late outcome and predictors of colectomy. J Crohns Colitis 2014;8(8):852–8.
140. Díaz-Llopis M, Salom D, Garcia-de-Vicuña C, et al. Treatment of Refractory Uveitis with Adalimumab: A Prospective Multicenter Study of 131 Patients. Ophthalmology 2012;119(8):1575–81.
141. Calvo-Río V, Blanco R, Beltrán E, et al. Anti-TNF-α therapy in patients with refractory uveitis due to Behçet’s disease: a 1-year follow-up study of 124 patients. Rheumatol Oxf Engl 2014;53(12):2223–31.
142. Piaserico S, Conti A, Lo Console F, et al. Efficacy and safety of systemic treatments for psoriasis in elderly patients. Acta Derm Venereol 2014;94(3):293–7.
143. María Fernández-Torres R, Paradela S, Fonseca E. Long-Term Efficacy of Etanercept for Plaque-Type Psoriasis and Estimated Cost in Daily Clinical Practice. Value Health J Int Soc Pharmacoeconomics Outcomes Res 2015;18(8):1158–61.
144. Kimball AB, Rothman KJ, Kricorian G, et al. OBSERVE-5: observational postmarketing safety surveillance registry of etanercept for the treatment of psoriasis final 5-year results. J Am Acad Dermatol 2015;72(1):115–22.

139
145. Vender R, Lynde C, Gilbert M, Ho V, Sapra S, Poulin-Costello M. One-year, multicenter, open-label, single-arm study evaluating the safety and effectiveness of etanercept for the treatment of moderate-to-severe plaque psoriasis in a Canadian population. J Cutan Med Surg 2013;17(2):129–38.
146. Gottlieb AB, Kircik L, Eisen D, et al. Use of etanercept for psoriatic arthritis in the dermatology clinic: the Experience Diagnosing, Understanding Care, and Treatment with Etanercept (EDUCATE) study. J Dermatol Treat 2006;17(6):343–52.
147. Ahmad K, Rogers S. Two years of experience with etanercept in recalcitrant psoriasis. Br J Dermatol 2007;156(5):1010–4.
148. Antoniou C, Vergou T, Dessinioti C, et al. Etanercept: effectiveness and safety data of a retrospective study. J Eur Acad Dermatol Venereol 2011;25(9):1113–5.
149. Shear NH, Hartmann M, Toledo-Bahena M, et al. Long-term efficacy and safety of infliximab maintenance therapy in patients with plaque-type psoriasis in real-world practice. Br J Dermatol 2014;171(3):631–41.
150. Kalb RE, Gurske J. Infliximab for the treatment of psoriasis: Clinical experience at the State University of New York at Buffalo. J Am Acad Dermatol 2005;53(4):616–22.
151. Horneff G, Bock FD, Foeldvari I, et al. Safety and efficacy of combination of etanercept and methotrexate compared to treatment with etanercept only in patients with juvenile idiopathic arthritis (JIA): preliminary data from the German JIA Registry. Ann Rheum Dis 2009;68(4):519–25.
152. Prince FHM, Twilt M, Cate R ten, et al. Long-term follow-up on effectiveness and safety of etanercept in juvenile idiopathic arthritis: the Dutch national register. Ann Rheum Dis 2009;68(5):635–41.
153. Klotsche J, Niewerth M, Haas J-P, et al. Long-term safety of etanercept and adalimumab compared to methotrexate in patients with juvenile idiopathic arthritis (JIA). Ann Rheum Dis 2016;75(5):855–61.
154. Giannini EH, Ilowite NT, Lovell DJ, et al. Long-term safety and effectiveness of etanercept in children with selected categories of juvenile idiopathic arthritis. Arthritis Rheum 2009;60(9):2794–804.
155. Tarkiainen M, Tynjälä P, Vähäsalo P, Lahdenne P. Occurrence of adverse events in patients with JIA receiving biologic agents: long-term follow-up in a real-life setting. Rheumatol Oxf Engl 2015;54(7):1170–6.

140
156. Dijkmans B, Emery P, Hakala M, et al. Etanercept in the Longterm Treatment of Patients With Ankylosing Spondylitis. J Rheumatol 2009;36(6):1256–64.
157. Martín-Mola E, Sieper J, Leirisalo-Repo M, et al. Sustained efficacy and safety, including patient-reported outcomes, with etanercept treatment over 5 years in patients with ankylosing spondylitis. Clin Exp Rheumatol 2010;28(2):238–45.
158. Talarico R, Bazzichi L, d’Ascanio A, et al. Rate of serious infections in Behçet’s disease patients receiving biologic therapies: a prospective observational study. Clin Rheumatol 2013;32(10):1547–8.
159. Niccoli L, Nannini C, Benucci M, et al. Long-term efficacy of infliximab in refractory posterior uveitis of Behçet’s disease: a 24-month follow-up study. Rheumatology 2007;46(7):1161–4.
160. Surveillance of Humira Injection in Korean Patients - Full Text View - ClinicalTrials.gov [Internet]. [cited 2017 Mar 6];Available from: https://clinicaltrials.gov/ct2/show/NCT01083121?term=NCT01083121&rank=1
161. Special Investigation in Patients With Crohn’s Disease (All Patients Investigation) - Full Text View - ClinicalTrials.gov [Internet]. [cited 2017 Mar 6];Available from: https://clinicaltrials.gov/ct2/show/NCT01298648?term=NCT01298648&rank=1
162. An Audit of Patients With Crohn’s Disease Treated With Infliximab (P06066) - Full Text View - ClinicalTrials.gov [Internet]. [cited 2017 Mar 6];Available from: https://clinicaltrials.gov/ct2/show/NCT00988832?term=NCT00988832&rank=1
163. Program Extension of Real Life Dosing of Remicade in Austria for Crohn’s Disease (Study P04052)(COMPLETED) - Full Text View - ClinicalTrials.gov [Internet]. [cited 2017 Mar 6];Available from: https://clinicaltrials.gov/ct2/show/NCT00724958?term=NCT00724958&rank=1
164. Postmarketing Safety Surveillance European Registry of Crohn’s Disease Patients Treated With Remicade or Standard Therapy (MK-2155-035) - Full Text View - ClinicalTrials.gov [Internet]. [cited 2017 Mar 6];Available from: https://clinicaltrials.gov/ct2/show/NCT00705614?term=NCT00705614&rank=1
165. Observational Trial With Enbrel - Full Text View - ClinicalTrials.gov [Internet]. [cited 2017 Mar 6];Available from:

141
https://clinicaltrials.gov/ct2/show/NCT00488475?term=NCT00488475&rank=1
166. Study to Assess the Safety and Efficacy of Etanercept in Patients Treated Over the Long-term in Real-world Clinical Practice, Using Data Collected by the British Society of Rheumatology Biologics Registry - Full Text View - ClinicalTrials.gov [Internet]. [cited 2017 Mar 6];Available from: https://clinicaltrials.gov/ct2/show/NCT01646385?term=NCT01646385&rank=1
167. A Drug Use Investigation of ENBREL for Post-marketing Surveillance (PMS) for RA and PsA - Full Text View - ClinicalTrials.gov [Internet]. [cited 2017 Mar 6];Available from: https://clinicaltrials.gov/ct2/show/NCT00195403?term=NCT00195403&rank=1
168. Study Evaluating Enbrel In Adults With Active Rheumatoid Arthritis In Luxemburg - Full Text View - ClinicalTrials.gov [Internet]. [cited 2017 Mar 6];Available from: https://clinicaltrials.gov/ct2/show/NCT00195338?term=NCT00195338&rank=1
169. Good EULAR Response In Patients With Early Rheumatoid Arthritis - Full Text View - ClinicalTrials.gov [Internet]. [cited 2017 Mar 6];Available from: https://clinicaltrials.gov/ct2/show/NCT01558089?term=NCT01558089&rank=1
170. Characterize Patients With Moderately Active Rheumatoid Arthritis (RA) - Full Text View - ClinicalTrials.gov [Internet]. [cited 2017 Mar 6];Available from: https://clinicaltrials.gov/ct2/show/NCT01557322?term=NCT01557322&rank=1
171. Drug Concentration, Immunogenicity, and Efficacy Study in Patients With Rheumatoid Arthritis Currently Treated With Etanercept, Adalimumab, or Infliximab - Full Text View - ClinicalTrials.gov [Internet]. [cited 2017 Mar 6];Available from: https://clinicaltrials.gov/ct2/show/NCT01981473?term=NCT01981473&rank=1
172. Safety and Effectiveness of Adalimumab in Patients Diagnosed With Rheumatoid Arthritis - Full Text View - ClinicalTrials.gov [Internet]. [cited 2017 Mar 6];Available from: https://clinicaltrials.gov/ct2/show/study/NCT01078571?term=adalimumab+OR+etanercept+OR+infliximab+OR+golimumab+OR+certolizumab&recr=Completed&rslt=With&type=Obsr&rank=2§=X430156

142
173. Post-marketing Observational Study in Subjects With Rheumatoid Arthritis - Full Text View - ClinicalTrials.gov [Internet]. [cited 2017 Mar 6];Available from: https://clinicaltrials.gov/ct2/show/NCT00234884?term=NCT00234884&rank=1
174. A 3-year Study Following up Patients With Moderate to Severe Rheumatoid Arthritis Treated With Humira in Greece - Full Text View - ClinicalTrials.gov [Internet]. [cited 2017 Mar 6];Available from: https://clinicaltrials.gov/ct2/show/NCT01086033?term=NCT01086033&rank=1
175. Study to Characterize Demographics, Compliance, Tolerability and Safety in Patients With Rheumatoid Arthritis, Psoriatic Arthritis and Ankylosing Spondylitis Prescribed Adalimumab (Humira®) as Part of Routine Clinical Care - Full Text View - ClinicalTrials.gov [Internet]. [cited 2017 Mar 6];Available from: https://clinicaltrials.gov/ct2/show/NCT01163916?term=NCT01163916&rank=1
176. A Study of Rheumatoid Arthritis Patients on Adalimumab to Evaluate Quality of Life Variables, Effects on Work Productivity and Functional Outcomes in Malaysia - Full Text View - ClinicalTrials.gov [Internet]. [cited 2017 Mar 6];Available from: https://clinicaltrials.gov/ct2/show/NCT01387789?term=NCT01387789&rank=1
177. Greek Study on Work Productivity and Sleep in Patients With Rheumatic Diseases Treated With Adalimumab - Full Text View - ClinicalTrials.gov [Internet]. [cited 2017 Mar 6];Available from: https://clinicaltrials.gov/ct2/show/NCT01282372?term=NCT01282372&rank=1
178. Effectiveness and Safety of Adalimumab in Rheumatoid Arthritis Patients in Routine Clinical Practice - Full Text View - ClinicalTrials.gov [Internet]. [cited 2017 Mar 6];Available from: https://clinicaltrials.gov/ct2/show/NCT01078090?term=NCT01078090&rank=1
179. Drug Use Investigation for Humira® - All Patient Investigation for Rheumatoid Arthritis - Full Text View - ClinicalTrials.gov [Internet]. [cited 2017 Mar 6];Available from: https://clinicaltrials.gov/ct2/show/NCT01076959?term=NCT01076959&rank=1
180. Special Investigation in Patients With Rheumatoid Arthritis (HOPEFUL III Study), a Follow-up Survey of Study P12-069 - Full Text View -

143
ClinicalTrials.gov [Internet]. [cited 2017 Mar 6];Available from: https://clinicaltrials.gov/ct2/show/NCT01346501?term=NCT01346501&rank=1
181. Assessment of the Safety of Adalimumab in Rheumatoid Arthritis Patients Showing Rapid Progression of Structural Damage of the Joints, Who Have no Prior History of Treatment With Disease-modifying Anti-rheumatic Drugs or Biological Agents - Full Text View - ClinicalTrials.gov [Internet]. [cited 2017 Mar 6];Available from: https://clinicaltrials.gov/ct2/show/NCT01783730?term=NCT01783730&rank=1
182. Quality of Life Outcomes of HUMIRA in Rheumatoid Arthritis (RA), Psoriatic Arthritis (PsA), Ankylosing Spondylitis (AS) After Unsustainable Response to Biologicals and Disease Modifying Antirheumatic Drugs - Full Text View - ClinicalTrials.gov [Internet]. [cited 2017 Mar 6];Available from: https://clinicaltrials.gov/ct2/show/NCT01083693?term=NCT01083693&rank=1
183. EValuation of HumIRA® in Patients With Active Rheumatoid Arthritis, Psoriatic Arthritis and Ankylosing Spondylitis in EASTern European Countries - Full Text View - ClinicalTrials.gov [Internet]. [cited 2017 Mar 6];Available from: https://clinicaltrials.gov/ct2/show/NCT01078402?term=NCT01078402&rank=1
184. A Study to Observe Characteristics of Rheumatoid Arthritis in Patients Using Infliximab (Study P04250) - Full Text View - ClinicalTrials.gov [Internet]. [cited 2017 Mar 6];Available from: https://clinicaltrials.gov/ct2/show/NCT00705289?term=NCT00705289&rank=1
185. Real Life Dosing of Remicade for Rheumatoid Arthritis in Austria Monitored Over 9 Infusions (Study P03756)(COMPLETED) - Full Text View - ClinicalTrials.gov [Internet]. [cited 2017 Mar 6];Available from: https://clinicaltrials.gov/ct2/show/NCT00725621?term=NCT00725621&rank=1
186. Post Marketing Surveillance Study of Remicade in Patients With Chronic Inflammatory Diseases (P04840) - Full Text View - ClinicalTrials.gov [Internet]. [cited 2017 Mar 6];Available from: https://clinicaltrials.gov/ct2/show/NCT00727298?term=NCT00727298&rank=1
187. An Observational Study of Infliximab Injection in Ankylosing Spondylitis, Rheumatoid Arthritis, Psoriatic Arthritis and Psoriasis Participants - Full Text View - ClinicalTrials.gov [Internet]. [cited 2017 Mar 6];Available from:

144
https://clinicaltrials.gov/ct2/show/NCT00760669?term=NCT00760669&rank=1
188. Observation of Treatment With Certolizumab Pegol in Daily Practice - Full Text View - ClinicalTrials.gov [Internet]. [cited 2017 Mar 6];Available from: https://clinicaltrials.gov/ct2/show/NCT01069419?term=NCT01069419&rank=1
189. Long Term Effects of an Early Response to Certolizumab Pegol (CZP, Cimzia®) in Rheumatoid Arthritis (RA) Patients - Full Text View - ClinicalTrials.gov [Internet]. [cited 2017 Mar 6];Available from: https://clinicaltrials.gov/ct2/show/NCT01288287?term=NCT01288287&rank=1
190. A Study to Investigate the Use of Golimumab (Simponi®) in Participants With Rheumatoid Arthritis, Psoriatic Arthritis and Ankylosing Spondylitis (P06554) - Full Text View - ClinicalTrials.gov [Internet]. [cited 2017 Mar 6];Available from: https://clinicaltrials.gov/ct2/show/NCT01313858?term=NCT01313858&rank=1
191. Study Evaluating the Safety and Efficacy of Etanercept in Patients With Psoriatic Arthritis Treated by Dermatologists - Full Text View - ClinicalTrials.gov [Internet]. [cited 2017 Mar 6];Available from: https://clinicaltrials.gov/ct2/show/NCT00293709?term=NCT00293709&rank=1
192. Study Evaluating the Safety and Efficacy of Etanercept in Patients With Psoriatic Arthritis Treated by Rheumatologists - Full Text View - ClinicalTrials.gov [Internet]. [cited 2017 Mar 6];Available from: https://clinicaltrials.gov/ct2/show/NCT00293722?term=NCT00293722&rank=1
193. Study Evaluating Safety and Adherence to Treatment With Etanercept in Adults With Psoriatic Arthritis - Full Text View - ClinicalTrials.gov [Internet]. [cited 2017 Mar 6];Available from: https://clinicaltrials.gov/ct2/show/NCT00938015?term=NCT00938015&rank=1
194. Multi-country Post-Marketing Observational Study on Maintenance of Effectiveness of Adalimumab (Humira®) in Patients With Ankylosing Spondylitis and Psoriatic Arthritis - Full Text View - ClinicalTrials.gov [Internet]. [cited 2017 Mar 6];Available from: https://clinicaltrials.gov/ct2/show/NCT01474876?term=NCT01474876&rank=1
195. Prevalence and Incidence of Articular Symptoms and Signs Related to Psoriatic Arthritis in Patients With Psoriasis Severe or Moderate With
145
Adalimumab Treatment - Full Text View - ClinicalTrials.gov [Internet]. [cited 2017 Mar 6];Available from: https://clinicaltrials.gov/ct2/show/NCT01316224?term=NCT01316224&rank=1
196. Efficacy and Safety of Humira® in Patients With Psoriatic Arthritis in Normal Medical Practice - Full Text View - ClinicalTrials.gov [Internet]. [cited 2017 Mar 6];Available from: https://clinicaltrials.gov/ct2/show/NCT01111240?term=NCT01111240&rank=1
197. Observational Safety Study of Etanercept (Enbrel) for Treatment of Psoriasis - Full Text View - ClinicalTrials.gov [Internet]. [cited 2017 Mar 6];Available from: https://clinicaltrials.gov/ct2/show/NCT00322439?term=NCT00322439&rank=1
198. Observational Study Evaluating Etanercept (Enbrel®) In Subjects With Plaque-Type Psoriasis In Usual Care Settings - Full Text View - ClinicalTrials.gov [Internet]. [cited 2017 Mar 6];Available from: https://clinicaltrials.gov/ct2/show/NCT00708708?term=NCT00708708&rank=1
199. An Observational Study of the Real Life Management of the Psoriasis Patients Treated With Enbrel According to the New Reimbursement Criteria - Full Text View - ClinicalTrials.gov [Internet]. [cited 2017 Mar 6];Available from: https://clinicaltrials.gov/ct2/show/NCT01557283?term=NCT01557283&rank=1
200. Quality of Life in Adalimumab Treated Psoriasis Patients Failing Other Biologic Disease Modifying Anti-rheumatic Drugs - Full Text View - ClinicalTrials.gov [Internet]. [cited 2017 Mar 6];Available from: https://clinicaltrials.gov/ct2/show/NCT01084668?term=NCT01084668&rank=1
201. Evaluation of Humira Retention Rate in Psoriasis Patients in Daily Practice and Assessment of Work Productivity and Quality of Life - Full Text View - ClinicalTrials.gov [Internet]. [cited 2017 Mar 6];Available from: https://clinicaltrials.gov/ct2/show/NCT01169987?term=NCT01169987&rank=1
202. Greek Study of the Quality of Life in Patients With Psoriasis Treated With Adalimumab - Full Text View - ClinicalTrials.gov [Internet]. [cited 2017 Mar 6];Available from: https://clinicaltrials.gov/ct2/show/NCT01077128?term=NCT01077128&rank=1

146
203. Study of Adalimumab (HUMIRA®) in Patients With Moderate to Severe Psoriasis (PS) in Spain (PROMISE) - Full Text View - ClinicalTrials.gov [Internet]. [cited 2017 Mar 6];Available from: https://clinicaltrials.gov/ct2/show/NCT01076192?term=NCT01076192&rank=1
204. Special Investigation in Patients With Psoriasis Vulgaris and Psoriatic Arthritis (All Patients Investigation) - Full Text View - ClinicalTrials.gov [Internet]. [cited 2017 Mar 6];Available from: https://clinicaltrials.gov/ct2/show/NCT01155570?term=NCT01155570&rank=1
205. Five-Year Observation of Remicade Treatment for Plaque Psoriasis in Austria (Study P04900) - Full Text View - ClinicalTrials.gov [Internet]. [cited 2017 Mar 6];Available from: https://clinicaltrials.gov/ct2/show/NCT00725452?term=NCT00725452&rank=1
206. Assessment of Long-Term Infliximab for Psoriasis (P05319) - Full Text View - ClinicalTrials.gov [Internet]. [cited 2017 Mar 6];Available from: https://clinicaltrials.gov/ct2/show/NCT00779675?term=NCT00779675&rank=1
207. Enbrel-Juvenile Idiopathic Arthritis (JIA) Use Results Survey [All-Case Surveillance] - Full Text View - ClinicalTrials.gov [Internet]. [cited 2017 Mar 6];Available from: https://clinicaltrials.gov/ct2/show/NCT01145352?term=NCT01145352&rank=1
208. Study Evaluating The Use Of Etanercept In Patients With Ankylosing Spondylitis - Full Text View - ClinicalTrials.gov [Internet]. [cited 2017 Mar 6];Available from: https://clinicaltrials.gov/ct2/show/NCT00544557?term=NCT00544557&rank=1
209. An Observational, Retrospective, Multicenter, National Study for the Monitoring of Subjects Who Participated in the LoadET Clinical Trial - Full Text View - ClinicalTrials.gov [Internet]. [cited 2017 Mar 6];Available from: https://clinicaltrials.gov/ct2/show/NCT01793285?term=NCT01793285&rank=1
210. Basic Documentation of Adalimumab (Humira) in Patients With Ankylosing Spondylitis (AS) - Full Text View - ClinicalTrials.gov [Internet]. [cited 2017 Mar 6];Available from: https://clinicaltrials.gov/ct2/show/NCT01079182?term=NCT01079182&rank=1

147
211. Investigation of 9 Consecutive Remicade Infusions in Ankylosing Spondylitis in Austria (Study P04044)(COMPLETED) - Full Text View - ClinicalTrials.gov [Internet]. [cited 2017 Mar 6];Available from: https://clinicaltrials.gov/ct2/show/NCT00725543?term=NCT00725543&rank=1
212. Schoepfer AM, Vavricka SR, Binek J, et al. Efficacy and safety of certolizumab pegol induction therapy in an unselected Crohn’s disease population: results of the FACTS survey. Inflamm Bowel Dis 2010;16(6):933–8.
213. Kimball AB, Pariser D, Yamauchi PS, et al. OBSERVE-5 interim analysis: an observational postmarketing safety registry of etanercept for the treatment of psoriasis. J Am Acad Dermatol 2013;68(5):756–64.
214. Bodro M, Paterson DL. Listeriosis in patients receiving biologic therapies. Eur J Clin Microbiol Infect Dis 2013;32(9):1225–30.
215. Winthrop KL, Chang E, Yamashita S, Iademarco MF, LoBue PA. Nontuberculous Mycobacteria Infections and Anti–Tumor Necrosis Factor-α Therapy. Emerg Infect Dis 2009;15(10):1556–61.
216. Hansen RA, Gartlehner G, Powell GE, Sandler RS. Serious Adverse Events With Infliximab: Analysis of Spontaneously Reported Adverse Events. Clin Gastroenterol Hepatol 2007;5(6):729–735.e1.
217. Kaur N, Mahl TC. Pneumocystis jiroveci (carinii) Pneumonia After Infliximab Therapy: A Review of 84 Cases. Dig Dis Sci 2007;52(6):1481–4.
218. Slifman NR, Gershon SK, Lee J-H, Edwards ET, Braun MM. Listeria monocytogenes infection as a complication of treatment with tumor necrosis factor α–neutralizing agents. Arthritis Rheum 2003;48(2):319–24.
219. Keane J, Gershon S, Wise RP, et al. Tuberculosis associated with infliximab, a tumor necrosis factor alpha-neutralizing agent. N Engl J Med 2001;345(15):1098–104.
220. Hoffman KB, Overstreet BM, Doraiswamy PM. Development of a drug safety ePlatform for physicians, pharmacists, and consumers based on post-marketing adverse events. Drugs Ther Stud 2013;3(1):4.
221. Ross JS, Tse T, Zarin DA, Xu H, Zhou L, Krumholz HM. Publication of NIH funded trials registered in ClinicalTrials.gov: cross sectional analysis. BMJ 2012;344:d7292.
222. Dickersin K, Min Y-I, Meinert CL. Factors Influencing Publication of Research Results: Follow-up of Applications Submitted to Two Institutional Review Boards. JAMA 1992;267(3):374–8.

148
223. von Elm E, Röllin A, Blümle A, Huwiler K, Witschi M, Egger M. Publication and non-publication of clinical trials: longitudinal study of applications submitted to a research ethics committee. Swiss Med Wkly 2008;138(13–14):197–203.
224. Rizvi S, Chaudhari K, Syed BA. The psoriasis drugs market. Nat Rev Drug Discov 2015;14(11):745–6.
225. The Best Selling Drugs of All Time; Humira Joins The Elite [Internet]. [cited 2017 Mar 3];Available from: https://www.forbes.com/sites/simonking/2013/01/28/the-best-selling-drugs-of-all-time-humira-joins-the-elite/#40f6181b5110
226. Strangfeld A, Listing J. Bacterial and opportunistic infections during anti-TNF therapy. Best Pract Res Clin Rheumatol 2006;20(6):1181–95.
227. Research C for DE and. Drug Safety and Availability - FDA Drug Safety Communication: Drug labels for the Tumor Necrosis Factor-alpha (TNFα) blockers now include warnings about infection with Legionella and Listeria bacteria [Internet]. [cited 2017 May 5];Available from: https://www.fda.gov/Drugs/DrugSafety/ucm270849.htm