comparison of navigation techniques for large digital … · comparison of navigation techniques...
TRANSCRIPT

Comparison of Navigation Techniques for Large Digital Images BRADLEY HEMMINGER University of North Carolina at Chapel Hill and ANNE BAUERS AND JIAN YANG University of North Carolina at Chapel Hill ________________________________________________________________________ Digital images are examined on computer screens in a variety of contexts. Frequently these images are larger than computer screens, and computer applications support different paradigms for user navigation of large images. The paper reports on a systematic investigation of what interaction techniques are the most effective for navigating images larger than the screen size. An experiment compares five different types of geometrically zoomable interaction techniques, each at two speeds (fast and slow update rates) for the task of finding a known feature in the image. There were statistically significant performance differences between several groupings of the techniques. The fast versions of the ArrowKey, Pointer, and ScrollBar performed the best. In general, techniques that enable both intuitive and systematic searching performed the best at the fast speed, while techniques that minimize the number of interactions with the image were more effective at the slow speed. Additionally, based on a post experiment questionnaire and qualitative comparison, users expressed a clear preference for the Pointer technique, which allowed them to more freely and naturally interact with the image. Categories and Subject Descriptors: H5.2 [Information Interfaces and Presentation]: User Interfaces - Evaluation/methodology, Graphical user interfaces (GUI), input devices and strategies, Interaction styles; H.1.2 [Information Systems]: User/Machine Systems - Human factors, Human information processing; H.3.3 [Information Systems]: Information Search and Retrieval - Search process; H.3.4 [Information Systems]: Systems and Software - Performance evaluation; I.3.3 [Computing Methodologies]: Picture/Image Generation - Viewing algorithms; I.3.6 [Computing Methodologies]: Methodology and Techniques - Interaction techniques; J. [Computer Applications] General Terms: Human Factors, Performance Additional Key Words and Phrases: Human-computer interaction, Image Display, Image Navigation, Feature Detection, Pan, Zoom, Large Images, Performance Evaluation ________________________________________________________________________ This research was supported in part by the National Institutes of Health (NIH) Grant # RO1 CA60193-05, U.S. Army Medical Research and Material Command, Grant # DAMD 17-94-J-4345, NIH RO1-CA 44060, and NIH PO1-CA 47982. Authors' addresses: Bradley Hemminger, School of Information and Library Science, University of North Carolina at Chapel Hill, Chapel Hill, NC 27599-3360, email: [email protected]; Anne Bauers 4909 Abbott Ave. S. Minneapolis, MN 55410, Jian Yang School of Information and Library Science, University of North Carolina at Chapel Hill, Chapel Hill, NC 27599-3360 Permission to make digital/hard copy of part of this work for personal or classroom use is granted without fee provided that the copies are not made or distributed for profit or commercial advantage, the copyright notice, the title of the publication, and its date of appearance, and notice is given that copying is by permission of the ACM, Inc. To copy otherwise, to republish, to post on servers, or to redistribute to lists, requires prior specific permission and/or a fee. © 2005 ACM

1. INTRODUCTION
Viewing images larger than the user’s display screen is now a common occurrence. It
occurs both because the spatial resolution of digital images that people interact with
continues to increase, and because of the increasing variety of smaller resolution screens
in use today (PDAs, cellphones, handheld games, etc.). This leads to an increased need
for interaction techniques that enable the user to successfully and quickly navigate
images larger than their screen size. People view large digital images on a computer
screen in many different kinds of situations. For example, radiologists perform diagnoses
using computer video screens. Scholars and students view art images and/or photographs
digitally. Cartographers view maps digitally. NASA, military and other government
agencies study satellite and similar types of images that are acquired digitally. Computer
gamers may be navigating a large virtual space. Consumers may wish to view a map of
their surroundings, to locate a destination such as a restaurant.
In the past computer and network speeds limited the speed at which such large images
could be manipulated by the display device, limiting the types of interaction techniques
available and their effectiveness. As computer and network speeds have increased, it is
now possible to interactively manipulate images by panning and zooming them in real-
time on most computer based display systems, including standard personal computers.
The availability of interactive techniques supporting real-time panning and zooming
provides for the possibility of improved human computer interactions. However, most
interactions in existing commercial applications as well as freely available ones, do not
take advantage of improved interaction techniques, or necessarily use the techniques best
suited for capabilities of their particular display device.
This paper reports on a study designed to research the types of interaction techniques
that would best allow users to interact with large images under different conditions.
Large images are defined as images that have a spatial resolution significantly larger than
their viewing device, i.e. at least several times larger in area. It may additionally be
constrained by the user operating within a window on that screen that further constrains
the available resolution. For instance, a user may wish to navigate a satellite image map
that is 40000x40000 pixels on a personal computer screen that is 1024x768 pixels in a
window of size 800x600 pixels.
In order to quantitatively compare the performance of different techniques, we must
be able to measure their performance on a specific task. There are many types of tasks
and contexts in which users view large images. In this study we chose to examine the

task of finding a particular feature within an image. This is a common task and
representative of many areas. In addition to the interaction technique, the speed of
updating the image view may affect the quality of the interaction. Several factors can
affect the update rate, including processor speed and network connection speed. While
many personal computer connections now use fast connections such as broadband cable,
DSL or T1, a significant number of connections still operate at lower speeds including
analog phone dial-up connections, wireless devices, and cellphones. A different user
experience may result from the same interaction technique with a slow connection as
compared to a fast connection. To address these issues in the study we tested five
different techniques, with each technique evaluated with both a fast and a slow update
rate.
2. BACKGROUND AND RELATED WORK
There has been interest in viewing large digital images since the start of digital
computers, and especially since the advent of raster image displays. Several decades
ago, researchers began to consider digital image interpretation in the context of image
display [McKeown & Denlinger, 1982]. Today, digital image viewing and interpretation
plays a vital role in a number of fields. Digital images are now routinely used for much
of medical practice including radiology [Reiner 2001; Raman 2004; Heyden et al. 1998],
surgery [Eadie et al. 2000; Hemminger 2005], pathology [Marchevsky et al. 2002], and
dentistry [Farr 2000]. Digital libraries and museums collect and preserve large
collections of digital images and digital maps [Hastings 2000; Kenney and Rieger 2000;
Armitage and Enser 1997]. The United States military also uses digital images for
decision making as well as combat and reconnaissance training [Ackerman 2001;
Howard 1991].
This paper is concerned with navigational and diagnostic uses (as defined by Plasiant et
al. [1995]) of digital images when displayed on screens of significantly smaller size. We
limited our focus to techniques used on standard computing devices, i.e. not having
special displays or input devices, and that used geometric zooming (i.e. do not distort the
image), in order to match the task requirements for the described application areas.
Interfaces that provide the ability to zoom and pan an image have been termed
“zoomable” interfaces in the HCI literature [Perlin and Fox 1993]. Two well developed
environments that support development and testing of general zoomable interfaces are the

Pad++ [Bederson and Hollan 1994] and Jazz toolkits [Bederson et al. 2000]. To date,
few studies have examined digital image viewing from the perspective of maximizing
effective interface design for the task of navigating and searching out features within a
single large image. There is, however, a significant body of literature in related areas.
2.1 Studies on Related Topics
Many researchers have examined the transition from analog to digital presentations,
especially in medical imaging [Foley 1990; et al. 1992; Beard et al. 1993; Andricole,
2002; Fischer et. al 2002; Hermann et al. 2002; Pisano et al. 2002]. Substantial work has
been done with non-geometric zoomable interfaces including semantic zooming [Perlin
and Fox 1993; Frank and Timpf 1994], distortion-based methods (fisheye) [Furnas 1986;
Hornbaek and Rokjaer 2001; Gutwin and Fedak 2004], and sweet spots on large screens
[Baudisch 2002]. A summary of these different types of methods can be found in
Schaffer [1996]. Additionally, much work has focused on searching through collections
of objects. Examples include a single image from a collection of images [e.g. Kennedy
and Rieger 2000; Armitage and Enser 1997; Bederson 1994; Watanabe et al. 1996;
Kennedy and Rieger 2000; Gough 1999; Combs and Bederson 1999); viewing large text
documents or collections of documents [Schaffer 1996; Hornbæk and Frøkjær 2003]; and
viewing web pages [Hightower 1998]. Methods that involve changing the speed of
panning depending on the zoom scale may have some relevance to our results. These
methods have been developed to allow users to move slowly at small scales (fine detail),
and more quickly over large scales (overviews). Cockburn et al. [2005] found that two
different speed dependent automatic zooming interfaces performed better than fixed
speed or scrollbar interfaces when searching for notable locations in a large one
dimensional textual document. Ware and Fleet [1999] tested five different choices for
automatically adjusting the panning speed, primarily based on zoom scale. They found
that two of the adaptive automatic methods worked better than three other options,
including fixed speed panning, for the task of finding small scale boxes artificially added
to a large map. Their task differs from our study in that the targets are easily identified at
the fine detail scale. Difficult to detect targets require slower, more careful panning at
the fine detail scale, which probably negates the advantage of automatic zooming
methods for our task.

2.2 Closely Related Studies
One of the first articles addressing navigational techniques for large images was Beard et
al. [1990], which found that pointer based pan and zoom techniques performed better
than scrollbars for navigating large image spaces to locate specific words located on tree
nodes. They followed this work with a review of the requirements and design principles
for radiological workstations [Beard et al. 1991; Hemminger 1992], and an evaluation of
the relative effects of available screen space and system response time on the
interpretation speed of radiologists [Beard et al. 1992]. In general faster response times
for the user interface, larger screen space, and simpler interfaces (mental models)
performed better [Hemminger 1992]. This was followed by timing studies that
established that computer workstations using navigational techniques to interact with
images larger than the physical screen size could perform as well or better than their
physical analog, radiology film-based displays [Beard et al. 1993; Beard et al. 1994,
Pisano 2002]. Gutwin and Fedak [2004] studied the effect of displaying standard
workstation application interfaces on small screen devices like PDAs. They found that
techniques that supported zooming (fisheye, standard zoom) were more effective than
just panning, and that determining which technique was most effective depended on the
task. Kaptelinin [1995] studied scrollbars and pointer panning, the latter evaluated with
and without zooming and overviews. His test set was a large array of folder icons, with
the overall image size 9 times the screen size. Users were required to locate and open the
folders to complete the task. He found the pointer panning technique performed faster
than scrollbars and was qualitatively preferred, likely due to it not requiring panning
movements to be broken down into separate horizontal and vertical scrollbar movements.
Also, he found the addition of zooming to improve task speed. Hemminger [2003]
evaluated several different digital large image interaction techniques as a preliminary step
in choosing one technique (Pointer) to compare computer monitor versus analog film
display for mammography readings [Pisano 2002]. However, the evaluation was based
on the users’ qualitative judgments and did not compare the techniques quantitatively.
Despite the relative lack of research in the specific area of digital image viewing
techniques, many applications exist for viewing digital photographs, images, and maps.
Online map providers such as Mapquest [2005] and Google Maps [2005], as well as the
National Imagery and Mapping Agency [NIMA 2005] and the United States Geological
Survey [USGS 2005] provide map viewing and navigating capabilities to site visitors. A
number of digital libraries, such as the Smithsonian Institution [2005] and the Museum of

Modern Art [MoMA 2005], provide access to digital photographs, digitized paintings and
other art objects, and digitized maps. There are also many standalone applications
designed for viewing digital image data. Specialized systems, such as the Senographe
DMR (GE Medical Systems, Milwaukee, WI), are used for detection tasks by
radiologists; software packages such as ArcView GIS [2003] support digital viewing of
feature (raster) data or image data. Berinstein [1998] reviewed five image-viewing
software packages with zooming capabilities, VuePrint, VidFun, Lens, GraphX, and E-Z
Viewer, which were frequently used by libraries. The transition from film to digital
cameras for the consumer market has resulted in a wide selection of photographic image
manipulation applications.
These tools use a variety of different interaction techniques to give viewers access to
images at different resolutions. There are two basic classes of interactions involved. The
first is zooming, which refers to the magnification of the image. The spatial resolution of
the image as it is originally acquired is referred to as the “full resolution”. Different
zoom levels that shrink the image in spatial resolution are provided so that the image can
be shrunk down to fit the screen. The second operation is panning, which refers to the
spatial movement through the image at its current zoom level. Most tools use some
combination of these two techniques. Prominent paradigms for zooming in and out of
images and some example applications that use them include: the use of onscreen
buttons/toolbars [Mapquest 2005; Google Maps 2005; NIMA 2005; USGS 2005],
clicking within an image to magnify a small portion of that image [FFView 2005], or
clicking within the image to magnify the entire image with the clicked point at the center
[ArcView GIS 2005]. Prominent image panning paradigms and example applications
include the use of scroll bars [ArcView GIS 2005, Mapquest 2005, most Microsoft Office
applications, Adobe PhotoShop 2005]; moving a “magnification area” over the image in
the manner of a magnifying glass [FFView 2005], clicking on arrows or using the
keyboard arrows to move over an image [NIMA 2005]; panning vertically only via the
mouse scroll wheel [Microsoft Paint 2005, Adobe PhotoShop 2005]; and dragging the
image via a pointer device movement [Google Maps 2005, MicroSoft Office Picture
Manager 2005].
Thus, while many systems exist to view digital images and digital image viewing is
considered an important component of practice in many fields, there is not guidance from
the literature regarding what geometric zoomable interaction techniques are best suited

for navigating large images, and in particular for the task of finding features of interest
within an image.
3. MATERIALS AND METHODS
The study was comprised of both quantitative and qualitative parts. The quantitative part
was the experiment to measure the users’ speed at finding features in large images when
using different interaction techniques. There were three qualitative parts of the study:
observations by the experimenter of the subjects during the experiment, a post
experiment questionnaire, and a qualitative comparison by the subject of all five
interaction techniques on a single test image.
3.1 Pilot Experiment
To ensure we had developed the image viewing techniques effectively and chosen
appropriate targets within the images, we ran a pilot experiment. Three observers
participated in the pilot. They each viewed 60 images using each of the five fast versions
of the techniques to ensure that appropriate targets had been selected and to identify
problems with the implementations of the techniques themselves. They then viewed 10
images using each of the five slow versions of the techniques. Feedback from the pilot
observers was used to refine the techniques and to eliminate target choices that, on
average, were extremely simple or extremely difficult to locate. Measurements of the
pilot observers completion times were also used to estimate the number of training trials
needed to reach proficiency with the techniques. Once the experiment began, the
techniques and targets were fixed.
3.2 Experimental Design
3.2.1 Quantitative
This study evaluated five different interaction techniques at two update rates (fast, slow)
to determine which technique and update rate combinations were the most effective in
terms of speed at finding a target within the image. Because the same interaction
technique when used at a different update rate can have a substantially different user
interaction, each of the combinations is treated as a separate method. An ANOVA study
design using a linear model for the task completion time was chosen to compare the
performance of the ten different methods.
The task of finding a small target within a large image is naturally variable, affected
by the image contents, and each observer’s individual searching style. To minimize

variance in each user’s performance, users received a significant amount of training to
become proficient with the interaction method on which they would be tested. The
number of study trials was also chosen to be large enough to help control for this
variability. This led to having each user only perform with a single interaction method,
because the alternative (a within subject design) would have been prohibitive due to the
number of trials required if each participant was to test with all ten interaction methods.
A total of forty participants were recruited by flyers and email for the study.
Participants had to be over 18 years of age, and have good vision (corrected was
acceptable). They were students, faculty and staff from the University of North Carolina
at Chapel Hill (primarily graduate students from the School of Information and Library
Science). Thirty one participants were women and nine were men.
Each participant completed 5 demonstration images, 40 training images, and 120
study images for the experiment. They were each randomly assigned one of the ten
interaction methods, which they used for the entire study. At the beginning of the first
session, the participant completed an IRB consent form. Then the experimenter
explained the purpose and format of the study, and demonstrated the image viewing tool
with the five-image demonstration set. Next, the participant completed the training set of
40 images, followed by the study set. The study set consisted of 120 images in a
randomized order, partitioned into four sets. The presentation order of the four image
sets was counterbalanced across observers. Participants read images in multiple sessions.
Most observers read in 5 separate sessions (training set and four study sets), although
some completed it in fewer by doubling up sessions. Participants were required to take
mandatory breaks (10 minutes per hour) during the sessions to avoid fatigue. At the
beginning of each new session, the participant was asked to complete a five-image
retraining set to re-familiarize them with the interaction tool before beginning the next
study image set. If time between sessions exceeded one week, participants were required
to complete a 10-image retraining set.
3.2.1 Qualitative
During the experiment, the researcher took notes on the observer’s performance,
problems they encountered and unsolicited comments they made during the test. When
participants had completed all of the image sets, they completed the post-experiment
questionnaire (Appendix A.1). Last, they were asked to try all of the interaction
techniques using an additional test image to compare the methods and then rank them.

3.3 Images, Targets, Screen Size
To test the viewing mechanisms, participants were asked to find targets, or specific
details, within a number of digital grayscale photographs of Orange County, North
Carolina. These photographs are 5000 x 5000 pixels in size and were produced by the
United States Geological Survey. Since participants were asked to find small details
within the images, knowledge of Orange County did not assist participants in task
completion. The targets were subparts of the full digital photograph and are 170 x 170
pixels in size. Target locations were evenly distributed across the images, so that results
from participants who began each search in a particular location would not be biased.
Appendix A.2 shows the distribution of targets within the images, for the 160 images in
the training and test sets. The screen resolution of the computer display was 1152x864
pixels, and the actual size of the display area for the image was 1146x760 pixels. Thus,
only about 3.5% of the full resolution image could be shown on the screen at one time.
Appendix A.3 shows a full image and an example target from that image.
3.4 Presentation and Zoom Levels
We tested five types of image viewing techniques in the study. Each technique supported
the following capabilities:
• ability to view both the image and the visual target at all times. The visual
target was always on screen at full resolution, so that if participants were
viewing the image at full resolution they would be able to see the target at an
identical scale.
• the entire image could be seen at once (by shrinking the image to fit the screen).
• all parts of the image were able to be viewed at full resolution, although only a
small portion of the full image could be seen at once when doing this.
• ability to choose a portion of the image as the target and get feedback as to
whether the selection was correct or not.
An example screen shot is shown in Figure 1, showing the Pointer interaction method at
zoom level 3. The target can be seen in the upper right corner.
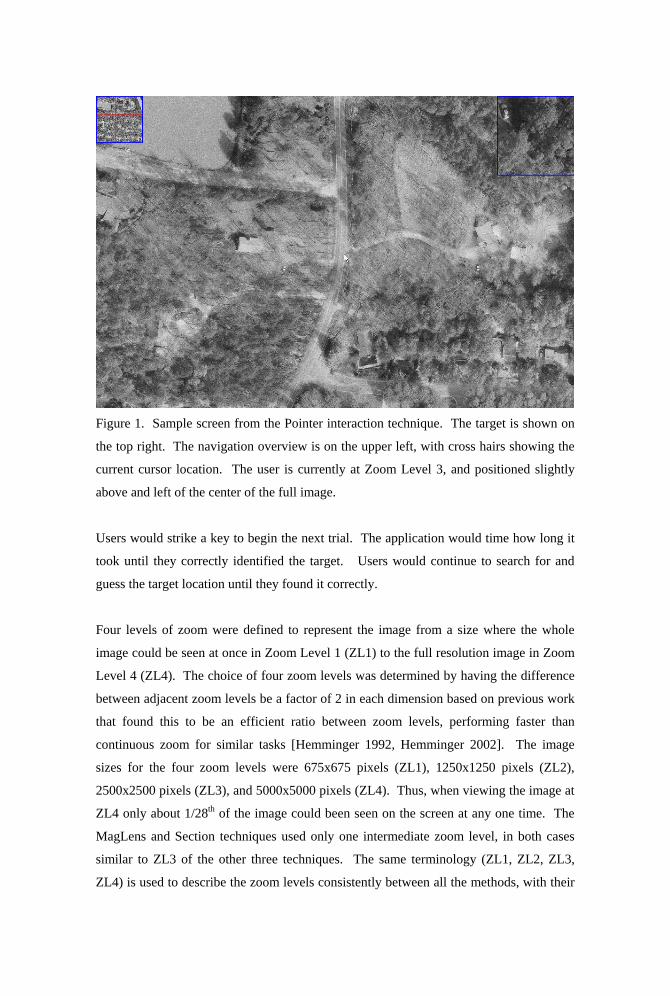
Figure 1. Sample screen from the Pointer interaction technique. The target is shown on
the top right. The navigation overview is on the upper left, with cross hairs showing the
current cursor location. The user is currently at Zoom Level 3, and positioned slightly
above and left of the center of the full image.
Users would strike a key to begin the next trial. The application would time how long it
took until they correctly identified the target. Users would continue to search for and
guess the target location until they found it correctly.
Four levels of zoom were defined to represent the image from a size where the whole
image could be seen at once in Zoom Level 1 (ZL1) to the full resolution image in Zoom
Level 4 (ZL4). The choice of four zoom levels was determined by having the difference
between adjacent zoom levels be a factor of 2 in each dimension based on previous work
that found this to be an efficient ratio between zoom levels, performing faster than
continuous zoom for similar tasks [Hemminger 1992, Hemminger 2002]. The image
sizes for the four zoom levels were 675x675 pixels (ZL1), 1250x1250 pixels (ZL2),
2500x2500 pixels (ZL3), and 5000x5000 pixels (ZL4). Thus, when viewing the image at
ZL4 only about 1/28th of the image could been seen on the screen at any one time. The
MagLens and Section techniques used only one intermediate zoom level, in both cases
similar to ZL3 of the other three techniques. The same terminology (ZL1, ZL2, ZL3,
ZL4) is used to describe the zoom levels consistently between all the methods, with their

specific differences described in the next section. Appendix A.4 contains an illustration
of the four zoom levels. Resizing the image between zoom levels was done via a bilinear
interpolation.
3.5 Interaction Techniques
Based on our review of the literature and techniques commonly available, we chose five
different interaction techniques to evaluate.
ScrollBar
The ScrollBar technique allows the participant to pan around the picture by manipulating
horizontal and vertical scroll bars at the right and bottom edges of the screen, similar to
many current image and text viewing applications, in particular Microsoft Office
applications. Zooming in and out of the image is accomplished using two on screen
buttons (ZoomIn and ZoomOut), located in the upper left-hand corner of the screen. Four
levels of zoom were supported. Image zooming is centered about the previous image
center.
MagLens
The MagLens technique shows the entire image (ZL1) while providing a square area
(512x512 pixels) that acts as a magnifying glass (showing a higher resolution view
underneath it). Using the left mouse button the participant may pan the MagLens over
the image to view all parts of the image at the current zoom level. Clicking the right
mouse button dynamically changes the zoom level at which the area beneath the
MagLens is viewed. Only three levels of zoom were supported (ZL1, ZL3, ZL4) because
the incremental difference of using ZL2 for the MagLens area was not found to be
effective in the pilot experiment and was eliminated. Thus, if the zoom level is set to
ZL1 the participant is viewing the entire image at ZL1 with no part of the image zoomed
in to see higher resolution. If the participant clicks once, the MagLens square would then
show the image below it at ZL3 while the image outside of the MagLens stays at ZL1.
Clicking again would increase the zoom of the MagLens area to ZL4, and a further click
cycles back to ZL1 (no zoomed area). This interface style is found on generic image
processing applications, especially in the sciences, engineering and medicine.

Pointer
The Pointer technique allows the participant to zoom in and out of the image by clicking
the right (magnify) and left (minify) mouse buttons. Zooming is centered on the location
of the pointing device (cursor on screen). Thus, the user can point to and zoom in
directly on an area of interest as opposed to centering it first and then zooming. The
Pointer method supports all four zoom levels. Panning is accomplished by holding the
left mouse button down and dragging the cursor. We found that many users strongly
identified with one of two mental models for the panning motion: either they were
grabbing a viewer above the map and moving it, or they were grabbing the map and
moving it below a fixed viewer. This corresponded to the movement of the mouse drag
matching the movement of the view (a right drag caused rightward movement of the
map) or the inverse (right drag caused leftward map movement), respectively. A
software setting controlled this. The experimenter observed their initial reaction during
the demonstration trials, and configured the technique to their preferred mental model.
The individual components (panning by dragging) and pointer based zooming are often
implemented; although this particular combined interface is not commonly available. It
is similar to the original Pad++ interface [Bederson 1994] which used the center and right
mouse buttons for zooming in and out. The Pointer interface used in this study is the
same one qualitatively chosen as the best of these same five (fast) techniques in a medical
imaging study [Hemminger 2003].
ArrowKey
The ArrowKey technique works similarly to the Pointer technique, but uses the keyboard
for manipulation instead of the mouse. The arrow keys on the keypad are used to pan
the image in either a vertical or horizontal direction in small discrete steps. As with the
Pointer interface a software toggle controlled the correspondence between the key and the
direction of movement and was configured to match the user’s preference. The
ArrowKey method supported all four levels of zoom. Zooming is accomplished by
clicking on the keypad Ins key (zoom in) or Del key (zoom out). The technique always
zooms into and out of the image at the point that is at the center of the screen. This
interface sometimes serves as a secondary interface to a pointer device for personal
computer applications; it is more common as a primary interface on mobile devices
which have only small keypads for input.

Section
This technique conceptually divides each image into equal size sections, and provides
direct access to each section through the single push of a key. A section of keys on the
computer keyboard were mapped to the image sections so as to maintain a spatial
correspondence, i.e. pushing the key in the upper right causes the upper right section of
the image to be shown at a higher resolution. In our experiment, the screen area was
divided into 9 rectangles, which were mapped to the 1-9 buttons on the keyboard’s
numeric keypad. The upper left-hand section of the image would be selected and
displayed at ZL3 by hitting key 7, the upper center by key 8, the upper right by key 9, and
so forth. Once zoomed in to ZL3, the participant may zoom in further to ZL4 to see a
portion of the ZL3 image at full resolution by striking another one of the 1-9 keys. Thus,
this technique allows the participant to view a total of eighty-one separate full resolution
sections, all accessible by two keystrokes. For instance, to see the upper rightmost of 81
sections, the participant would hit 9 followed by 9. To zoom out of any section, the
participant presses the ZoomOut (insert) key, on the numeric keypad. An overlap of the
sections is intentionally built-in at the section boundaries, as illustrated in Appendix A.5.
This allows participants to access targets that may otherwise have been split across
section boundaries. The Section method supports three levels of zoom (ZL1, ZL3, and
ZL4) similar to MagLens, because the pilot experiment found the use of ZL2 to be a
detriment for this technique. This interaction is sometimes implemented with fewer
sections (for example quadrant based zooming). It is less common than the other choices,
and probably more suited to mobile devices that have numeric keypads but not attached
pointing devices.
Navigation Overview
Many systems provide a separate navigation window showing the user what portion of
the entire image they are currently viewing [Plaisant et al. 1995, North et al. 1996]. In
our work evaluating several zoomable interfaces for medical image display [Hemminger
2003], we found that when the zooming interactions operated in real-time and the full
image could be accessed in less than one second (for instance via two mouse clicks or
two keystrokes), users preferred to operate directly on the image instead of looking to a
separate navigation view. Hornbaek [2002] reported similar findings for an interface
with a larger number of incremental zoom levels (20). They found that users actually
performed faster without the navigation view and switching between the navigation and
the detail view used more time and added complexity to the task. Because some of the

techniques tested in this study (particularly the slow update rate ones) might not perform
as well without a navigation view, a navigation window (100x100 pixels in the upper left
corner) was included as part of all of the techniques. Based on the pilot study and
guidelines established for navigation overview windows [Beard and Walker 1990,
Plaisant et al. 1995; Carr et al. 1998; Baldonado et al. 2000, Hornbaek et al. 2002] the
overview window was constructed so that it was tightly coupled to the detail window,
showed the current location of the cursor, and kept small to leave as much of the screen
real estate for the detail window as possible, which was crucial for this study’s task.
We developed ten viewing tools corresponding to the ten methods and implemented them
as Java 2.0 programs, running on a Dell 8200 computer with 1 Gbyte of memory, and a
20” color Sony Trinitron CRT monitor. The viewing tools, an example image and
instructions are available at http://ils.unc.edu/bmh/pubs/PanZoom/.
4. RESULTS
Quantitative
We analyzed the training (first 40 images) and test images (numbered 41-160) to see if
the observers reached asymptote performance with their interaction method by the end of
their training, so that their test results would not be biased by observers continuing to
significantly improve during the study trials. Time for each subject was modeled using
least squares as a function of trial number with a modified Michaelis-Menten function
which is non-linear, monotonic and decreasing to an asymptote. All observers reached
asymptote performance by the end of training with most achieving it within the first 10-
15 training cases. An example observer’s reading times with asymptote curve fit is seen
in Appendix A.6.
The primary quantitative analysis was to compare the ten different methods (five
techniques each at two speeds) based on how quickly observers could complete the
feature finding task using that method. Table 1 summarizes the mean time and standard
deviation for each method, calculated across all observers and all trials. To determine
whether a particular method performed faster than another, the mean task completion
times were compared using the SAS (Cary, NC) GENMOD repeated measures regression
test (1 degree of freedom, complete analysis in Appendix A.7). A P-value of 0.05 or less
indicates the null hypothesis--that the techniques have the same performance, is rejected,
and that the performance of the two techniques is statistically significantly different from
each other. Using the results from this analysis we grouped the methods into

performance groups. Table 1 shows the mean task completion times in seconds averaged
across all observers for each method, and the performance groupings. Methods were
placed in the same performance group if they had similar mean times, and did not have
statistically significant differences in mean times from all other members of the
performance group (using SAS GLM Tukey’s Studentized Range Test). The methods
segregated into four groups (Table 1). Part of the reason for grouping the techniques is
that the group rankings are probably more informative than the individual rank ordering
of methods, due to the large standard deviations in detection times due to image and
observer effects, as seen in Table 1. A further regression analysis was conducted to
compare these resulting groups. All of the groups were found to be statistically
significantly different from one another (p-value < 0.05), with the exception of group 1
versus group 2. A power analysis based on the existing data shows that the study would
have to increase from 4 to 7 observers per method in order to reduce the variance
sufficiently to demonstrate the difference between group 1 and group 2 at a statistically
significantly level.
Table I. The mean task completion times
Performance Group Method Name Mean Time StdDev
1 ArrowKey Fast 76 76 1 Pointer Fast 79 100 1 ScrollBar Fast 84 108 2 Section Fast 97 127 2 Section Slow 97 131 2 Scrollbar Slow 98 94 3 MagLens Slow 117 165 3 ArrowKey Slow 119 134 3 Pointer Slow 128 146 4 MagLens Fast 155 176
A regression analysis was also performed to examine the significance of the other two
factors (observer and image). The largest determining factor was the method, with the
observer and image effect each approximately one third the magnitude. Table 2 shows
how much each of the main effects contributes to the determining the speed of detecting
targets.
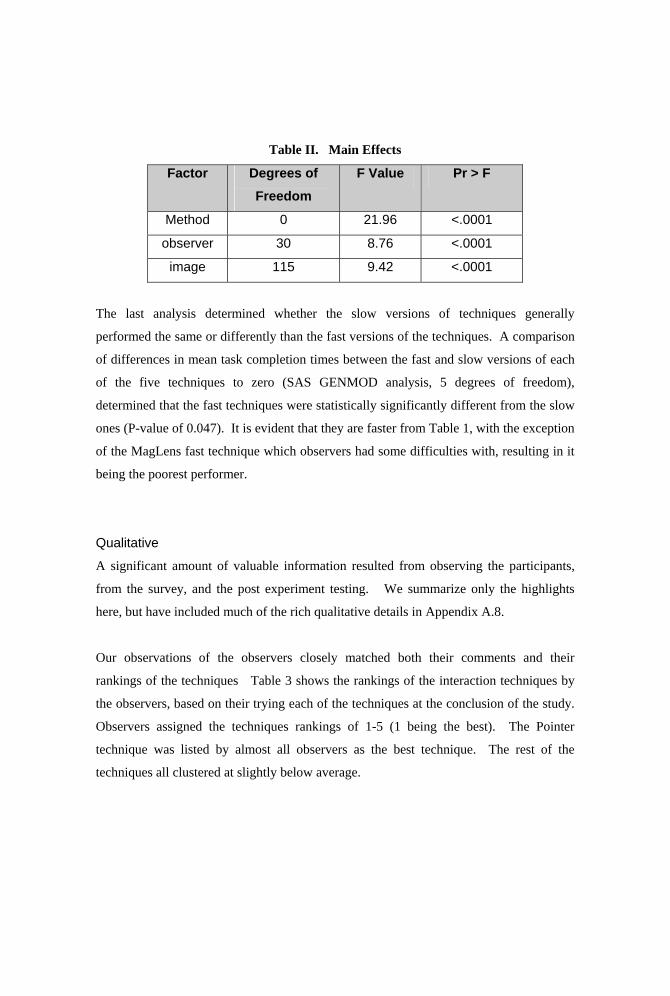
Table II. Main Effects
Factor Degrees of Freedom
F Value Pr > F
Method 0 21.96 <.0001
observer 30 8.76 <.0001
image 115 9.42 <.0001
The last analysis determined whether the slow versions of techniques generally
performed the same or differently than the fast versions of the techniques. A comparison
of differences in mean task completion times between the fast and slow versions of each
of the five techniques to zero (SAS GENMOD analysis, 5 degrees of freedom),
determined that the fast techniques were statistically significantly different from the slow
ones (P-value of 0.047). It is evident that they are faster from Table 1, with the exception
of the MagLens fast technique which observers had some difficulties with, resulting in it
being the poorest performer.
Qualitative
A significant amount of valuable information resulted from observing the participants,
from the survey, and the post experiment testing. We summarize only the highlights
here, but have included much of the rich qualitative details in Appendix A.8.
Our observations of the observers closely matched both their comments and their
rankings of the techniques Table 3 shows the rankings of the interaction techniques by
the observers, based on their trying each of the techniques at the conclusion of the study.
Observers assigned the techniques rankings of 1-5 (1 being the best). The Pointer
technique was listed by almost all observers as the best technique. The rest of the
techniques all clustered at slightly below average.

Table III. Observers’ Rankings of Techniques on a 1-5 Scale
Technique Average Ranking
Pointer 1.77
MagLens 3.12
ArrowKey 3.28
ScrollBar 3.30
Section 3.51
Reasons the observers gave for favoring the Pointer method was the natural control it
gave them in panning around the image, precise control of the zooming, maintaining
context (location in the overall image), and speed of operations. The ArrowKey method
was also favored for its speed, and precise control of panning and zooming. Participants
did not rank it as high because they found the panning motion to be “less smooth” and it
was “harder to scan” than with the Pointer method. They did find the ArrowKey
technique very effective for systematic searching. Some users found the MagLens
interaction desirable because you always maintained the context of where you were in the
overall full resolution image. It was also considered to be a more familiar paradigm than
some of other the techniques like the Section. However, many users felt it was difficult
to use in practice, saying it was “hard on the eyes”, “is a pain”, and several observers who
used it complained that it was disorienting to use, with one becoming dizzy as a result.
The ScrollBar technique was considered “familiar” yet “old-fashioned”. Users felt it
gave them good control, but with too limited flexibility (i.e. only being able to pan in one
dimension at a time versus two for most of the other techniques). Only two of the eight
participants who had used the technique in the study ranked it in their top two choices.
The Section technique was the least favored of all the techniques. Panning of the image
is not directly supported by this technique, in that users have to step up a zoom level and
then back down again in an adjacent section to effect a “pan” operation. Users felt this
did not allow a natural panning exploration to occur, that too many button clicks were
required to pan around, and that the constant zooming in and out frequently caused a loss
of context.
The navigation view was very rarely used except for experimenting with it in training.
The few instances where it was observed being used during the test cases were in the
slow versions.

5. DISCUSSION
Our results indicate that some interaction techniques perform quantitatively better for
feature detection types of tasks. The performance of interaction techniques, however,
will clearly depend on the task, and these results may not hold for other types of tasks.
Integrating the results from the quantitative and qualitative portions of the study did yield
several consistent overall themes, and a clearer understanding of the benefits and
shortcomings of the individual techniques.
Overall Themes
Intuitive, Easy to Use Interface Favored: From the qualitative feedback, users
expressed clear preferences for intuitive, easy to use, and highly interactive user interface
techniques. There were common elements to the techniques that performed well
quantitatively and were preferred qualitatively. The top three performing techniques
supported natural and easy ways to perform image panning. They supported both
systematic and intuitive target searching. The most preferred method, Pointer, was
favored in a large part because it had the most natural interaction for panning, with hand
motion of the pointer corresponding to moving the image viewpoint. The most preferred
methods (Pointer, ArrowKey) supported easy control of zooming, in that zoom levels
could be selected without moving the observer moving their hand. Techniques that had
more challenging mental models (Section) or difficult interactions (MagLens) were not
favored, and did not perform as well.
Simple Interface Favored: Techniques that minimized interactions (keystrokes, mouse
clicks, hand motions) tended to perform better, as might be predicted by GOMS [Card
1983] modeling of the techniques. The Pointer and ArrowKey had the most efficient
interactions due to the hand remaining on input device (mouse, or arrowkeys,
respectively), and only one interaction (click) is required for both pan and zoom
operations. The Scrollbar method was perhaps the least efficient due to having to move
the pointer between three areas and click on small controls (vertical and horizontal
scrollbars and the zoom buttons). This was reflected in the user’s comments and
rankings which made it clear that they did not favor this technique because it did not
support natural and quick panning and was too cumbersome for more generalized tasks.
However, the method performed well quantitatively for the feature detection task because
all the users of this technique adopted a systemic way to scan the image (they scrolled
across the image a “row” at a time using only one scrollbar control).

Faster, Real-time Interactions Preferred: Users clearly favored the faster update rate
versions of techniques, and also performed better with them in all cases except the
MagLens technique, where the fast version had worse performance likely due to the users
losing context and getting confused about what part of the image they had already
viewed.
Individual Techniques
Pointer: This was one of the top performing techniques and the clear favorite of the
observers. It’s natural, easy to use interface lends itself well both to systemic tasks like
the feature detection task of this experiment, and more general tasks, such as
manipulating large images or following map driving directions. The panning part of the
Pointer interaction (dragging the mouse) is becoming more common, however, having
the zoom interaction on the mouse as well is not supported. Generally a separate
interaction is required, as in Google Maps, which zooms by mouse clicks on a scale on
the screen, or keystrokes on the keyboard. This is less efficient than having both the
zoom and the panning operations accomplished from the pointing device [Hemminger
1992]. An easy way to do this is to zoom via the scroll wheel now commonly found on
mouse devices. This technique is strongly dependent on a fast interaction. The natural
connection between the panning motion of the mouse and the movement of the image on
the screen was lost due to the update delay in the slow version. The result was that the
slow version was not favored by users and was next to last in performance.
ArrowKeys: This was the one of the top performers and while it was significantly
behind the Pointer technique in user preference, it was generally favorably reviewed by
observers. While this technique was not as natural as the mouse panning interaction of
the Pointer technique, the small discrete movements (left, right, up, down) were easily
understood and utilized by the observers. As with the Pointer method, the slow version
of this technique did not perform as well because of the reduced interactivity of the pan
operation.
Scrollbar: The Scrollbar method was familiar to users. They found it satisfactory for
one dimensional scrolling, as is commonly found in text viewers. However, it was
generally viewed as cumbersome for navigating in two dimensions because of having to
separately manipulate the vertical and horizontal scrollbar controls. In this experiment,
users were able to adapt the task to a series of systematic searches along “rows” of the
image, reducing their usage to manipulating a single scrollbar control to move across one
“row”. This allowed them to perform efficiently with both the fast and the slow versions
of the technique.
Section: The Section method was the least favored by the observers because most were
not familiar with the technique, and the mental model was not as natural to them.
However, users were able to become efficient with this technique, and both the fast and
the slow version were in the top five in performance. It appeared that the slow version
performed as well as the fast version because users tended to not rely on many quick
panning motions, but instead adopted a systematic section by section search pattern,
which was not significantly affected by the difference in the slow and fast update rates.
MagLens: While this technique was familiar to most users, and favored by some, it was
generally not preferred by those who used it in the experiment, and it performed the worst
overall of all the techniques. Interestingly, the fast version was by far the slowest in
performance. Users of the fast version tended to try to interactively pan more. When
they did this, they lost their position (context), and often became disoriented with respect
to what territory they had covered already. The users of the slower version tended to
adopt a more methodical search pattern for covering the image at a high zoom level, and
ended up being more efficient.
This experiment dealt with a particular feature detection task, and given sufficient
training users were, in most cases, able to adapt the technique they utilized to efficiently
perform the task. For most of the techniques, this resulted in the users scanning out the
image in rows, with the height of the row being the size of the image seen at either ZL3
or ZL4 (depending on user preference). This type of serialized scanning interaction is
formalized in several disciplines, for instance it was popularized by Laszlo Tabar as a
method of training radiology residents in detecting microcalcifications in mammography.
The Arrowkey, Scrollbar, and Section techniques support this type of interaction
especially well. They are less well suited to support navigation that requires following
objects like terrain in the image, or roads on a map. Observers commented that the
Pointer method seemed much more effective for these types of interactions as well as for
more general purpose navigation.

Several factors affect the choice of the technique to utilize in a given situation. In
addition to the task, the update rate of the display device, and the types of interactions
supported by the display device (keyboard only, cellphone/PDA keypad only) are key
factors. For devices such as personal computers that commonly have pointing devices
and fast update rates, the Pointer method would likely be an effective choice across a
wide range of applications. If the update rate is not fast, then a different technique than
the Pointer method may be more optimal (e.g. Section or Scrollbar). The ArrowKey and
Section interfaces do not require a pointing device, and thus may be better suited for
small mobile devices such as cellphones and PDAs.
Since the fast versions of the techniques performed significantly better than the slow
versions, there is not a single technique that can be considered the best choice for
working well under both update conditions. Thus, applications that may be used under
both conditions should consider offering more than one interface technique to the user.
For this particular task, if only a single technique could be supported then the Section and
Scrollbar techniques might be good candidates since both the slow and fast versions of
these techniques were in the top two performance groups.
ACKNOWLEDGMENTS
Thanks to the Interaction Design Lab which hosted the space for the observer experiment,
and to Chris Weisen of the Odum Institute, who helped with the statistical analysis.
Prior work studying different interaction techniques for radiology workstation designs
helped lay the groundwork for this study. This included grants from Fischer Imaging,
and Hologic as well as federally funded grants NIH RO1 CA60193-05, DOD DAMD 17-
94-J-4345, NIH RO1-CA 44060, and NIH PO1-CA 47982.
FUTURE WORK
It would be desirable to test these techniques on additional task types. As a next step we
plan to model our existing interaction types with a GOMS model, with then compare the
model’s predictions with the raw data we acquired as part of the experiment (mouse click
and keystroke events).

APPENDIX
A.1: Post Experiment Questionnaire
A.2: Distribution of Targets within Images
A.3: Target and Original Image
A.4: Zoom Levels
A.5: Section Zoom Overlap
A.6: Example Observer’s Reading Times
A.7: Method Versus Completion Time Analysis
A.8: Observer Qualitative Comments
REFERENCES ACKERMAN, R. 2000. Commercial imagery aids Afghanistan operations. Signal, 56(4), 16-19. Adobe PhotoShop. 2005. Available at http://adobe.com/. ANDRICHOLE, K.P. 2002. Productivity and cost assessment of computed radiography, digital radiography, and
screen-film for outpatient chest examinations. Journal of Digital Imaging, 15(3), 161-9. ArcView GIS. 2005. Environmental Systems Research Institute, Inc. Available at
http://www.esri.com/software/arcgis/arcview/. ARMITAGE, L. H. AND ENSER, P. G. B. 1997. Analysis of user need in image archives. Journal of Information
Science, 23(4), 287-99. BAUDISCH, P., GOOD, N., BELLOTTI, V., SCHRAEDLEY, P. 2002a. Keeping things in context: a comparative
evaluation of focus plus context screens, overviews, and zooming. Proceedings of the 2002 SIGCHI conference on Human factors in computing systems: Changing our world, changing ourselves, April 20-25, Minneapolis, Minnesota. XXXX
BAUDISCH, P., GOOD, N., BELLOTTI, V., SCHRAEDLEY, P. 2002b. Focus and Context: Keeping things in context: a comparative evaluation of focus plus context screens, overviews, and zooming. Proceedings of the SIGCHI 2002 conference on Human factors in computing systems: Changing our world, changing ourselves, 259 – 266.
BEARD, D.V., BROWN, P., HEMMINGER, B.M., MISRA, R. 1991. Scrolling Radiologic Images: Requirements, Designs, and Analyses. Computer Assisted Radiology (CAR) Berlin July 3-6. XXXX
BEARD, D.V., HEMMINGER, B.M., DENELSBECK, K.M., BROWN, P.H. 1992. A Time Motion Comparison of Several Radiology Workstation Designs and Film. S/CAR 1992 Proceedings, Symposia Foundation, pp588-594.
BEARD, D.V., HEMMINGER, B.M., PERRY, J.R., MAURO, M.A., MULLER, K.E., WARSHAUER, D.M., SMITH, M.A., ZITO, A.J., 1993. Interpretation of CT studies: single-screen workstation versus film alternator. Radiology 187(2):565-9.
BEARD, D.V., HEMMINGER, B.M., PISANO, E.D., DENELSBECK, K.M., WARSHAUER, D.M., MAURO, M.A., KEEFE, B., MCCARTNEY, W.H., WILCOX, C.B. 1994. Computed tomography interpretations with a low-cost workstation: a timing study. Journal of Digital Imaging, 7(3):133-9.
BEARD, D. B. AND WALKER, J. Q. 1990. Navigational techniques to improve the display of large two-dimensional spaces. Behav. Inform. Techn. 9, 6, 451--466.
BEDERSON, B.B. AND HOLLAN, J. 1994. Pad++: a zooming graphical interface for exploring alternate interface physics, Proceedings of the 7th annual ACM symposium on User interface software and technology (UIST), Marina del Rey, California, p.17-26.
BEDERSON, B.B., MEYER, J., GOOD, L. 2000. Jazz: an extensible zoomable user interface graphics toolkit in Java. Proceedings of the 13th annual ACM symposium on User interface software and technology (UIST), San Diego, California. p.171-180
BERNSTEIN, P. 1998. Now that I’ve got it, what do I do with it? No-nonsense image utilities for non-techies. Online, 22(1), 86-90.
CARD, S. K., MORAN, T. P., NEWELL, A. 1983. The Psychology of Human-Computer Interaction. Lawrence Erlbaum, Hillsdale, N.J.

COCKBURN, A., SAVAGE, J., WALLACE, A. 2005. Basic level interaction techniques: Tuning and testing scrolling interfaces that automatically zoom. Proceedings of the SIGCHI conference on Human factors in computing systems. 71-80.
COMBS, T.T.A., BEDERSON, B.B. 1999. Does zooming improve image browsing?. Proceedings of the fourth ACM conference on Digital libraries. XXXX
EADIE, C., HERD, A., STALLARD, S. 2000. An investigation into digital imaging in assessing cosmetic outcome after breast surgery. Journal of Audiovisual Media in Medicine, 23(1), 12-16.
FARR, C. 2000. Digital Dentistry in the 21st Century. Dentistry Today, 19(6), 96-101. FFView. 2005. Available at http://www.feedface.com/projects/ffview.html. FISCHER, U., BAUM, F., OBENAUER, S., LUFTNER-NAGEL, S., VON HEYDEN, D., VOSSHENRICH, R., GRABBE, E.
2002. Comparative study in patients with microcalcifications: full-field digital mammography vs screen-film mammography. European Radiology, 12(11), 2679-83.
FOLEY D.W., JACOBSON D.R, TAYLOR A.J., et al. 1990. Display of CT Studies on a Two Screen Electronic Workstation Versus A Film Panel Alternator: Sensitivity and Efficiency Among Radiologists. Radiology, Vol 174, 769-773.
FRANK, A. U., TIMPF, S. 1994. Multiple representations for cartographic objects in a multi-scale tree---an intelligent graphical zoom. Comput. Graph. 18, 6, 823--829.
FURNAS, G.W. 1986 Generalized fisheye views. ACM SIGCHI Bulletin, Proceedings of the SIGCHI conference on Human factors in computing systems, Volume 17 Issue 4, 16-23.
Google Maps. 2005. Available at http://maps.google.com/. GOUGH, V. 1999. Large Image Manipulation Project: Designing a new library for processing of large images
using a minimal amount of memory. Linux Journal, January 1999. GUTWIN, C, FEDAK, C. 2004. Interacting with big interfaces on small screens: a comparison of fisheye, zoom,
and panning techniques. Proceedings of the 2004 conference on Graphics interface GI '04. XXXX HASTINGS, S. K. 2000. Digital image managers: a museum/university collaboration. First Monday, 5(6). HEMMINGER, B.M. 2003. Softcopy Display Requirements for Digital Mammography. Journal of Digital
Imaging, Sep;16(3):292-305. HEMMINGER, B.M., MOLINA, P.L., EGAN, T.M., DETTERBECK, R.C., MULLER, K.E., COFFEY, C., LEE, J.K.T.
2005. Assessment of Real-Time 3D Visualization for Cardiothoracic Diagnostic Evaluation and Surgery Planning. Journal of Digital Imaging, Vol 18, No 2, pp145-153.
HEMMINGER, B.M. 1992. Design of Useful and Inexpensive Radiology Workstations,” S/CAR 1992 Proceedings, Symposia Foundation.
HERMANN, K. P., OBENAUER, S., FUNKE, M., GRABBE, E. H. 2002. Magnification mammography: a comparison of full-field digital mammography and screen-film mammography for the detection of simulated small masses and microcalcifications. European Radiology, 12(9), 2188-91.
HEYDEN, J. E., CARPENDALE, M. S. T., INKPEN, K., & ATKINS, M. S. 1998. Visual presentation of magnetic resonance images. Proceedings of the conference on Visualization ’98, October 1998, 423-426.
HORNBÆK, K., BEDERSON, B. B., AND PLAISANT, C. 2002. Navigation patterns and usability of zoomable user interfaces with and without an overview. ACM Trans. Comput.-Hum. Interact. 9, 4 (Dec. 2002), 362-389. DOI= http://doi.acm.org/10.1145/586081.586086.
HORNBÆK, K. AND FRØKJÆR, E. 2003. Reading patterns and usability in visualizations of electronic documents. ACM Trans. Comput.-Hum. Interact. 10, 2 (Jun. 2003), 119-149. DOI= http://doi.acm.org/10.1145/772047.772050.
HOWARD, P. 1991. Coast Guard studies “digital imaging” systems. Sea Power, 34(8), 48. KENNEY, A. R., RIEGER, O. Y. 2000. Preserving digital assets: Cornell’s Digital Image Collection Project. First
Monday, 5(6). Mapquest. 2005. Available at http://www.mapquest.com. MARCHEVSKY, A.M., DULBANDZHYAN, R., SEELY, K., CAREY, S., DUNCAN, R.G. 2002. Storage and
distribution of pathology digital images using integrated web-based viewing systems. Arch Pathol Lab Med. May;126(5):533-9.
MCKEOWN, D., AND DENLINGER, J. 1982. Graphical tools for interactive image interpretation. Proceedings of the 9th annual conference on Computer Graphics and Interactive Techniques. 16(3):189-198.
Microsoft Office Picture Manager. 2005. Available at http://microsoft.com. Microsoft Paint. 2005. Part of Microsoft XP Accessories. Available at http://microsoft.com. Museum of Modern Art (MoMA). 2005. Available at http://www.moma.org. National Imagery and Mapping Agency (NIMA). 2005. NGA Raster Roam tool. Available at
http://www.nima.mil/. NORTH, C., SHNEIDERMAN, B., PLAISANT, C. 1996. User controlled overviews of an image library: a case study
of the visible human. Proceedings of the first ACM international conference on Digital libraries, 74-82.PISANO, E.D., COLE, E.B, KISTNER, E.O., MULLER, K.E., HEMMINGER, B.M., BROWN, M.L., JOHNSTON, R.E.,
KUZMIAK, C.M., BRAEUNING, M.P., FREIMANIS, R.I., SOO, M.S., BAKER, J.A., WALSH, R. 2002. Interpretation of Digital Mammograms: A Comparison of Speed and Accuracy of Soft-Copy Versus Printed-Film Display. Radiology, 223: 483-488.
PERLIN, K., AND FOX, D. 1993. Pad: an alternative approach to the computer interface, Proceedings of the 20th annual conference on Computer graphics and interactive techniques, September 1993, p.57-64.

PLAISANT, C., CARR, D., AND SHNEIDERMAN, B. 1995. Image-Browser Taxonomy and Guidelines for Designers. IEEE Softw. 12, 2 March, 21-32. DOI= http://dx.doi.org/10.1109/52.368260
RAMAN, B., RAMAN, R., RAMAN, L., AND BEAULIEU, C.F. 2004. Radiology on Handheld Devices: Image Display, Manipulation, and PACS Integration Issues. Radiographics 24:299-310.
REINER, B.I., SIEGEL, E.L., HOOPER, F.J., POMERANTZ, S., DAHLKE, A., RALLIS, D. 2001. Radiologists' productivity in the interpretation of CT scans: a comparison of PACS with conventional film. AJR Am J Roentgenol. Apr;176(4):861-4.
SCHAFFER, D., ZUO, Z., GREENBERG, S., BARTRAM, L., DILL, J., DUBS, S., ROSEMAN, R. 1996. Navigating hierarchically clustered networks through fisheye and full-zoom methods. ACM Transactions on Computer-Human Interaction (TOCHI), v.3 n.2, p.162-188.
Smithsonian Institute. 2005. Available at http://www.smithsonian.org. United States Geological Survey (USGS). 2005. The National Map Viewer. Available at http://www.usgs.gov/. WATANABE, M., NAKAYAMA, O., KISHI, N. 1996. A bird’s-eye map display for car navigation. Automotive
Engineering, May, 59-63. WARE, C. AND FLEET, D. 1997. Context sensitive flying interface. Proceedings of the 1997 symposium on
Interactive 3D graphics, 127-130.