comparison of human resource management practices and
TRANSCRIPT

COMPARISON OF HUMAN RESOURCE MANAGEMENT PRACTICES AND
PERCEPTIONS OF AGRI-BUSINESS EMPLOYEES ACROSS
THREE INDONESIAN SUBCULTURES
A Dissertation
by
MARK CHRISTOPHER KELLY
Submitted to the Office of Graduate Studies of Texas A&M University
in partial fulfillment of the requirements for the degree of
DOCTOR OF PHILOSOPHY
May 2008
Major Subject: Agricultural Education

COMPARISON OF HUMAN RESOURCE MANAGEMENT PRACTICES AND
PERCEPTIONS OF AGRI-BUSINESS EMPLOYEES ACROSS
THREE INDONESIAN SUBCULTURES
A Dissertation
by
MARK CHRISTOPHER KELLY
Submitted to the Office of Graduate Studies of Texas A&M University
in partial fulfillment of the requirements for the degree of
DOCTOR OF PHILOSOPHY
Approved by: Co-Chairs of Committee, Kim E. Dooley Michael J. McCormick Committee Members, Gary E. Briers Larry M. Dooley Head of Department, David W. Reed
May 2008
Major Subject: Agricultural Education

iii
ABSTRACT
Comparison of Human Resource Management Practices and
Perceptions of Agri-Business Employees Across Three Indonesian
Subcultures. (May 2008)
Mark Christopher Kelly, B.S.; B.A., University of North Carolina Wilmington;
M.S., Texas A&M University
Co-Chairs of Advisory Committee: Dr. Kim E. Dooley Dr. Michael J. McCormick Prior research has shown that differences in human resource management (HRM)
perception/practices do exist between nations. These differences have been attributed to
variations in culture. The fundamental purpose of this study was to determine whether
subcultures differing in location, religion, and ethnicity significantly affect perception/
practices of human resource management within a common national context (Indonesia).
A secondary purpose of the current study was to compare with those found within
Indonesia by the Best International Practices Consortium or Best Practices Project
(BPP).
Participants in the present study were 762 agri-business employees who were
members of three distinctly separate subcultures within Indonesia; Sundanese/ Javanese,
Balinese, and Minahasan. Data are obtained through the distribution of written
questionnaires modeled after those employed by the BPP.

iv
Within each subculture, there were numerous disparities between current
perceived practices and those desired by employees. This study also revealed several
significant differences in HRM practices and perceptions across the three observed
subcultures in the areas of hiring, training, performance appraisal, leadership, and
communications. Participants reported differences in current and desired managerial
styles across subcultures. However, within these groups, current management practices
matched employee preferences. The overall findings of the present study differed from
those of the BPP. These differences may be attributable to dissimilarities in the samples
for the two studies’ samples.
This study indicates that employee attitudes and perceptions of HRM practices
do differ across cultural boundaries within a common national context. This discovery
has wide implications for international companies which may be looking to establish
overseas enterprises in countries with diverse cultural populations.

v
DEDICATION
“Mark, are you studying?” This question will forever be etched in my memory.
To my parents, Thomas and Vickie Kelly, thank you so much for never ceasing to ask.
This manuscript and the work it represents are small examples of what one can
accomplish when given the love and support you so selflessly gave me. You also gave
me Kelly stubbornness and lots of prayer. Those helped too.

vi
ACKNOWLEDGEMENTS
The Beach Boys once sang “I need a mess of help to stand alone.” While
conducting my research and writing this dissertation this was certainly true for me.
Without the numerous people who showed faith in me, I would not have accomplished
anything.
Dr. Kim Dooley, I cannot adequately express my gratitude for the enthusiasm
and encouragement which you showed me. Your positive attitude was extremely
contagious, and every visit to your office convinced me all the more that I was actually
going to make it!
Dr. Michael McCormick, Dr. Gary Briers, and Dr. Larry Dooley, thank you all
for sharing your time and expertise while assisting me in the pursuit of my goals. It truly
was a pleasure working with each of you.
Mr. Steve Gregory, Khres, and the entire Indonesia SEAFAST staff, without
your knowledge, patience, and willingness to help, this study would have been
impossible. What you achieved in 3 short years is nothing short of amazing and is a
wonderful accomplishment for yourselves and Texas A&M. I, along with thousands of
Indonesians, am in your debt.
I would also like to extend a heartfelt “thank you” to my travel companions,
Arief, Melanie, and Intan, who braved one lane roads, livestock, and oncoming traffic

vii
just to get ‘ten more surveys!’ Your ability to put up with me is a testament to your
poise and patience.
Mr. Corey Rosenbusch, thank you for introducing me to a new and wonderful
country. The opportunity you afforded me started it all. Working with each of you was
a learning experience that I will always carry.
Dr. Cliff Hoelscher, working for you was truly an adventure. Everyday held
something new and exciting. Your forethought, planning, and hard work are examples I
hope to follow.
The staff of The Borlaug Institute for International Agriculture at Texas A&M, I
am extremely proud to claim you as my coworkers and friends. The potential is
staggering and I have no doubt you will continue to accomplish great things for the
World.
And finally, to the people of Indonesia, no matter to which group you belonged,
you were always kind and hospitable to the crazy buleh from Texas A&M. This
research is yours. I hope it helps tell the story of one of the most magical places on
Earth.

viii
TABLE OF CONTENTS Page ABSTRACT ..................................................................................................................... iii DEDICATION ...................................................................................................................v ACKNOWLEDGEMENTS ..............................................................................................vi TABLE OF CONTENTS ............................................................................................... viii LIST OF TABLES .............................................................................................................x CHAPTER I INTRODUCTION...............................................................................................1
Statement of the Problem ..............................................................................4 Purpose of Study ...........................................................................................5 Specific Objectives........................................................................................5 Theoretical Base............................................................................................6 Research Questions and Hypotheses.............................................................6 Methodology .................................................................................................7 Delimitations .................................................................................................8 Limitations ....................................................................................................8 Assumptions ..................................................................................................9 Definition of Terms.......................................................................................9
II REVIEW OF LITERATURE............................................................................10
Human Resource Management ...................................................................10 International HRM ......................................................................................12 The Best Practices Project...........................................................................18 Indonesia and the Best Practices Project.....................................................20 Indonesia’s Uniqueness...............................................................................23 Indonesian Cultures.....................................................................................24
Javanese and Sundanese.....................................................................25 Balinese ..............................................................................................27 Minahasans.........................................................................................28
Agricultural Leadership and Education.......................................................31

ix
CHAPTER Page Summary of Related Literature ...................................................................35
III METHODS AND PROCEDURES...................................................................37
Selection of Sample.....................................................................................37 Instrumentation............................................................................................40 Translation...................................................................................................41 Data Collection............................................................................................41 Comparison of Data ....................................................................................42 Analysis of Data ..........................................................................................42
IV RESULTS..........................................................................................................44
Managerial Perception and Preference........................................................44 Hiring Practices ...........................................................................................46 Training and Development..........................................................................50 Performance Appraisals ..............................................................................55 Payment Practices .......................................................................................59 Leadership ...................................................................................................63 Communications..........................................................................................66 Summary .....................................................................................................69
V SUMMARY, CONCLUSIONS, AND RECOMMENDATIONS....................70
Summary .....................................................................................................70 Conclusions .................................................................................................71 Current Versus Desired HRM Practices......................................................71 Individual HRM Items ................................................................................73 Perceived Effectiveness of Current Practices..............................................73 Present Study Versus BPP Findings............................................................73 Recommendations for Further Research .....................................................75 Recommendations for Practice....................................................................76
REFERENCES.................................................................................................................81 APPENDIX A ..................................................................................................................88 APPENDIX B ..................................................................................................................98 VITA ................................................................................................................................99

x
LIST OF TABLES
TABLE Page 1 Regional Representation of Sample ..................................................................39 2 Perceived Current Management Style...............................................................45 3 Desired Management Style ...............................................................................46 4 Combined Means for Current and Desired Hiring Practices Across Regions ..47 5 Individual Hiring Practices Survey Items Across Regions ...............................48 6 Perceived Effectiveness of Current Hiring Practices ........................................49 7 Comparison of Individual Hiring Practices Survey Items Between Present Study and Best Practices Project .......................................................................50 8 Combined Means for Current and Desired Training and Development Practices Across Regions ..................................................................................52 9 Individual Training and Development Survey Items Across Regions ..............53 10 Perceived Effectiveness of Current Training Practices.....................................54 11 Comparison of Individual Training and Development Survey Items Between Present Study and Best Practices Project ...........................................55 12 Combined Means for Current and Desired Training and Development Practices Across Regions ..................................................................................56 13 Individual Performance Appraisal Survey Items Across Regions ....................57 14 Perceived Effectiveness of Current Performance Appraisal Practices..............58 15 Comparison of Performance Appraisal Survey Items Between Present Study and Best Practices Project ......................................................................59 16 Combined Means for Current and Desired Payment Practices Across Regions..............................................................................................................60 17 Individual Payment Practice Survey Items Across Regions .............................61

xi
TABLE Page 18 Perceived Effectiveness of Current Payment Practices.....................................62 19 Comparison of Payment Practices Items Between Present Study and Best Practices Project ................................................................................................63 20 Combined Means for Current and Desired Leadership Practices Across Regions..............................................................................................................64 21 Individual Leadership Survey Items Across Regions .......................................65 22 Perceived Effectiveness of Current Leadership Practices.................................66 23 Combined Means for Current and Desired Communications Practices Across Regions..................................................................................................67 24 Individual Communication Survey Items Across Regions ...............................68 25 Perceived Effectiveness of Current Communications Practices .......................69

1
CHAPTER I
INTRODUCTION
As the world’s economic and social structures become ever-more connected and
reliant upon one another, understanding how humans interact with one another within
these structures becomes more and more vital. Managers expanding or linking their
operations internationally must be aware of how entities in different nations and regions
recognize and respond to commonly faced human resource issues and demands
(Budhwar & Sparrow, 2002). By acknowledging these differences and trying to
understand the pretexts for their existence, managers and policymakers will be better
able to integrate and/or redesign their entities’ human resource management practices to
achieve desired objectives and success on the global stage (Marquardt & Berger, 2003).
In response to the need for information concerning regional human resource
management (HRM) differences, various researchers have asked which HRM practices
and perceptions appear to be universally implemented or pursued and which are culture
specific. Others searched for significant similarities and distinctions between nations
and the ascertainment of whether these differences are shrinking or expanding. Other
researchers have sought the determinants and consequences of these differences (Clark,
Gospel, & Montgomery, 1999).
Jackson and Schuler (1995) asserted that much of this research focuses on
finding differences, but their research failed to address the cultural contexts of the
_____________ This dissertation follows the style and format of the Journal of Agricultural Education.

2
organizations in which these divergences occur. Cultural contexts are recurrently linked
to national boundaries, and therefore HRM policies and procedures are frequently
compared across nations. Indeed, national boundaries have been shown to be correlated
with differences in HRM polices and perceptions. Hofstede (1983) supported the
importance of “nationality” on a culture’s psyche. “National and regional differences are
felt by the people to be a reality and therefore they are a reality” (p. 75).
In an effort to quantify the concept of “culture,” Hofstede (1983) proposes four
dimensions of national culture. The dimensions were measures of Individualism, Power
Distance, Uncertainty Avoidance, and Masculinity. Hofstede formulates these
dimensions to be virtually independent and, hypothetically, exclusive of one another.
With these dimensions (others have been subsequently added), Hofstede asserted the
importance of national and/or cultural context on human resource management practices
and perceptions.
Budhwar and Sparrow (2002) outlined a framework which may be used to study
cross-national differences in human resource management practice. Within this
framework, Budhwar and Sparrow contended that four “national factors” (national
culture, institutions, industrial sector, and business environment) set the overall
“climate” for variances in HRM across countries. Budhwar and Sparrow identified
several mechanisms by which cultural context may affect HRM policies. These included
managerial roles, behaviors, and assumptions.
Several researchers joined together to form the “Best International Practices
Consortium” or “Best Practices Project” (BPP), a series of studies designed to measure

3
cross-national differences in perceptions and practices in several areas of human
resource management including personnel selection, performance appraisal, training,
compensation practices, leadership, and communication (Von Glinow, Drost, &
Teagarden, 2002). These researchers took into account national/cultural differences as
they compared perceptions and attitudes of HRM across nine countries, including
Indonesia, and one region, South America. The BPP’s findings indicated that Indonesia
is unique in several areas of HRM and that as a nation, Indonesia does not lend itself to
any one grouping and differs greatly from other Asian nations as well as Western
nations.
The contributing members of the BPP demonstrated how implementation and
perceptions of HRM areas including hiring, training, performance appraisal, and
compensation can differ across national and regional contexts. Results pointed to certain
aspect groupings among nations with similar cultural characteristics. Taiwan, South
Korea, China, and Japan displayed parallel traits in HRM emphasis as did Canada,
Australia, and the United States. Drost, Frayne, Lowe, and Geringer (2002)
acknowledged Indonesia’s variance and pointed out an inability to find any literature on
training and development practices within Indonesia, which left their analysis of this
difference, self-admittedly, incomplete.
Possible explanations for Indonesia’s distinctive characteristics in training and
other HRM areas may lie in the nation’s unique geographic and social composition.
This relatively young nation comprises more than 13,000 islands encompassing more
than 700,000 sq miles. Indonesia possesses the fourth largest population in the world,

4
with the 2000 census placing the nation’s population at an estimated 206 million.
Indonesia’s people are as varied as the nation’s geography. A vast majority of
Indonesians (88 percent) are Muslim, making Indonesia the most populous Muslim
nation in the world. Christians account for approximately eight percent, while Hindus
make up roughly two percent of the population (Suryadinata, Arifin, & Ananta, 2003).
These religions stretch across several ethnic groups who have traditionally held differing
social and cultural practices. A shared sense of nationality does not translate into
cultural homogeneity within a nation’s borders. Factors such as ethnicity, religion, class,
and education can be the basis for numerous subcultures within a single national context
(Smith, Bond, & Ka gıtcıbas I, 2006).
Therefore, this study replicated portions of the BPP research within Indonesia
across three subcultural/ regional contexts. This study provided comparable measures
to the BPP’s existing results, as well as measured possible differences across Indonesia’s
complex societal fabric.
Statement of the Problem
Contrasted with the relative cultural homogeneity of other previously observed
nations, Indonesia presents a unique opportunity to study possible effects of cultural
differences on aspects of human resource management inside a single national context.
Such a context offers the possibility of controlling for factors such as national
regulations and laws, which, in previous studies, were considered independent variables.
The practices and perceptions measured by the BPP go beyond “daily” operational

5
implications and affect long-term strategic goals of the company such as competitive
advantage and compatibility within regional and global market places.
As Indonesia’s role in the global market place increases, so will the need for
greater understanding of how varied subcultures affect the nation’s workforce.
Purpose of Study
Therefore, the fundamental purpose of this study was to determine whether
regional/religious/ethnic subcultural contexts significantly affect perception/practices of
human resource management within the Indonesian national perspective. A secondary
purpose of the current study was to provide comparable results with those found in
Indonesia by the Best Practices Project.
Specific Objectives
The following specific objectives were identified to achieve the purpose and
facilitate the development of this study:
1. Identify three definable subcultures within Indonesia.
2. Modify existing instrument utilized by the Best Practices Project.
3. Develop methodology for application of the survey instrument within Indonesian
businesses.
4. Measure and compare existing importance ratings of HRM factors across
subcultures.
5. Measure and compare perceived importance ratings of HRM factors across
subcultures.

6
6. Compare findings of current study with those of the Best Practices Project for
Indonesia and other nations/regions.
7. Discuss possible implications of findings.
Theoretical Base
The following concepts summarize the theoretical structure on which this study
is based. These concepts are expanded in the review of literature as described in Chapter
II:
1. Societies exhibit empirical differences in cultural dimensions across national
boundaries (Hofstede, 2001).
2. Human resource management perceptions and practices differ across national
contexts (Drost, Frayne, Lowe, and Geringer, 2002).
3. Factors such as ethnicity, religion, class, and education can be the basis for
numerous subcultures within a single national context (Smith, Bond, &
Ka gıtcıbasI, 2006).
4. Several subcultures based on religion/ethnicity/geography comprise the regional
structure of Indonesia (Kumar, 2003; McVey, 2002; Suryadinata, Arifin, &
Ananta, 2003).
Research Questions and Hypotheses
The following research questions and hypotheses were addressed in this study: 1. Do Indonesian employees’ perceptions of current HRM practices differ from
desired practices?

7
2. Do Indonesian employees’ perceptions of current and desired HRM practices
differ across cultural regions?
3. Do companies’ cultural contexts affect personnel’s perceptions of HRM
practices?
4. How do measures of this population compare to those found by BPP?
H01: Subjects’ perceptions of existing and perceived HRM areas do not differ
significantly across subcultures.
H02: Subjects’ perceptions of existing and perceived individual HRM practices do
not differ significantly across subcultures.
H03: Total mean scores of combined subcultures in the current study do not differ
from those found in Indonesia by the Best Practices Project.
Methodology
The instrument employed in this study was sections of the survey used by the
Best Practices Project. This survey was translated from English into the Indonesian
language by individuals whose first language is Indonesian. This first translation was
then converted back into English by another Indonesian speaker to determine if any
concepts did not translate literally between the two languages. A consensus by a panel
of Indonesian speakers insured that any questionable items transferred the desired
concept to participants. The completed instrument was pilot-tested among a small group
of Indonesian workers. Questions and comments were solicited from these workers to
further insure content validity. The instrument was then administered to personnel of

8
agri-businesses of similar size located in three geographical regions of Indonesian
including West Java, Bali, and Northern Sulawesi.
These regions represent the central locales of three of Indonesia’s prominent
ethnicities- Javanese/ Sundanese, Balinese, and Minahasan. Each of these ethnicities
practice an overwhelmingly predominate religion (Muslim, Hindu, and Christian
respectively) as well as self-identify themselves along cultural characteristics.
Delimitations
This study was designed to measure agri-business employees’ perceptions of
human resource management practices in three Indonesian regions- Western Java, Bali,
and Northern Sulawesi. The data collected in this study may not be generalizable to
other cultures within Indonesia. However, results may be used for comparisons between
these other cultures or nations of interest.
Limitations
1. Respondents may have given culturally or socially “correct” answers even
though they knew they would remain anonymous and were informed that there
were no “right or wrong” answers.
2. Because of the diversified nature of many Indonesian businesses, replicable
samples of businesses engaged in identical enterprises were difficult to obtain.

9
Assumptions
1. Respondents would be familiar with basic concepts of “human resource
management” including: training, hiring, performance appraisal, leadership,
communication, and pay practices, if not the specific term itself.
2. Respondents would be representative of the general workforce present in their
respective regions.
3. The instrument employed would accurately measure respondents’ perceptions of
the targeted concepts.
4. Data collection methods did not influence participants’ responses.
Definition of Terms
Culture: “Collective programming of the mind that distinguishes the members
of one group or category of people from another” (Hofstede, 2001, p. 9).
Human resource management: “The planning, organizing, directing and
controlling of the procurement, development, compensation, integration, maintenance,
and separation of human resources to the end that individual, organizational, and societal
objectives are accomplished” (Shonhiwa & Gilmore, 1996, p.16) .

10
CHAPTER II
REVIEW OF LITERATURE
In an effort to engage new markets and seek labor and financial competitive
advantages, companies have become increasingly global in the scope of their operations.
With accompanying advantages of reaching new potential consumers and utilizing new
labor forces, companies are facing the challenges of how to conduct business in new
regions of the world. Employing new labor forces entails the implementation of human
resource management (HRM) practices. These practices include recruitment, selection,
and hiring of the workforce. Once individuals are hired, they need to be incorporated
into the company’s framework through training and socialization. Appraising the
progress of these employees and motivating them via compensation are also key
components of HRM (Schuler & MacMillan, 1984).
Human Resource Management
Shonhiwa and Gilmore (1996) define HRM as the “planning, organizing,
directing and controlling of the procurement, development, compensation, integration,
maintenance, and separation of human resources to the end that individual,
organizational, and societal objectives are accomplished” (p. 16). Effective
management of one’s labor force results in the increased capacity to recruit and keep
qualified personal. Properly motivating these workers increases productivity and
product quality while decreasing production costs and worker turnover (Schuler &
MacMillan, 1984). By building and maintaining such a workforce, an enterprise can

11
gain a competitive advantage over its competitors (Sparrow, Schuler, & Jackson, 1994;
Tayeb, 1995; Wright, McMahan, & McWilliams, 1994).
How to select, train, appraise, compensate, and communicate with one’s
domestic workforce can seem daunting enough. Successfully managing employees who
do not share the same opinions, values, and outlooks as those found in the company’s
country of origin can pose a myriad of issues which, if not handled knowledgeably, can
negate the advantages of entering new markets. Because of the increasing pressures and
interconnectedness of the global market, researchers are now studying how well HRM
practices can be transposed across different countries and which practices need to be
modified to fulfill their respective purposes (Begin, 1992, Budhwar & Khatri, 2001;
Clark, Gospel, & Montgomery, 1999; Easterby-Smith, Malina, & Yuan, 1995).
For corporations or other organizations to be successful in different international
settings, they must first understand the cultural context in which they will be operating
(Morden, 1995). Several studies have shown that the effectiveness of HRM practices is
dependent on how well these methods fit with the culture in which they are implemented
(Debrah, McGovern, & Budhwar, 2000; Huo & Von Glinow, 1995). Newman and
Nollen (1996) linked three fiscal performance measures of 176 international offices of a
US-based firm with managerial practices and cultural dimensions of the offices’
respective countries. Newman and Nollen found that offices employing management
styles fitting the cultural contexts were more financially productive than those offices
whose management practices did not fit with the cultural background.

12
Having established that HRM practices do affect performance, researchers in
both the business and academic community have begun to study how HRM practices
differ across countries in which they are applied (Kidger, 1991). These studies attempt
to address the need for managers and policy-makers to understand how their overseas
counterparts and respective employees perceive and react to general HRM areas and
specific practices. By matching the HRM practices with cultural contexts, companies
hope to safeguard the advantages gained by globalization.
International HRM
Schuler, Budhwar, and Florkowski (2002) define the purpose of international
HRM as the enabling of companies to be successful globally by increasing
competitiveness. This competitiveness is accomplished by increasing local efficiency,
responsiveness, and flexibility and by the transference of information across national
borders (Kidger, 1991). The theory that HRM is perceived and implemented differently
across nations has been tested by many comparative studies.
One of the first and largest empirical studies of culture was undertaken at the
behest of one of the world’s largest international corporations, IBM, by Geert Hofstede
(Hofstede, 2001). Hofstede quantifies four aspects of culture including Individualism,
Power Distance, Uncertainty Avoidance, and Masculinity. Using these dimensions,
Hofstede demonstrated that cultural variations between nations do exist and that they
have the real potential to affect differences in HRM practices and perceptions.
Individualism, and it’s corresponding opposite Collectivism, measures the
strength of ties between a society’s members and their fellow members. An

13
individualistic culture is characterized by loose affiliations with those outside immediate
family. One is expected to take care of him or herself and immediate family members.
In contrast, members of collectivist cultures receive protection and care from the
community in return for unwavering loyalty (Hofstede, 2001).
Power Distance is a measurement of the degree to which members of a society
accept an unequal distribution of power between other members and organizations.
Uncertainty Avoidance is a measure of how members of a culture feel threatened or
stressed by the prospect of unfamiliar situations or uncertain outcomes. Masculinity, or
Femininity, refers to how well defined gender roles are within a culture as well as the
level of objectivity used to measure outcomes or performance. A more masculine
culture would be characterized as one in which men and women have clearly separate
jobs, duties, and emotions. In a feminine culture, these roles and emotions would be
blurred or shared between men and women (Hofstede, 2001).
For a general comparison, Indonesia’s Uncertainty Avoidance score (48) is
higher than that of the US (36). Indonesia’s Power Distance score (78) is also higher
than the US (40). Indonesia and the US are at the opposite ends of the scale in terms of
Individualism, with the US displaying much greater Individualism (91) than the
collectivist society of Indonesia (14). Gender roles in the US are somewhat more
defined than those in Indonesia, as by a higher Masculinity score (62) compared to that
of Indonesia (46). This also indicates that performance measures in Indonesia are more
subjective than in the US.

14
As with subsequent researchers, Hofstede made comparisons across the national
context. In justifying the reasoning for this level of comparison, Hofstede states that
nationality is a critical determining factor for management styles. One reason is that
employees, managers, and companies within a nation share a common legal system,
educational structure, and labor history. Nations impart a symbolic value of belonging
and common identity to their respective citizens. These differences are seen as reality by
the citizens, and, therefore, Hofstede surmises, are reality. Along with these common
institutions, structures, and psyche comes a combined effect of differentiating one group
or nation from another. In turn, these differences affect behaviors and mindsets which
are manifested in such areas as customs, traditions, schools of thought, legal and
educational systems, and government and business institutions (Hofstede, 1983).
Jackson and Schuler (1995) asserted that while comparative research often
focuses on differences across nations, much of it fails to address the cultural contexts of
the organizations in which these divergences occur. In an effort to fully understand why
HRM differences are present between nations, many studies have tried to establish links
between differences in culture and HR practices.
Verburg, Drenth, Koopman, van Muijen, and Wang (1999) sampled Dutch and
mainland Chinese industrial companies and found several differences in HRM
perceptions across the two nations in the areas of hiring, performance appraisal, training,
and compensation practices. For example, companies in the Netherlands were more
likely than Chinese industries to have formal procedures for hiring and compensation.
Chinese companies demonstrated a greater tendency to base pay on both company and

15
personal performance than did Dutch companies. Training needs analysis was more
likely to occur within Dutch companies. Verburg et al. identify aspects of each culture
including values and historical contexts which might explain these differences.
Aycan, Kanungo, and Sinha (1999) compared HRM perceptions of both workers
and managers in Canadian and Indian organizations and observed the effect of cultural
contexts on these perceptions. The authors found several significant differences in
opinions between the two nations. Canadians stated they felt more autonomy and self-
control, or the ability to make decisions and work without direct supervisions, than their
Indian employee counterparts. Indian employees indicated that they worked more in
tandem with their managers when setting personal goals than did Canadian employees.
Indians also displayed more forward thinking when planning actions and goals. Aycan
et al. found significant correlations between these differences in perceptions and
differences in cultural characteristics, including power distance, uncertainty avoidance,
and paternalism. Canadians scored lower on these traits than did Indians.
Aycan et al. (2000) linked differences in HR job enrichment, supervision, and
reward allocation across Canada, China, Germany, India, Israel, Pakistan, Romania,
Russian, Turkey, and the United States to cultural dimensions established by the
researchers. These dimensions included paternalism, power distance, fatalism (the belief
of the inability to control the outcomes of one’s actions) and loyalty toward community.
Managers in nations scoring higher on the fatalism scale, such as Russia and India, were
less likely to engage in job enrichment, performance-based reward systems, or employee
empowerment. Management in countries with high paternalism scores (India, Turkey,

16
and China) were also less likely to empower employees to set personal goals, make
decisions, or accept responsibility.
Budhwar and Khatri (2001) discovered differences between British and Indian
companies in the HR practices in the areas of recruitment, compensation, training, and
communications. In order to control for possible confounds that may be caused by
different manufacturing sectors or business size, businesses with more than 200
employees were matched with their British or Indian counterparts in specific areas such
as plastic, steel, textiles, or pharmaceuticals. Distinctions were also made between blue-
and white- collar employees. Budhwar and Kharti found that differences did exist
between matched British and Indian businesses but were dependent on HR strategies
such as cost reduction or talent acquisition.
Not all comparisons are made between such obviously distinct countries such as
Canada and India or China and the Netherlands. Neelankavil, Mathur, and Zhang (2000)
compared perceived management performance factors in the United States with those of
three Asian nations: mainland China, India, and the Philippines. While these Asian
countries are distinct from one another, it is probable that they do share a more common
sphere of cultural influence with each other than with western nations.
Neelankavil et al. found significant differences between Chinese, Indian,
Filipino, and American managers’ perceived importance of characteristics such as
planning/ decision-making, self-confidence, educational achievement, communication
skills, past experience, and leadership ability. The largest differences between perceived
importance of management factors were educational skills, planning, and decision-

17
making abilities. Surprisingly, the largest national differences were not seen between
the three Asian nations and the US but between China and the rest of the sampled
countries. This phenomenon suggests that perhaps simply grouping nations by only one,
two, or three cultural dimensions is no guarantee that the group will display similar
HRM preferences. Neelankavil et al. concluded that these differences in HR practices
originate from variations of Hofstede’s cultural dimensions such as collectivism/
individualism found between the four countries.
Brewster and Larsen (1992) observed variances in the utilization of companies’
HR departments across ten European nations: Denmark, France, Germany, Italy, the
Netherlands, Norway, Spain, Sweden, Switzerland, and the United Kingdom. The
companies sampled represented several business and public sectors such as health,
manufacturing, agriculture, chemical, and engineering. Brewster and Larsen measured
the degree to which these companies considered HRM as part of business strategy
(integration) and the extent to which HRM responsibilities were placed on line managers
as contrasted to HR specialists (devolvement). Nations which displayed higher levels of
devolvement more closely matched one another’s cultural dimensions than countries
with lower devolvement levels. Denmark and the Netherlands were shown to have low
integration and high devolvement. These two countries share common scores on
Hofstede’s cultural dimensions of high individualism, small power distance, and low
masculinity. Sweden and Switzerland display similar high individualism and small
power distance scores. Brewster and Larsen found that these two countries both have
high levels of both integration and devolvement.

18
Nations with low devolvement did not fit each other’s cultural dimension scores.
Countries with high integration and low devolvement included France and Spain, which
are culturally similar to one another. However, Norway, which has lower power
distance and uncertainty avoidance (Hofstede, 1983), was also included in this HR
grouping. Nations with low integration and devolvement, including Italy, Germany, and
Great Britain, did not lend themselves to similar cultural groupings. Germany was
closer to Italy with higher uncertainty avoidance but more closely matched Great Britain
with lower power distance (Hofstede, 1983). These findings suggest that different
combinations of cultural dimensions may affect HR practices in varied ways.
The Best Practices Project
In response to a growing need for information concerning how HRM practices
are affected by the cultural context in which they are implemented, a conglomeration of
international researchers undertook a transnational survey to compare how cultures
impact employees’ perceptions and attitudes of specific HRM practices.
The Best International Practices Consortium, known as the Best Practices Project
(BPP), sought to determine which HRM practices are most effective within specific
contexts such as national and regional cultures (Von Glinow, 2002). To accomplish this,
the BPP employed several researchers from various national backgrounds to develop and
administer surveys which measured different areas of HRM, including hiring, training,
performance assessment, and compensation. Management styles, leadership, and
communications practices were also included in the survey, but data from these areas
were either not obtained or remain unpublished. The BPP comprises nine countries and

19
one region- Australia, Canada, Indonesia, Japan, Latin America, Mexico, South Korea,
Taiwan, the People’s Republic of China, and the United States.
The BPP survey included a section which asked respondents to choose which of
four management options they currently believed their supervisors exhibited and which
management style they would prefer (see Appendix A). These management styles are
modeled after those constructed by Likert (1967) which were classified as Exploitive
Authoritative, Benevolent Authoritative, Consultative, and Participative. Likert based
these management styles on levels of interaction, cooperation, and communication
between subordinates and superiors, such as the degree to which managers encourage
employees to discuss important issues and incorporate subordinates’ ideas into solutions.
Exploitative Authoritative managers exhibit little or no regard for employees’ opinions.
Benevolent Authorities managers still fully control decision making but are more open
to employees’ inputs and needs. Consultative managers make an active decision to
obtain employee input and incorporate it into their final decision process. Participative
managers allow employees to directly influence decision making processes.
Using an “is now” and “should be” Likert-scale format, BPP asked whether a
specific practice was utilized in the respective country and to what extent respondents
believed these practices should be employed in the future. BPP also asked how
respondents perceived these practices as related to employee performance, job
satisfaction, and overall organizational effectiveness. The manner in which BPP
researchers distributed questionnaires differed according to the method which received
the most responses. Researchers in some countries such as Mexico and Indonesia had to

20
administer survey instruments in person as initial mail-in response rates were extremely
low or impractical (Geringer, Frayne, & Milliman, 2002).
Results of these surveys indicated several differences in perceptions and opinions
of HRM practices across nations. While some HRM practices followed regional or
cultural patterns as in Asia (Japan, Korea, Taiwan, PRC) or Western (Australia, Canada,
US), others did not lend themselves to suspected trends. Indeed, Indonesia stands out as
a country which did not readily follow any categorical classification. As mentioned in
Chapter I, very little literature exists regarding Indonesian business models or HRM
practices (Drost et al., 2002). The following is a short summary of the BPP findings and
the manner in which Indonesia relates to them.
Indonesia and the Best Practices Project
Huo, Huang, and Napier (2002) studied hiring (recruiting) practices across the
countries involved in the BPP. Huo et al. hypothesized that choosing the most qualified
persons for vacant positions would be a universal goal of companies worldwide. While
selecting the best qualified candidates may be a common objective, the findings of Huo
et al. suggest that methods for meeting this purpose differ across countries. Huo et al.
measured several aspects of recruitment including importance of candidates’ ability to
meet technical requirements and the method by which this ability is determined.
Significance of candidates’ social attributes such as his or her capacity to interact well
with current employees and the company’s value system, as well as the methods by
which these were ascertained, were also observed.

21
The results of Huo et al. show that, with some exceptions, candidates’ ability to
perform the technical requirements of the job and the outcome of personal interviews
were commonly employed across countries. Indonesia, China, and South Korea were
the only countries that indicated a current emphasis on employment tests. Desired hiring
practices were more widely varied according to country. Indonesian respondents
indicated a desire to see employment tests play a larger role than that currently
perceived.
Drost, Frayne, Lowe, and Geringer (2002) studied training and development
practices in BPP countries. Among the countries surveyed, Indonesia rated the lowest in
current training for improvement of technical skill, while showing a high level of interest
in future use. Indonesia was the third highest behind PRC and Taiwan in the current
utilization of training as a reward to employees but was the lowest among all nations in
the area of improving interpersonal skills as both a current and desired practice.
Although overall scores were low, Indonesia grouped with PRC, Taiwan, and Latin
America in the upper ranking of countries for the current improvement of poor employee
performance.
Milliman, Nason, Zhu, and De Cieri (2002) observed performance appraisal
practices across the BPP nations by grouping individual survey questions into four main
purposes. Documentation included employees’ past performance, strengths and
weaknesses, and goal achievement. Development purposes were composed of planning,
training, and ascertaining specific methods by which performance could be improved.
Administrative purposes consisted of using evaluations to determine compensation and

22
promotion. Subordinate expression centered on the utilization of evaluative practices as
ways for employees to express their opinions.
Appraisals as documentation tools were rated as low (below 3.0) by respondents
in Indonesia, Australia, and Mexico and moderate (between 3.0 to 3.5) in the remaining
countries. Desired documentation was ranked moderately high (3.5 to 3.9) in all Asian
countries with the exception of Taiwan, which, along with Western nations, ranked
desired documentation highly (above 4.0). Respondents from Asian countries,
excluding Taiwan, indicated a moderate desire to see appraisals used as development
tools, contrasted to high rankings of Western and Latin American nations. Indonesia
joined Mexico, the US, PRC, and Canada in rating appraisals as currently being used for
promotion applications. Respondents from most nations stated only a moderate desire to
see appraisals employed for promotions. All nations scored low to moderate for current
subordinate expression. Desired expression was higher in all countries.
Lowe, Milliman, De Cieri, and Dowling (2002) present the BPP’s findings on
compensation practices within BPP countries. When considering seniority in salary
determination, Indonesia joined Taiwan and Japan as nations scoring above 3 as a
current practice. Indonesia joined all other countries, excluding PRC and Korea, in
indicating less of a desire for seniority to influence salaries in the future. In the current
utilization of pay as an incentive (or motivation), Indonesia scored closer (2.8) to
Western nations but showed more similarity to Korea, PRC, and Japan in the desire to
see motivational pay (3.92). Indonesia scored current performance-based salary (2.81)

23
closer to China and Japan than the other Asian nations of Korea and Taiwan, whereas
desired emphasis on performance was closer to that shown by Canada (3.85).
The BPP survey also included sections on leadership and communications (see
Appendix A) which consists of items focusing on companies’ specific practices of
motivating, directing, and disseminating information. Results from these sections are
not published with other BPP findings and therefore could not be compared with current
findings within Indonesia.
Indonesia’s Uniqueness
Cultures within nations are not necessarily uniform. Factors such as religion,
race, class, and education often lead to the existence of several subcultures within
national contexts (McGuire, O’Donnell, Garavan, Saha, & Murphy, 2002; Smith &
Bond, 1993; Smith, Bond, & Ka gıtcıbas I, 2006). Hofstede (1983) acknowledged the
existence of culturally distinct groups within some national contexts but maintained the
focus of his study at the national level. He asserted that these distinct groups can still
display a single, distinguishable culture when compared to that of another nation.
National boundaries make for ready delineators of dependent variables, the
countries themselves. If, as discussed above, factors such as religion, ethnicity, class,
education, and geography all contribute to the definition of a specific culture (McGuire,
O’Donnell, Garavan, Saha, & Murphy 2002), then how might these reflect in the results
of a nation with a culturally heterogeneous population? Nations with populations
displaying variations of these factors may be home to several distinct groups which do
not lend themselves to one homogenous national culture. Smith and Bond (1993) argued
24
that in comparing one nation to another, a researcher could easily find subcultures within
one country which are more similar to those of the opposite nation than they are to their
national culture.
The reason that Indonesia does not lend itself readily to regional groupings from
the BPP results may lie within its cultural heterogeneity. Within Indonesian ethnicity,
the active effort to define oneself or group is commonly synonymous with religion and
regional location or territory (McVey, 2002).
Indonesian Cultures
With more than 1,000 separate ethnic groups, Indonesia is a prime example of
numerous cultures within a single nation (Suryadinata et al., 2003). Most of these
groups are dwarfed by the Javanese, whose 83 million members make up approximately
40 percent of Indonesia’s population. Despite this numerical superiority and a relative
monopoly on central political power, topography and deep-seated traditional differences
have preserved many of these unique identities (McVey, 2002; Kingsbury & Aveling,
2002).
This study focused on three distinct ethnic groups: the Javanese/ Sundanese, the
Balinese, and the Minahasans. These groups were chosen because they possess recorded
cultural distinctiveness among one another as well as geographic centralities in which
these ethnicities constitute the respective majorities (see Appendix B).

25
Javanese and Sundanese
With a combined population of ~112 million, the Javanese and Sundanese people
are the first and second largest ethnic groups in Indonesia, comprising 40 percent and 15
percent of the total population respectively. These groups share the 48,900 square mile
island of Java (Suryadinata et al., 2003). Javanese inhabit Eastern Java while the
majority of Sundanese inhabit the western portion of the island, an area roughly 17,000
square miles, where they form the largest ethnic group with approximately 26 million, or
74 percent of the region’s population. The overwhelming majority of West Javan
residents, 97 percent, is Muslim (Suryadinata et. al, 2003). The city of Bogor represents
a major center of Sundanese ethnic identity despite being only thirty miles from the
national capital of Jakarta (Grant, 1965).
Javanese and Sundanese neighbors do consider their cultures unique from each
other. The bases of these differences include variations in religion and language.
Sundanese have traditionally followed a more orthodox form of Islam than the Javanese
(Lamourex, 2003, Freyer & Jackson, 1977), which may be a reflection of a resistance to
change in general. This orthodoxy may also be, in part, a response to a self-awareness of
loss of Sundanese culture reported by Wessing (1977). Another aspect that separates the
Sundanese from Javanese is their language, which is distinct from that of Javanese or the
national language of Indonesia, and is still spoken by a majority of Sundanese
(Chalmers, 2006).
Javanese and Sundanese do, however, share much common history because of
the unification of various kingdoms under the Hindu Majapahit Empire from 1293-1500

26
(Taylor, 2003). Muslim merchants and leaders continued this merging of cultures from
the Sixteenth Century onward (Taylor, 2003; Koentjaraningrat, 1990). The development
of Jakarta, Western Java as the national capital and center of commerce has also resulted
in a further blurring of regional distinctions.
Etiquette and courtesy play large roles in Javanese relationships (Williams, 1990;
Palmier, 1969; Geertz, 1960). As with the Javanese, Sundanese relationships are built
upon the show of respect and manners to one of higher status. Javanese and Sundanese
relationships are also characterized as patriarchal authoritarianism in which dependents
look to a leader for support in return for loyalty, which is expressed as one of the major
tenets of “being Javanese” (Sutarto, 2006). Social status can be measured in the number
of dependents one has under his (or her) purview. The status of these dependents within
society is also directly correlated with the status of the benefactor himself (Wessing,
1977).
Maintaining social harmony is an important aspect of life on Java. In many
instances, one will avoid a negative verbal response to a question, but will instead
answer in the affirmative with a corresponding facial expression that denotes an actual
negative answer. Javanese generally try to avoid expressing displeasure or confrontation
directly, favoring a more indirect approach using irony or omission (Sutarto, 2006).
Self-effacing behaviors such as unwillingness to assert oneself openly are also seen as
ascribable Javanese traits (Sutarto, 2006), as are the avoidance of negative feelings and
disappointment through a general attitude of acceptance of negative outcomes or events
(Williams, 1990).

27
Balinese
The Balinese people comprise roughly 1.5 percent (or ~ 3 million) of the total
Indonesian population. Balinese can be found in relatively small numbers in numerous
regions of the country. The vast majority (~2.8 million) live on the island of Bali, where
they make up 88 percent of the island’s population. Eighty-seven percent of the island’s
inhabitants are Hindu, a faith that constitutes 1.8 percent of Indonesian religious beliefs
(Suryadinata et al., 2003). Denpasar is the major city on Bali and is located on the
southern tip of the island.
Though some practices and observances are fading from daily life, such as
functional adherence to the caste system, the Balinese ethos has been very resilient in the
face of encroaching cultures, both Western and Eastern (Barth, 1993). Underlying
much of Balinese life is a sense of balance and harmony within the individual as well as
within the community (Belo, 1970). To preserve such harmony, Balinese practice
emotional restraint and place a premium on maintaining poise and dignity (Belo, 1970).
Balance is also perceived to originate from order. Correspondingly, Balinese society is
very hierarchical in nature with much regulation and structure dictating social behavior
(Parker, 2003; Jensen & Suryani, 1992). Balinese actions historically center on
sociological and communal benefits as opposed to exclusive individual goals or values
(Bateson, 1970).
Balinese society may be viewed as egalitarian, though not in the sense of wealth,
status, or power. Equality of dignity or of “face” is seen as a way to maintain harmony
within the community. A manager or foreman may show restraint in giving orders or

28
correcting mistakes in deference to maintain good social relations and to avoid conflict
with the workers below him (Belo, 1970).
Balinese generally follow the adage “know little, say little” to avoid the chance
of being incorrect (Jensen & Suryani, 1992). Depending on the status of those
discussing an issue, consensus may or may not be reached. It is more likely that an
inclusive agreement will be required among a group of equals than it would be in a
group with a leader of higher status (Parker, 2003).
Because of a high level of regulation and structure, responsibilities and duties
within the social or work organization are often very clearly defined and rarely altered
(Parker, 2003). Complex tasks such as spiritual rituals are routinely undertaken with
great attention to detail. However, reasons behind these detailed actions are often
unknown to those participating in them (Parker, 2003).
Minahasans
The Minahasans inhabit the northern tip of the island of Sulawesi. Though a
relatively small ethnic group on the Indonesian national scale, 0.3 percent of the total
population, the Minahasans constitute the majority ethnicity present in the province of
North Sulawesi, numbering roughly 650,000 or 33.19 percent of regional population in
2000 (Suryadinata et al., 2003).
The Minahasa people are a conglomeration of eight tribal groups - the Tombulu,
Tonsea, Tondano, Tontemboan, Tonsawang, Ponosakan, Ratahan, and Bantik. Although
these eight Minahasan tribes possessed distinct languages and quarreled internally, they
banded together to face outside threats from neighboring groups. The tribes shared a

29
common creation story and perceived ancestral lineage. While each tribe had its own
distinct ritualistic practices, these individual practices were seen as components of the
larger purpose of the whole when joined with other tribes (Henley, 1993).
The title Minahasa comes from the word “Mahasa,” meaning “those who unite”
(Renwarin, 2006, p 1). The first mention of “Minahasa,” meaning “united, become
one” comes from the 1789 Dutch colonial administrators (Henley, 1993). The Dutch
wrested control of the region from the Spanish in 1660 and proceeded to leave their
colonial impression on the people. With the arrival of the Dutch, Christianity replaced
traditional spiritual practices as a common thread throughout the eight tribes (Henley,
1993).
Dutch missionaries and authorities encouraged unifying ideas already present,
including a common creation story, intertribal marriage, and formalization of a common
governing body, further promoting a sense of a single Minahasan culture. Increased
infrastructure in the region also more closely linked the loose tribal confederation
(Henley, 1993).
The Minahasans readily adapted to the presence of the Dutch and quickly
became an administrative class across the entire Indonesian archipelago. Minahasans
served as mid-level bureaucrats and elite soldiers in the colonial army. The founding of
Minahasan newspapers, schools, and a governing body which negotiated directly with
the Dutch parliament illustrated a robust sense of Minahasan identity, however far from
its ancestral roots (Henley, 1993; Renwarin, 2006). Minahasans have garnered a
relatively large amount of literature on their culture and self-perception despite being

30
one of the smaller Indonesian ethnic groups. This proliferation of research is due in part
to close ties with The Netherlands.
Jacobsen (2006) asked Minahasans to identity traits they themselves see as
“Minahasan.” The respondents listed land holdings, family history, Christianity
(especially evangelical Protestantism), and Westernization as the most self-identifiable
Minahasan characteristics. Minahasans describe themselves as open, generous,
dynamic, and cooperative.
Minahasans also place importance on individual achievement through
courageous acts and quick wittedness (Schouten, 1995). The roots of these traits can be
traced back to Minahasans’ unique creation stories in which man tricks or directly steals
from the gods to obtain the necessities of life such as rice, wild pigs, or cloth (Schefold,
1995).
The cultural variations between Javanese/Sundanese, Balinese, and Minahasans,
as well as other Indonesian groups, are not simply academically cataloged distinctions.
These differences are felt by members of each of the groups. Hofstede (1983) stated that
“regional differences are felt by the people to be a reality-and therefore they are a
reality” (p. 76). Evidence of this reality was observed by Hutchings and Ratnasari
(2006) who qualitatively studied Indonesian workers moving from one culture to another
within the country. Hutchings and Ratnasari found that Indonesians do perceive
differences in values and behavioral norms, such as the role of women, across these
cultures. These differences were substantial enough to cause stress among the relocating

31
workers. It is therefore plausible that these cultural differences also affect HRM
practices and perceptions.
Agricultural Leadership and Education
Despite the importance of both human resource management and agricultural
education, only a tenuous link between the two exists in the literature. There are few
direct references to the application of human resource management practices to issues
being faced by both private agribusiness and the public agricultural sector.
As agricultural operations become more commercialized, traditional labor
management practices may not be as applicable as they once were (Howard, McEwan,
Brinkman, & Christensen, 1991). In developed nations such as Canada and the US,
shortages of skilled agricultural labor are also an issue as hired laborers have become a
larger portion of the farming workforce. As a result, the need for knowledge of HRM
practices has increased among farm owners and managers (Bitsch & Olynk, 2007).
Farm owners are finding it increasingly difficult to recruit and retain skilled workers
(Howard, McEwan, Brinkman, & Christensen, 1991).
Here, effective HRM is important for the motivation of skilled workers. By
compensating workers with attractive incentives and benefits, farms and businesses
stand a much better chance of retaining workers in the face of industries which can offer
higher wages. Some research suggests that agricultural labor offers better non-economic
rewards, such as high-self esteem, recognition, and comradery with other workers, than
do other industries (Howard, McEwan, Brinkman, & Christensen, 1991).

32
Developing and managing agricultural workforces are also important in
developing nations, where agriculture often remains the main source of income for the
majority of the population. In Africa alone, an estimated 510 million inhabitants still rely
on agriculture as a main source of income (Kamoche, 2002). Food handling and
processing are key sections of the agricultural chain. In developing nations, such
operations can vary widely in size and efficiency (FAO, 2003).
Along with other areas of agricultural industry in developing nations, these areas
have traditionally employed large percentages of low skill and unskilled workers.
However, the implementation of relatively complex procedures, food safety, and product
manufacturing calls for increasingly higher levels of worker aptitude. Devising and
implementing effective HRM practices for these emerging workforces should be a major
concentration area of agricultural leadership and education research and curriculum.
As with specializations in other business sectors, HRM practices may, by
necessity, vary across different agricultural industries (Burton, Schurle, Williams, &
Brester, 1996). As an example, some practices employed in dairy production may not be
as applicable or effective when applied to pork production (Bitsch & Olynk, 2007;
Erven, 2001).
Proper management of human resources is crucial to the building and
maintenance of a functioning civil service, which includes agricultural extension agents.
This is especially true in developing nations, were agriculture serves as a vital source of
income and sustenance for the populous (Tessema, Soeters, & Abraham, 2005). As in
the private sector, recruitment, training and development are key to staffing

33
governmental positions. Problems arise from nepotism as well as inadequate or
inappropriate training. In many instances, connections are used to fill positions with
individuals who have little or none of the required expertise. Uneven recruitment, or the
lack of a cohesive hiring plan that does not address the actual needs of constituents is
also a major hindrance to effective extension services (Karbasioun & Mulder, 2004).
Training and development programs can be neglected because of a lack of
resources. If agents are not given access to the latest information or technology, then
passing these innovations on to their constituents is impossible (Karbasioun & Mulder,
2004). When training does occur, it can be haphazard, or irrelevant to the issues faced
by the agents attending. Supervisors may employ training as a system of rewards or
punishments. Trips, per diems, and other perks associated with these trainings can be
seen as a way of rewarding favorite subordinates, as opposed to targeting needed
knowledge areas. Conversely, supervisors may relegate tedious or laborious training to
out-of-favor agents as a way of punishment (Tessema, Soeters, & Abraham, 2005).
There is no reason to exclude training as part of a reward system, provided that it is
extended to agents who would benefit most from learning new skills.
If civil service positions are filled with skilled personnel, retaining these agents
becomes an issue that must be addressed. The loss of skilled civil servants to the private
sector due to inadequate compensation or motivation is a major concern in developing
nations. Because often scarce resources are used to train these individuals, the loss of
these individuals can place a large burden on already strained government agencies.
While individual practices may vary across nations and cultures, some form of merit

34
based pay and promotional system should be utilized to encourage high standards of
performance (Birmingham, 1999). Implementing a transparent and consistent reward
system that focuses directly on the needs of these civil servants is critical to their
retention (Tessema, Soeters, & Abraham, 2005). Clear paths to promotion and other
career opportunities should also be provided, with criteria based not only on academic
background, but actual skill level as well (Birmingham, 1999). Lack of mobility within
extension organizations can also lead to the loss of skilled personnel (Karbasioun &
Mulder, 2004).
While HRM is not as clearly linked with agricultural enterprises as it is with
other businesses, efforts are being undertaken by institutions of higher learning to
incorporate management and leadership into agricultural educational programs and
research. Human resources are equally important to a business or nation as are natural
resources and man-made infrastructure (Van crowder, 1996). Therefore, much of the
task of developing this human capital falls to colleges and universities, which, in turn,
pass the mission onto their graduates.
Emphasis on human resource management in agriculture is pursued in
developing nations such as India. There, efforts are being made in India to introduce
human resource management curricula in agricultural extension in order to better prepare
extension graduates to face the changing needs of the nation’s economy (Sulaiman &
van den Ban, 2000). Sulaiman and van den Ban argue that training in the social aspects
of agriculture development has been overlooked in favor of more statistically based
research methodology.

35
Studies indicate that HRM is being addressed in agriculture education
departments at US institutions of higher learning (Brown & Fritz, 1994, Fritz, Hoover,
Weeks, Townsend, & Carter, 2001). Thirty six of 55 surveyed departments stated they
offer courses dealing with leadership and HRM (Brown & Fritz, 1994). While curricula
may have changed, many of these courses have been offered for over ten years,
establishing a definite presence of HRM within the context of agricultural education
(Brown & Fritz, 1994). Fritz et al. (2001) found that over half of departments surveyed
required students to take at least one HRM course.
As with any subject, curricula must be periodically updated to keep pace with the
realities found outside the classroom. To this end, HRM must be a continuing focus of
agricultural education researchers (Sonka & Hudson, 1989).
Summary of Related Literature
This chapter presented a review of literature outlining the current state of
research concerning the effects of different cultures on perceptions and attitudes of HRM
and the need for such research. Differences in perceptions and attitudes have been
shown to exist across national boundaries. This review discloses possible limitations of
current research in finding studies which endeavor to explain these differences in terms
of specific cultural variations. A review of the literature finds that studies do not take
into account intra-national cultural consistency, which leaves unanswered the effects of
multiple cultural groups within a national context. Research has indicated that Indonesia
is in many ways unique from its Asian neighbors. Further research shows that Indonesia

36
is far from cultural homogeneity and that it contains several distinct ethnic groups. In
summary, past research has shown that:
• HRM perceptions and attitudes do differ across national cultures.
• Actual cultural characteristics are not always employed to account for these differences.
• Indonesia is distinctive from its Asian counterparts in many areas of
HRM. • Indonesia comprises several divergent ethnic groups.
• These ethnic groups are likely causes of differences in HRM perceptions and practices.

37
CHAPTER III
METHODS AND PROCEDURES
Selection of Sample
Accurate estimations of the number of businesses involved in food processing,
handling, or production in Indonesia are extremely difficult to ascertain. Many
companies are diversified into several varying industries and do not categorize
themselves solely by one aspect. Individual company size can also vary widely
according to seasonal production or other market forces. Businesses are often reluctant
to divulge proprietary figures such as exact employment or production. The majority of
businesses are not legally registered with respective provincial governments, further
complicating accurate statistical data. However, some estimates do exist. Agriculture
employs the majority of the Indonesian work force. In total, various sectors of
agriculture employ ~42 million workers above the age of 15 in some form of agricultural
enterprise (Badan Pusat Statistik, 2007).
There are an estimated 3.5 million businesses of varying sizes operating in West
Java. Of these, only 37,499 are registered with the government (Heriawan, 2004). The
remaining majority are generally cottage-sized operations or street vendors. A similar,
but less exaggerated trend is observed on Bali, where approximately 35,000 of a total of
~180,000 businesses are registered (Bank Indonesia, 2004a). Manado is home to
approximately 60,000 businesses. An estimate of the number of registered businesses
was unavailable (Bank Indonesia, 2004b).

38
With such a varied business population, it was necessary to narrow selection to
those companies that had registered with their respective regional governments. These
businesses are generally much larger than their unregistered counterparts. Access to
major national firms was difficult, usually requiring essentially unobtainable
authorization from home offices in Jakarta. Prospective companies were limited to firms
own and operated by Indonesians and employing between 25 and 300 workers in order
to control for possible confounds stemming from international control or ownership.
Population statistics are clearer due to the 2000 national census. West Java was
the most populated of the studied regions with 35 million inhabitants. Of these, 26
million are Sundanese, while nearly 4 million (11%) are Javanese. The population of
Bali numbers 3.1 million, of which 2.7 (88%) are Balinese. North Sulawesi possesses a
population of nearly 2 million, with ~660,000 of (33 %) Minahasans (Suryadinata et al.,
2003). While these numbers give an approximation of the populations from which this
study’s sample was obtained, care should be taken when interpreting them, especially in
the cases of West Java and North Sulawesi. Participants in North Sulawesi were from
the city of Manado and the surrounding areas. Though the minority in the region (which
covers a large area), Minahasans comprise the majority in the city and Manado regency.
The sample was defined as 762 non-management workers employed by 36
Indonesian companies within the food processing, handling, and production industrial
sector. These targeted convenience samples were selected to represent employees in
three geographical regions/ cities of West Java, Bali, and Northern Sulawesi (Manado

39
Regency) and corresponding ethnic majority – Javanese/Sundanese, Balinese, and
Minahasan respectively (see Table 1).
Potential registered companies were selected from a variety of sources. Several
were located via the database of the SEAFAST Project, a US funded, Texas A&M
administered food safety development project. These companies had been previously
identified by the project as potential participants in upcoming training initiatives. Other
companies were found using local phonebooks and internet searches. Some companies
were discovered simply by driving past their locations.
A Bahasa staff member contacted these companies via phone to re-confirm the
companies’ main focus and contact information. A letter detailing the study’s purpose
and scope was then sent to the prospective companies. Once companies agreed to take
part in the study, an appointment was made with the management. The study’s purpose
and scope were explained with company management. If management agreed to allow
the company to participate, volunteers were then solicited from the respective
companies’ workforce.
Table 1 Regional Representation of Sample Majority Subculture Region Companies Employees Javanese/ Sundanese Bogor/ West Java 12 220 Balinese Denpasar/ Bali 13 206 Minahasan Manado/ North Sulawesi 11 336 36 762

40
Instrumentation
The instrument employed in this study was a shortened form of a questionnaire
used in a study conducted by Geringer et al. (2002) as part of the Best International
Human Resource Management Practices Project (BPP). The instrument used in the
present study was modified to reflect the goal of measuring differences solely across
cultures and not gender, age, or education level. Questions asking gender, age,
education level, and occupation title were excluded to help ensure anonymity of
respondents. Questions exploring job satisfaction, opinions of direct supervisors, and
future career plans were also removed to further protect respondents and to reduce
possible anxiety. Questions specifically tailored for managerial staff were also excluded
(see Appendix A).
Using a “Is Now” (current practices)/ “Should Be” (desired practices) question
format, the instrument in the present study measured participants’ perceptions of current
HR practices within their respective companies as well as their opinion of how the
practices should be implemented in the future. This format allowed for the contextual
comparison of both current practices and employees’ preferences between regions.
Questions were posed in a 5-point response scale from “Not at all” to “A very great
extent” and covered six areas of HR - hiring practices, training and development,
performance appraisal, pay, leadership, and communications. Effectiveness of
companies’ policies toward attracting and retaining qualified personnel, employee
satisfaction, and overall organizational success were also measured using the same
response scale.

41
Translation
The original BPP instrument deployed within Indonesia was translated into
Bahasa, the national language. To ensure a conceptual translation in which ideas
conveyed matched those of the English original, several renditions were produced using
the back translation method (Brislin, 1970). A native Bahasa Indonesian speaker was
asked to translate the original version from English to Bahasa. Three other Bahasa
speakers then independently converted this translation back into English. The three
versions were compared for conceptual conformity, with the resulting versions found to
be very similar in context to the original English version. A panel of Indonesian
speakers was then consulted to confirm the items’ validity (see Appendix A).
Data Collection
On location at the various companies, another detailed explanation of the study
was given to employees, who were then asked if they would like to participate. Those
who agreed were given information sheets in Bahasa explaining that they were not
required to participate or to answer any questions with which they had concerns.
Employees were also informed that their responses would remain anonymous and that
management would have access only to the overall findings within the company.
Employees who agreed to participate were then given the instrument with the
further instructions to answer each question honestly, with the knowledge that there were
no right or wrong answers. Participants completed questionnaires independently and
were encouraged not to discuss the questionnaires while completing them.

42
The principal investigator directly collected completed instrument. A code was
assigned to each completed instrument to later identify from which company and region
each survey originated. All methods employed in data collection received prior approval
by the Texas A&M University Institutional Review Board (see Appendix C).
Comparison of Data
Several assessments of data were made to obtain an accurate representation of
HRM practices within Indonesia and between the studied regions. When analogous
means were available, combined national means for individual items from the current
study were compared to those obtained by the BPP.
Current and preferred managerial styles were compared across regions, as were
means of combined items from each of the six HRM areas addressed. Combined means
for desired and current practices were also compared nationwide as well as between
regions/ subcultures. Individual items with the six HRM areas were also compared
between each region.
Analysis of Data
Data were analyzed using the Statistical Package for the Social Sciences
(SPSS®) version 14. Responses for survey questions were organized according to
individual, company, and region respectively. Descriptive analyses were conducted to
measure frequencies, means, and standard deviations of responses within each region.
Chi-square tests were used to find significant relationships between managerial
styles and regions. Cross-tabulations were conducted to illustrate these differences
across regions.
43
Cronbach’s alpha tests for reliability were employed to measure relatedness of
items within the contexts of current practices, desired practices, and perceived
effectiveness of current practices within the six HRM areas studied.
Paired samples t-tests were conducted to compare combined item means of
nationwide current practices with desired practices within the six HRM areas.
One-way analyses of variance were performed to test for significant differences
among regions in combined item means for both current and desired practices of each of
the six HRM areas. One-way analyses of variance were also used to compare individual
current and desired practices between regions. Unless otherwise noted, Bonferroni
Correction post hoc analyses were conducted to ascertain which regions differed
significantly from one another if significant differences of means were discovered.

44
CHAPTER IV
RESULTS
The purpose of this study was to determine whether food industry employees’
perceptions of current and desired HRM practices varied across cultural differences.
This study also asked if overall Indonesian employees’ perceptions of current HRM
practices differed from desired practices. This study further sought to compare current
results with those recorded by the Best Practices Project (BPP) within Indonesia. To
achieve these goals, Indonesian employees from three different cultural groups were
surveyed using methods described in Chapter III.
Results of data analysis were organized by HRM areas including managerial
perception and preference, hiring practices, training and development, performance
appraisal, payment practices, leadership, and communications. Within each area, current
and desired combined mean scores, as well as individual item scores, are compared
across cultural groups. Combined individual scores are also compared to previous
findings by the BPP for the areas of hiring, performance appraisal, and payment
practices.
Managerial Perception and Preference
The percentage of current management styles indicated by participants differed
by region c2 (6, N=735) =30.92, p<.001. Perceived current occurrences for Exploitative
and Benevolent Authoritative management were similarity distributed across all three
regions. Manado respondents indicated a higher incidence (31%) of Participative
management and a lower incidence or Consultative management (18%) compared to

45
both Bogor and Denpasar. Bogor and Denpasar employees pointed out fewer instances
of Participative management (<20% each) than those in Manado (see Table 2).
Table 2 Perceived Current Management Style Management Region
Style a Bogor Manado Denpasar Total Exploitive Count 56 78 44 178Authoritative % within Region 26.54 24.00 22.11 24.22 Benevolent Count 48 86 51 185Authoritative % within Region 22.75 26.46 25.63 25.17 Consultative Count 70 59 67 196 % within Region 33.18 18.15 33.67 26.67 Participative Count 37 102 37 176 % within Region 17.54 31.38 18.59 23.95
The percentage of current management styles preferred by participants differed
by region χ2 (6, N=728)=41.57, p<.001. Participants across all regions indicated
Exploitive Authoritative as the least desired management style in the work environment.
Participative management was more desired in Manado (~half) than in the other two
regions (< one-third). Within Bogor and Denpasar, Benevolent Authoritative,
Consultative, and Participative were almost equally desired (~one-third) (see Table 3).

46
Table 3 Desired Management Style Management Region
Style Bogor Manado Denpasar Total Exploitive Count 21 28 8 57.00Authoritative % within Region 10.05 8.70 4.06 7.83
Benevolent Count 74 82 63 219.00Authoritative % within Region 35.41 25.47 31.98 30.08
Consultative Count 61 57 63 181.00
% within Region 29.19 17.70 31.98 24.86
Participative Count 53 155 63 271.00 % within Region 25.36 48.14 31.98 37.23
Hiring Practices Overall means for current and desired hiring practices, each comprised of seven
items, were calculated across all regions, yielding Cronbach’s α values of .595 (scaled
M=20.32, SD=3.91) and .607 (scaled M=24.92, SD=3.96) respectively. The overall
means were compared to obtain national differences between current and desired
practices.
Based on a paired-samples t-test, the perceived current hiring practices of
combined regions (x=2.90) were significantly lower (-.65 mean difference) than desired
hiring practices (x=3.55), t(742) = -28.39, p < .001.
While no significant differences were observed between combined means for
either current or desired practices across cultural regions, significant within-region
differences were seen between current or desired practices for all three regions (Bogor,
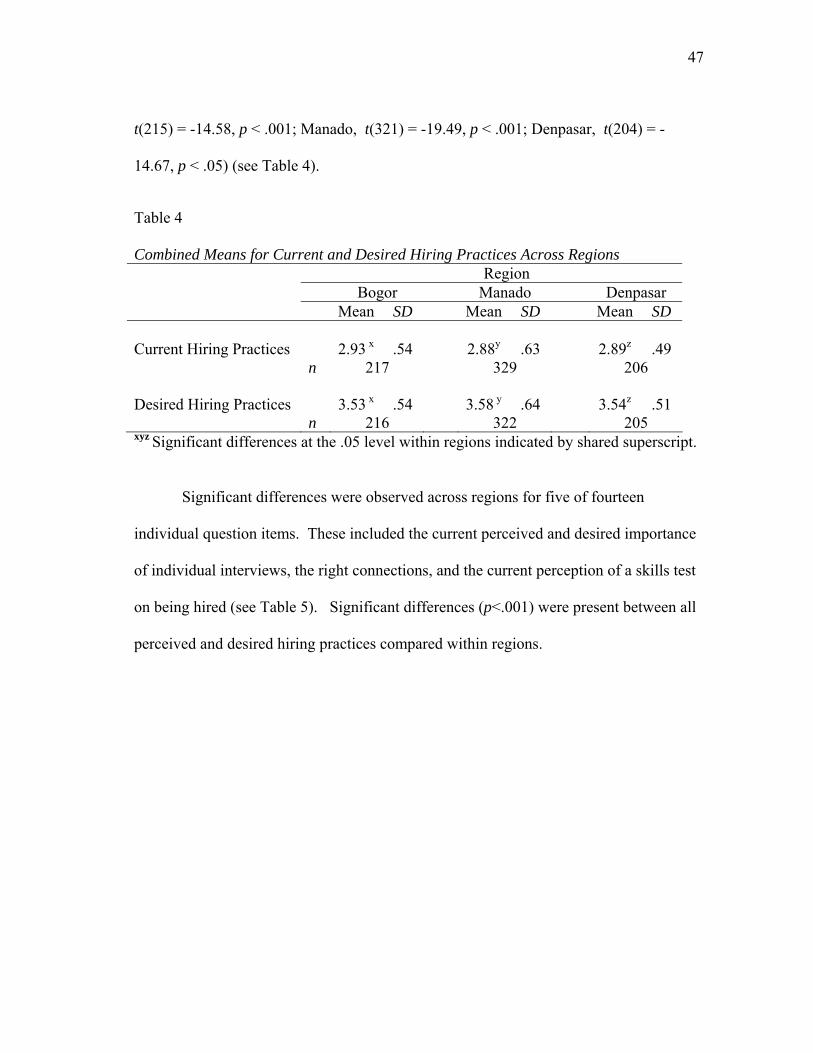
47
t(215) = -14.58, p < .001; Manado, t(321) = -19.49, p < .001; Denpasar, t(204) = -
14.67, p < .05) (see Table 4).
Table 4 Combined Means for Current and Desired Hiring Practices Across Regions Region Bogor Manado Denpasar Mean SD Mean SD Mean SD Current Hiring Practices 2.93 x .54 2.88y .63 2.89z .49 n 217 329 206 Desired Hiring Practices 3.53 x .54 3.58 y .64 3.54z .51 n 216 322 205 xyz Significant differences at the .05 level within regions indicated by shared superscript. Significant differences were observed across regions for five of fourteen
individual question items. These included the current perceived and desired importance
of individual interviews, the right connections, and the current perception of a skills test
on being hired (see Table 5). Significant differences (p<.001) were present between all
perceived and desired hiring practices compared within regions.

48
Table 5 Individual Hiring Practices Survey Items Across Regions Region Bogor Manado Denpasar Item * Mean SD Mean SD Mean SD Applicants’ ability to perform technical 2.84 .96 2.76 1.02 2.87 .93 requirements 3.94 .88 3.97 .91 4.02 .68 Individual interview 3.19ab 1.12 2.84a 1.10 2.86b .96 3.82a 1.0 3.63 1.10 3.4a 1.02 Applicants’ ability to 3.06 .88 2.96 .96 3.08 .89 interact with co-workers 4.02 .83 4.05 .82 4.02 .86 Having the right 2.81abc 1.22 3.5abc 1.16 3.21abc 1.01 connections 2.47a 1.31 2.76a 1.43 2.51 1.22 Skills test 2.97a 1.20 2.64a 1.13 2.78 1.02 3.88 .84 3.83 .99 3.87 .76 Applicants' potential to 2.96 .84 3.10 .87 2.99 .83 do a good job 3.50 1.1 3.71 1.02 3.73 .85 Future co-workers’ 2.60 1.08 2.45 1.14 2.40 1.09 opinions of applicant 3.03 1.22 3.15 1.31 3.21 1.05
Note: * Current practices means and standard deviations provided as top value; desired practices means and standard deviations provided as bottom value. abc Significant differences at .05 level across regions’ respective current and desired practices indicated by shared superscript. No significant differences in perceived effectiveness of current hiring practices
were observed across cultural regions (see Table 6).

49
Table 6 Perceived Effectiveness of Current Hiring Practices Region Bogor Manado Denpasar Mean SD Mean SD Mean SD Combined hiring practices 3.46 0.77 3.47 0.86 3.45 0.83 n 215 322 205 Hiring process affects 3.46 1 3.39 1.04 3.41 1 employees’ good performance 215 320 204 Hiring process affects 3.36 0.96 3.39 1.06 3.42 1.01employees’ satisfaction n 214 320 205 Hiring process contributes to 3.59 0.99 3.67 1.05 3.54 0.98overall company’s effectiveness n 214 318 204
The greatest differences between hiring practices measured in the present study
and in the BPP are seen in current perceptions of an applicant’s ability to perform
technical requirements (mean difference of -.77) and desired importance of having the
right connections in order to be hired (mean difference of .73) (see Table7).

50
Table 7 Comparison of Individual Hiring Practices Survey Items Between Present Study and Best Practices Project Present Study BPP Item * Mean SD Mean SD Applicants’ ability to perform 2.81 0.98 3.58 0.90 technical requirements 3.98 0.84 4.16 0.66 Individual interview 2.95 1.08 3.55 0.89 3.62 1.06 3.93 0.70 Applicants’ ability to 3.02 0.92 3.13 0.88 interact with co-workers 4.03 0.83 3.82 0.77 Having the right connections 3.22 1.17 2.69 1.22 2.61 1.35 1.88 1.06 Skills test 2.78 1.13 3.27 1.09 3.86 0.89 4.04 0.75 Applicants' potential to 3.03 0.85 3.08 0.73 do a good job 3.66 1.00 3.82 0.70 Future co-workers’ 2.48 1.09 2.46 1.09 opinions of applicant 3.13 1.22 2.64 1.16
N=719-746 N=233 Note:* Current practices means and standard deviations provided first (top value); desired practices means and standard deviations provided next (bottom value).
Training and Development Overall means for current and desired training and development practices, each
comprised of six items, were calculated across all regions, yielding Cronbach’s α values
of .805 (scaled M=17.32, SD=4.43) and .807 (scaled M=25.06, SD=3.22) respectively.
These overall means were compared to obtain national differences between

51
current and desired practices. Based on a paired-samples t-test, the perceived current
training and development practices of combined regions (2.88) were significantly
different (-1.29 mean difference) than desired training and development (4.17), t(751) =
-44.40, p < .001.
The means of combined items measuring perceptions of current training and
development practices differed significantly between Bogor (2.75, SD=.73) and Manado
(2.99,SD=.75)F(2, 753)=7.533, p=.001. Denpasar (2.85, SD=.70) was not significantly
different from either Manado or Bogor (see Table 8).
The means of combined items measuring desired training and development
practices differed significantly between Bogor (4.11, SD=.56) and Manado
(4.22,SD=.53) F(2, 753)=7.533, p>.05. Denpasar (4.17, SD=.54) was not significantly
different from either Manado or Bogor (see Table 8). Significant within-region
differences were also seen between current or desired practices for all three regions
Bogor, t(217) = -12.33, p < .001, Manado, t(328) = -11.72, p < .001, Denpasar, t(205)
= -11.05, p < .001 (see Table 8).

52
Table 8 Combined Means for Current and Desired Training and Development Practices Across Regions Region Bogor Manado Denpasar Mean SD Mean SD Mean SD Current training practices 2.75ax .73 2.99ay .75 2.85z .70 n 219 331 206 Desired training practices 4.11bx .56 4.22by .53 4.16z .53 n 219 329 205
Note:abc Significant differences at .05 level between regions indicated by shared superscript. xyz Significant differences within regions indicated by shared superscript at .05 level. Significant differences were observed for seven of twelve individual question
items. These included the current perceived practices of using training as an employee
reward, using current and desired practice of training to build teamwork, teaching
business technology and procedures, and enabling employee multitasking (see Table 9).
Significant differences (p<.001) were present between all perceived and desired training
practices compared within regions.

53
Table 9 Individual Training and Development Survey Items Across Regions Region Bogor Manado Denpasar
Item * Mean SD Mean SD Mean SD Rewarding employees 2.16ab .96 2.45a 1.18 2.45b .99 4.09 .79 4.05 .86 4.17 .68 Increase employees’ 2.90 1.69 3.05 .97 2.92 .93technical skills 4.12 .71 4.24 .70 4.21 .70 Fix employees' past 2.81 .89 2.97 1.00 2.89 .89poor performance 4.16 .73 4.15 .80 4.12 .70 Build the teamwork 3.11a .88 3.33ab .91 3.09b .95in the company 4.19a .73 4.37a .69 4.31 .65 Helps employees understand 2.42ab 1.03 2.90a 1.10 2.72b .95business tech, procedures 4.02a .81 4.27ab .77 4.08b .78 Enables employees 3.11 1.02 3.30a 1.10 3.02a .90to do multiple tasks 4.10 .81 4.27a .80 4.07a .81
Note: * Current practices means and standard deviations provided as top value; desired practices means and standard deviations provided as bottom value. abc Significant differences at .05 level across regions’ respective current and desired practices indicated by shared superscript.
No significant differences in perceived effectiveness of current hiring practices
were observed across cultural regions (see Table 10).

54
Table 10 Perceived Effectiveness of Current Training Practices Region Bogor Manado Denpasar Mean SD Mean SD Mean SD Combined training practices 3.5 0.83 3.57 0.94 3.53 0.9 n 218 330 206 Training contributes to 3.49 1.00 3.48 1.07 3.49 1.03employees’ good performance n 218 328 206 Training process contributes to 3.4 0.95 3.53 1.05 3.5 0.96employees’ satisfaction n 217 328 206 Training process contributes to 3.64 0.91 3.73 1.06 3.59 1.00overall company effectiveness n 217 328 206
The greatest differences between hiring practices measured in the present study
and in the BPP are seen in current perceptions of training employed as a reward (mean
difference of -.36) and current perception of enabling multitasking (mean difference of
.42) (see Table 11).

55
Table 11 Comparison of Individual Training and Development Survey Items Between Present Study and Best Practices Project Present Study BPP Item * Mean SD Mean SD Rewarding employees 2.36 1.08 2.72 1.01 4.1 0.79 3.67 1.06 Increase employees’ 2.97 1.21 3.22 0.89 technical skills 4.2 0.70 4.24 0.83 Fix employees' past 2.9 0.94 3.02 0.9 poor performance 4.14 0.75 4.19 0.81 Build the teamwork in 3.2 0.92 2.95 1.02 the company 4.3 0.70 4.07 0.96 Helps employees understand 2.71 1.06 2.6 0.96 business tech, procedures, etc 4.15 0.79 4 0.90 Enables employees 3.17 0.99 2.75 0.93 to do multiple tasks. 4.16 0.81 3.85 0.96 N=745-754 N=242
Note:* Current practices means and standard deviations provided first (top value); desired practices means and standard deviations provided next (bottom value).
Performance Appraisals
Overall means for current and desired performance appraisal practices, each
comprised of seven items, were calculated across all regions, yielding Cronbach’s α
values of .859 (scaled M=19.51, SD=4.97) and .838 (scaled M=28.35, SD=3.76)
respectively. These overall means were compared to obtain national differences
between current and desired practices.

56
Based on a paired-samples t-test, the perceived current performance appraisal
practices of combined regions (2.80) were significantly different (-1.27 mean difference)
than desired hiring practices (4.08), t(740) = -44.98, p < .001. Significant within-region
differences were also seen between current or desired practices for all three regions
(Bogor, t(213) = -24.30, p < .001, Manado, t(321) = -30.33, p < .001, Denpasar, t(204)
= -22.80, p < .001) (see Table 12).
The means of combined items measuring perceptions of current performance
appraisal practices differed significantly between Bogor (2.71, SD=.69) and Manado
(2.86,SD=.74)F(2, 746)=3.057, p<.05. Denpasar (2.80, SD=.67) was not significantly
different from either Manado or Bogor (see Table 12).
The means of combined items measuring desired performance appraisal practices
did not differ significantly across cultural regions.
Table 12 Combined Means for Current and Desired Performance Appraisal Practices Region Bogor Manado Denpasar Mean SD Mean SD Mean SD Current appraisal practices 2.71ax .69 2.86ay .74 2.80z .67 n 214 327 206 Desired appraisal practices 4.02x .51 4.09y .56 4.08z .71 n 214 322 205
Note:a Significant differences at .05 level between regions indicated by shared superscript: xyz Significant differences within regions indicated by shared superscript at .05 level.

57
Significant differences were observed for two of fourteen individual question
items. These included the desired importance of appraisals for evaluation of goal
achievement and current perception of appraisals’ role in employee promotions (see
Table 13). Significant differences (p<.001) were present between all perceived and
desired appraisal practices compared within regions.
Table 13 Individual Performance Appraisal Survey Items Across Regions
Region
Bogor Manado Denpasar Item * Mean SD Mean SD Mean SD To determine an 2.57 .99 2.74 1.00 2.75 .97 appropriate salary 4.12 .72 4.15 .76 4.11 .74 To plan employees’ 2.54 1.03 2.67 1.01 2.63 .88 training activities 3.9 .76 3.95 .87 3.89 .74 Awareness of good 2.92 .91 3.03 .94 3.04 .81 performance 3.99 .72 4.09 .77 4.09 .73 Design specific methods 2.84 .91 2.98 .98 2.86 .93 to improve performance 4.04 .67 4.14 .76 4.08 .67 Discuss employees 2.58 1.02 2.68 1.02 2.66 .91 opinions 4.13 .73 4.07 .79 4.05 .74 Evaluation of employees' 3.12 .89 3.19 .93 3.09 .88 goal achievement 4.02a .68 4.18a .75 4.11 .72 Promotion planning 2.36a .99 2.75a 1.09 2.55 .99 3.98 .83 4.01 .88 4.03 .71
Note: * Current practices means and standard deviations provided as top value; desired practices means and standard deviations provided as bottom value. abc Significant differences at .05 level across regions’ respective current and desired practices indicated by shared superscript.

58
Significant differences were observed between both combined means (F(2,
738)=3.83, p<.05) and overall effectiveness (F(2, 735)=4.80, p<.05) of Manado and
Denpasar (see Table 14).
Table 14 Perceived Effectiveness of Current Performance Appraisal Practices Region Bogor Manado Denpasar Mean SD Mean SD Mean SD Combined appraisal 3.44 0.86 3.58a 0.87 3.37a 0.94practices n 213 323 205 Performance evaluation contributes 3.40 1.00 3.48 1.00 3.27 1.04to workers’ high performance n 213 322 205 Performance evaluation contributes 3.41 0.98 3.55 1.01 3.35 1.00to employees’ work satisfaction n 212 320 205 Performance evaluation contributes 3.53 0.98 3.73a 1.00 3.48a 1.02
to overall company effectiveness n 212 321 205 Note:a Significant differences at .05 level between regions indicated by shared superscript.
The largest differences between hiring practices measured in the present study
and in the BPP are seen in current perceptions of appraisals as goal achievement
evaluations (mean difference of .32) and current perception of performance appraisals’
use in promotions planning (mean difference of -.33) (see Table 15).

59
Table 15 Comparison of Performance Appraisal Survey Items Between Present Study and Best Practices Project Present Study BPP Item * Mean SD Mean SD**
To determine an 2.70 0.99 2.94 - appropriate salary 4.11 0.75 3.90 - To plan employees’ 2.62 0.98 2.71 - training activities 3.92 0.81 4.05 - Awareness of good 3.00 0.90 3.00 - performance 4.13 2.02 3.94 - Design specific methods 2.91 0.94 2.74 - to improve performance 4.09 0.71 4.05 - Discuss about employees’ 2.65 0.99 2.71 - opinions 4.08 0.76 3.81 - Evaluation of employees' 3.14 0.91 2.82 - goal achievement 4.11 0.72 3.84 - Promotion planning 2.58 1.05 2.91 - 4.01 0.82 3.94 - N=722-742 N=220-241
Note:* Current practices means and standard deviations provided first (top value); desired practices means and standard deviations provided next (bottom value). ** SD not reported in BPP study.
Payment Practices
Overall means for current and desired payment practices, each comprised of four
items, were calculated across all regions, yielding Cronbach’s α values of .738 (scaled
M=10.87, SD=3.37) and .677 (scaled M=15.73, SD=2.67) respectively. These overall

60
means were compared to obtain national differences between current and desired
practices.
Based on a paired-samples t-test, the perceived current payment practices and
appraisal practices of combined regions (2.73) were significantly different (-1.25 mean
difference) than desired payment practices (3.98), t(739) = -34.48, p < .001. Significant
within-region differences were also seen between current or desired practices for all
three regions (Bogor, t(215) = -20.22, p < .001; Manado, t(320) = -22.31, p < .001:
Denpasar, t(202) = -18.13, p < .001 ) (see Table 16).
The means of combined items measuring perceptions of current payment
practices differed significantly across Bogor, Manado, and Denpasar F(2, 749)=25.68,
p<.05. The means of combined items measuring desired payment practices differed
significantly between Bogor and Manado, F(2, 737)=5.61, p<.05 (see Table 16).
Table 16 Combined Means for Current and Desired Payment Practices Across Regions Region Bogor Manado Denpasar Mean SD Mean SD Mean SD Current payment practices 2.42abcx .76 2.93abcy .87 2.76abcz .83 N 218 329 205 Desired payment practices 3.85ax .70 4.05ay .74 3.99z .63 N 216 321 203
Note:abc Significant differences at .05 level between regions indicated by shared superscript. xyz Significant differences within regions indicated by shared superscript at .05 level.

61
Significant differences were observed for seven of eight individual question
items. The only item that did not generate a significantly different response across
regions was the desire for pay to be used as a motivating tool (see Table 17). Significant
differences (p<.001) were present between all perceived and desired payment practices
compared within regions.
Table 17 Individual Payment Practice Survey Items Across Regions
Region
Bogor Manado Denpasar Item * Mean SD Mean SD Mean SD Seniority is considered 2.67a 1.14 3.02a 1.10 2.91 1.12 in the salary decision 3.54a 1.07 3.90a 1.08 3.75 .94 Pay is designed to 2.11ab 1.00 2.81a 1.18 2.67b 1.09 motivate employees 4.06 .79 4.17 .84 4.13 .76 Salary is based on 2.39ab 1.03 2.94ac 1.11 2.69bc 1.04 performance 3.98a .87 4.22a .78 4.13 .78 Significant salary gap 2.44ab 1.16 2.93a 1.15 2.74b 1.11 exists high and low 3.51a 1.05 3.82a 1.13 3.70 .99 performance employees
Note: * Current practices means and standard deviations provided as top value; desired practices means and standard deviations provided as bottom value. abc Significant differences at .05 level across regions’ respective current and desired practices indicated by shared superscript. Significant differences were observed between both combined means (F(2,
745)=4.88, p<.05) and perceived contribution towards employee satisfaction (F(2,
743)=4.08, p<.05). Perceived contribution to overall company effectiveness differed

62
significantly between both Bogor/Manado and Bogor/Denpasar (F(2, 741)=7.28, p<.05)
(see Table 18).
Table 18 Perceived Effectiveness of Current Payment Practices Region Bogor Manado Denpasar Mean SD Mean SD Mean SD Combined payment 3.48 0.95 3.65a 0.92 3.41a 0.93practices N 216 328 204 Salary system/practice contributes 3.46 1.12 3.52 1.06 3.30 1.06
to workers’ performance N 215 325 204 Salary system/practice contributes 3.48 1.08 3.68a 1.07 3.44a 1.04to employees’ satisfaction N 216 326 204 Salary system/practice contributes 3.51ab 0.98 3.76a 0.99 3.47b 0.95to overall company’s effectiveness N 215 326 203
Note: abc Significant differences at .05 level between regions indicated by shared superscript. The largest differences between payment practices measured in the present study
and in the BPP are seen in the level of desire to see payment based on seniority (mean
difference of .79) and desire for pay to be used as a motivating factor (mean difference
of .44) (see Table 19).

63
Table 19 Comparison of Payment Practices Items Between Present Study and Best Practices Project Present Study BPP Item * Mean SD Mean SD**
Seniority is considered in 2.89 1.123 3.01 - the salary decision 3.75 1.049 2.96 - Pay is designed to 2.57 1.144 2.82 - motivate employees 4.13 0.804 3.69 - Salary is based on 2.71 1.092 2.81 - performance 4.12 0.812 3.85 - N=731-746 N=241
Note:* Current practices means and standard deviations provided first (top value); desired practices means and standard deviations provided next (bottom value). ** SD not reported in BPP study.
Leadership
Overall means for current and desired leadership practices, each comprised of
five items, were calculated across all regions, yielding Cronbach’s α values of .800
(scaled M=15.15, SD=3.57) and .829 (scaled M=20.36, SD=2.95) respectively. These
overall means were compared to obtain national differences between current and desired
practices.
Based on a paired-samples t-test, the perceived current leadership practices of
combined regions (3.02) were significantly different (-1.04 mean difference) from
desired leadership practices (4.06), t(732) = -37.95, p < .001. Significant within-region
differences were also seen between current or desired practices for all three regions

64
(Bogor, t(213) = -19.88, p < .001; Manado, t(317) = -26.23, p < .001; Denpasar, t(200)
= -18.99, p < .001) (see Table 20).
The means of combined items measuring perceptions of current leadership
practices did not differ significantly across Bogor, Manado, and Denpasar t(749)=25.68,
p<.05. The means of combined items measuring desired leadership practices differed
significantly between Bogor and Manado, F(2, 730)=3.21, p<.05 (see Table 20).
Table 20 Combined Means for Current and Desired Leadership Practices Across Regions Region Bogor Manado Denpasar Mean SD Mean SD Mean SD Current leadership practices 2.95x .71 3.04y .74 3.06z .70 N 215 324 204 Desired leadership practices 3.98ax .64 4.12ay .59 4.07z .59 N 214 318 201
Note:a Significant differences at .05 level between regions indicated by shared superscript. xyz Significant differences within regions indicated by shared superscript at .05 level. Significant differences across regions were observed for five of ten individual
leadership practices question items (see Table 21). Significant differences (p<.001)
were present between all perceived and desired leadership practices compared within
regions.

65
Table 21 Individual Leadership Survey Items Across Regions
Region
Bogor Manado Denpasar Item z Mean SD Mean SD Mean SD Determines the specific 2.88 .97 2.93 .92 2.93 .81 goals to be achieved 3.88a .81 4.06a .73 4.03 .72 Emphasizes high 3.34 .96 3.29 .90 3.15 .87 standard of performance 3.81a .83 3.98a .84 3.95 .74 Friendly and open to 3.00 .97 3.17 .94 3.03 .96 employees' opinions 4.10a .73 4.26ab .72 4.10b .74 Shows enthusiasm for 2.47ab 1.04 2.82a 1.10 2.83ab .95 good performance 4.09 .75 4.13 .79 4.15 .71 Treats you with respect 3.12 .95 3.04a .99 3.35a .93 4.08 .85 4.17 .79 4.12 .78
Note: * Current practices means and standard deviations provided as top value; desired practices means and standard deviations provided as bottom value. abc Significant differences at .05 level across regions’ respective current and desired practices indicated by shared superscript. No significant differences in perceived effectiveness of current leadership
practices were observed across cultural regions (see Table 22).

66
Table 22 Perceived Effectiveness of Current Leadership Practices Region Bogor Manado Denpasar Mean SD Mean SD Mean SD Combined Leadership 3.6 0.91 3.63 0.99 3.65 0.87Practices N 214 321 204 Leadership system/practice contributes 3.60 1.00 3.54 1.00 3.59 0.96to workers’ performance N 213 321 204 Leadership system/practice contributes 3.51 1.02 3.63 0.97 3.65 0.95to employees’ satisfaction N 214 319 204 Leadership system/practice contributes 3.60 1.03 3.76 0.92 3.70 0.97to overall company’s effectiveness N 212 320 204
Communications Overall means for current and desired communication practices, each comprising
of six items, were calculated across all regions, yielding Cronbach’s α values of .822
(scaled M=17.85, SD=4.26) and .4.85 (scaled M=23.57, SD=4.19), respectively. These
overall means were compared to obtain national differences between current and desired
practices.
Based on a paired-samples t-test, the perceived current communication practices
of combined regions (2.95) were significantly different (-.97 mean difference) from
desired communication practices (3.92), t(740) = -33.21, p < .001. Significant within-
region differences were also seen between current or desired practices for all three

67
regions (Bogor, t(214) = -18.95, p < .001; Manado, t(321) = -21.58, p < .001; Denpasar,
t(203) = -16.72, p < .001 ) (see Table 23).
The means of combined items measuring perceptions of current communications
practices differed significantly between Bogor and Manado F(2, 744)=3.14, p<.05 (see
Table 23). No significant differences were observed for combined desired
communication practices between regions.
Table 23 Combined Means for Current and Desired Communications Practices Across Regions Region Bogor Manado Denpasar Mean SD Mean SD Mean SD Current communications 2.86ax .72 3.04ay .75 3.06z .67practices N 215 326 206 Desired communications 3.84x .59 3.98y .74 3.92z .75 practices N 215 323 204
Note:a Significant differences at .05 level between regions indicated by shared superscript using LSD post hoc test. xyz Significant differences within regions indicated by shared superscript at .05 level. Significant differences were observed for two of twelve individual
communication practices, which included current direct supervisors asking employee
opinions and clearly stating goals and objectives (see Table 24). Significant differences
(p<.001) were present between all perceived and desired communications practices
compared within regions.

68
Table 24 Individual Communication Survey Items Across Regions
Region
Bogor Manado Denpasar Item * Mean SD Mean SD Mean SD Informal communication is more effective 2.89 .86 2.96 .92 3.07 .83 than formal 3.66 .84 3.91 .81 4.05 3.54 Your direct supervisor 2.96 .99 3.11 1.00 3.15 .85 shows that he/she trusts you 3.86 .81 4.02 .75 3.91 .67 Your direct supervisor 2.74a 1.11 2.98 a 1.01 2.95 .96 often asks your opinion 3.90 .76 3.94 .75 3.91 .64 Your direct supervisor 3.17 1.01 3.25 1.00 3.16 .94 often gives suggestions 4.07 .73 4.12 .78 4.02 .64 Goals are stated clearly 3.08 a .90 3.28 a .89 3.11 .88 and easily understood 4.10 .73 4.29 2.80 4.07 .67 You are allowed to make 2.35 1.07 2.53 1.14 2.52 1.03 decisions usually made by 3.54 .93 3.57 1.00 3.53 1.01 higher management
Note: * Current practices means and standard deviations provided as top value; desired practices means and standard deviations provided as bottom value. abc Significant differences at .05 level across regions’ respective current and desired practices indicated by shared superscript. No significant differences in perceived effectiveness of current communications practices were observed across cultural regions (see Table 25).

69
Table 25 Perceived Effectiveness of Current Communications Practices Region Bogor Manado Denpasar Mean SD Mean SD Mean SD Combined Communication 3.71 0.81 3.71 0.82 3.64 0.85Practices n 213 328 206 Communication system/practice 3.71 0.92 3.57 0.96 3.58 0.97contributes to workers’ performance n 213 328 206 Communication system/practice 3.63 0.94 3.72 0.92 3.63 0.93contributes to employees' satisfaction n 214 327 206 Communication system/practice 3.82 0.97 3.88 0.88 3.70 0.91contributes to company’s effectiveness n 213 326 206
Summary The above findings indicate that employees located within the three studied
regions of Bogor, Manado, and Denpasar do possess significant differences in attitudes
and perceptions of HRM practices despite sharing a common nationality. These findings
and possible explanations for them will be further expounded upon in Chapter V.

70
CHAPTER V
SUMMARY, CONCLUSIONS, AND RECOMMENDATIONS
This chapter presents a summary of the current study’s findings and sets forth
conclusions and implications derived from the findings. Recommendations for the
application of findings and for further research are also included.
Summary
The fundamental purpose of this study was to determine whether
regional/religious/ethnic subcultural contexts found within the Indonesian national
setting significantly affected perception/practices of human resource management and
development of persons employed in the private food industrial sector. A secondary
purpose of the current study was to provide results able to be compared with those
recorded for Indonesia by the Best Practices Project (BPP). Understanding how cultural
contexts within a national setting may affect employees’ perceptions and preferences for
various HRM practices will allow companies to better tailor their policies to more
efficiently utilize their respective workforces as well as more effectively maintain
workforce job satisfaction (Debrah, et al., 2000; Huo & Von Glinow, 1995; Newman &
Nollen, 1996).
To measure potential differences in perceptions and practices across cultures,
portions of the original BPP instrument were shortened and translated into Bahasa
Indonesia. These instruments covered six main areas of HRM: management style
preferences, hiring and recruitment, performance appraisal, payment practices,

71
leadership, and communications. Employee perceptions of current and desired practices
in the remaining HRM areas were measured using a 5 point response scale.
These shortened instruments were administered to a total of 762 food industry
employees in cities located within three culturally distinct regions of Indonesia: West
Java, Bali, and North Sulawesi (Bogor, Denpasar, and Manado, respectively).
Conclusions
Findings by the current study indicate that employees’ perceptions and desires of
HRM practices do differ significantly across cultural boundaries even while sharing a
national context. These differences encompassed general areas of HRM as well as
individual practices.
Current Versus Desired HRM Practices
Comparisons of managerial styles across regions indicated that Indonesian
managers exhibit, with few exceptions, similar leadership behaviors. Exploitative and
benevolent authoritative styles were equally distributed across cultural regions
consultative management style was more prevalent in Bogor and Denpasar, while
participative group management was more apparent in Manado.
Employees in all three regions showed the least predilection for an exploitative
authoritative style. Employees in Bogor and Denpasar favored consultative management
while Manado employees favored participative group management. These patterns
indicate that, with the exception of those employees whose managers use exploitative
authoritative style, current management practices match employee preferences.

72
Comparisons between combined regional measures of current and desired
practices indicate that there is a significant difference between what Indonesian
employees perceive as current practices and practices that employees would like
enacted. Likert-scale measurements of current practices in all HRM areas were below 3,
or “to moderate extent.”
These differences between current and desired HRM practices ranged from -.65
to -1.29. These measures may be seen as an indicator of which areas employers are
more closely matching to their employees’ preferences. Mean differences of current and
desired training and development, performance appraisal, and payment practices (-1.29,
-1.27, and -1.25 respectively) indicate that these areas are not as closely matched to
employee preference.
Significant differences between current and desired combined practices appeared
in five of six HRM areas when compared across Indonesian cultural regions. Only
current and desired hiring combined practices showed no significant differences when
compared across cultural regions.
Bogor and Manado differed significantly in both current and desired training,
current appraisal, current and desired payment, desired leadership, and current
communications practices. Denpasar differed significantly from Bogor in the combined
measures of current pay practices only.

73
Individual HRM Items Significant differences were observed within each region between perceived
current and desired practices for each HRM item. This indicates that there are no
practices with which employees are completely satisfied.
Of 70 individual HRM practices items, 28 displayed a significant difference
across cultural regions. Of these 28, 15 were perceived current practices. The fewest
relative differences were observed within the areas of performance appraisal and
communication practices. The greatest number of significant differences was observed
between Sundanese/ Javanese and Minahasan employees.
Perceived Effectiveness of Current Practices
Significant differences in perceived effectiveness of current practices were
observed only in the areas of performance appraisal and payment practices. In both
areas, Manado respondents demonstrated higher perceived effectiveness in maintaining
or increasing employee satisfaction and overall company efficiency. This was also
reflected in higher scores on individual appraisal and payment practices.
Present Study Versus BPP Findings
In most cases, individual item scores in the present study differed from those
observed by the BPP. Of the 46 comparable items, 18 displayed absolute differences
greater than .25 with the largest overall differences occurring within the areas of hiring
and payment practices.

74
Respondents in the BPP study placed more emphasis on applicants’ ability to
perform technical requirements and skills tests than did participants in this study. BPP
respondents also downplayed both the current and desired importance of needing the
right connections to obtain the applied for position. In addition, BPP respondents cared
less about future coworkers’ opinions of the applicant than did those in the present study
(Huo et al., 2002).
BPP respondents and participants in the present study displayed few differences
within the HRM training and development area. BPP respondents gave more credence
to training as a current reward to employees but showed less desire to see this practice
increase than did current participants. Current participants indicated both a higher
perception and desire over BPP respondents for training to increase teamwork within the
company. BPP respondents reacted more negatively to current and desired abilities of
training to increase employees’ multitasking abilities (Drost et al., 2002).
The smallest overall difference between BPP and current scores was observed in
the HRM area of performance appraisal. BPP respondents placed more importance on
appraisals as a current method to determine both salary and promotions but placed less
desired value on these practices than did current participants. BPP respondents were
also less interested in using appraisals for goal achievement evaluation than were current
participants (Milliman, et al., 2002).
Although BPP respondents saw seniority as a pay determinate, they displayed
much less desired emphasis on this characteristic than did current participants. BPP
respondents also saw pay as more of a current motivator but desired this practice less

75
than did current participants. Current participants indicated a wish to see pay based on
performance (Lowe et al., 2002).
Recommendations for Further Research
In an effort to obtain comparable samples as well as to control for variances
which might have existed between industries, the current study focused singularly on the
private food handling and processing sector within Indonesia. To obtain a more
representative sample of HRM employee preferences within a culture, a wider section of
the business community should be measured. Such a study would need to insure close
representative pairings between businesses in each cultural context to reduce confounds
stemming from different company types.
Differences between measures of the current study and those of the BPP suggest
different sample populations were targeted by each study. BPP’s respondents were
overwhelmingly middle to upper management, whereas the majority of the current
study’s participants were low-level employees (Geringer et al., 2002).
Geographic location of the BPP sample population was not stipulated but may
presumably be centered in Jakarta, the industrial and political center of Java. A
population from such a cosmopolitan area would undoubtedly be ethnically diverse and
therefore present difficulties in obtaining culturally representative measures. A narrower
study focusing on management level employees could provide more comparable
measures to those found by the BPP.
Though few nations have the level of cultural diversity Indonesia possesses,
numerous countries are home to large groups of ethnically different populations. These

76
countries may serve as further evidence for the existence of different HRM perceptions
based on cultural background within a single national context.
Further studies can also measure different aspects of HRM than were covered by
the present study. Business enterprises may choose to measure HRM practices which
are specific to their respective industries.
Recommendations for Practice
Previous studies have demonstrated that employees’ attitudes and perceptions of
HRM practices vary across national and regional cultures (Hofstede, 2001). However,
this study determined that many of these attitudes also differ significantly across cultural
boundaries within a common national setting. This discovery has wide implications for
international companies who may be looking to establish overseas enterprises in
countries with diverse cultural populations. Local companies wishing to branch out to
other regions within their country would also benefit. By gaining a more detailed
understanding of culturally specific attitudes towards HRM policies, both international
and local companies can more closely tailor their respective policies to meet the needs
and wants of their employees. In doing so, companies can increase their workforces’
efficiency and competitive advantage.
Specifically, this study has direct implications for both local and international
companies which may be considering expansion into the studied regions of Indonesia.
Domestic companies should not take for granted cultural differences which may exist
among regions, as these can affect employees’ attitudes towards specific HRM practices.

77
International companies may need to tailor their HRM practices not only to Indonesia,
but to specific regional ethnicities as well. Acknowledging that current and preferred
HRM practices may be different from one’s present region or country can increase work
force satisfaction and productivity.
Regardless of the region in which a company is located, this study shows that
current practices do not coincide with those desired by employees. Every current
practice was significantly different from those preferred by employees. Changes could
be made to enable current practices to more closely resemble those preferred by
employees. Care should be taken, however, before changes in HRM policy are initiated.
Practices used by individual companies may be specifically tailored to that company’s
needs. While it may not match exactly what is preferred by employees, a practice could
represent the most efficient course of action for the company.
By observing differing employee perceptions and attitudes of HRM items across
regions, one may be able to construct a HR strategy that best fits each individual region
and its corresponding ethnic group. For instance, a Balinese or Javanese/Sundanese
company opening a branch in Manado may obtain better results from implementation of
a more participative style of management, as this style is both the most utilized and most
preferred by Minahasan employees.
When hiring employees in Bogor, Minahasan or Balinese companies should
consider placing more emphasis on individual interviews and skills tests than they would
if hiring in their home region. Balinese and Javanese/Sundanese companies may look to

78
more personal referrals as hiring references as these personal connections are deemed
more important in Manado.
Training and development practices also vary across regions. Both Balinese and
Minahasan employees see training more as a reward and as a way of increasing
understanding business technology and procedures than do Javanese/ Sundanese. Thus,
companies from these regions might place less of a reward emphasis on training and
devise new styles of introducing procedures which are more acceptable to their
Javanese/ Sundanese employees.
Because Minahasans feel training is important to the building of teamwork,
Balinese and Javanese/ Sundanese companies should develop ways to incorporate this
feature into their existing training programs. Minahasans also see company training as a
way of enabling employees to do multiple tasks and may respond less enthusiastically to
a rigid “one skill” training methodology.
Not many differences were observed across regions in the area of performance
appraisal. A few variations should be noted however. Minahasans indicated a stronger
desire for appraisals to be an evaluation of employees’ goal achievement as well as a
current factor in promotion planning than did their Balinese and Javanese/ Sundanese
counterparts. Accordingly, Balinese and Javanese/ Sundanese companies should place a
larger emphasis on recording and evaluating individual’s goals/ achievements when
employing Minahasans.
In comparison to performance appraisals, several differences existed in payment
practices across the studied regions. Seniority plays a larger factor in compensation in

79
Manado than either Bogor or Denpasar. Minahasan employees also demonstrate a
stronger desire for this practice than their Balinese or Javanese/Sundanese counterparts.
This was also true in the case of performance-based pay. Correspondingly, Minahasan
employees showed the highest ranking of a current existence of a salary gap between
low- and high-performing employees as well as the desire to see this practice continue.
Pay was least cited by Javanese/Sundanese employee’s as a motivator when compared
with Balinese and Minahasan participants. These factors seem to indicate that other
compensation systems are utilized within Javanese/Sundanese companies to motivate
and reward employees. Such compensation techniques should be ascertained and
incorporated by entering companies.
Though all three groups rated the current practices equally, Balinese and
Minahasan employees rated a greater desire for their direct leadership to determine
specific goals and to emphasize a high standard of performance than did Javanese/
Sundanese. Balinese employees indicated that their direct supervisors treat them with
respect more often than did Minahasan and Javanese/ Sundanese employees. These
results suggest that companies operating in Manado should direct their managers to
make efforts to listen to employee feedback as well as place emphasis on specific goals.
Balinese and Minahasan employees indicated that supervisors are more likely to
ask their opinions than did their Javanese/Sundanese counterparts. However, each
regional group ranked this practice as equally desirable. Minahasans also ranked clearly
stated goals higher than the other regional groups.

80
The above suggestions are based upon the specific items compared in this study,
whose main purpose was to discover whether differences existed between cultural
groups within Indonesia. Companies seeking entry to these regions, or those in other
culturally diverse nations, should take into account that such differences may exist in
other specific areas of human resource management and plan accordingly.

81
REFERENCES
Aycan, Z., Kanungo, R., Medonca, M., Yu, K, Deller, J., Stahl, G., & Kurshid, A. (2000). Impact of human resource management practices: A 10-country comparison. Applied Psychology: An International Review, 49(1), 192-221. Aycan, Z., Kanungo, R., & Sinha, J. (1999). Organizational culture and human resource management practices: The model of culture fit. Journal of cross-cultural psychology, 30(4), 501-526. Badan Pusat Statistik (2007). Employment Statistics. Retrieved February 17, 2007, from http://www.bps.go.id/sector/employ/table2.shtml Bank Indonesia (2004a). Information system of Baseline Economic Survey Executive Summary (KPJu) Province: Bali. Retrieved February 17, 2007, from http://www.bi.go.id/sipuk/en/?id=2&no=1010402&idrb=21&prop=51 Bank Indonesia (2004b). Information system of Baseline Economic Survey Executive Summary (KPJu) Province: North Sulawesi. Retrieved February 17, 2007, from http://www.bi.go.id/sipuk/en/?id=2&no=1010501&idrb=21&prop=71 Barth, F. (1993). Balinese Worlds. Chicago, Illinois: University of Chicago Press. Begin, J., (1992). Comparative human resource management (HRM): A systems perspective The International Journal of Human Resource Management, 3(3), 379-408. Belo, J. (1970). Traditional Balinese Culture. Columbia University Press. Birmingham, M. (1999). Revisiting Agricultural extension: Experiences in less industrialized countries. Journal of International Agricultural and Extension, 6(2), 19-26. Bitsch, V. & Olynk, N. (2007). Pork managers’ perception of labor management practices and their risks. In Selected Paper prepared for presentation at the American Agricultural Economics Association Annual Meeting, Portland, Oregon, July 28-August 1, (pp. 1-31). Retrieved February 22, 2008 from http://ageconsearch.umn.edu/bitstream/123456789/27313/1/sp07bi01.pdf Brewster, C., & Larsen, H. H. (1992). Human resource management in Europe: Evidence from ten countries. The International Journal of Human Resource Management, 3(3), 408-434.

82
Brislin, R. (1970). Back-translation for cross-cultural research. Journal of Cross- Cultural Psychology, 1(3), 185-216. Brown, W. & Fritz, S. (1994). Management/ development Offerings in Post-Secondary Departments of Agricultural Education. Journal of Agricultural Education 35(3)1-5. Budhwar, P. S., & Sparrow, P. R. (2002). An integrative framework for understanding cross-national human resource management practices. Human Resource Management Review, 12, 377-403. Budhwar, P. S., & Khatri, N. (2001). A comparative study of HR practices in Britain and India. The International Journal of Human Resource Management, 12(5), 800-826. Burton, O., Schurle, B., Williams, J., & Brester, W. (1996). Teaching management for specialized agricultural industries. American Journal of Agricultural Economics, 78(5). 1222-1227. Clark, T. Gospel, H., & Montgomery, J. (1999). Running on the spot? A review of twenty years of research on the management of human resources in comparative and international perspective. The International Journal of Human Resource Management, 10(3), 520-544. Chalmers, I. (2006). Indonesia: An introduction to contemporary traditions. Oxford: University Press. Debrah, Y, McGovern, I. &, Budhwar, P. (2000). Complementarity or competition: the development of human resources in a South-East Asian growth triangle: Indonesia, Malaysia and Singapore. International Journal of Human Resource Management, 11(2). 314-335. Drost, E. A., Frayne, C. A., Lowe, K. B., & Geringer, J. M. (2002). Benchmarking training and development practices: A multi-country comparative analysis. Human Resource Management, 41(1), 67-86. Easterby-Smith, M., Malina, D., & Yuan, L. (1995). How culture-sensitive is HRM? A comparative analysis of practice in Chinese and UK companies. The International Journal of Human Resource Management, 6(1) 31-59. Erven, B. (2001). Human resource management: Making your dairy farm an appealing place to work. In Proceedings of the Western Dairy Management Conference, April 8-10, (pp. 139-144). Las Vegas, Nevada. Retrieved February 20, 2008 from http://www.wdmc.org/1999/AppealingPlace.pdf

83
FAO (2003). Assuring food safety and quality: Guidelines for strengthening national food control systems. FAO Food and Nutrition Papers. 76-80. Retrieved February 21, 2008 from http://www.who.int/foodsafety/ publications/fs_management/guidelines_foodcontrol/en/ Freyer, D., & Jackson, J. (1977). Indonesia. Boulder, Colorado: Westview Press. Fritz, S., Hoover, T., Weeks, W., Townsend, C., & Carter, R. (2003). Re-examining the growth of leadership programs in departments of agricultural education. Retrieved February 20, 2008 from http://pubs.aged.tamu.edu/conferences/ SRAERC2001/pdf/p5.pdf Geertz, H. (1960). The Javanese Family: A study of kinship and socialization. New York: The Free Press of Glencoe, Inc. Geringer, J. M., Frayne, C. A., & Milliman, J. F. (2002). In search of “best practices” in international human resource management: Research design and methodology. Human Resource Management, 41(1), 5-30. Grant, B. (1965). Indonesia. Carlton, Victoria, Australia: Melbourne University Press. Henley, D. (1993). Nationalism and Regionalism in Colonial Indonesia: The Case of Minahasa. Indonesia, 55, 91-112. Heriawan, R. (2004). Improving the quality of Informal Sector Statistics – Country Experience. In 7th Meeting of the Expert Group on Informal Sector Statistics (Delhi Group) 2 -4 February 2004. New Delhi, India. Retrieved February 17, 2007, from http://www.mospi.nic.in/rusman_heriawan_a.htm Hofstede, G. (2001). Cultures consequences: Comparing values, behaviors, institutions ,and organizations across nations. (2nd ed.). London: Sage Publications. Hofstede, G. (1983). The cultural relativity of organizational practices and theories. Journal of International Business Studies, 14(2), 75-89. Huo, Y., Huang, H., & Napier, N. (2002). Divergence of convergence: A cross- national comparison of personnel selection practices. Human Resource Management, 41(1), 31-44. Huo, P, & Von Glinow, M. (1995). On transplanting human resource practices to China: A culture-driven approach. International Journal of Manpower, 16(9), 3-15.

84
Hutchings, K. & Ratnasari, S. (2006). Cross-cultural non-work transition stresses: domestic transferees in Indonesia. Cross Cultural Management, 13(2), 114-138. Jackson, S. E., & Schuler, R. S. (1995). Understanding human resource management in the context of organizations and their environments. Annual Review of Psychology, 46, 237-264. Jensen, G., & Suryani, L. (1992). The Balinese people: a reinvestigation of character. Oxford University Press. Kamoche, K. (2002). Introduction: Human resource management in Africa. International Journal of Human Resource Management, 3(7), 993-997. Karbasioun, M. & Mulder, M. (2004). HRM and HRD in agricultural extension organizations in Iran: A literature review. In AIAEE 2004 Proceedings of the 20th Annual Conference (pp. 13-24). Retrieved February 20, 2008 from http://www.aiaee.org/2004/Accepted/021.pdf Kingsbury, D & Aveling, H. (2002). Nation versus state in Indonesia. In D. Kingsbury & H. Aveling (Eds.) Autonomy and Disintegration in Indonesia (pp. 1-8). New York: RoutledgeCurzon. Kidger, P. (1991). The emergence of international human resource management. International Journal of Human Resource Management, 2(2), 149-163. Koentjaraningrat. (1990). Javanese Culture. Singapore: Oxford University Press. Kumar, A. (2003). The state and the status of the nation. In D. Kingsbury & H. Aveling (Eds.) Autonomy and Disintegration in Indonesia (pp. 45-63). New York: RoutledgeCurzon. Lamoureux, F. (2003). Indonesia: A global studies handbook. Denver, Colorado: ABC-CLIO. Likert, R. (1967). The human organization: Its management and value. St. Louis: McGraw Hill. Lowe, K., Milliman, J., De Cieri, H., & Dowling, P. (2002). International compensations: A ten-country comparative analysis. Human Resource Management, 41(1), 45-66. Marquardt, M., & Berger, N. (2003). The future: Globalization and new roles for HRD. Advances in Developing Human Resources, 5(3), 283-295.

85
McGuire, D., O’Donnell, D., Garavan, T. N., Saha, S. K., & Murphy, J. (2002) The cultural boundedness of theory and practice in HRD? Cross Cultural Management, 9(2), 25-44. Milliman, J., Nason, S., Zhu, C., & De Cieri, H. (2002). An exploratory assessment of the purposes of performance appraisals in North and Central America and the Pacific Rim. Human Resource Management, 41(1), 87–102. McVey, R. (2002). Nation versus state in Indonesia. In D. Kingsbury & H. Aveling (Eds.) Autonomy and Disintegration in Indonesia (pp. 11-27). New York: RoutledgeCurzon. Morden, T. (1995). International culture and management. Management Decision, 33(2), 16-21. Neelankavil, J., Mathur, A., & Zhang, Y. (2000). Determinants of managerial performance: A cross-cultural comparison of the perceptions of middle-level managers in four countries. Journal of International Business Studies, 31(1), 121-140. Newman, K., & Nollen, S. (1996) Culture and congruence: The fit between management practices and nations. Journal of International Business Studies, 27(4), 753-779. Palmier, L. H. (1969). Social status and power in Java. London: The Athlone Press, University of London.
Parker, L. (2003). From Subjects to Citizens: Balinese Villagers in the Indonesian. Copenhagen, Denmark: Nordic Institute of Asian Studies.
Renwarin, P. (2006). Matuari and Tona’as: The cultural dynamics of the Tombulu in Minahasa. (Doctoral dissertation, Leiden University, 2006). Retrieved March 5, 2008, from https://openaccess.leidenuniv.nl/handle/1887/4442?mode=more
Schefold, R. (1995). The heroic theft. In R. Schefold (Ed.) Minahasa Past and Present: Tradition and transition in an outer island region in Indonesia. (pp. 22-31). Leiden, The Netherlands: CNWS Publications. Schouten, M. (1995). Wa’ilan and Bos: Status seeking in Minahasa. In R. Schefold (Ed.) Minahasa past and present: Tradition and transition in an outer island region in Indonesia. (pp. 7-21). Leiden, The Netherlands: CNWS Publications. Schuler, R., Budhwar, P., & Florkowski, G. (2002). International human resource management review and critique. International Journal of Management Reviews, 4(10), 41-70.

86
Schuler, R., & MacMillan, I. (1984). Gaining competitive advantage through human resource management practices. Human Resource Management, 23(3), 241-255. Shonhiwa, S., & Gilmore, H., (1996). Development of human resources: A portfolio strategy. SAM Advanced Management Journal, 61(1), 16-23. Smith, B., Bond, M., & Kagıtcıbasl, C. (2006). Understanding social psychology across cultures: Living and working in a changing world. London: Sage Publications. Smith, P. & Bond, M. (1993). Social psychology across cultures analysis and perspectives, U.K: Harvester Press.
Sonka, T., & Hudson, A. (1989). Why agribusiness anyway? Agribusiness, 5(4),
305-314. Sparrow, P., Schuler, R., & Jackson, S. (1994). Convergence or divergence? Human resource practices and policies for competitive advantage world-wide. International Journal of Human Resource Management, 5(2), 267-99. Sulaiman, R. & van den Ban, A. (2000) Reorienting agricultural extension curricula in India. Journal of Agricultural Education and Extension. 7(2), 69-78. Sutarto, A. (2006). Becoming a true Javanese: A Javanese view of attempts at Javanisation. Indonesia and the Malay World, 34(98), 39-53. Suryadinata, L., Arifin, E., & Ananta, A. (2003). Indonesia’s Population: Ethnicity and religion in a changing political landscape. Singapore: Institute of Southeast Asian Studies. Tayeb, M. (1995). The competitive advantage of nations: the role of HRM and its socio-cultural context. The International Journal of Human Resource Management, 6(3), 588-605. Taylor, J. (2003). Indonesia: Peoples and histories. New Haven: Yale University Press. Tessema, M, Soeters, J., & Abraham, K. (2005). Practices and challenges of the training and utilization of labour in sub-Saharan Africa: The case of the Eritrean civil service. International Journal of Training and Development, 9(4). 214-231. Verburg, R. M., Drenth, P. J. D., Koopman, P. L., van Muijen, J. J., & Wang, Z. (1999). Managing human resources across cultures: a comparative analysis of practices

87
in industrial enterprises in China and The Netherlands. The International Journal of Human Resource Management, 10(3), 391-410. Von Glinow, M., Drost, E., & Teagarden, M. (2002). Converging on IHRM best practices: Lessons learned from a globally distributed consortium on theory and practice. Human Resource Management, 41(1), 123-140 Wessing, R. (1977). The position of the Baduj in the larger West Javanese society. Man, 12(2), 293-303. Williams, W. L. (1990). Javanese lives: Women and men in modern Indonesian society. New Brunswick: Rutgers University Press. Wright, P.M., McMahan, G. C., & McWilliams, A. (1994). Human resources as a source of sustained competitive advantage: A Resource-based Perspective. International Journal of Human Resource Management, 5, 301-326.

88
APPENDIX A
Karyawan yang terhormat, Kami mohon kerjasama Anda untuk melengkapi kuesioner yang terlampir. Kuesioner tersebut menanyakan pendapat Anda mengenai berbagai aspek Praktik Manajemen Sumber Daya Manusia (MSDM) di perusahaan Anda. Tidak ada jawaban benar atau salah, kami menginginkan pendapat jujur Anda. Survei ini akan memakan waktu 20-30 menit. Ini merupakan bagian dari suatu studi global yang bertujuan membentuk praktik MSDM yang lebih baik. Semua respon Anda akan kami rahasiakan. Respon Anda tidak akan dilihat oleh siapapun di perusahaan Anda. Terima kasih atas kesediaan Anda untuk berpartisipasi, kami sangat menghargainya. Salam. Dear employees, We would like your participation to complete the attached questionnaire. This questionnaire will ask for your opinion about many aspects of the human resources management practices at your company. There is no right or wrong answer, we want your honest opinion. This survey will take around 20-30 minutes to complete. This questionairre is a part of a global study with a purpose to form a better human resources management practice. All of your responses will be kept confidential. Your responses will not be seen by anyone in your company. Thank you for your participation, we appreciate it a lot. Regards,

89
TIPE MANAJER MANAGER TYPE
Berikut ini adalah deskripsi dari empat tipe manajer yang berbeda. Sebelum menjawab pertanyaan, mohon baca terlebih dahulu keseluruhan deskripsi Following are descriptions of four different type of manager. Before answering the questions, please read through all the descriptions. Manajer 1: Membuat keputusan-keputusan dengan cepat dan
mengkomunikasikannya kepada bawahan dengan jelas dan tegas. Bawahan diharapkan untuk melaksanakan keputusan tanpa argumentasi. Quickly makes decisions and communicate them with the employees strong and clear. Employees are expected to follow the desicions without any arguments.
Manajer 2: Membuat keputusan-keputusan dengan cepat. Sebelum melangkah lebih
jauh, menjelaskan alasan keputusan tersebut kepada bawahan serta menjawab pertanyaan-pertanyaan yang mungkin muncul.
Quickly makes decisions. Before continuing further, explains the reason of the decisions to the employees and answers all questions that might arise.
Manajer 3: Berkonsultasi dengan bawahan sebelum mencapai suatu keputusan.
Mempertimbangkan nasihat lalu membuat keputusan. Bawahan diharapkan untuk taat melaksanakan keputusan yang dibuat, meskipun tidak sesuai dengan nasihat yang mereka berikan.
Discusses with employees before coming up with a decision. Considers any suggestions then make the decision. Employees are expected to follow the decision made, although it might not agree with the suggestions they gave.
Manajer 4: Melaksanakan rapat dengan bawahan saat akan membuat keputusan.
Keputusan dibuat berdasarkan suara terbanyak. Confers with employees to make a decision. The decision made based on
vote.
1. Berikan tanda pada salah satu tipe manajer yang paling Anda sukai dalam pekerjaan. Mark on the type of manager you like the most at work.
1. Manajer 1 ___________ 3. Manajer 3 ___________ 2. Manajer 2 ___________ 4. Manajer 4 ___________

90
2. Dari keempat tipe manajer di atas, yang manakah yang paling mendekati tipe atasan Anda?
From the four type of manager above, which one is the most similar to your current supervisor?
1. Manajer 1 ___________ 3. Manajer 3 ___________ 2. Manajer 2 ___________ 4. Manajer 4 ___________
PROSES REKRUTMEN KARYAWAN EMPLOYEE RECRUITING PROCESS
Seberapa tepat pernyataan-pernyataan dibawah menggambarkan Proses Rekrutmen di perusahaan Anda? Untuk setiap pernyataan, berikan dua jawaban. How accurate the following statements to describe the recruiting process in your company ? For each question, pelase provide two answers. Pertama, gunakan kolom kiri untuk menunjukkan sejauh mana pernyataan-pernyataan dibawah ini menggambarkan Proses Rekrutmen yang sekarang berlangsung (SEKARANG). First. Use the left column to show how accurate the following statements to desribe the recruiting process that currenty take place in your company (CURRENT PRACTICE) Kedua, gunakan kolom kanan untuk menunjukkan sejauh mana pernyataan-pernyataan dibawah ini menggambarkan Proses Rekrutmen yang seharusnya dilaksakanakan untuk meningkatkan efektivitas perusahaan (SEHARUSNYA). Second. Use the column on the right to show how accurate the following statements to describe the recruiting process that should be done to increace the company’s efficiency. (DESIRED PRACTICE) Gunakan skala berikut ini: Use the following scale: 1 2 3 4 5 Tidak sama sekali Sedikit Sedang Banyak Sangat Banyak Not at all A little Somehow A lot Very much

91
Keputusan rekrutmen dipengaruhi oleh: SEKARANG SEHARUSNYA Recruiting decision is determined by: NOW SUPPOSEDLY
1. Kemampuan pelamar untuk melaksanakan | hal-hal teknis yang berkaitan dengan pekerjaan. 1 2 3 4 5 | 1 2 3 4 5 Applicant’s ability to do technical things related to the job. | 2. Wawancara individual. 1 2 3 4 5 | 1 2 3 4 5 Individual interview | 3. Kemampuan pelamar untuk bersosialisasi | dengan orang lain. 1 2 3 4 5 | 1 2 3 4 5 Applicant’s ability to socialize/interact with other people | 4. Koneksi (famili, teman, kesamaan suku, agama, dll.) | pelamar dengan perusahaan. 1 2 3 4 5 | 1 2 3 4 5 Relationship (family, friend, race, religion, etc.) Between applicants and the company |
5. Ujian pegawai untuk | mengetahui kemampuan mereka. 1 2 3 4 5 | 1 2 3 4 5 An emploment test to know their skill/capability |
6. Kesesuaian pelamar dengan nilai-nilai dan | kebiasaan dalam perusahaan. 1 2 3 4 5 | 1 2 3 4 5 Applicant’s match with the company’s value and custom |
7. Pendapat calon rekan kerja tentang apakah orang | tersebut harus dipakai atau tidak. 1 2 3 4 5 | 1 2 3 4 5 Opinion from future co-worker whether he/she should be hired or not Gunakan skala yang sama untuk menunjukkan kontribusi Proses Rekrutmen di perusahaan Anda. Use the same scale to show the recruting process contribution in your company 1. Proses rekrutmen berkontribusi terhadap kinerja tinggi karyawan. 1 2 3 4 5 Recruiting process affects employees good performance
2. Proses rekrutmen berkontribusi terhadap rasa senang/puas karyawan akan pekerjaannya. 1 2 3 4 5 Recruiting process affects emplyees satisfaction/dissatisfaction at his/her work
3. Proses rekrutmen berkontribusi positif terhadap
efektivitas perusahaan secara keseluruhan. 1 2 3 4 5 Recruiting process positively contributes to overall company’s effectiveness

92
TUJUAN PROSES PELATIHAN DAN PENGEMBANGAN Seberapa tepat pernyataan-pernyataan dibawah menggambarkan tujuan Proses Pelatihan dan Pengembangan di perusahaan Anda? Untuk setiap pernyataan, berikan dua jawaban. How accurate the following statements to describe the purpose of training and development process in your company? Pertama, gunakan kolom kiri untuk menunjukkan sejauh mana pernyataan-pernyataan dibawah ini menggambarkan tujuan Proses Pelatihan dan Pengembangan yang sekarang berlangsung (SEKARANG). First. Use the left column to show how accurate the following statements to desribe the purpose of training and development process that currenty take place in your company (CURRENT PRACTICE) Kedua, gunakan kolom kanan untuk menunjukkan sejauh mana pernyataan-pernyataan dibawah ini menggambarkan tujuan Proses Pelatihan dan Pengembangan yang seharusnya diperoleh untuk peningkatan efektivitas perusahaan (SEHARUSNYA). Second. Use the column on the right to show how accurate the following statements to describe the purpose of training and development process that should be done to increace the company’s efficiency. (DESIRED PRACTICE) Gunakan skala berikut ini: Use the following scale: 1 2 3 4 5 Tidak sama sekali Sedikit Sedang Banyak Sangat banyak Not at all A little Somehow A lot Very much SEKARANG SEHARUSNYA NOW SUPPOSEDLY | 1. Menyediakan penghargaan untuk karyawan. 1 2 3 4 5 | 1 2 3 4 5 Provide awards to the employees | 2. Meningkatkan kemampuan teknis karyawan. 1 2 3 4 5 | 1 2 3 4 5 Increase employee’s technical skills | 4. Memperbaiki kinerja buruk karyawan di masa lalu. 1 2 3 4 5 | 1 2 3 4 5 Fix employees bad performance in the past | 6. Membangun kerjasama dalam perusahaan. 1 2 3 4 5 | 1 2 3 4 5 Build the teamwork in the company | 7. Membantu karyawan memahami bisnis (contoh: | wawasan mengenai pesaing, teknologi baru, dsb.). 1 2 3 4 5 | 1 2 3 4 5 Help employee understand the business (e.g. (knowledge about competitor, new technology, etc) | 8. Membuat karyawan mampu melakukan | berbagai pekerjaan, tidak hanya satu jenis pekerjaan. 1 2 3 4 5 | 1 2 3 4 5 Enables employees to do multiple work/task, not only One type of job/work Gunakan skala yang sama untuk menunjukkan sejauh mana kontribusi Proses Pelatihan dan Pengembangan di perusahaan Anda. Use the same scale to show how far the contribution of training and development process in your company
1. Proses Pelatihan berkontribusi terhadap kinerja tinggi karyawan. 1 2 3 4 5
Training process contributes to employee’s high/good performance
2. Proses Pelatihan berkontribusi terhadap rasa senang/puas karyawan akan pekerjaannya. 1 2 3 4 5
Training process contibutes to employees satistaction/dissatisfaction At his/her work 3. Proses Pelatihan berkontribusi positif terhadap efektivitas perusahaan secara keseluruhan. 1 2 3 4 5 Training process contributes positively to Overall company’s effectiveness

93
TUJUAN PENILAIAN KINERJA PURPOSE OF WORK PERFORMANCE EVALUATION
Seberapa tepat pernyataan-pernyataan dibawah menggambarkan tujuan Penilaian Kinerja di perusahaan Anda? Untuk setiap pernyataan, berikan dua jawaban. How accurate the following statements to describe the purpose of work performance evaluation in your company? Pertama, gunakan kolom kiri untuk menunjukkan sejauh mana pernyataan-pernyataan dibawah ini menggambarkan tujuan Penilaian Kinerja yang sekarang berlangsung (SEKARANG). First. Use the left column to show how accurate the following statements to desribe the purpose of work performance evaluation that currenty take place in your company (CURRENT PRACTICE) Kedua, gunakan kolom kanan untuk menunjukkan sejauh mana pernyataan-pernyataan dibawah ini menggambarkan tujuan Penilaian Kinerja yang seharusnya untuk meningkatkan efektivitas perusahaan (SEHARUSNYA). Second. Use the column on the right to show how accurate the following statements to describe the purpose of work performance evaluation that should be done to increace the company’s efficiency. (DESIRED PRACTICE) Gunakan skala berikut ini: 1 2 3 4 5 Tidak sama sekali Sedikit Sedang Banyak Sangat banyak Not at all A little Somehow A lot Very much SEKARANG SEHARUSNYA NOW SUPPOSEDLY Berbagai kemungkinan tujuan penilaian kinerja: Possibilites for the purpose of work performance evaluation: 1. Untuk menentukan gaji yang sesuai. 1 2 3 4 5 | 1 2 3 4 5 To determine an appropriate salary | 2. Untuk merencanakan kegiatan bawahan |
(contoh: pelatihan, tugas baru) 1 2 3 4 5 | 1 2 3 4 5 To plan employees activity (e.g. training, new task) | 3. Untuk mengetahui kinerja baik |
yang dilakukan bawahan. 1 2 3 4 5 | 1 2 3 4 5 To be aware of good performance done by employees |
4. Untuk merancang cara-cara spesifik agar bawahan | bisa meningkatkan kinerja. 1 2 3 4 5 | 1 2 3 4 5
To design specific ways for employees to improve His/her performance | 5. Untuk mendiskusikan pendapat-pendapat bawahan. 1 2 3 4 5 | 1 2 3 4 5 To discuss about employees opinions | 6. Untuk mengevaluasi pencapaian tujuan bawahan. 1 2 3 4 5 | 1 2 3 4 5 To evaluate employees goal achievement | 7. Untuk menentukan promosi bawahan. 1 2 3 4 5 | 1 2 3 4 5 To determine employees promotion Gunakan skala yang sama untuk menunjukkan sejauh mana kontribusi Proses Penilaian Kinerja di perusahaan Anda. Use the same scale to show how far the contribution of performance evaluation process in your company.
1. Proses Penilaian Kinerja berkontribusi terhadap kinerja tinggi karyawan. 1 2 3 4 5 Performance evaluation process contributes to Workers high/good performance
2. Proses Penilaian Kinerja berkontribusi terhadap rasa senang/puas karyawan akan pekerjaannya. 1 2 3 4 5
Performance evaluton contibutes to employees satistaction/dissatisfaction
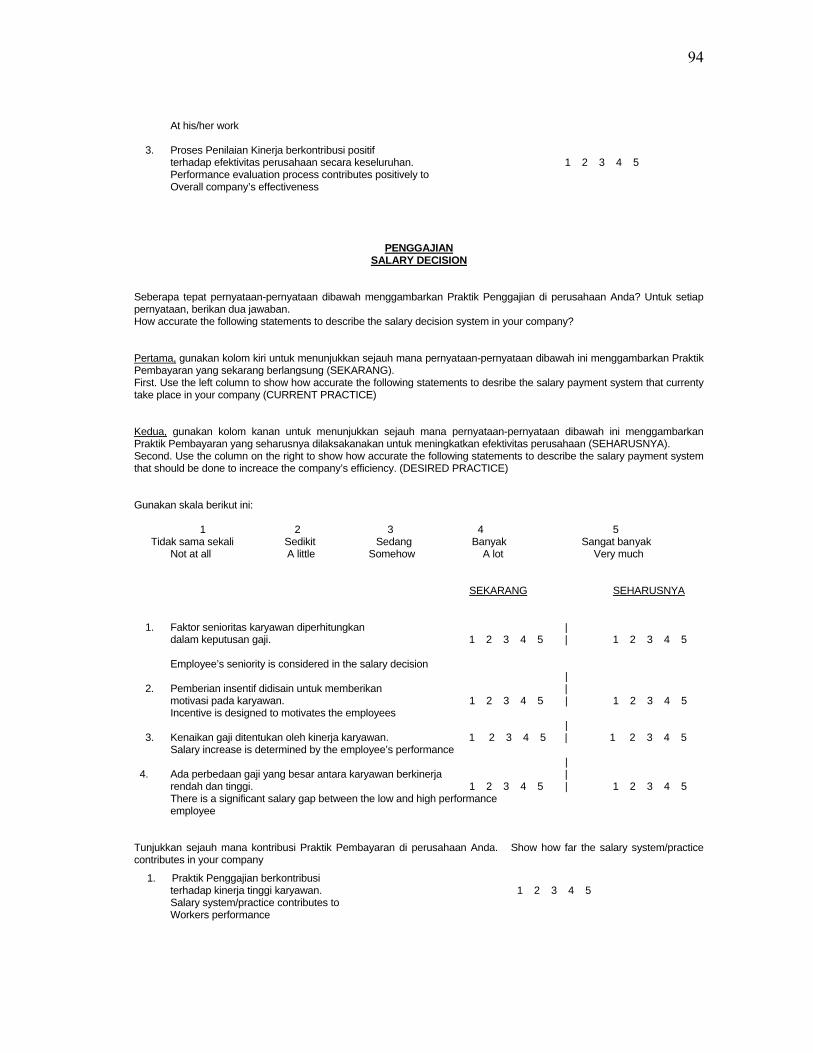
94
At his/her work 3. Proses Penilaian Kinerja berkontribusi positif terhadap efektivitas perusahaan secara keseluruhan. 1 2 3 4 5 Performance evaluation process contributes positively to Overall company’s effectiveness
PENGGAJIANSALARY DECISION
Seberapa tepat pernyataan-pernyataan dibawah menggambarkan Praktik Penggajian di perusahaan Anda? Untuk setiap pernyataan, berikan dua jawaban. How accurate the following statements to describe the salary decision system in your company? Pertama, gunakan kolom kiri untuk menunjukkan sejauh mana pernyataan-pernyataan dibawah ini menggambarkan Praktik Pembayaran yang sekarang berlangsung (SEKARANG). First. Use the left column to show how accurate the following statements to desribe the salary payment system that currenty take place in your company (CURRENT PRACTICE) Kedua, gunakan kolom kanan untuk menunjukkan sejauh mana pernyataan-pernyataan dibawah ini menggambarkan Praktik Pembayaran yang seharusnya dilaksakanakan untuk meningkatkan efektivitas perusahaan (SEHARUSNYA). Second. Use the column on the right to show how accurate the following statements to describe the salary payment system that should be done to increace the company’s efficiency. (DESIRED PRACTICE) Gunakan skala berikut ini: 1 2 3 4 5 Tidak sama sekali Sedikit Sedang Banyak Sangat banyak Not at all A little Somehow A lot Very much SEKARANG SEHARUSNYA 1. Faktor senioritas karyawan diperhitungkan | dalam keputusan gaji. 1 2 3 4 5 | 1 2 3 4 5 Employee’s seniority is considered in the salary decision | 2. Pemberian insentif didisain untuk memberikan | motivasi pada karyawan. 1 2 3 4 5 | 1 2 3 4 5 Incentive is designed to motivates the employees | 3. Kenaikan gaji ditentukan oleh kinerja karyawan. 1 2 3 4 5 | 1 2 3 4 5 Salary increase is determined by the employee’s performance | 4. Ada perbedaan gaji yang besar antara karyawan berkinerja | rendah dan tinggi. 1 2 3 4 5 | 1 2 3 4 5 There is a significant salary gap between the low and high performance employee Tunjukkan sejauh mana kontribusi Praktik Pembayaran di perusahaan Anda. Show how far the salary system/practice ontributes in your company c
1. Praktik Penggajian berkontribusi terhadap kinerja tinggi karyawan. 1 2 3 4 5 Salary system/practice contributes to Workers performance

95
2. Praktik Penggajian berkontribusi terhadap rasa senang/puas karyawan akan pekerjaannya. 1 2 3 4 5
Salary system/practice contibutes to employees satistaction/dissatisfaction At his/her work 3. Praktik Penggajian memberikan bekontribusi positif terhadap efektivitas perusahaan secara keseluruhan. 1 2 3 4 5 Salary system/practice contributes positively to overall company’s effectiveness
KEPEMIMPINAN LEADERSHIP
Seberapa tepat pernyataan-pernyataan dibawah menggambarkan Praktik Kepemimpinan di perusahaan Anda? Untuk setiap pernyataan, berikan dua jawaban. How accurate the following statements to describe the leadership system/practice in your company? Pertama, gunakan kolom kiri untuk menunjukkan sejauh mana pernyataan-pernyataan dibawah ini menggambarkan Praktik Kepemimpinan yang sekarang berlangsung (SEKARANG). First. Use the left column to show how accurate the following statements to desribe leadership system/practice that currenty take place in your company (CURRENT PRACTICE) Kedua, gunakan kolom kanan untuk menunjukkan sejauh mana pernyataan-pernyataan dibawah ini menggambarkan Praktik Kepemimpinan yang seharusnya dilaksakanakan untuk meningkatkan efektivitas perusahan (SEHARUSNYA). Second. Use the column on the right to show how accurate the following statements to describe the leadership system/practice that should be done to increace the company’s efficiency. (DESIRED PRACTICE) Gunakan skala berikut ini: 1 2 3 4 5 Tidak sama sekali Sedikit Sedang Banyak Sangat banyak Not at all A little Somehow A lot Very much Atasan langsung Anda: SEKARANG | SEHARUSNYA Your direct supervisor : NOW SUPPOSEDLY | | 1. Menentukan tujuan spesifik untuk Anda capai. 1 2 3 4 5 | 1 2 3 4 5 Determine the specific goals to be achieved | 2. Menekankan standar kinerja yang tinggi. 1 2 3 4 5 | 1 2 3 4 5 Emphasize on a high standard performance | 3. Bersahabat dan mudah menerima pendapat. 1 2 3 4 5 | 1 2 3 4 5 Friendly and open to opinions | 4. Antusias untuk melihat dan memberi | penghargaan atas kinerja yang baik. 1 2 3 4 5 | 1 2 3 4 5 Enthusiastic to see and give awards to a good performance 5. Memperlakukan Anda dengan hormat. 1 2 3 4 5 | 1 2 3 4 5 Treat you with respect Gunakan skala yang sama untuk menunjukkan sejauh mana kontribusi Praktik Kepemimpinan di perusahaan Anda. Use the same scale to show how far the leadership system/practice contributes in your company
1. Praktik Kepemimpinan berkontribusi terhadap kinerja tinggi karyawan. 1 2 3 4 5 Leadership system/practice contributes to Workers performance
2. Praktik Kepemimpinan berkontribusi terhadap rasa senang/puas karyawan akan pekerjaannya. 1 2 3 4 5
Leadership system/practice contibutes to employees satistaction/dissatisfaction

96
At his/her work 3. Praktik Kepemimpinan berkontribusi positif terhadap efektivitas perusahaan secara keseluruhan. 1 2 3 4 5 Leadership system/practice contributes positively to Overall company’s effectiveness
KOMUNIKASI COMMUNICATION
Seberapa tepat pernyataan-pernyataan dibawah menggambarkan Praktik Komunikasi di perusahaan Anda? Untuk setiap pernyataan, berikan dua jawaban. How accurate the following statements to describe the communication system/practice in your company? Pertama, gunakan kolom kiri untuk menunjukkan sejauh mana pernyataan-pernyataan dibawah ini menggambarkan Praktik Komunikasi yang sekarang berlangsung (SEKARANG). First. Use the left column to show how accurate the following statements to desribe communication system/practice that currenty take place in your company (CURRENT PRACTICE) Kedua, gunakan kolom kanan untuk menunjukkan sejauh mana pernyataan-pernyataan dibawah ini menggambarkan Praktik Komunikasi yang seharusnya dilaksakanakan untuk meningkatkan efektivitas perusahaan (SEHARUSNYA). Second. Use the column on the right to show how accurate the following statements to describe the communication system/practice that should be done to increace the company’s efficiency. (DESIRED PRACTICE) Gunakan skala berikut ini: Use the following scale 1 2 3 4 5 Tidak sama sekali Sedikit Sedang Banyak Sangat banyak Not at all A little Somehow A lot Very much SEKARANG SEHARUSNYA
NOW SUPPOSEDLY 1. Komunikasi informal lebih efektif daripada komunikasi formal. 1 2 3 4 5 1 2 3 4 5 Informal communication is more effective than formal communication 2. Atasan langsung Anda menunjukkan penghargaan atas kerja Anda. 1 2 3 4 5 1 2 3 4 5 Your direct supervisor shows appreciation on your work 3. Atasan langsung Anda menunjukkan kepercayaan pada Anda. 1 2 3 4 5 1 2 3 4 5 Your direct supervisor shows that he/she trust you 4. Atasan langsung Anda sering menanyakan pendapat atau saran Anda. 1 2 3 4 5 1 2 3 4 5 Your direct supervisor oftenly ask for you opinion or suggestion 5. Atasan langsung Anda sering memberikan informasi/saran/evaluasi. 1 2 3 4 5 1 2 3 4 5 Your direct supervisor oftenly give information/suggestion/evaluation 6. Tujuan dikomunikasikan dengan jelas dan mudah dipahami. 1 2 3 4 5 1 2 3 4 5 Goals are communicated clearly and easy to be understood 7. Anda diizinkan membuat beberapa keputusan yang biasanya dibuat oleh orang-orang pada level yang lebih tinggi. 1 2 3 4 5 1 2 3 4 5 You are permitted/allowed to make some decision which usually made by People on the higher level

97
Gunakan skala yang sama untuk menunjukkan sejauh mana kontribusi Praktik Komunikasi di perusahaan Anda. Use the same scale to show how far the leadership system/practice contributes in your company
1. Praktik Komunikasi berkontribusi terhadap kinerja tinggi karyawan. 1 2 3 4 5 Communication system/practice contributes to Workers performance
2. Praktik Komunikasi berkontribusi terhadap rasa senang/puas karyawan akan pekerjaannya. 1 2 3 4 5
Communication system/practice contibutes to employees satistaction/dissatisfaction At his/her work 3. Praktik Komunikasi memberikan berkontribusi positif terhadap efektivitas perusahaan secara keseluruhan. 1 2 3 4 5 Communication system/practice contributes positively to Overall company’s effectiveness

98
APPENDIX B
http://www.undp.or.id/general/maps/Map_religions.jpg

99
VITA
Name: Mark Christopher Kelly Address: Department of Agricultural Leadership, Education, and Communications Texas A&M University, MS 2216 College Station, TX 77843-2116 Email Address: [email protected] Education: B.S., Marine Biology, University of North Carolina Wilmington,
2002 B.A., Psychology, University of North Carolina Wilmington, 2002
M.S., Wildlife and Fisheries, Texas A&M University, 2005 Ph.D., Agricultural Education, Texas A&M University, 2008