comparison of ghg emissions from unconventional … · comparison of ghg emissions from...
TRANSCRIPT
Comparison of GHG emissions from unconventional natural gas (“fracking”) in key studies
prepared for ExxonMobil Production Germany
by
Uwe R. Fritsche
Scientific Director, IINAS
Suzanne Hunt
IINAS Associate
Kevin Fingerman
Research Fellow, IINAS
Darmstadt, Washington DC, August 2014
IINAS ii GHG Shale Gas
Comparison of GHG emissions from unconventional natural gas (“fracking”) in key studies
Table of Content
List of Figures ............................................................. iv
List of Tables ............................................................... iv
1 Introduction .......................................................... 1
2 Data Disaggregation of US Studies ......................... 2
2.1 Emissions from Exploration and Well Completion ......... 2
2.2 Emissions from Production ............................................ 2
2.3 Emissions from Processing ............................................. 2
2.4 Emissions from Transmission, Storage, and Distribution 3
2.5 Summary of the Analysis of US Studies .......................... 3
3 Data Disaggregation of the UK Study ..................... 5
3.1 Emissions from Exploration and Well Completion ......... 5
3.2 Emissions from Production and Processing .................... 5
3.3 Emissions from Transmission, Storage, and Distribution 5
3.4 Summary of the Analysis of the UK Study ...................... 5
4 Data Disaggregation of EU Studies ......................... 8
4.1 Emissions from Exploration and Well Completion ......... 8
4.2 Emissions from Production and Processing .................... 8
4.3 Emissions from Transmission, Storage, and Distribution 8
4.4 Summary of the Analysis of EU Studies .......................... 8
5 Comparison of Data ............................................. 11
5.1 Comparison and Discussion of Life-Cycle GHG Emissions from Shale Gas Provision .............................................. 11
5.2 Comparison and Discussion of GHG Emissions from Electricity Generation based on Shale Gas ................... 14

IINAS iii GHG Shale Gas
Comparison of GHG emissions from unconventional natural gas (“fracking”) in key studies
6 Discussion and Conclusions ................................. 19
6.1 Discussion of the Studies and Results from other Work ............................................................................ 19
6.2 Conclusions .................................................................. 20
References................................................................ 21
IINAS iv GHG Shale Gas
Comparison of GHG emissions from unconventional natural gas (“fracking”) in key studies
List of Figures Figure 1 Breakdown of Life-Cycle GHG Emissions from Shale Gas
Provision given in the US Studies .................................... 4 Figure 2 Breakdown of Life-Cycle GHG Emissions from Shale Gas
Provision in the UK Study ............................................... 7 Figure 3 Breakdown of Life-Cycle GHG Emissions from Shale Gas
Provision given in the EU Studies .................................. 10 Figure 4 Comparison of Life-Cycle GHG Emissions from Shale Gas
Provision given in the Studies ....................................... 12 Figure 5 Breakdown of Life-Cycle GHG Emissions from Shale Gas
Provision given in the Studies ....................................... 13 Figure 6 Comparison of Life-Cycle GHG Emissions from Shale Gas
Provision given in the Studies plus German Data .......... 14 Figure 7 Comparison of Life-Cycle GHG Emissions for Electricity
from Shale Gas ............................................................. 16 Figure 8 Breakdown of Life-Cycle GHG Emissions for Electricity
from Shale Gas ............................................................. 18
List of Tables Table 1 Breakdown of Life-Cycle GHG Emissions from US Shale
Gas Provision given in the US Studies ............................. 3 Table 2 Breakdown of Life-Cycle GHG Emissions from Shale Gas
Provision according to the UK Study ............................... 6 Table 3 Breakdown of Life-Cycle GHG Emissions from Shale Gas
Provision given in the EU studies .................................... 9 Table 4 Life-Cycle GHG Emissions from Shale Gas Provision given
in the Studies ................................................................ 11 Table 5 Life-Cycle GHG Emissions for Electricity from Shale Gas 15 Table 6 Breakdown of Life-Cycle GHG Emissions for Electricity
from Shale Gas ............................................................. 17
IINAS 1 GHG Shale Gas
Comparison of GHG emissions from unconventional natural gas (“fracking”) in key studies
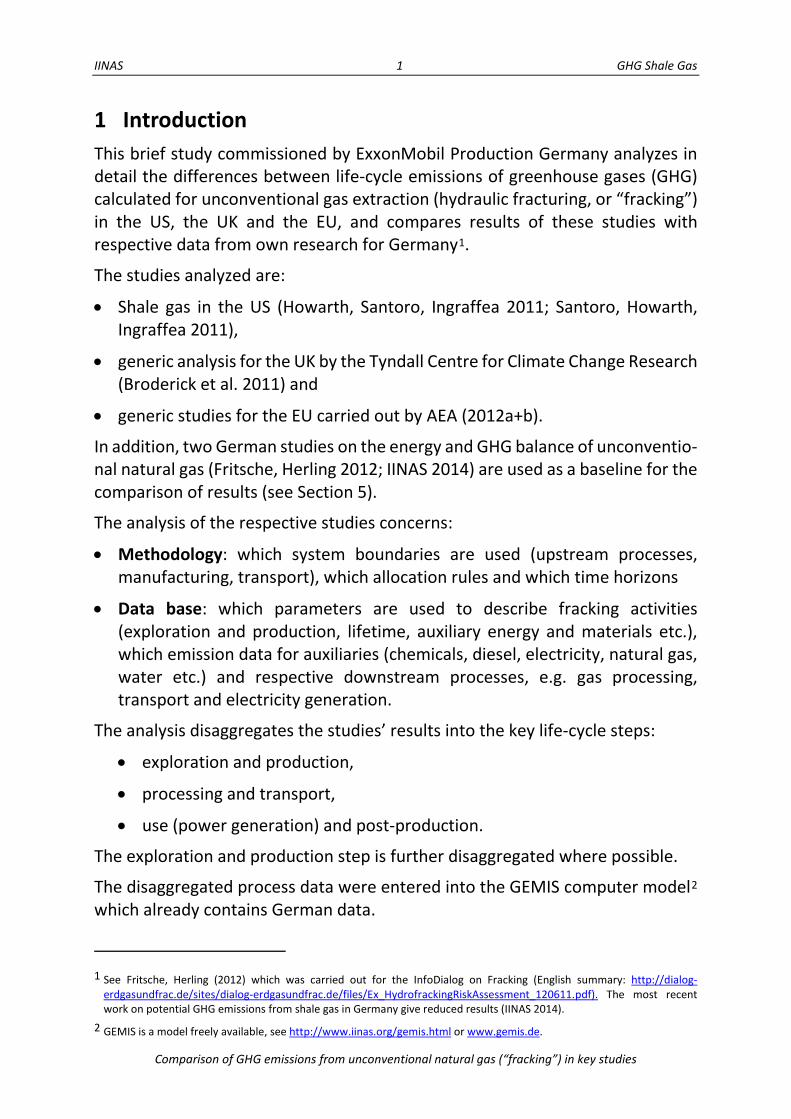
1 Introduction This brief study commissioned by ExxonMobil Production Germany analyzes in detail the differences between life-cycle emissions of greenhouse gases (GHG) calculated for unconventional gas extraction (hydraulic fracturing, or “fracking”) in the US, the UK and the EU, and compares results of these studies with respective data from own research for Germany1.
The studies analyzed are:
• Shale gas in the US (Howarth, Santoro, Ingraffea 2011; Santoro, Howarth, Ingraffea 2011),
• generic analysis for the UK by the Tyndall Centre for Climate Change Research (Broderick et al. 2011) and
• generic studies for the EU carried out by AEA (2012a+b).
In addition, two German studies on the energy and GHG balance of unconventio-nal natural gas (Fritsche, Herling 2012; IINAS 2014) are used as a baseline for the comparison of results (see Section 5).
The analysis of the respective studies concerns:
• Methodology: which system boundaries are used (upstream processes, manufacturing, transport), which allocation rules and which time horizons
• Data base: which parameters are used to describe fracking activities (exploration and production, lifetime, auxiliary energy and materials etc.), which emission data for auxiliaries (chemicals, diesel, electricity, natural gas, water etc.) and respective downstream processes, e.g. gas processing, transport and electricity generation.
The analysis disaggregates the studies’ results into the key life-cycle steps:
• exploration and production,
• processing and transport,
• use (power generation) and post-production.
The exploration and production step is further disaggregated where possible.
The disaggregated process data were entered into the GEMIS computer model2 which already contains German data.
1 See Fritsche, Herling (2012) which was carried out for the InfoDialog on Fracking (English summary: http://dialog-
erdgasundfrac.de/sites/dialog-erdgasundfrac.de/files/Ex_HydrofrackingRiskAssessment_120611.pdf). The most recent work on potential GHG emissions from shale gas in Germany give reduced results (IINAS 2014).
2 GEMIS is a model freely available, see http://www.iinas.org/gemis.html or www.gemis.de.
IINAS 2 GHG Shale Gas
Comparison of GHG emissions from unconventional natural gas (“fracking”) in key studies
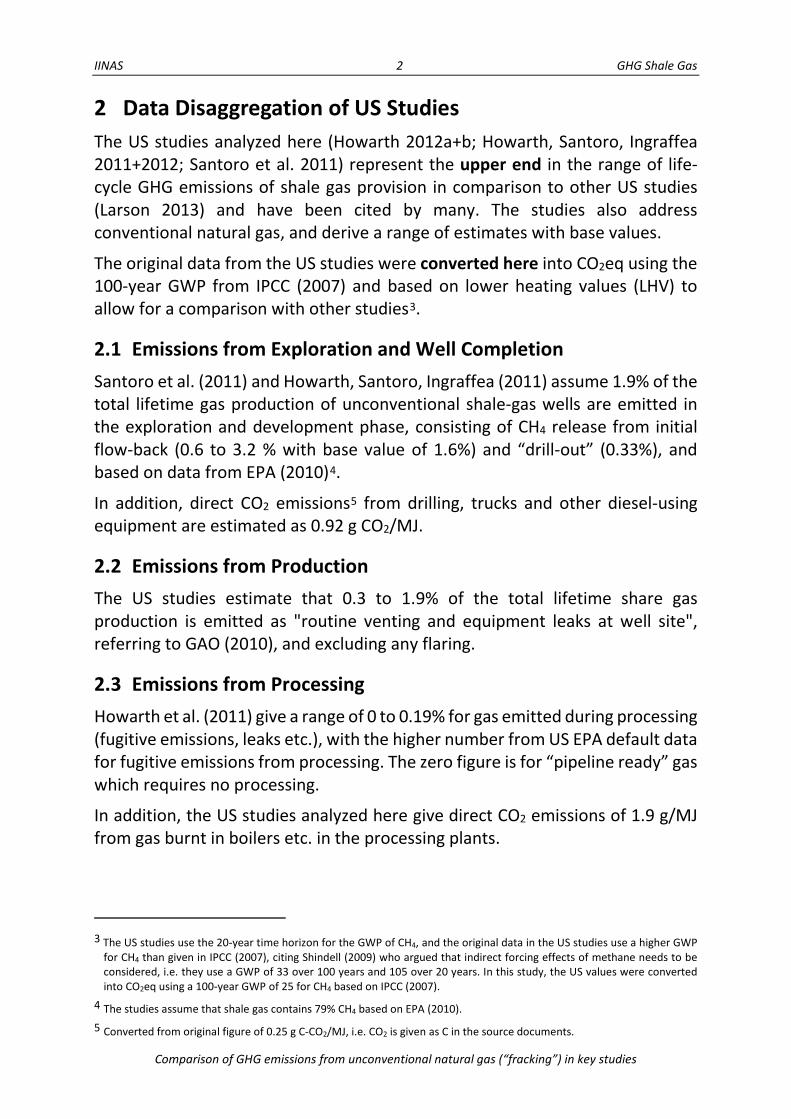
2 Data Disaggregation of US Studies The US studies analyzed here (Howarth 2012a+b; Howarth, Santoro, Ingraffea 2011+2012; Santoro et al. 2011) represent the upper end in the range of life-cycle GHG emissions of shale gas provision in comparison to other US studies (Larson 2013) and have been cited by many. The studies also address conventional natural gas, and derive a range of estimates with base values.
The original data from the US studies were converted here into CO2eq using the 100-year GWP from IPCC (2007) and based on lower heating values (LHV) to allow for a comparison with other studies3.
2.1 Emissions from Exploration and Well Completion Santoro et al. (2011) and Howarth, Santoro, Ingraffea (2011) assume 1.9% of the total lifetime gas production of unconventional shale-gas wells are emitted in the exploration and development phase, consisting of CH4 release from initial flow-back (0.6 to 3.2 % with base value of 1.6%) and “drill-out” (0.33%), and based on data from EPA (2010)4.
In addition, direct CO2 emissions5 from drilling, trucks and other diesel-using equipment are estimated as 0.92 g CO2/MJ.
2.2 Emissions from Production The US studies estimate that 0.3 to 1.9% of the total lifetime share gas production is emitted as "routine venting and equipment leaks at well site", referring to GAO (2010), and excluding any flaring.
2.3 Emissions from Processing Howarth et al. (2011) give a range of 0 to 0.19% for gas emitted during processing (fugitive emissions, leaks etc.), with the higher number from US EPA default data for fugitive emissions from processing. The zero figure is for “pipeline ready” gas which requires no processing.
In addition, the US studies analyzed here give direct CO2 emissions of 1.9 g/MJ from gas burnt in boilers etc. in the processing plants.
3 The US studies use the 20-year time horizon for the GWP of CH4, and the original data in the US studies use a higher GWP
for CH4 than given in IPCC (2007), citing Shindell (2009) who argued that indirect forcing effects of methane needs to be considered, i.e. they use a GWP of 33 over 100 years and 105 over 20 years. In this study, the US values were converted into CO2eq using a 100-year GWP of 25 for CH4 based on IPCC (2007).
4 The studies assume that shale gas contains 79% CH4 based on EPA (2010). 5 Converted from original figure of 0.25 g C-CO2/MJ, i.e. CO2 is given as C in the source documents.
IINAS 3 GHG Shale Gas
Comparison of GHG emissions from unconventional natural gas (“fracking”) in key studies
2.4 Emissions from Transmission, Storage, and Distribution Howarth et al. (2011) give aggregated data for gas leakage during transmission, storage and distribution, with 1.4% as lower and 3.6% as the upper limit.
In addition, the US studies analyzed here give direct CO2 emissions of 0.6 g/MJ from gas burnt in compressors etc. during transmission, storage and distribution of shale gas.
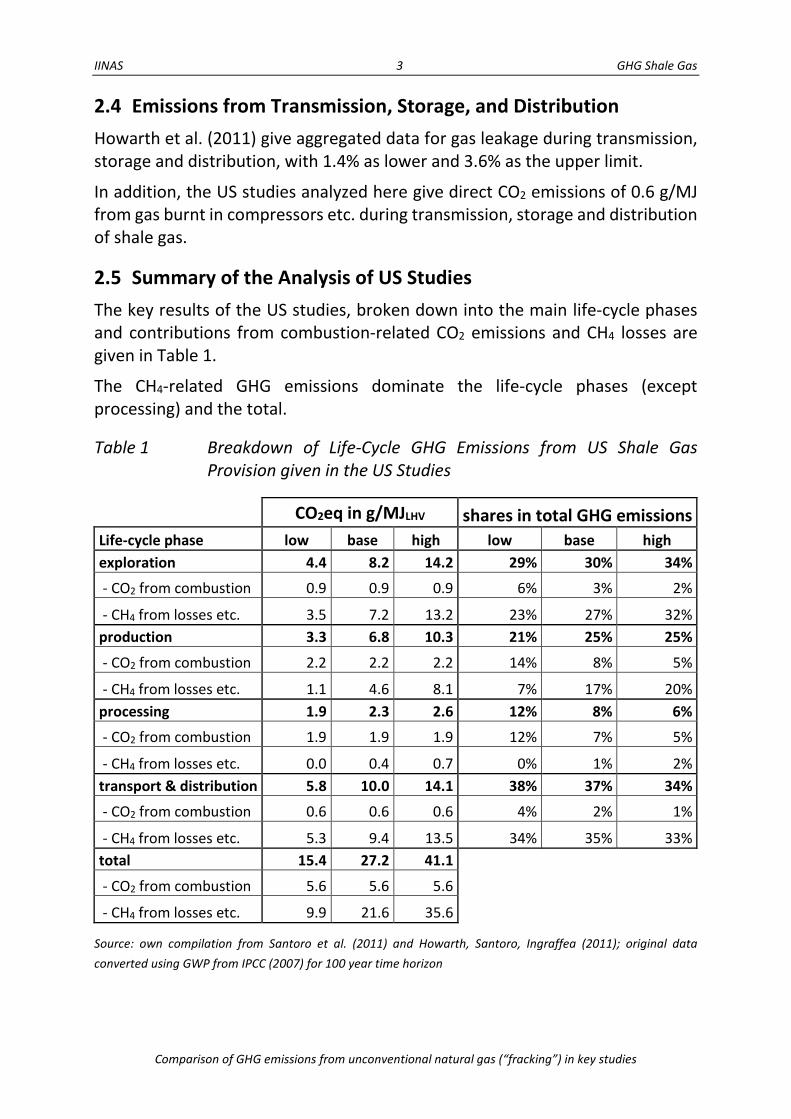
2.5 Summary of the Analysis of US Studies The key results of the US studies, broken down into the main life-cycle phases and contributions from combustion-related CO2 emissions and CH4 losses are given in Table 1.
The CH4-related GHG emissions dominate the life-cycle phases (except processing) and the total.
Table 1 Breakdown of Life-Cycle GHG Emissions from US Shale Gas Provision given in the US Studies
CO2eq in g/MJLHV shares in total GHG emissions Life-cycle phase low base high low base high exploration 4.4 8.2 14.2 29% 30% 34%
- CO2 from combustion 0.9 0.9 0.9 6% 3% 2%
- CH4 from losses etc. 3.5 7.2 13.2 23% 27% 32% production 3.3 6.8 10.3 21% 25% 25%
- CO2 from combustion 2.2 2.2 2.2 14% 8% 5%
- CH4 from losses etc. 1.1 4.6 8.1 7% 17% 20% processing 1.9 2.3 2.6 12% 8% 6%
- CO2 from combustion 1.9 1.9 1.9 12% 7% 5%
- CH4 from losses etc. 0.0 0.4 0.7 0% 1% 2% transport & distribution 5.8 10.0 14.1 38% 37% 34%
- CO2 from combustion 0.6 0.6 0.6 4% 2% 1%
- CH4 from losses etc. 5.3 9.4 13.5 34% 35% 33% total 15.4 27.2 41.1
- CO2 from combustion 5.6 5.6 5.6
- CH4 from losses etc. 9.9 21.6 35.6
Source: own compilation from Santoro et al. (2011) and Howarth, Santoro, Ingraffea (2011); original data converted using GWP from IPCC (2007) for 100 year time horizon
IINAS 4 GHG Shale Gas
Comparison of GHG emissions from unconventional natural gas (“fracking”) in key studies
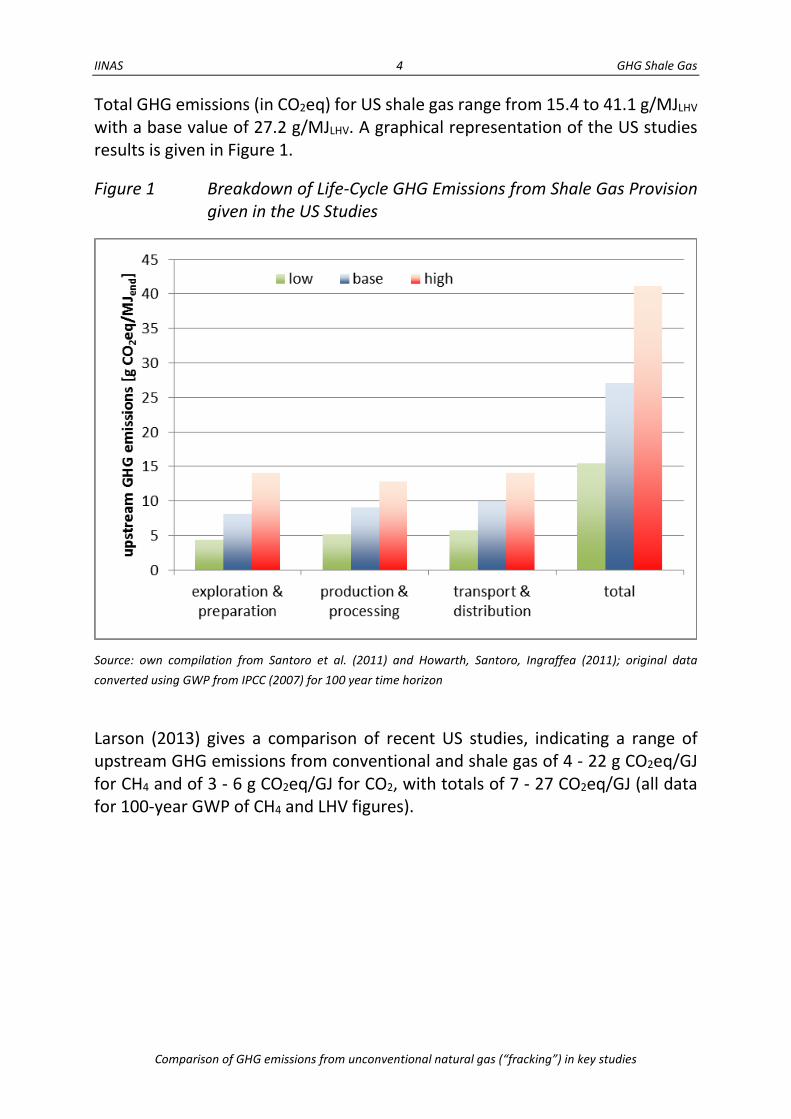
Total GHG emissions (in CO2eq) for US shale gas range from 15.4 to 41.1 g/MJLHV with a base value of 27.2 g/MJLHV. A graphical representation of the US studies results is given in Figure 1.
Figure 1 Breakdown of Life-Cycle GHG Emissions from Shale Gas Provision given in the US Studies
Source: own compilation from Santoro et al. (2011) and Howarth, Santoro, Ingraffea (2011); original data converted using GWP from IPCC (2007) for 100 year time horizon
Larson (2013) gives a comparison of recent US studies, indicating a range of upstream GHG emissions from conventional and shale gas of 4 - 22 g CO2eq/GJ for CH4 and of 3 - 6 g CO2eq/GJ for CO2, with totals of 7 - 27 CO2eq/GJ (all data for 100-year GWP of CH4 and LHV figures).
IINAS 5 GHG Shale Gas
Comparison of GHG emissions from unconventional natural gas (“fracking”) in key studies
3 Data Disaggregation of the UK Study The UK study carried out by the Tyndall Centre for Climate Change Research (Broderick et al. 2011) analyses energy use and emission data from other (mainly US) studies, and additional information from UK sources. It specifies the additional emissions from shale gas compared to conventional natural gas.
3.1 Emissions from Exploration and Well Completion Broderick et al. (2011) assume that exploration and vertical drilling for shale gas is similar to natural gas, but additional horizontal drilling and hydraulic fracturing is needed.
The respective CO2 emissions of 15-17 t/well are calculated for horizontal drilling of 300-1500 m, and additional 295 t of CO2 for fracturing (based on US Marcellus Shale data). Data for chemicals are not included.
Transportation of water to and wastewater from the well plus wastewater treatment are calculated to release additional 38 - 68 t of CO2.
The total CO2 emissions per well are determined as 348 - 438 t per well.
Regarding fugitive emissions and leakage of CH4, the study uses the upper (3.2%) and lower (0.6%) percentage of lifetime production of methane that is potentially emitted during flow back, referring to Howarth et al. (2011). This translates into a range of CO2eq emissions of 2.9 - 15.3 g/MJ.
3.2 Emissions from Production and Processing The UK study does not give own estimates for the production and processing. To allow for a comparison, data from a German study (Fritsche, Herling 2012) was added in Table 2.
3.3 Emissions from Transmission, Storage, and Distribution The UK study does not give own estimates for transmission, storage and distribution effects but refers to the Howarth et al. (2011) range of 1.4% - 3.6% of methane produced over the lifecycle being emitted as CH4.
3.4 Summary of the Analysis of the UK Study The key results of the UK study, broken down into the main life-cycle phases and contributions from combustion-related CO2 emissions and CH4 losses are given in Table 2.
Note that in this table, only the exploration and production stage are data from Broderick et al. (2011), while the production and processing data were added here from the German study (based on Fritsche, Herling 2012) and the transport
IINAS 6 GHG Shale Gas
Comparison of GHG emissions from unconventional natural gas (“fracking”) in key studies
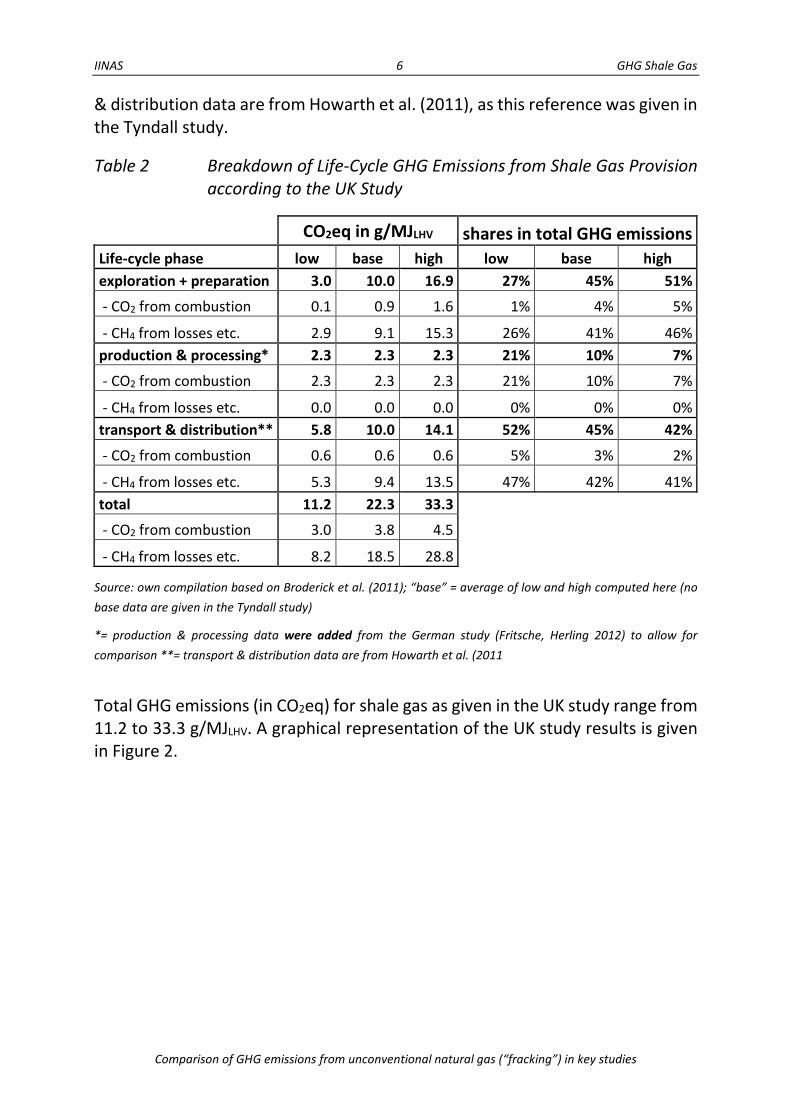
& distribution data are from Howarth et al. (2011), as this reference was given in the Tyndall study.
Table 2 Breakdown of Life-Cycle GHG Emissions from Shale Gas Provision according to the UK Study
CO2eq in g/MJLHV shares in total GHG emissions Life-cycle phase low base high low base high exploration + preparation 3.0 10.0 16.9 27% 45% 51%
- CO2 from combustion 0.1 0.9 1.6 1% 4% 5%
- CH4 from losses etc. 2.9 9.1 15.3 26% 41% 46% production & processing* 2.3 2.3 2.3 21% 10% 7%
- CO2 from combustion 2.3 2.3 2.3 21% 10% 7%
- CH4 from losses etc. 0.0 0.0 0.0 0% 0% 0% transport & distribution** 5.8 10.0 14.1 52% 45% 42%
- CO2 from combustion 0.6 0.6 0.6 5% 3% 2%
- CH4 from losses etc. 5.3 9.4 13.5 47% 42% 41% total 11.2 22.3 33.3
- CO2 from combustion 3.0 3.8 4.5
- CH4 from losses etc. 8.2 18.5 28.8
Source: own compilation based on Broderick et al. (2011); “base” = average of low and high computed here (no base data are given in the Tyndall study)
*= production & processing data were added from the German study (Fritsche, Herling 2012) to allow for comparison **= transport & distribution data are from Howarth et al. (2011
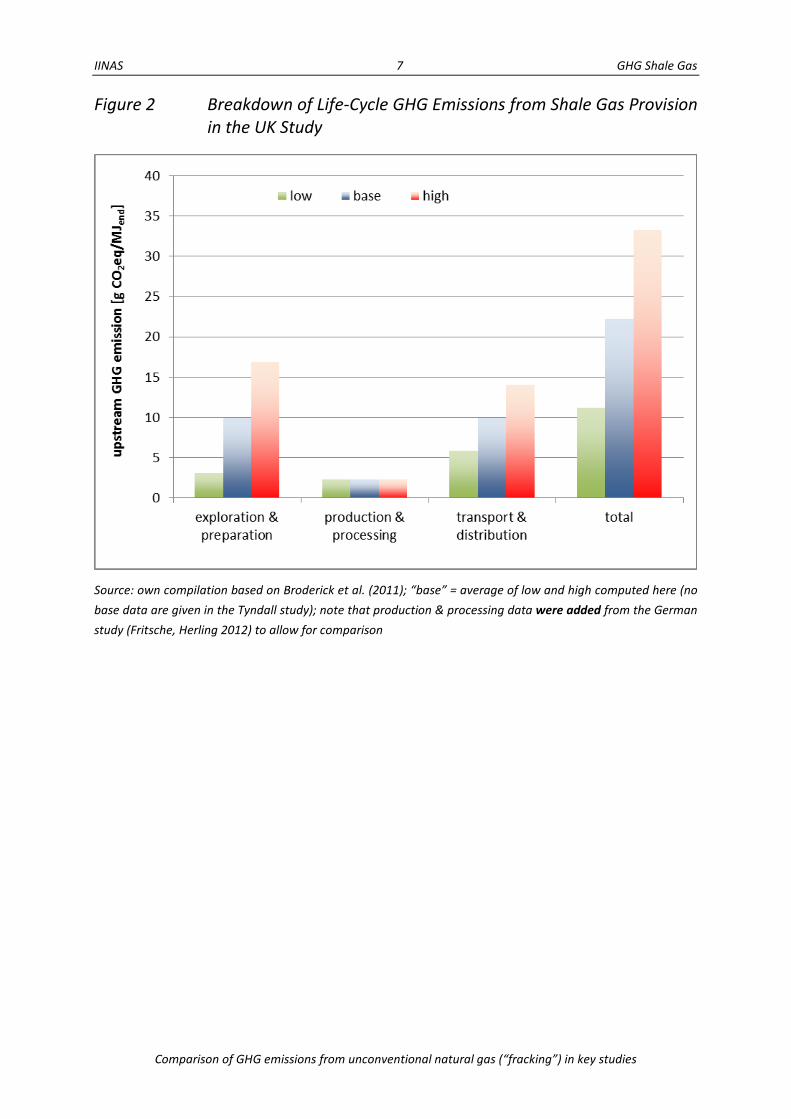
Total GHG emissions (in CO2eq) for shale gas as given in the UK study range from 11.2 to 33.3 g/MJLHV. A graphical representation of the UK study results is given in Figure 2.
IINAS 7 GHG Shale Gas
Comparison of GHG emissions from unconventional natural gas (“fracking”) in key studies
Figure 2 Breakdown of Life-Cycle GHG Emissions from Shale Gas Provision in the UK Study
Source: own compilation based on Broderick et al. (2011); “base” = average of low and high computed here (no base data are given in the Tyndall study); note that production & processing data were added from the German study (Fritsche, Herling 2012) to allow for comparison
IINAS 8 GHG Shale Gas
Comparison of GHG emissions from unconventional natural gas (“fracking”) in key studies
4 Data Disaggregation of EU Studies The EU studies carried out by AEA (2012a+b) consist of a compilation of emission data from other - mainly US - studies, and develop a series of scenarios to reflect key parameters influencing the GHG emissions from shale gas.
4.1 Emissions from Exploration and Well Completion The EU studies consider site preparation in terms of land clearing, construction and auxiliary materials, vertical and horizontal drilling, water use and waste-water treatment. For drilling, they use the US data discussed in Section 2.1 of this study.
The total lifetime gas production of an unconventional shale-gas well is assumed to be 56.6 Mm3 in the base case, with sensitivity cases of 28.3 Mm3 (low) and 84.9 Mm3 (high), respectively. The EU studies assume an emission volume of 312,008 m3 of gas per well for the base case, and that 15% of these emissions are flared (98% combustion efficiency) while the remaining 85% are vented. The sensitivity cases assume a 90% flaring rate (low) and complete venting (high), with a higher emission volume of 396200 m3 of gas.
4.2 Emissions from Production and Processing The EU studies give estimates for conventional natural gas production and processing in several countries (NL, NO, RU, UK) without providing specific data for shale gas. To allow for a comparison, data from the German study (Fritsche, Herling 2012) were added in Table 3.
4.3 Emissions from Transmission, Storage, and Distribution Similar to the production and processing stage, the EU studies give estimates for conventional natural gas pipeline transmission in several countries (NL, NO, RU, UK), and provide an assumption for shale gas: in the low and base case, pipeline emissions result from combustion emissions of 0.9% and diffuse emissions of 0.013 % of gas throughput (for 500 km transport distance). For the high case, a transport distance of 1000 km is assumed. The EU studies do not consider gas leakage during storage and distribution.
4.4 Summary of the Analysis of EU Studies The key results of the EU studies, broken down into the main life-cycle phases and contributions from combustion-related CO2 emissions and CH4 losses are given in Table 3.
IINAS 9 GHG Shale Gas
Comparison of GHG emissions from unconventional natural gas (“fracking”) in key studies
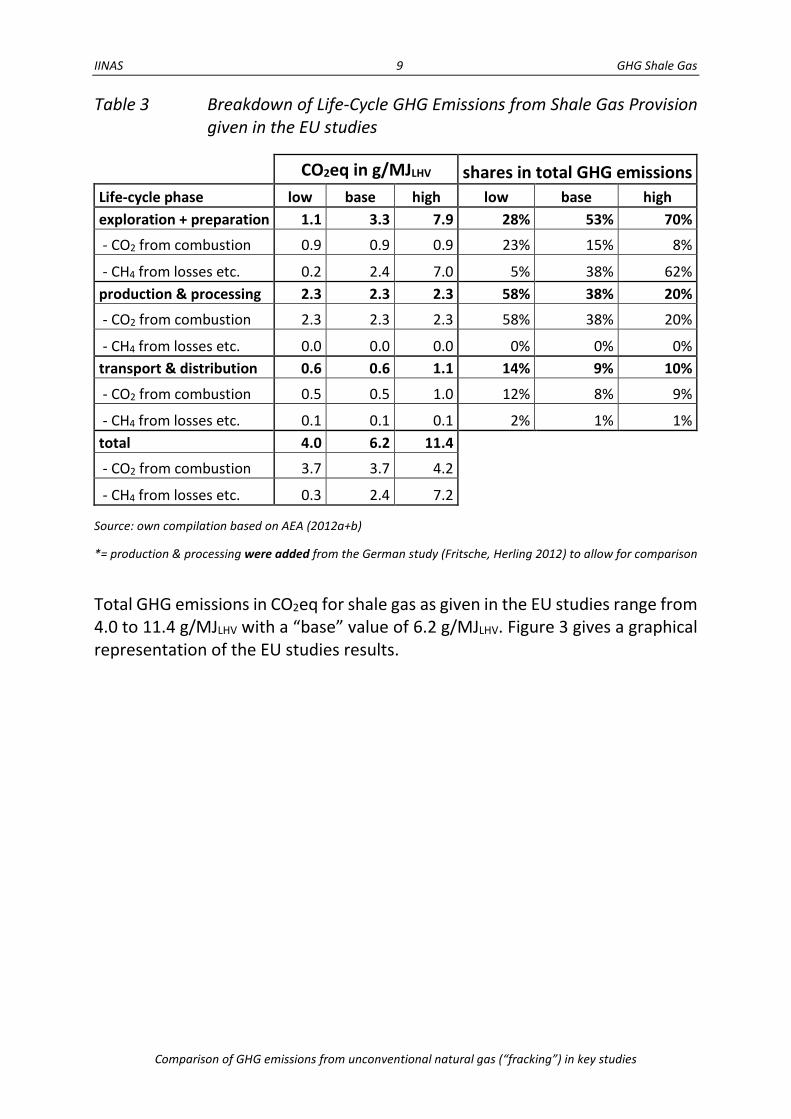
Table 3 Breakdown of Life-Cycle GHG Emissions from Shale Gas Provision given in the EU studies
CO2eq in g/MJLHV shares in total GHG emissions Life-cycle phase low base high low base high exploration + preparation 1.1 3.3 7.9 28% 53% 70%
- CO2 from combustion 0.9 0.9 0.9 23% 15% 8%
- CH4 from losses etc. 0.2 2.4 7.0 5% 38% 62% production & processing 2.3 2.3 2.3 58% 38% 20%
- CO2 from combustion 2.3 2.3 2.3 58% 38% 20%
- CH4 from losses etc. 0.0 0.0 0.0 0% 0% 0% transport & distribution 0.6 0.6 1.1 14% 9% 10%
- CO2 from combustion 0.5 0.5 1.0 12% 8% 9%
- CH4 from losses etc. 0.1 0.1 0.1 2% 1% 1% total 4.0 6.2 11.4
- CO2 from combustion 3.7 3.7 4.2
- CH4 from losses etc. 0.3 2.4 7.2
Source: own compilation based on AEA (2012a+b)
*= production & processing were added from the German study (Fritsche, Herling 2012) to allow for comparison
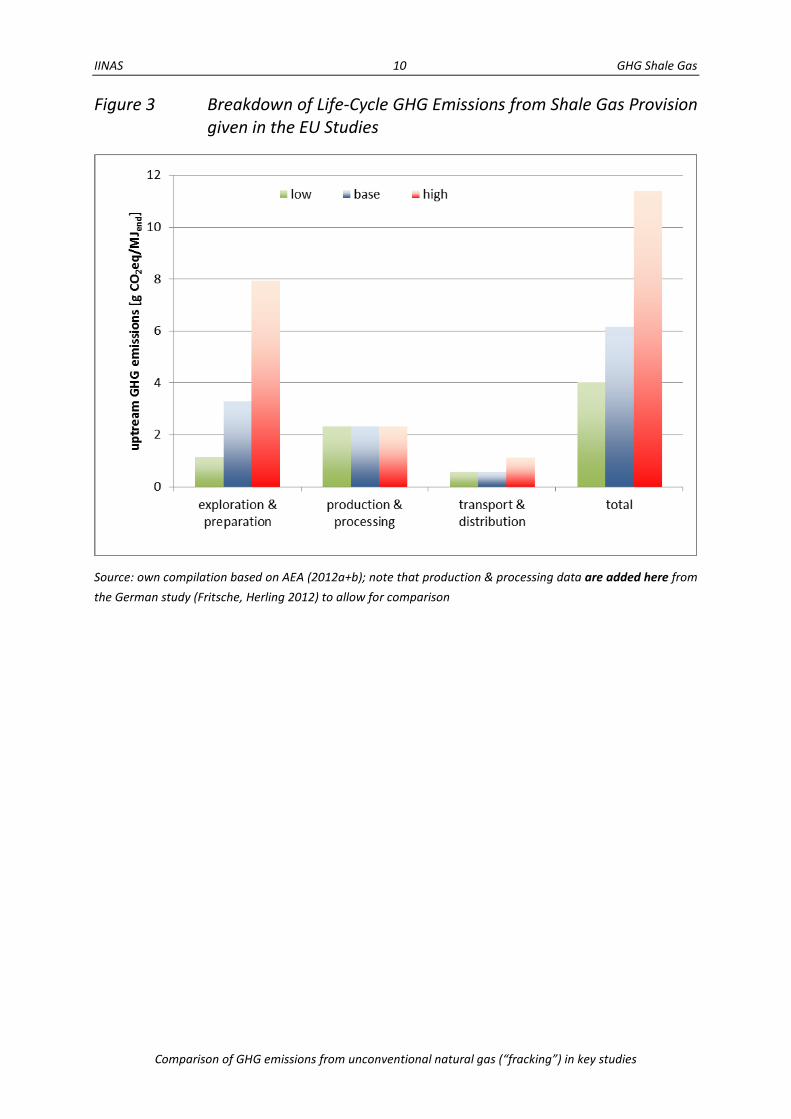
Total GHG emissions in CO2eq for shale gas as given in the EU studies range from 4.0 to 11.4 g/MJLHV with a “base” value of 6.2 g/MJLHV. Figure 3 gives a graphical representation of the EU studies results.
IINAS 10 GHG Shale Gas
Comparison of GHG emissions from unconventional natural gas (“fracking”) in key studies
Figure 3 Breakdown of Life-Cycle GHG Emissions from Shale Gas Provision given in the EU Studies
Source: own compilation based on AEA (2012a+b); note that production & processing data are added here from the German study (Fritsche, Herling 2012) to allow for comparison
IINAS 11 GHG Shale Gas
Comparison of GHG emissions from unconventional natural gas (“fracking”) in key studies
5 Comparison of Data
5.1 Comparison and Discussion of Life-Cycle GHG Emissions from Shale Gas Provision
Table 4 summarizes the analysis of the life-cycle GHG emissions of shale gas in the US, UK and EU studies.
Table 4 Life-Cycle GHG Emissions from Shale Gas Provision given in the Studies
CO2eq in g/MJLHV low base high
Life-cycle phase US UK EU US UK EU US UK EU exploration & preparation 4.4 3.0 1.1 8.2 10.0 3.3 14.2 16.9 7.9
- CO2 from combustion 0.9 0.1 0.9 0.9 0.9 0.9 0.9 1.6 0.9
- CH4 from losses etc. 3.5 2.9 0.2 7.2 9.1 2.4 13.2 15.3 7.0 production & processing 5.2 2.3 2.3 9.0 2.3 2.3 12.9 2.3 2.3
- CO2 from combustion 4.1 2.3 2.3 4.1 2.3 2.3 4.1 2.3 2.3
- CH4 from losses etc. 1.1 0.0 0.0 5.0 0.0 0.0 8.8 0.0 0.0 transport & distribution 5.8 5.8 0.6 10.0 10.0 0.6 14.1 14.1 1.1
- CO2 from combustion 0.6 0.6 0.5 0.6 0.6 0.5 0.6 0.6 1.0
- CH4 from losses etc. 5.3 5.3 0.1 9.4 9.4 0.1 13.5 13.5 0.1 total 10.2 8.9 1.7 18.1 19.9 3.8 28.2 31.0 9.1
- CO2 from combustion 1.5 0.7 1.4 1.5 1.5 1.4 1.5 2.2 1.9
- CH4 from losses etc. 8.7 8.2 0.3 16.6 18.5 2.4 26.7 28.8 7.2
Source: own compilation; note that for UK and EU, production & processing data were added from the German study (Fritsche, Herling 2012) to allow for comparison
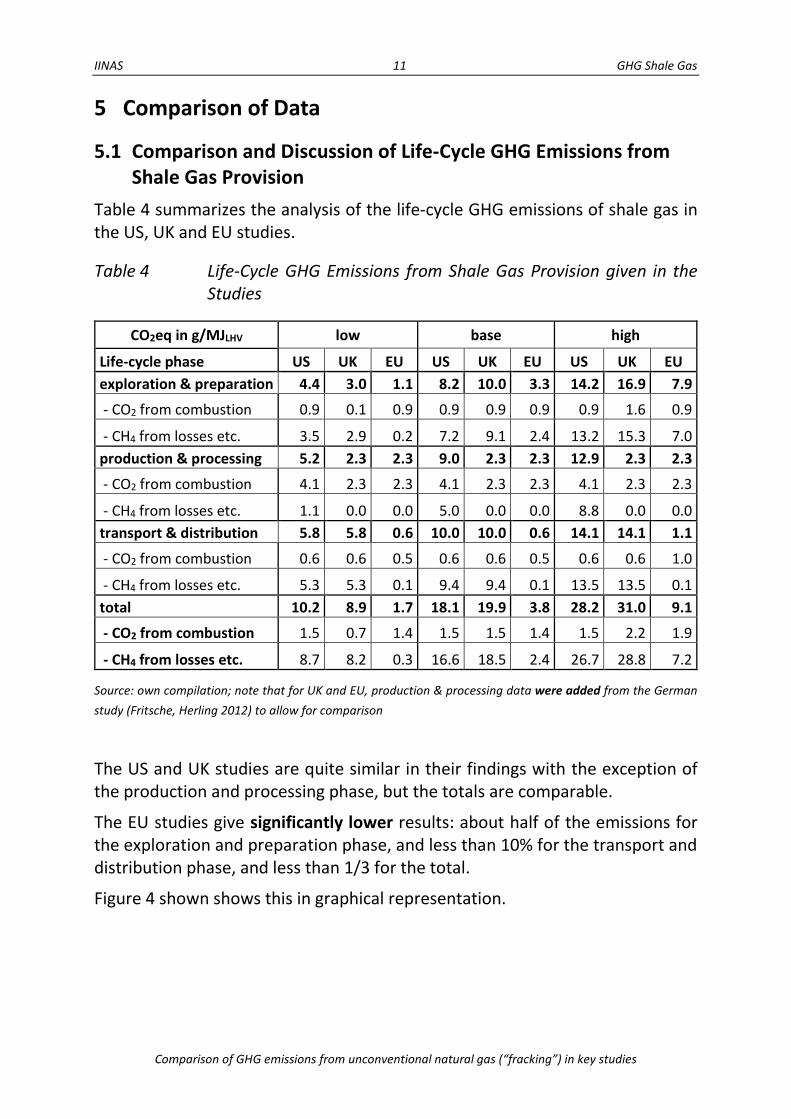
The US and UK studies are quite similar in their findings with the exception of the production and processing phase, but the totals are comparable.
The EU studies give significantly lower results: about half of the emissions for the exploration and preparation phase, and less than 10% for the transport and distribution phase, and less than 1/3 for the total.
Figure 4 shown shows this in graphical representation.
IINAS 12 GHG Shale Gas
Comparison of GHG emissions from unconventional natural gas (“fracking”) in key studies
Figure 4 Comparison of Life-Cycle GHG Emissions from Shale Gas Provision given in the Studies
Source: own compilation; note that for UK and EU, production & processing data were added from the German study (Fritsche, Herling 2012) to allow for comparison
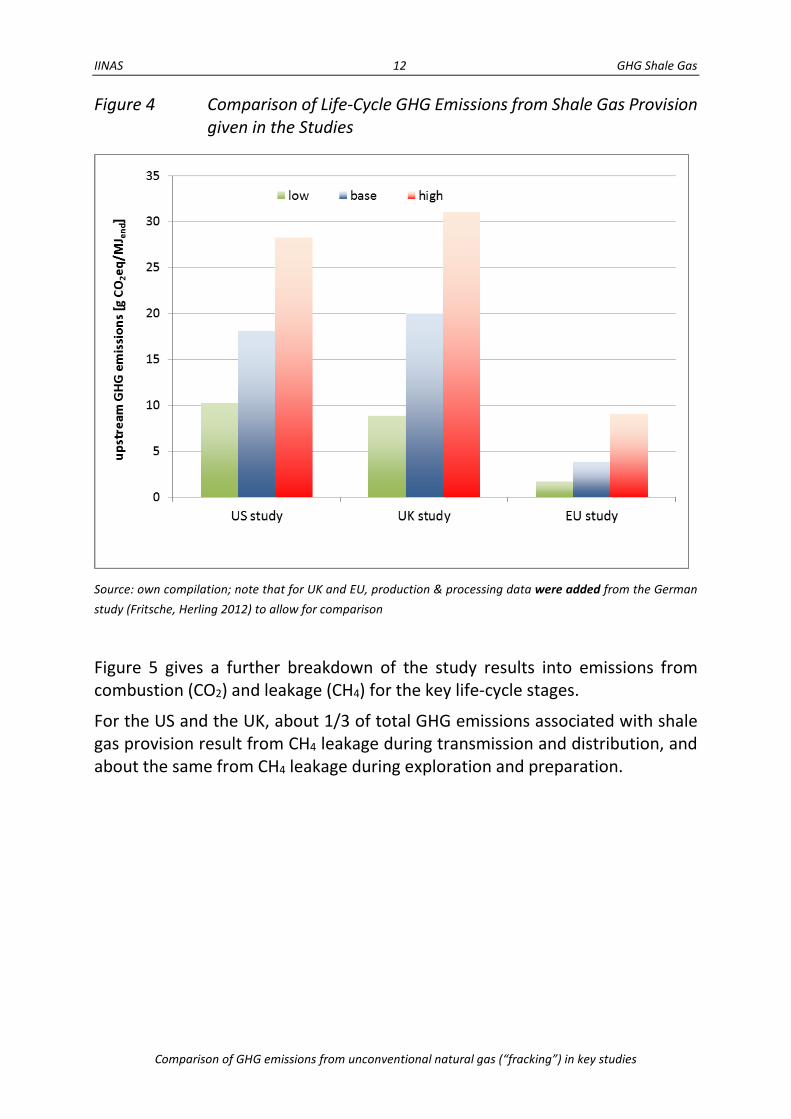
Figure 5 gives a further breakdown of the study results into emissions from combustion (CO2) and leakage (CH4) for the key life-cycle stages.
For the US and the UK, about 1/3 of total GHG emissions associated with shale gas provision result from CH4 leakage during transmission and distribution, and about the same from CH4 leakage during exploration and preparation.
IINAS 13 GHG Shale Gas
Comparison of GHG emissions from unconventional natural gas (“fracking”) in key studies
Figure 5 Breakdown of Life-Cycle GHG Emissions from Shale Gas Provision given in the Studies
Source: own compilation; note that for UK and EU, production & processing data were added from the German study (Fritsche, Herling 2012) to allow for comparison
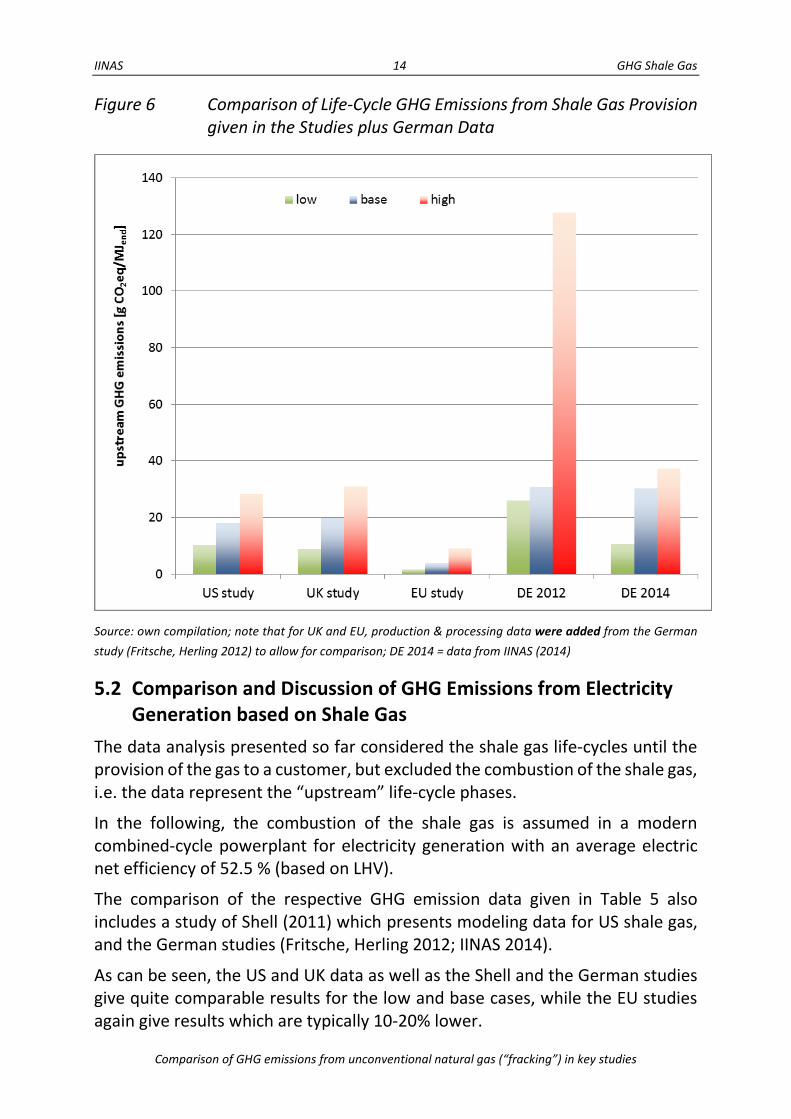
The results can be compared also to the ones for Germany (Fritsche, Herling 2012; IINAS 2014), as shown in Figure 6.
The “low” and “base” cases for Germany are comparable to the US and UK figures, while the “high” case is about four times higher than in these studies.
The reason for this is that the German “high” cases assumes a combination of “worst case” data, i.e. comparatively small reservoir, deep drilling (> 3,000 m) and consider post-production CH4 releases6.
6 see for details Fritsche, Herling (2012), and the most recent work on potential GHG emissions from shale gas in Germany
which gives reduced results (IINAS 2014).
IINAS 14 GHG Shale Gas
Comparison of GHG emissions from unconventional natural gas (“fracking”) in key studies
Figure 6 Comparison of Life-Cycle GHG Emissions from Shale Gas Provision given in the Studies plus German Data
Source: own compilation; note that for UK and EU, production & processing data were added from the German study (Fritsche, Herling 2012) to allow for comparison; DE 2014 = data from IINAS (2014)
5.2 Comparison and Discussion of GHG Emissions from Electricity Generation based on Shale Gas
The data analysis presented so far considered the shale gas life-cycles until the provision of the gas to a customer, but excluded the combustion of the shale gas, i.e. the data represent the “upstream” life-cycle phases.
In the following, the combustion of the shale gas is assumed in a modern combined-cycle powerplant for electricity generation with an average electric net efficiency of 52.5 % (based on LHV).
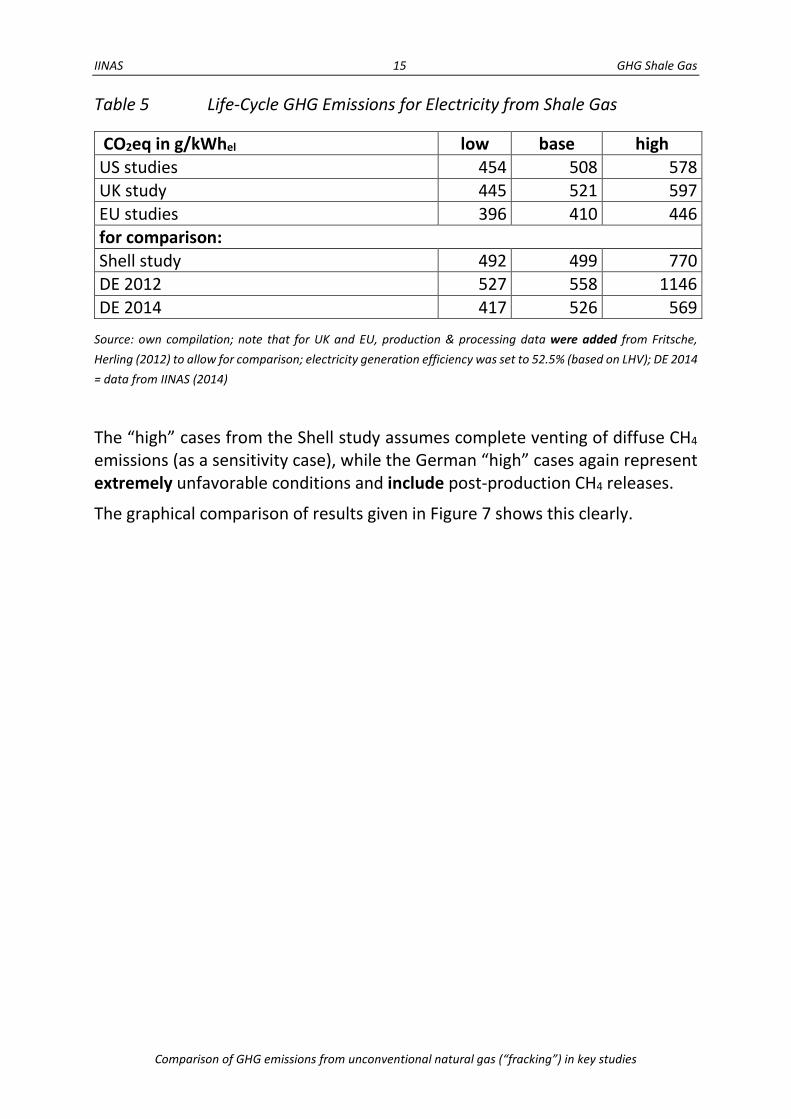
The comparison of the respective GHG emission data given in Table 5 also includes a study of Shell (2011) which presents modeling data for US shale gas, and the German studies (Fritsche, Herling 2012; IINAS 2014).
As can be seen, the US and UK data as well as the Shell and the German studies give quite comparable results for the low and base cases, while the EU studies again give results which are typically 10-20% lower.
IINAS 15 GHG Shale Gas
Comparison of GHG emissions from unconventional natural gas (“fracking”) in key studies
Table 5 Life-Cycle GHG Emissions for Electricity from Shale Gas
CO2eq in g/kWhel low base high US studies 454 508 578 UK study 445 521 597 EU studies 396 410 446 for comparison: Shell study 492 499 770 DE 2012 527 558 1146 DE 2014 417 526 569
Source: own compilation; note that for UK and EU, production & processing data were added from Fritsche, Herling (2012) to allow for comparison; electricity generation efficiency was set to 52.5% (based on LHV); DE 2014 = data from IINAS (2014)
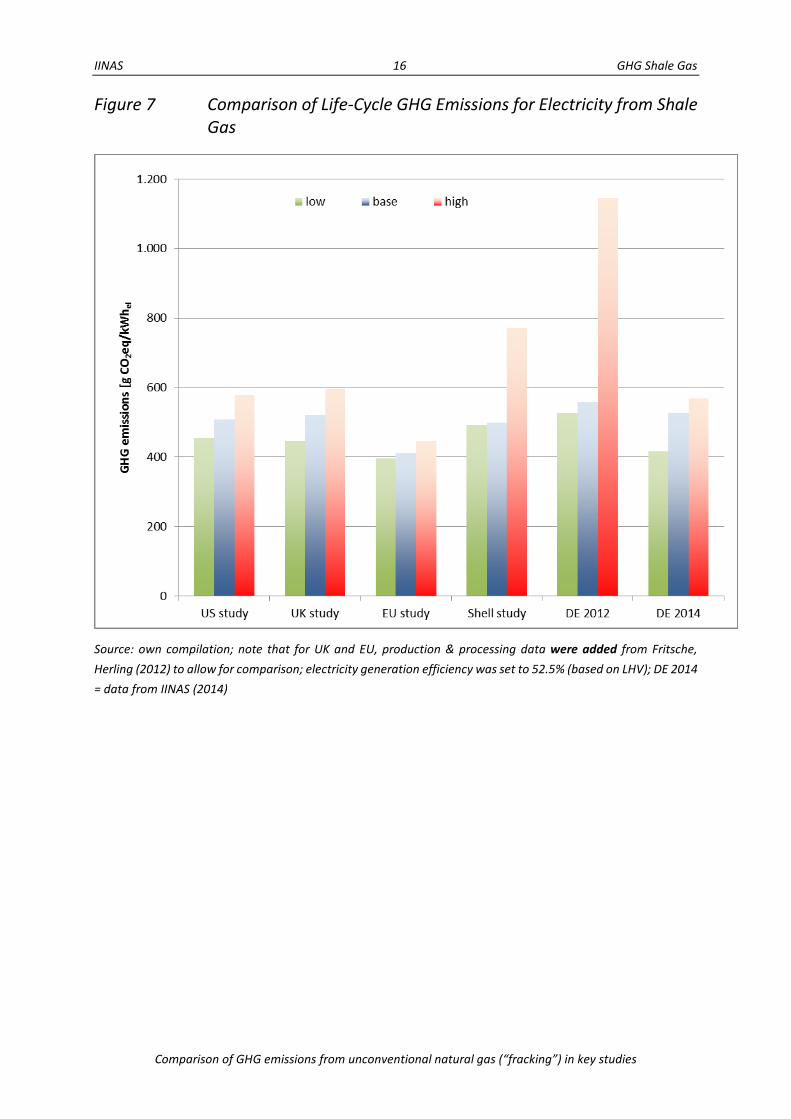
The “high” cases from the Shell study assumes complete venting of diffuse CH4 emissions (as a sensitivity case), while the German “high” cases again represent extremely unfavorable conditions and include post-production CH4 releases.
The graphical comparison of results given in Figure 7 shows this clearly.
IINAS 16 GHG Shale Gas
Comparison of GHG emissions from unconventional natural gas (“fracking”) in key studies
Figure 7 Comparison of Life-Cycle GHG Emissions for Electricity from Shale Gas
Source: own compilation; note that for UK and EU, production & processing data were added from Fritsche, Herling (2012) to allow for comparison; electricity generation efficiency was set to 52.5% (based on LHV); DE 2014 = data from IINAS (2014)
IINAS 17 GHG Shale Gas
Comparison of GHG emissions from unconventional natural gas (“fracking”) in key studies
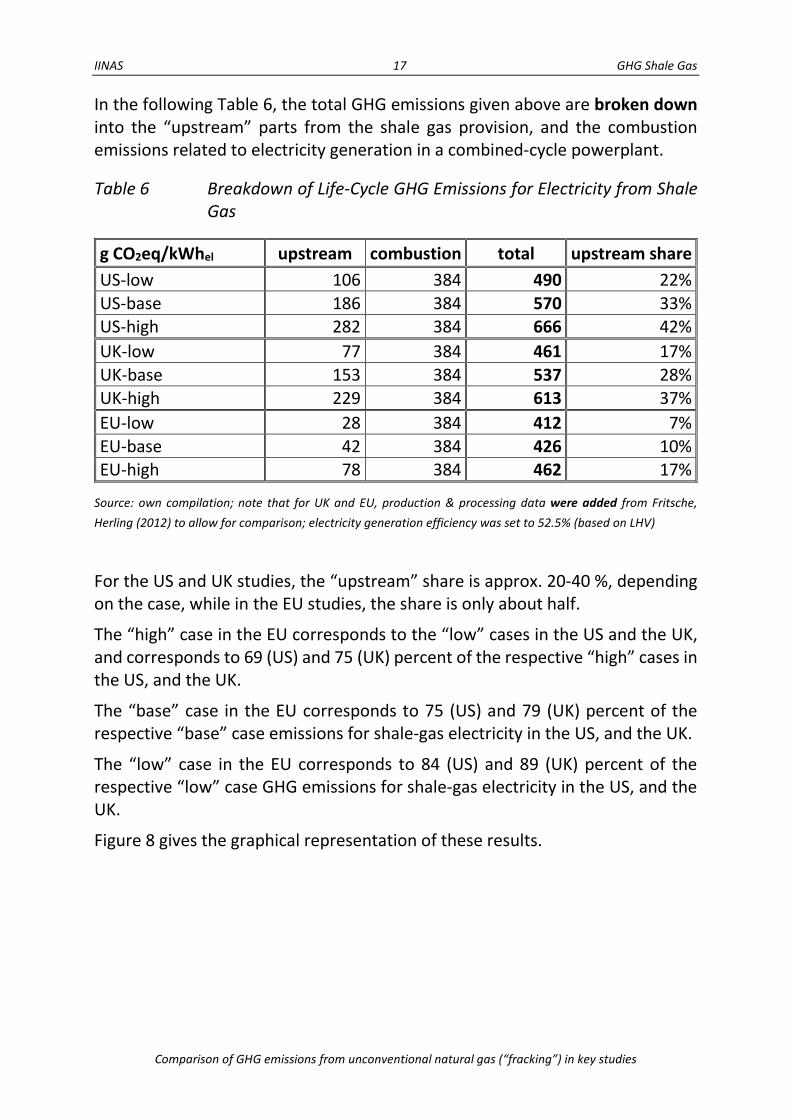
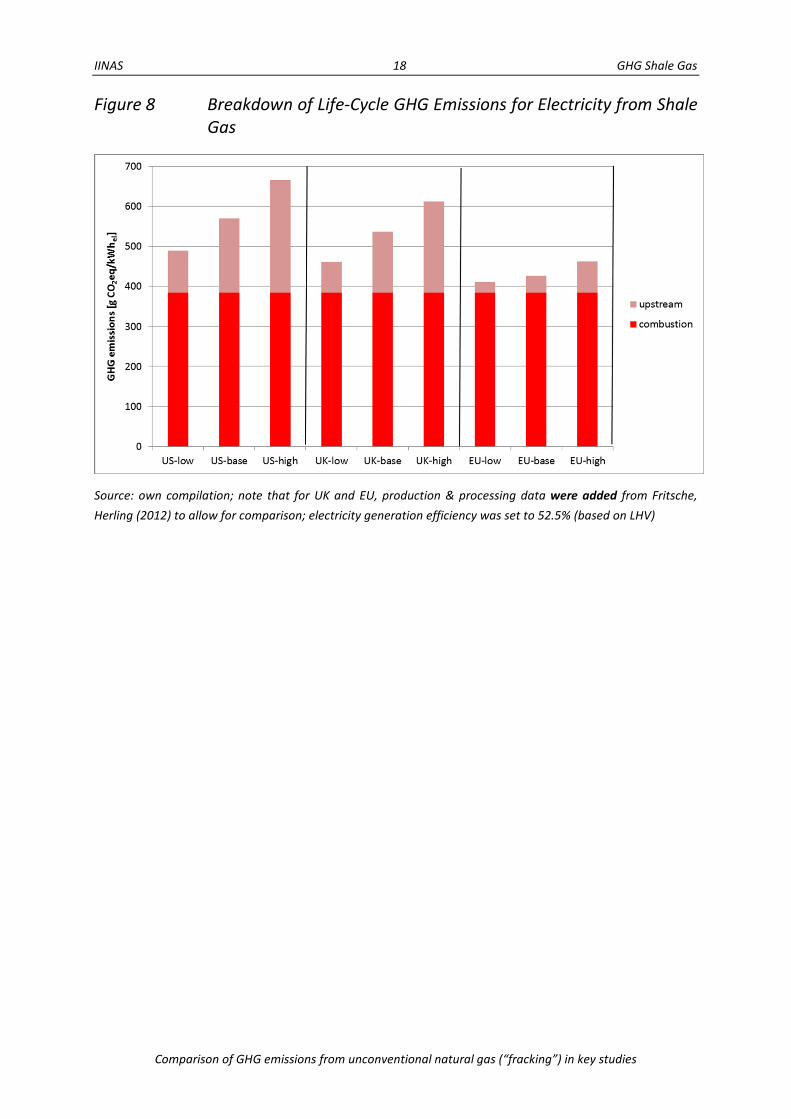
In the following Table 6, the total GHG emissions given above are broken down into the “upstream” parts from the shale gas provision, and the combustion emissions related to electricity generation in a combined-cycle powerplant.
Table 6 Breakdown of Life-Cycle GHG Emissions for Electricity from Shale Gas
g CO2eq/kWhel upstream combustion total upstream share US-low 106 384 490 22% US-base 186 384 570 33% US-high 282 384 666 42% UK-low 77 384 461 17% UK-base 153 384 537 28% UK-high 229 384 613 37% EU-low 28 384 412 7% EU-base 42 384 426 10% EU-high 78 384 462 17%
Source: own compilation; note that for UK and EU, production & processing data were added from Fritsche, Herling (2012) to allow for comparison; electricity generation efficiency was set to 52.5% (based on LHV)
For the US and UK studies, the “upstream” share is approx. 20-40 %, depending on the case, while in the EU studies, the share is only about half.
The “high” case in the EU corresponds to the “low” cases in the US and the UK, and corresponds to 69 (US) and 75 (UK) percent of the respective “high” cases in the US, and the UK.
The “base” case in the EU corresponds to 75 (US) and 79 (UK) percent of the respective “base” case emissions for shale-gas electricity in the US, and the UK.
The “low” case in the EU corresponds to 84 (US) and 89 (UK) percent of the respective “low” case GHG emissions for shale-gas electricity in the US, and the UK.
Figure 8 gives the graphical representation of these results.
IINAS 18 GHG Shale Gas
Comparison of GHG emissions from unconventional natural gas (“fracking”) in key studies
Figure 8 Breakdown of Life-Cycle GHG Emissions for Electricity from Shale Gas
Source: own compilation; note that for UK and EU, production & processing data were added from Fritsche, Herling (2012) to allow for comparison; electricity generation efficiency was set to 52.5% (based on LHV)
IINAS 19 GHG Shale Gas
Comparison of GHG emissions from unconventional natural gas (“fracking”) in key studies
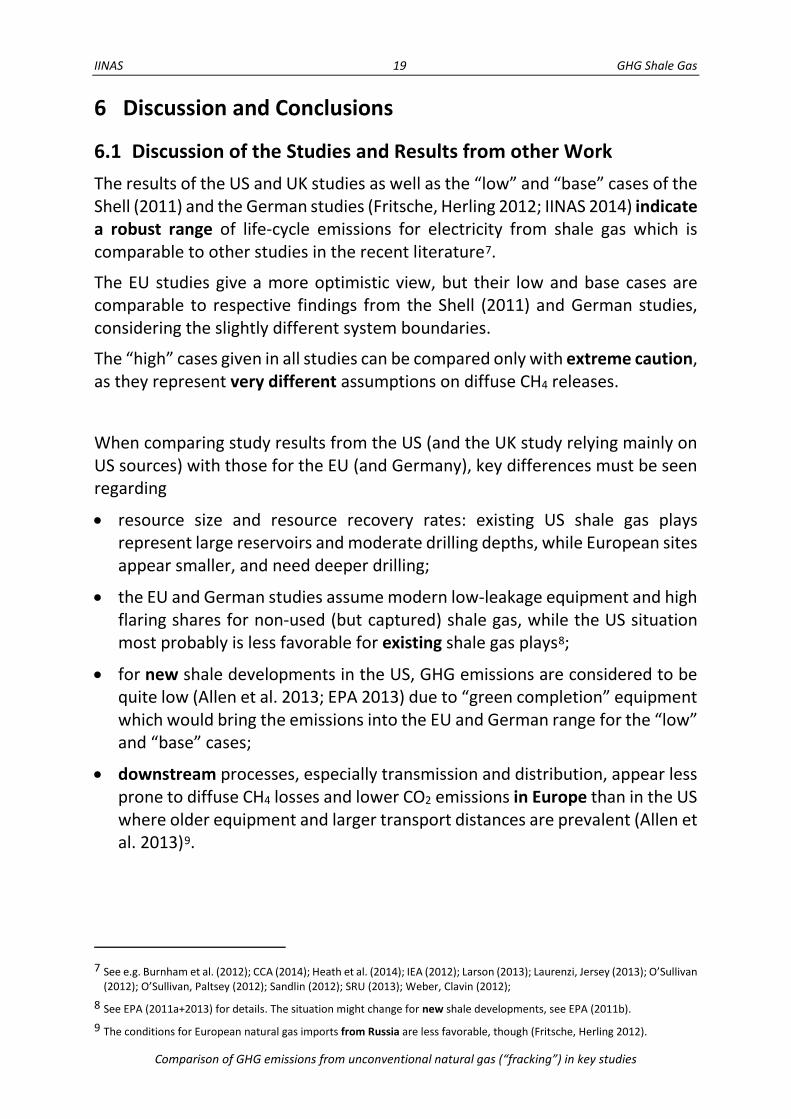
6 Discussion and Conclusions
6.1 Discussion of the Studies and Results from other Work The results of the US and UK studies as well as the “low” and “base” cases of the Shell (2011) and the German studies (Fritsche, Herling 2012; IINAS 2014) indicate a robust range of life-cycle emissions for electricity from shale gas which is comparable to other studies in the recent literature7.
The EU studies give a more optimistic view, but their low and base cases are comparable to respective findings from the Shell (2011) and German studies, considering the slightly different system boundaries.
The “high” cases given in all studies can be compared only with extreme caution, as they represent very different assumptions on diffuse CH4 releases.
When comparing study results from the US (and the UK study relying mainly on US sources) with those for the EU (and Germany), key differences must be seen regarding
• resource size and resource recovery rates: existing US shale gas plays represent large reservoirs and moderate drilling depths, while European sites appear smaller, and need deeper drilling;
• the EU and German studies assume modern low-leakage equipment and high flaring shares for non-used (but captured) shale gas, while the US situation most probably is less favorable for existing shale gas plays8;
• for new shale developments in the US, GHG emissions are considered to be quite low (Allen et al. 2013; EPA 2013) due to “green completion” equipment which would bring the emissions into the EU and German range for the “low” and “base” cases;
• downstream processes, especially transmission and distribution, appear less prone to diffuse CH4 losses and lower CO2 emissions in Europe than in the US where older equipment and larger transport distances are prevalent (Allen et al. 2013)9.
7 See e.g. Burnham et al. (2012); CCA (2014); Heath et al. (2014); IEA (2012); Larson (2013); Laurenzi, Jersey (2013); O’Sullivan
(2012); O’Sullivan, Paltsey (2012); Sandlin (2012); SRU (2013); Weber, Clavin (2012); 8 See EPA (2011a+2013) for details. The situation might change for new shale developments, see EPA (2011b). 9 The conditions for European natural gas imports from Russia are less favorable, though (Fritsche, Herling 2012).
IINAS 20 GHG Shale Gas
Comparison of GHG emissions from unconventional natural gas (“fracking”) in key studies
6.2 Conclusions The variety of data to describe the life-cycles of shale gas provision and its use for electricity generation does not allow deriving robust results for all relevant circumstances and possibly relevant situations, as e.g. post-production CH4 releases were considered only in the German studies.
Still, “base” case estimates for the US and Europe give a robust range of emissions for electricity from shale gas, indicating life-cycle GHG emissions reductions compared to coal-based electricity between 40 and 50 %, i.e. life-cycle GHG emissions from coal-based electricity are 1.5 to 2 times higher10.
For new shale gas plays in the US, the GHG emissions appear to be in the “low” range of the US studies, comparable to the respective cases for the EU, and Germany.
There are two major issues to be considered when assessing shale gas, though:
• The “per unit” comparison of GHG emissions from electricity generation based on shale gas and coal reflect the life-cycles, but not the overall balance of the real-world energy system. With increasing use of shale gas for electricity generation in the US, the domestic role of coal was reduced in the last years, leading to reduced domestic CO2 emissions. Yet, exports of US coal to Europe increased due to favorable energy prices11, leading to increased GHG emissions from coal-fired powerplants in Europe (Broderick, Allen 2012). This “leakage” must be considered when evaluating the absolute GHG impacts of shale gas development (SRU 2013; IINAS 2014).
• GHG emissions are important when discussing the environmental impacts from shale gas development, but other aspects such as
o risks of groundwater contamination and induced seismicity as well as
o local air pollution and noise (mainly due to truck transports)
need to be reflected as well.
It is beyond the brief analysis presented here to discuss these issues, though.
10 Note that this is calculated for the GWP100 time horizon, and GWPs from IPCC (2007). For shorter time horizons and other
GWPs as used in the original US studies, the GHG reductions from shale gas compared to coal would be smaller. 11 Another factor contributing to this development is the currently very low price for CO2 certificates in the European
Emission Trading System (ETS).

IINAS 21 GHG Shale Gas
Comparison of GHG emissions from unconventional natural gas (“fracking”) in key studies
References AEA (AEA Technology plc) 2012a: Climate Impact of Potential Shale Gas Production in the EU;
Forster D et al.; prepared for EC DG CLIMA; Didcot http://ec.europa.eu/clima/policies/eccp/docs/120815_final_report_en.pdf
AEA (AEA Technology plc) 2012b: Support to the identification of potential risks for the environment and human health arising from hydrocarbons operations involving hydraulic fracturing in Europe; Broomfield M; prepared for EC DG ENV; Didcot http://ec.europa.eu/environment/integration/energy/pdf/fracking study.pdf
Allen D et al. 2013: Measurements of methane emissions at natural gas production sites in the United States; in: PNAS published online before print September 16, 2013, doi: 10.1073/pnas.1304880110
Broderick J et al. 2011: Shale gas: an up-dated assessment of environmental and climate change impacts; Tyndall Centre for Climate Change Research, University of Manchester www.tyndall.manchester.ac.uk/public/Tyndall_shale_update_2011_report.pdf
Broderick J, Anderson K 2012: Has US Shale Gas Reduced CO2 Emissions? Tyndall Centre, University of Manchester http://www.tyndall.ac.uk/sites/default/files/broderick_and_anderson_2012_impact_of_shale_gas_on_us_energy_and_emissions.pdf
Burnham A et al. 2012: Life-Cycle Greenhouse Gas Emissions of Shale Gas, Natural Gas, Coal, and Petroleum; in: Environ. Sci. Technol. vol. 46, pp. 619–627
CCA (Council of Canadian Academies) 2014: Environmental Impacts of Shale Gas Extraction in Canada; The Expert Panel on Harnessing Science and Technology to Understand the Environmental Impacts of Shale Gas Extraction; Ottawa http://www.scienceadvice.ca/uploads/eng/assessments%20and%20publications%20and%20news%20releases/Shale%20gas/ShaleGas_fullreportEN.pdf
EPA (US Environmental Protection Agency) 2010: Greenhouse gas emissions reporting from the petroleum and natural gas industry. Background Techn. Supp. Doc; Washington DC http://www.epa.gov/ghgreporting/documents/pdf/2010/Subpart-W_TSD.pdf
EPA (US Environmental Protection Agency) 2011a: Inventory of U.S. Greenhouse Gas Emissions and Sinks: 1990–2009; Washington DC http://www.epa.gov/climatechange/Downloads/ghgemissions/US-GHG-Inventory-2011-Complete_Report.pdf
EPA (US Environmental Protection Agency) 2011b: Regulatory Impact Analysis - Proposed New Source Performance Standards and Amendments to the National Emissions Standards for Hazardous Air Pollutants for the Oil and Gas Industry; Washington DC http://www.epa.gov/ttnecas1/regdata/RIAs/oilnaturalgasfinalria.pdf
EPA (US Environmental Protection Agency) 2013: Inventory of U.S. Greenhouse Gas Emissions and Sinks: 1990–2011; Washington DC http://www.epa.gov/climatechange/Downloads/ghgemissions/US-GHG-Inventory-2013-Main-Text.pdf
Fritsche U, Herling J 2012: Energie- und Klimabilanz von Erdgas aus unkonventionellen Lagerstätten im Vergleich zu anderen Energiequellen; Öko-Institut/IINAS; Endbericht zum Gutachten für Team Ewen im Rahmen des InfoDialog Fracking; Darmstadt http://dialog-erdgasundfrac.de/sites/dialog-erdgasundfrac.de/files/OEKO_IINAS-Fracking-Energie-Klimabilanz.pdf
IINAS 22 GHG Shale Gas
Comparison of GHG emissions from unconventional natural gas (“fracking”) in key studies
GAO (US Government Accountability Office) 2010: Federal Oil and Gas Leases: Opportunities Exist to Capture Vented and Flared Natural Gas, Which Would Increase Royalty Payments and Reduce Greenhouse Gases; GAO-11-34; Washington DC http://www.gao.gov/assets/320/311826.pdf
Heath G et al. 2014: Harmonization of initial estimates of shale gas life cycle greenhouse gas emissions for electric power generation; in: PNAS early edition www.pnas.org/cgi/doi/10.1073/pnas.1309334111
Howarth R, Santoro R, Ingraffea A 2011: Methane and the greenhouse-gas footprint of natural gas from shale formations; in: Climatic Change vol. 106, pp. 679-690
Howarth R, Santoro R, Ingraffea A 2012: Venting and leaking of methane from shale gas development: response to Cathles et al.; in: Climatic Change vol. 113, pp. 537–549
Howarth R et al. 2012a: Methane Emissions from Natural Gas Systems; Background Paper Prepared for the National Climate Assessment; Reference number 2011-0003; Ithaca http://www.eeb.cornell.edu/howarth/Howarth%20et%20al.%20--%20National%20Climate%20Assessment.pdf
Howarth R et al. 2012b: Greenhouse gas footprint of shale gas obtained by hydraulic fracturing; presented at Ecological Society of America Annual Meeting 2012, 1 - 6 Aug 2012, OOS 3-8 http://cdn.f1000.com/posters/docs/251359591
IEA (International Energy Agency) 2012: Golden Rules for a Golden Age of Gas; Paris http://www.worldenergyoutlook.org/media/weowebsite/2012/goldenrules/WEO2012_GoldenRulesReport.pdf
IINAS (Internationales Institut für Nachhaltigkeitsanalysen und -strategien) 2014: Aufbereitung des Forschungsstands zu Energie- und Klimabilanzen sowie Scoping-Untersuchung der Klimabilanz in Deutschland; Fritsche U, Hunt S; in: RiskCom u.a. 2014: Umweltauswirkungen von Fracking bei der Aufsuchung und Gewinnung von Erdgas insbesondere aus Schiefergaslagerstätten Teil 2 - Grundwassermonitoringkonzept, Frackingchemikalienkataster, Entsorgung von Flowback, Forschungsstand zur Emissions- und Klimabilanz, induzierte Seismizität, Naturhaushalt, Landschaftsbild und biologische Vielfalt; UBA TEXTE 53/2014; Dessau http://www.umweltbundesamt.de/sites/default/files/medien/378/publikationen/texte_53_2014_umweltauswirkungen_von_fracking_28.07.2014_0.pdf
IPCC (Intergovernmental Panel on Climate Change) 2007: Climate Change 2007: The Physical Science Basis; contribution of Working Group I to the Fourth Assessment Report of the IPCC; Solomon S et al. (eds.); Cambridge, New York
IPCC (Intergovernmental Panel on Climate Change) 2013: Expert meeting on Fugitive Emissions from Oil and Natural Gas Systems (including shale gas, coal bed methane, etc.); August 20-22, 2013; Washington DC
Larson E 2013: Natural Gas & Climate Change; Climate Central; Princeton http://assets.climatecentral.org/pdfs/NaturalGas-and-ClimateChange.pdf
Laurenzi I, Jersey G 2013: Life Cycle Greenhouse Gas Emissions and Freshwater Consumption of Marcellus Shale Gas; in: Environ. Sci. Technol. dx.doi.org/10.1021/es305162w
O’Sullivan F 2012: Shale Gas Production – The GHG Emissions Question; Stakeholder Workshop on Natural Gas in the Inventory of U.S. Greenhouse Gas Emissions and Sinks http://www.epa.gov/climatechange/Downloads/ghgemissions/2012Workshop/MIT_OSullivan.pdf
IINAS 23 GHG Shale Gas
Comparison of GHG emissions from unconventional natural gas (“fracking”) in key studies
O'Sullivan F, Paltsev S 2012: Shale gas production: potential versus actual greenhouse gas emissions; in: Environ. Res. Lett. vol. 7, pp. 1-6
Sandlin J 2012: Realistic Completion Emissions; presented at the Stakeholder Workshop on Natural Gas in the Inventory of US GHG Emissions and Sinks Sept. 13, Washington DC http://www.epa.gov/climatechange/Downloads/ghgemissions/2012Workshop/Devon_Sandlin.pdf
Santoro R, Howarth R, Ingraffea A 2011: Indirect Emissions of Carbon Dioxide from Marcellus Shale Gas Development. A Technical Report from the Agriculture, Energy, & Environment Program at Cornell University; Ithaca http://www.eeb.cornell.edu/howarth/IndirectEmissionsofCarbonDioxidefromMarcellusShaleGasDevelopment_June302011%20.pdf
Shell 2011: Modeling the Relative GHG Emissions of Conventional and Shale Gas Production; Stephenson T, Valle J, Riera-Palou X; in: Environ. Sci Technol. vol. 45, pp. 10757-10764
Shindell D et al. 2009: Improved Attribution of Climate Forcing to Emissions; in: Science vol. 326 no. 5953 pp. 716-718
SRU (German Advisory Council on the Environment) 2013: Fracking for Shale Gas Production - A contribution to its appraisal in the context of energy and environment policy; Statement Nr. 18; Berlin http://www.umweltrat.de/SharedDocs/Downloads/EN/04_Statements/2012_2016/2013_09_Statement_18_Fracking_for_Shale_Gas_Production.pdf?__blob=publicationFile
Weber C, Clavin C 2012: Life cycle carbon footprint of shale gas: Review of evidence and implications; in: Environ. Sci. Technol. vol. 44 no. 11, pp. 5688-5695