comparison of electronic and mechanical schmidt hammers in
TRANSCRIPT
EARTH SURFACE PROCESSES AND LANDFORMSEarth Surf. Process. Landforms (2014)Copyright © 2014 John Wiley & Sons, Ltd.Published online in Wiley Online Library(wileyonlinelibrary.com) DOI: 10.1002/esp.3584
Letters to ESEX
Comparison of electronic and mechanical Schmidthammers in the context of exposure-age dating:are Q- and R-values interconvertible?Stefan Winkler1* and John A. Matthews21 Department of Geological Sciences, University of Canterbury, Christchurch, New Zealand2 Department of Geography, Swansea University, Swansea, UK
Received 5 January 2014; Revised 3 April 2014; Accepted 8 April 2014
*Correspondence to: Stefan Winkler, Department of Geological Sciences, University of Canterbury, Christchurch, New Zealand. E-mail: [email protected]
ABSTRACT: Application of Schmidt-hammer exposure-age dating (SHD) to landforms has substantially increased in recent years.The original mechanical Schmidt hammer records R-(rebound) values. Although the newly introduced electronic Schmidt hammer(SilverSchmidt) facilitates greatly improved data processing, it measures surface hardness differently, recording Q-(velocity) valuesthat are not a priori interconvertible with R-values. This study is the first to compare the performance of both instruments in the con-text of field-based exposure-age dating with a particular focus on the interconvertibility of R-values and Q-values. The study wasconducted on glacially polished pyroxene-granulite gneiss, Jotunheimen, southern Norway. Results indicate that mean Q-valuesare consistently 8–10 units higher than mean R-values over the range of values normally encountered in the application of SHDto glacial and periglacial landforms. A convenient conversion factor of ±10 units may, therefore, be appropriate for all but the softestrock types close to the technical resolution of the instruments. The electronic Schmidt hammer should therefore be regardedas a useful complement and potential replacement for the mechanical Schmidt hammer. Conversion of published R-valuesdata to Q-values requires, however, careful control and documentation of instrument calibration. Copyright © 2014 JohnWiley & Sons, Ltd.
KEYWORDS: Schmidt-hammer exposure-age dating (SHD); R-value; Q-value; Holocene glacier chronology; Norway
Introduction
Boulder and bedrock surface hardness affected by subaerialsurface weathering as a function of exposure time is the basicprinciple for geomorphologists applying the Schmidt hammerto the dating of landforms (Day and Goudie, 1977; McCarroll,1994; Goudie, 2006; Shakesby et al., 2006, 2011). Thetechnique has been used, for example, to date moraines andglacially sculptured bedrock (Matthews and Shakesby, 1984;Evans et al., 1999; Winkler, 2005, 2014; Owen et al., 2007;Matthews and Owen, 2010; Matthews and Winkler, 2011),rock glaciers and pronival ramparts (Frauenfelder et al., 2005;Kellerer-Pirklbauer et al., 2008; Matthews et al., 2011; Rodeand Kellerer-Pirklbauer, 2011; Matthews et al., 2013), talusslopes and rock avalanches (Nesje et al., 1994; Aa et al.,2007), and fluvial terraces and flood berms (Matthews andMcEwen, 2013; Stahl et al., 2013). Initially providing onlyrelative age estimates, the past decade has seen the develop-ment of Schmidt-hammer exposure-age dating (SHD) as acalibrated-age dating technique (sensu Colman et al., 1987)constrained by the requirement of control points for knownage of constructing high-precision age-calibration curves.
An electronic Schmidt hammer (named SilverSchmidt) wasintroduced by the manufacturer of the original mechanicalSchmidt hammer (Proceq SA, Schwerzenbach) in 2007 as animprovement of mechanical Schmidt hammers (Proceq, 2007).It offers, in particular, facilities for easy data procession such asthe initial storage and subsequent download of all measurementsto a laptop and constitutes a potential complement if not replace-ment for the mechanical Schmidt hammer. However, its differentapproach to the measurement of surface hardness – based onQ-(velocity) values instead of R-(rebound) values – is a po-tential drawback. This difference means that measurementsfrom the two instruments cannot be used interchangeably.Although Viles et al. (2011) compared the mechanicalSchmidt hammer and SilverSchmidt (alongside two versionsof another instrument, the Equotip) in a pilot study, they primarilyfocussed on their capabilities for investigating rock types ofdifferent surface hardness in relation to expected standarddeviation and required sample size.Moreover, themanufacturershave failed to produce any guidelines on interconvertibility.
Furthermore, no comparison of mechanical versus electronicSchmidt hammers in terms of Q- and R-values has so far beenconducted in the context of SHD. Given the increasing quantity

S. WINKLER AND J. A. MATTHEWS
of existing data and the increasing number of well-establishedregional age-calibration curves derived from mechanicalSchmidt hammers, it seems vital to test whether the Silver-Schmidt could, in future, be introduced within this field ofresearch. To this end, the performance of both instrumentswas compared on glacially polished bedrock surfaces atvarious localities in Jotunheimen, southern Norway, previouslyutilized for the construction of age-calibration curves (Matthewsand Owen, 2010). The performance of the SilverSchmidt duringextensive field measurements on surfaces of different surfacehardness was, in this context, tested for the first time. The overallaim was to compare theQ-values obtained by the SilverSchmidtwith the R-values obtained with a mechanical Schmidt hammeron the same types of surfaces under controlled field conditions.By investigating the interconvertibility of Q- and R-valuesthe possibility of establishing a numerical conversion factorfor Q- and R-values was explored. In summary, this studyassesses the potential of the SilverSchmidt as a future comple-ment or even replacement for the mechanical Schmidt hammer.
Study Area
The sample localities for this study are located in the west-central part of the Jotunheimen mountain range of southernNorway (Figure 1) and constitute sites of known age previouslyinvestigated by Matthews and Owen (2010). Two localities liewithin the boundaries of the Little Ice Age (LIA) glacierforelands of Leirbreen and Storbreen (both deglaciated c. AD
1900) and three localities lie beyond glacier-foreland bound-aries: one in the lower part of Leirdalen to the east of theSmorstabbtindan massif and the remaining two close to the
Figure 1. Sampling localities around the Smørstabbtindan massif, Jotunheim
Copyright © 2014 John Wiley & Sons, Ltd.
glacier forelands of Leirbreen and adjacent Bøverbreen to thewest of the massif. These three ‘older’ localities became ice-freelate in the Preboreal c. 9700 years ago (Dahl et al., 2002;Matthews and Dresser, 2008; Matthews and Owen, 2010).Age and altitude of all five sites are listed in Table I. The impactof altitudinal differences between individual sites was neitherspecifically discussed by Matthews and Owen (2010), norconsidered by them as a potential factor affecting the variabilityof mean R-values. For our study, this factor was considered notrelevant as altitude is controlled in our comparative approach.
The bedrock at all localities is part of the early-ProterozoicJotunheimen complex of predominantly pyroxene-granulitegneiss (Lutro and Tveten, 1996). Although within-site andwithin-locality lithological and mineralogical heterogeneitywas identified by previous studies (Matthews and Owen,2010; Matthews and Winkler, 2011), the bedrock is generallywell suited to Schmidt hammer applications. The closestmeteorological station Sognefjell [1413 m above sea level (a.s.l.)]has a mean annual air temperature of �3.1 °C (Aune, 1993).Annual precipitation is ~860 mm on the basis of the discontinuedmeasurements at this station (Førland, 1993).
Methods
Both instruments used in this comparative study were N-typemodels with an identical impact energy of 2.207 Nm for theplunger (Proceq, 2004, 2012; see also Shakesby et al., 2006,Viles et al., 2011, for more technical details). The main differ-ence regarding the measurement of compressive strength/surface hardness of a rock surface is that the mechanicalSchmidt hammer displays a rebound distance value. It uses a
en (modified from Matthews and Owen, 2010).
Earth Surf. Process. Landforms, (2014)

Table I. Differences between R- and Q-value means using the paired sampling approach
Locality Sample R-Valuea Q-Valuea Δ ∅ Δ
A - Leirbreen outside NS 181.1x 37.16±2.37 47.22±2.67 10.06(1520 m a.s.l.; c. 9700 years) NS 181.6x 35.58±1.92 43.94±2.24 8.36 9.21B – Bøverbreen outside NS 183.1x 39.30±2.58 49.55±2.88 10.25(1400 m a.s.l.; c. 9700 years) NS 183.6x 36.08±3.06 43.78±3.31 7.70 8.58C – Leirdalen outer valley NS 185.1x 42.12±2.05 50.88±2.29 8.76(1050 m a.s.l.; c. 9700 years) NS 185.2x 43.32±2.29 51.90±2.37 8.58 8.67D – Leirbreen inside NS 182.1x 65.04±0.97 73.03±1.28 7.99(1510 m a.s.l.; c. 100 years) NS 182.7x 66.74±0.98 74.37±1.38 7.63 7.81E – Storbreen inside NS 184.1x 69.08±1.02 77.41±1.05 8.33(1260 m a.s.l.; c. 100 years) NS 184.6x 71.40±0.94 79.76±0.72 8.36 8.35A–C (old control points) combined 38.93±1.03 47.88±1.13 8.95D–E (young control points) combined 68.07±0.59 76.14±0.67 8.07A–E (all points) combined 50.58±1.42 59.18±1.42 8.60Test anvil 80.84±0.29 89.38±0.20 8.54Tarmac NS 186.1x 25.28±1.35 28.97±1.70 3.69
NS 186.2x 22.28±0.97 27.68±1.66 5.40 4.55
Note: Paired sampling approach is the comparison of R- and Q-value mean data for the five selected localities previously investigated by Matthewsand Owen (2010; see also Figure 1). Matched pairs of Q- and R-values are used to calculate the mean difference, which is given for individualsamples (Δ, n=50) as well as for each locality (∅ Δ, n=100). Differences are additionally given for all old and young sites, respectively, and forthe whole data set. The test anvil and tarmac are included as additional test surfaces (see text).aMean with standard error of the mean (SEM) at 95% confidence (α = 0.05; n=50).
COMPARISON OF ELECTRONIC AND MECHANICAL SCHMIDT HAMMERS
rider with a guide rod to record the specific distance theplunger bounces back after it impacts the rock surface. TheSilverSchmidt, in contrast, uses an inbuilt sensor to record therebound velocity of the plunger and electronically displaysand saves this Q-value. The Q-value has primarily been intro-duced because it is not influenced by the impact direction ofthe plunger. By contrast, R-values are slightly influenced bythe impact direction and the mechanical Schmidt hammershould therefore ideally always be held vertical during sam-pling (Basu and Aydin, 2004; Proceq, 2007).Due to this difference in measuring the rebound and its
potential deviations the manufacturer Proceq SA refrains fromproviding a conversion factor for Q- and R-values with thelatest versions of the SilverSchmidt. The first SilverSchmidtshad an R-value unit conversion of unknown procedure in theirsoftware but that was eventually removed and the plungermodified (see later). There are two main differences withhandling the instruments and sampling in the field: first, theSilverSchmidt is able to store up to 4000 impacts and calculatearithmetic mean and standard deviation values; second, thedata can be easily downloaded after fieldwork and displayedeither in the instrument’s own software (Hammerlink) orexported into spreadsheets and statistical programmes (e.g.Microsoft Excel, IBM SPSS). Thus, there is no need for theoperator to book individual readings, which improves effi-ciency both in the field and in subsequent processing.To compare both instruments and explore interconvertibility,
we used two different approaches. First, parallel sampling wasconducted with both instruments with a high level of experi-mental control. For this approach, paired samples (n=50) onglacially polished bedrock were collected so that the plungerimpacts of both instruments were set close together on the rocksurface (to avoid both the influence of minor lithologicalheterogeneity and modifications to the surface by consecutiveimpacts on the same spot; see Discussion section). In order totest their performance at the higher and lower end of surfacehardness, similar paired sample tests were also made on afull-metal proprietary test anvil and soft tarmac, respectively.Second, resampling was carried out with the SilverSchmidt atfive selected localities (see Table I, Figure 2) previously sam-pled by Matthews and Owen (2010) with the mechanicalSchmidt-hammer. The rationale for this second approach was
Copyright © 2014 John Wiley & Sons, Ltd.
to test whether also older archive data and/or previously pub-lished data could be utilized in this context. With a consider-able amount of R-value data already available for someregions, this would in the end be important for the acceptanceof the new instrument. Although this approach involved alower level of experimental control, in order to achieve maxi-mum comparability, we kept to a minimum sample size at eachlocality of n=400 (25 impacts × 16 sites). The involvement ofone author in both studies ensured, furthermore, that measure-ments were conducted under equal conditions (e.g. on dry bed-rock surfaces; see Discussion section). An attempt was made toidentify the same bedrock exposures previously tested at all lo-calities and actually re-sample those.
Following common procedures with Schmidt hammer rawdata processing mean Q-values and mean R-values and theirconfidence intervals for each sample were calculated usingthe equation:
X ± 1:96σffiffiffin
p� �
(1)
where X = arithmetic mean, σ = standard deviation, andn = number of impacts for individual samples at 95% confi-dence (α = 0.05) following Shakesby et al. (2006). Standardstatistical analysis included Kolmogorov–Smirnov tests fornormality and paired t-tests for dependent samples (Sachs,1999; Lehmann, 2002) using IBM SPSS Statistics software.
Results
Measuring Q-values with the SilverSchmidt was unproblematic.Data were downloaded on a daily basis, the internal memorycleared, and battery capacity checked and occasionally re-charged. Hence, even with more than 1300 impacts per day,the stated maximum memory capacity was far from beingapproached. With all impacts automatically registered by theinstrument, inaccurate impacts (caused, for example, by smallparticles splintering away during impact or invisible cracksbelow the rock surface which only may be detected by ananomalous amphoric sound during the impact) needed to be
Earth Surf. Process. Landforms, (2014)
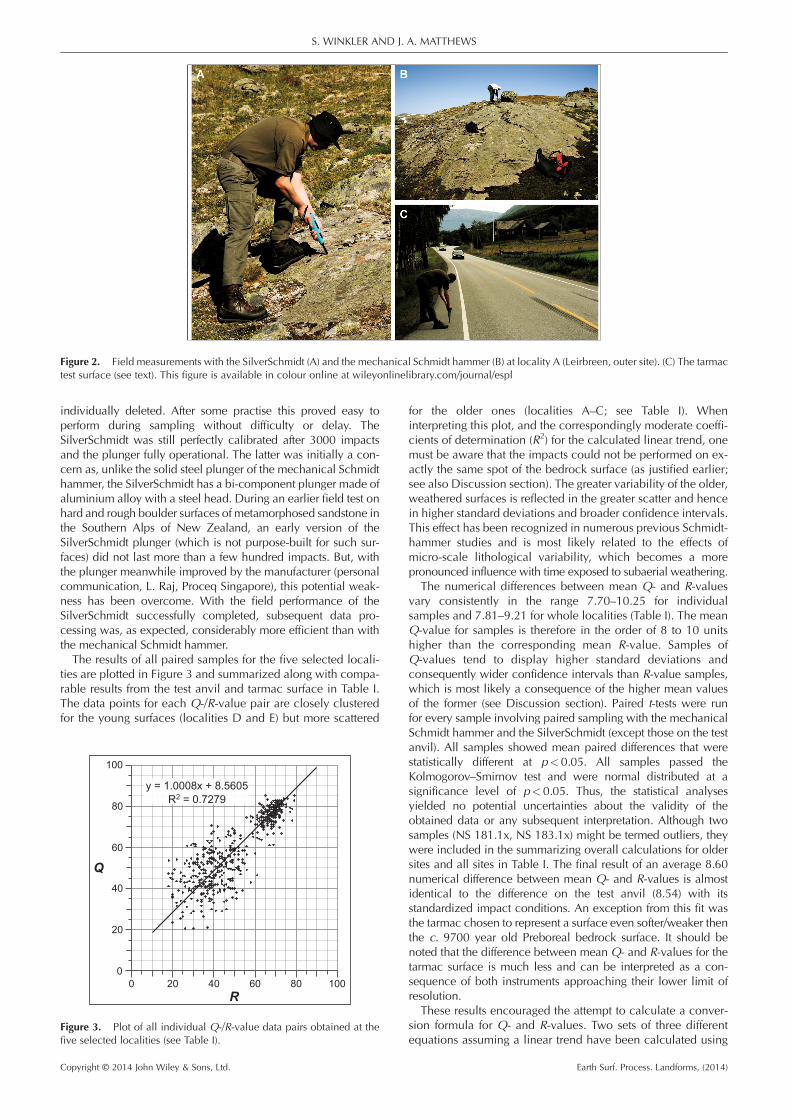
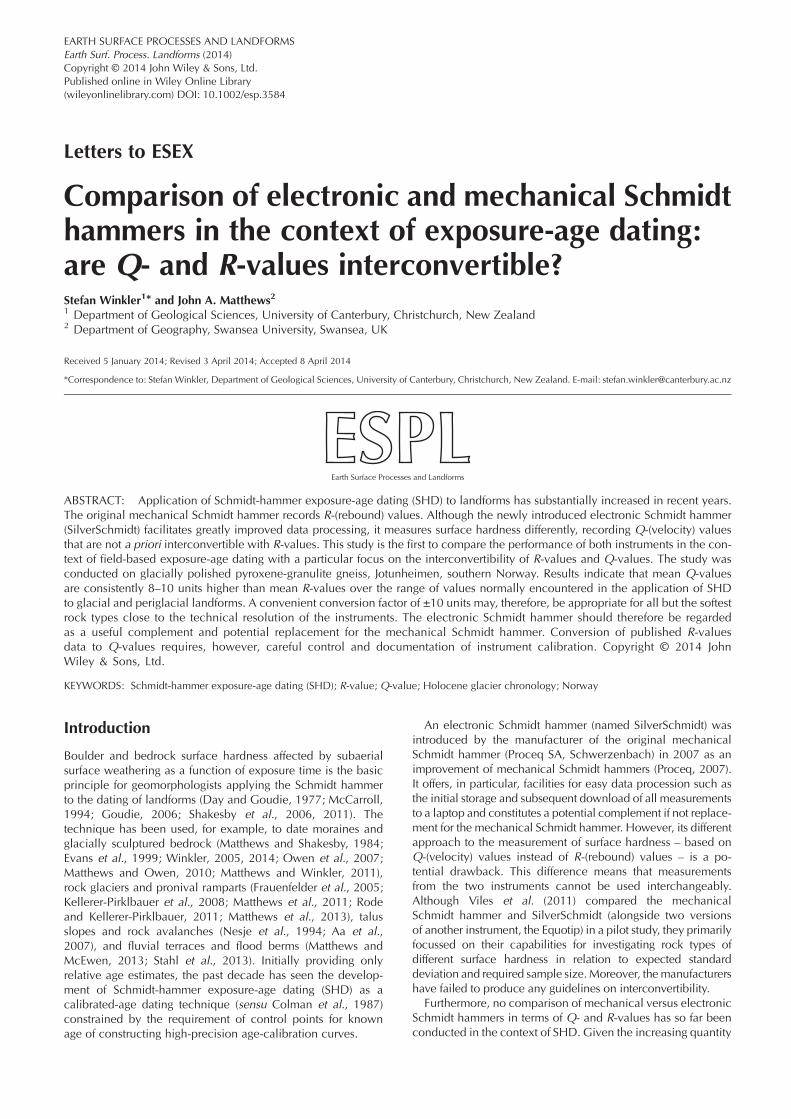
Figure 2. Field measurements with the SilverSchmidt (A) and the mechanical Schmidt hammer (B) at locality A (Leirbreen, outer site). (C) The tarmactest surface (see text). This figure is available in colour online at wileyonlinelibrary.com/journal/espl
S. WINKLER AND J. A. MATTHEWS
individually deleted. After some practise this proved easy toperform during sampling without difficulty or delay. TheSilverSchmidt was still perfectly calibrated after 3000 impactsand the plunger fully operational. The latter was initially a con-cern as, unlike the solid steel plunger of the mechanical Schmidthammer, the SilverSchmidt has a bi-component plunger made ofaluminium alloy with a steel head. During an earlier field test onhard and rough boulder surfaces of metamorphosed sandstone inthe Southern Alps of New Zealand, an early version of theSilverSchmidt plunger (which is not purpose-built for such sur-faces) did not last more than a few hundred impacts. But, withthe plunger meanwhile improved by the manufacturer (personalcommunication, L. Raj, Proceq Singapore), this potential weak-ness has been overcome. With the field performance of theSilverSchmidt successfully completed, subsequent data pro-cessing was, as expected, considerably more efficient than withthe mechanical Schmidt hammer.The results of all paired samples for the five selected locali-
ties are plotted in Figure 3 and summarized along with compa-rable results from the test anvil and tarmac surface in Table I.The data points for each Q-/R-value pair are closely clusteredfor the young surfaces (localities D and E) but more scattered
Figure 3. Plot of all individual Q-/R-value data pairs obtained at thefive selected localities (see Table I).
Copyright © 2014 John Wiley & Sons, Ltd.
for the older ones (localities A–C; see Table I). Wheninterpreting this plot, and the correspondingly moderate coeffi-cients of determination (R2) for the calculated linear trend, onemust be aware that the impacts could not be performed on ex-actly the same spot of the bedrock surface (as justified earlier;see also Discussion section). The greater variability of the older,weathered surfaces is reflected in the greater scatter and hencein higher standard deviations and broader confidence intervals.This effect has been recognized in numerous previous Schmidt-hammer studies and is most likely related to the effects ofmicro-scale lithological variability, which becomes a morepronounced influence with time exposed to subaerial weathering.
The numerical differences between mean Q- and R-valuesvary consistently in the range 7.70–10.25 for individualsamples and 7.81–9.21 for whole localities (Table I). The meanQ-value for samples is therefore in the order of 8 to 10 unitshigher than the corresponding mean R-value. Samples ofQ-values tend to display higher standard deviations andconsequently wider confidence intervals than R-value samples,which is most likely a consequence of the higher mean valuesof the former (see Discussion section). Paired t-tests were runfor every sample involving paired sampling with the mechanicalSchmidt hammer and the SilverSchmidt (except those on the testanvil). All samples showed mean paired differences that werestatistically different at p<0.05. All samples passed theKolmogorov–Smirnov test and were normal distributed at asignificance level of p< 0.05. Thus, the statistical analysesyielded no potential uncertainties about the validity of theobtained data or any subsequent interpretation. Although twosamples (NS 181.1x, NS 183.1x) might be termed outliers, theywere included in the summarizing overall calculations for oldersites and all sites in Table I. The final result of an average 8.60numerical difference between mean Q- and R-values is almostidentical to the difference on the test anvil (8.54) with itsstandardized impact conditions. An exception from this fit wasthe tarmac chosen to represent a surface even softer/weaker thenthe c. 9700 year old Preboreal bedrock surface. It should benoted that the difference between mean Q- and R-values for thetarmac surface is much less and can be interpreted as a con-sequence of both instruments approaching their lower limit ofresolution.
These results encouraged the attempt to calculate a conver-sion formula for Q- and R-values. Two sets of three differentequations assuming a linear trend have been calculated using
Earth Surf. Process. Landforms, (2014)
COMPARISON OF ELECTRONIC AND MECHANICAL SCHMIDT HAMMERS
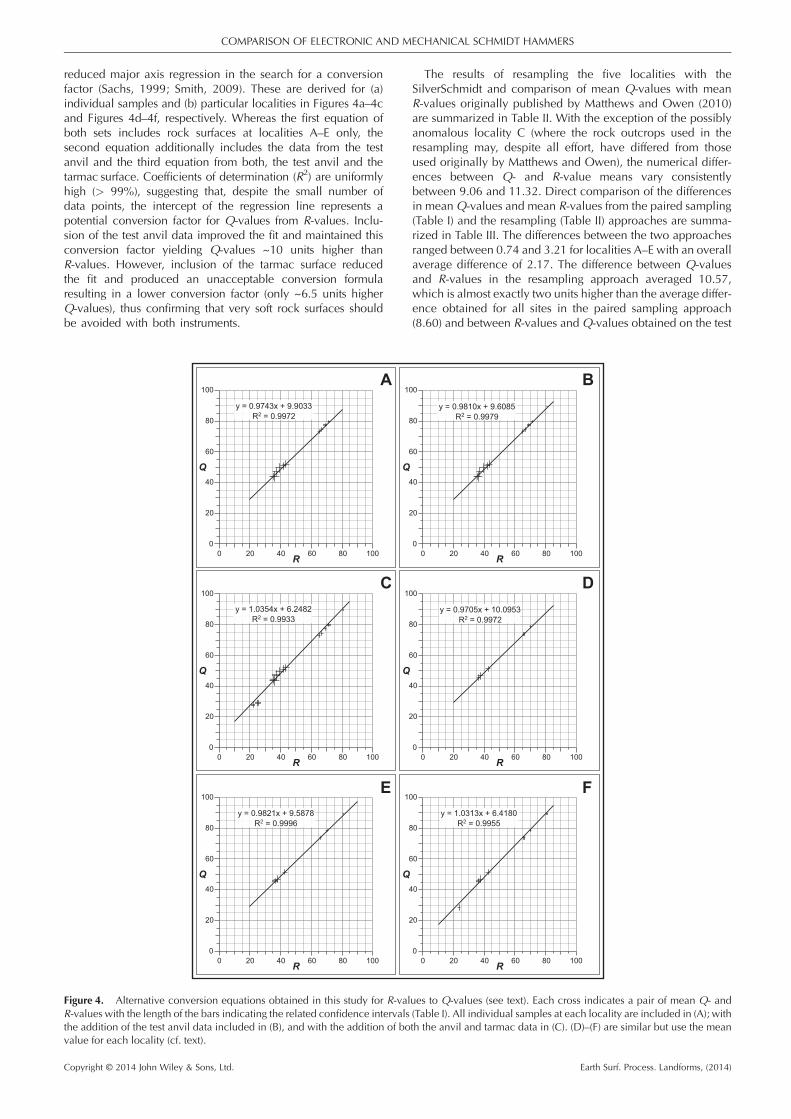
reduced major axis regression in the search for a conversionfactor (Sachs, 1999; Smith, 2009). These are derived for (a)individual samples and (b) particular localities in Figures 4a–4cand Figures 4d–4f, respectively. Whereas the first equation ofboth sets includes rock surfaces at localities A–E only, thesecond equation additionally includes the data from the testanvil and the third equation from both, the test anvil and thetarmac surface. Coefficients of determination (R2) are uniformlyhigh (> 99%), suggesting that, despite the small number ofdata points, the intercept of the regression line represents apotential conversion factor for Q-values from R-values. Inclu-sion of the test anvil data improved the fit and maintained thisconversion factor yielding Q-values ~10 units higher thanR-values. However, inclusion of the tarmac surface reducedthe fit and produced an unacceptable conversion formularesulting in a lower conversion factor (only ~6.5 units higherQ-values), thus confirming that very soft rock surfaces shouldbe avoided with both instruments.
Figure 4. Alternative conversion equations obtained in this study for R-valR-values with the length of the bars indicating the related confidence intervalsthe addition of the test anvil data included in (B), and with the addition of bovalue for each locality (cf. text).
Copyright © 2014 John Wiley & Sons, Ltd.
The results of resampling the five localities with theSilverSchmidt and comparison of mean Q-values with meanR-values originally published by Matthews and Owen (2010)are summarized in Table II. With the exception of the possiblyanomalous locality C (where the rock outcrops used in theresampling may, despite all effort, have differed from thoseused originally by Matthews and Owen), the numerical differ-ences between Q- and R-value means vary consistentlybetween 9.06 and 11.32. Direct comparison of the differencesin meanQ-values and mean R-values from the paired sampling(Table I) and the resampling (Table II) approaches are summa-rized in Table III. The differences between the two approachesranged between 0.74 and 3.21 for localities A–E with an overallaverage difference of 2.17. The difference between Q-valuesand R-values in the resampling approach averaged 10.57,which is almost exactly two units higher than the average differ-ence obtained for all sites in the paired sampling approach(8.60) and between R-values and Q-values obtained on the test
ues to Q-values (see text). Each cross indicates a pair of mean Q- and(Table I). All individual samples at each locality are included in (A); withth the anvil and tarmac data in (C). (D)–(F) are similar but use the mean
Earth Surf. Process. Landforms, (2014)

Table II. Differences between R- and Q-value means using the resampling approach
Locality R-Valuea nb Q-Value nc Δ Ranged
A - Leirbreen outside 35.78±0.74e 60 45.43± 1.48 16 9.65–10.1235.21±1.21 30 45.73± 1.45 1536.35±0.89 30 45.90± 1.53 14
B – Bøverbreen outside 37.12±0.92e 60 46.31± 1.88 16 9.19–10.3838.37±1.36 30 46.32± 1.82 1535.88±1.14 30 47.50± 1.08 14
C – Leirdalen outside 37.59±0.78 30 51.97± 1.17 44 11.86–14.3851.21± 1.02 4051.69± 1.22 3051.04± 1.20 3050.45± 1.02 30
D – Leirbreen inside 63.91±0.40 30 73.73± 1.07 20 9.06–10.0672.97± 0.85 1673.65± 0.55 15
E – Storbreen inside 66.43±0.46 30 77.33± 0.69 20 10.90–11.3277.64± 0.73 1677.75± 0.75 15
Note: Resampling approach is the comparison of meanQ-values with previously publishedmeanR-values (Matthews andOwen,2010). Apart from theQ-valuemeans using all individual samples obtained from each site (top value), a number of different selec-tions have been calculated for each site in an attempt to minimize the variability reflected in the confidence intervals.aOriginal data taken from Matthews and Owen (2010).bNumber of samples included (each sample with n=25 impacts).cNumber of samples included/selected (each sample with n=25 impacts; cf. text).dFor sites A and B only for the ‘combined’ values.eData for combined sites (cf. Matthews and Owen, 2010).
Table III. Comparison of differences betweenQ- and R-values accordingto paired sampling and resampling approaches (cf. Tables I and II).
Locality
Δ Q-/R-valuesresamplingapproach
Δ Q-/R-valuespaired
samplingapproach Difference
A - Leirbreenoutside
9.95a 9.21 0.74
(9.65–10.12) (8.36–10.06)B – Bøverbreenoutside
10.38 8.98 2.40
(9.19–10.38) (7.70–10.25)C – Leirdalenouter valley
11.86 8.67 3.21
(11.86–14.38) (8.58–8.76)D – Leirbreeninside
9.74 7.81 1.97
(9.06–10.06) (7.63–7.99)E – Storbreeninside
10.90 8.35 2.55
(10.90–11.32) (8.33–8.36)Test anvil 8.54Tarmac 4.55
(3.69–5.40)
aValue for the site-specific selection ofQ-value samples with the loweststandard error of the mean (SEM) (cf. Table II and text).
S. WINKLER AND J. A. MATTHEWS
anvil (8.55). A supposed explanation for this offset may be a slightdifference in the initial calibration of the mechanical Schmidt-hammer used in this study and that used byMatthews and Owen(2010) or, alternatively, an operational bias or differences in rockmoisture during sampling (see Discussion section). The consis-tent nature of the difference allows nevertheless the calculationof individual retrospective conversion formulas for the inclusion/exclusion of locality C (see Figure 5).
Copyright © 2014 John Wiley & Sons, Ltd.
Discussion
In their study focussed on a comparison of general applicabilityof mechanical and electronic Schmidt hammers (and addition-ally two Equotip devices) Viles et al. (2011) used an olderversion of the SilverSchmidt still yielding R-values. Unlike ourstudy, they did not compare Q-values with R-values. Theirreported strong positive correlation of R-values from bothinstruments is, however, in good agreement with our results.Viles et al. (2011) corrected their R-values for the mechanicalSchmidt hammer for impact direction following Basu andAydin (2004) prior to their comparison, a procedure impracticalwith our type of application. But as the bedrock surfaces at alllocalities tested were almost horizontal, the mechanicalSchmidt hammer could be held nearly vertical with all impactsand any effect on the data should, therefore, be negligible. Allmeans and standard deviations for Q-values were calculatedusing the same software as with all calculations of R-valuesparameters and not the instrument’s own software to avoidany potential bias.
Viles et al. (2011) state that the SilverSchmidt tends to givemore variable datasets than the mechanical instrument. Thisagrees with our findings that the Q-value means in generallyyield slightly higher confidence intervals with few exceptions(one site at the young locality E and the test anvil) and seemsto be at least partially related to the way the SilverSchmidt mea-sures Q-values. Viles et al. (2011) suggest that their result mightbe influenced artificially by an instrumental difference as theyused an N-type mechanical Schmidt hammer and an L-typeSilverSchmidt, which had a three-time lower plunger impactenergy. However, an artefact of operator handling of theSilverSchmidt also cannot be excluded. Unlike the mechanicalSchmidt hammer where the operator needs to read the scale af-ter each impact, with the SilverSchmidt there is no need tocheck individual readings as the instruments automaticallystops recording when the pre-programmed sample size isreached and the operator needs to accept the sample to starta new one. Apart from those cases were an impact is discarded
Earth Surf. Process. Landforms, (2014)
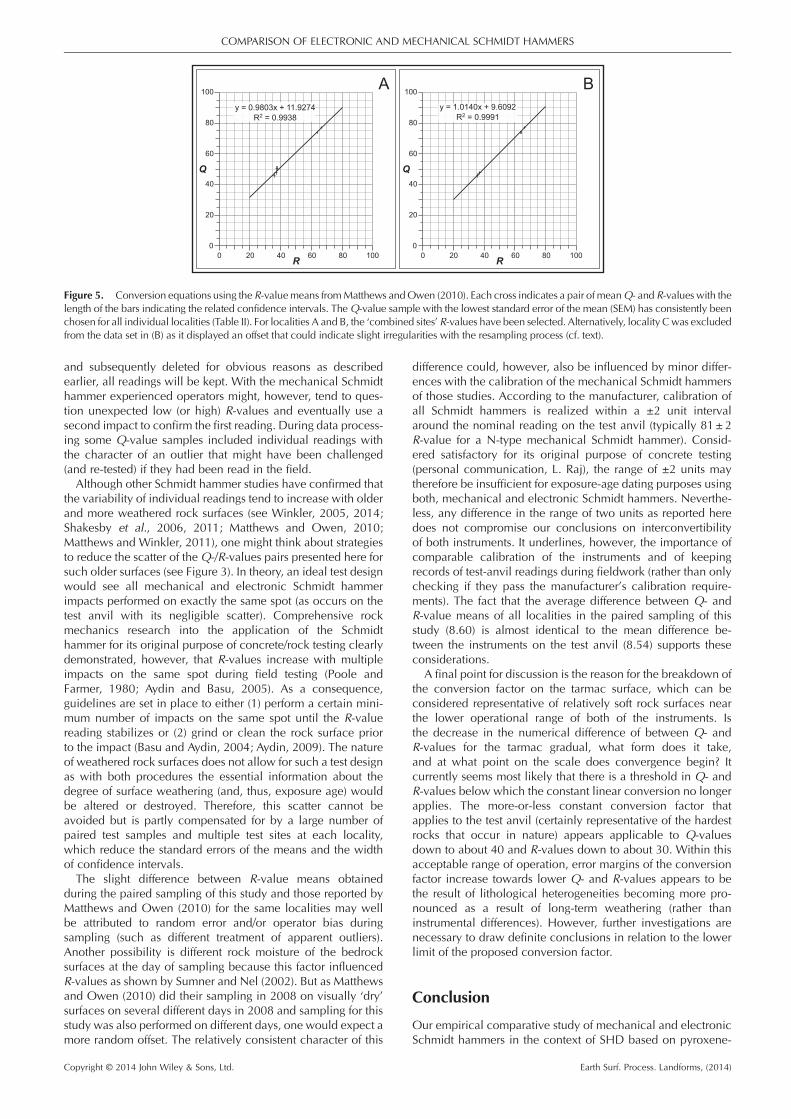
Figure 5. Conversion equations using theR-valuemeans fromMatthews andOwen (2010). Each cross indicates a pair ofmeanQ- and R-values with thelength of the bars indicating the related confidence intervals. TheQ-value sample with the lowest standard error of the mean (SEM) has consistently beenchosen for all individual localities (Table II). For localities A and B, the ‘combined sites’ R-values have been selected. Alternatively, locality Cwas excludedfrom the data set in (B) as it displayed an offset that could indicate slight irregularities with the resampling process (cf. text).
COMPARISON OF ELECTRONIC AND MECHANICAL SCHMIDT HAMMERS
and subsequently deleted for obvious reasons as describedearlier, all readings will be kept. With the mechanical Schmidthammer experienced operators might, however, tend to ques-tion unexpected low (or high) R-values and eventually use asecond impact to confirm the first reading. During data process-ing some Q-value samples included individual readings withthe character of an outlier that might have been challenged(and re-tested) if they had been read in the field.Although other Schmidt hammer studies have confirmed that
the variability of individual readings tend to increase with olderand more weathered rock surfaces (see Winkler, 2005, 2014;Shakesby et al., 2006, 2011; Matthews and Owen, 2010;Matthews and Winkler, 2011), one might think about strategiesto reduce the scatter of theQ-/R-values pairs presented here forsuch older surfaces (see Figure 3). In theory, an ideal test designwould see all mechanical and electronic Schmidt hammerimpacts performed on exactly the same spot (as occurs on thetest anvil with its negligible scatter). Comprehensive rockmechanics research into the application of the Schmidthammer for its original purpose of concrete/rock testing clearlydemonstrated, however, that R-values increase with multipleimpacts on the same spot during field testing (Poole andFarmer, 1980; Aydin and Basu, 2005). As a consequence,guidelines are set in place to either (1) perform a certain mini-mum number of impacts on the same spot until the R-valuereading stabilizes or (2) grind or clean the rock surface priorto the impact (Basu and Aydin, 2004; Aydin, 2009). The natureof weathered rock surfaces does not allow for such a test designas with both procedures the essential information about thedegree of surface weathering (and, thus, exposure age) wouldbe altered or destroyed. Therefore, this scatter cannot beavoided but is partly compensated for by a large number ofpaired test samples and multiple test sites at each locality,which reduce the standard errors of the means and the widthof confidence intervals.The slight difference between R-value means obtained
during the paired sampling of this study and those reported byMatthews and Owen (2010) for the same localities may wellbe attributed to random error and/or operator bias duringsampling (such as different treatment of apparent outliers).Another possibility is different rock moisture of the bedrocksurfaces at the day of sampling because this factor influencedR-values as shown by Sumner and Nel (2002). But as Matthewsand Owen (2010) did their sampling in 2008 on visually ‘dry’surfaces on several different days in 2008 and sampling for thisstudy was also performed on different days, one would expect amore random offset. The relatively consistent character of this
Copyright © 2014 John Wiley & Sons, Ltd.
difference could, however, also be influenced by minor differ-ences with the calibration of the mechanical Schmidt hammersof those studies. According to the manufacturer, calibration ofall Schmidt hammers is realized within a ±2 unit intervalaround the nominal reading on the test anvil (typically 81± 2R-value for a N-type mechanical Schmidt hammer). Consid-ered satisfactory for its original purpose of concrete testing(personal communication, L. Raj), the range of ±2 units maytherefore be insufficient for exposure-age dating purposes usingboth, mechanical and electronic Schmidt hammers. Neverthe-less, any difference in the range of two units as reported heredoes not compromise our conclusions on interconvertibilityof both instruments. It underlines, however, the importance ofcomparable calibration of the instruments and of keepingrecords of test-anvil readings during fieldwork (rather than onlychecking if they pass the manufacturer’s calibration require-ments). The fact that the average difference between Q- andR-value means of all localities in the paired sampling of thisstudy (8.60) is almost identical to the mean difference be-tween the instruments on the test anvil (8.54) supports theseconsiderations.
A final point for discussion is the reason for the breakdown ofthe conversion factor on the tarmac surface, which can beconsidered representative of relatively soft rock surfaces nearthe lower operational range of both of the instruments. Isthe decrease in the numerical difference of between Q- andR-values for the tarmac gradual, what form does it take,and at what point on the scale does convergence begin? Itcurrently seems most likely that there is a threshold in Q- andR-values below which the constant linear conversion no longerapplies. The more-or-less constant conversion factor thatapplies to the test anvil (certainly representative of the hardestrocks that occur in nature) appears applicable to Q-valuesdown to about 40 and R-values down to about 30. Within thisacceptable range of operation, error margins of the conversionfactor increase towards lower Q- and R-values appears to bethe result of lithological heterogeneities becoming more pro-nounced as a result of long-term weathering (rather thaninstrumental differences). However, further investigations arenecessary to draw definite conclusions in relation to the lowerlimit of the proposed conversion factor.
Conclusion
Our empirical comparative study of mechanical and electronicSchmidt hammers in the context of SHD based on pyroxene-
Earth Surf. Process. Landforms, (2014)

S. WINKLER AND J. A. MATTHEWS
granulite rock surfaces in Jotunheimen, southern Norway, hasshown that the application of the electronic SilverSchmidt withextensive sampling under field conditions is unproblematic.Subsequent data processing was considerably less time-consuming and more efficient than with the mechanicalSchmidt hammer. The Q-values from the SilverSchmidt andthe R-values from the conventional mechanical N-typeSchmidt hammer are closely related. However, Q-values aresystematically higher than R-values by 7.70 to 10.25 units overmost of the operational range of both instruments. Linearconversion equations indicate a conversion factor between+9.6 to +10.1 units is applicable when converting R-values toQ-values. These estimates agree well with data obtained onthe standard test anvil, which yield Q-values that are, onaverage, 8.54 units higher than R-values. These numericalrelationships are likely to break down only on very soft litholo-gies with Q-values of below 40 and R-values of below 30,respectively. The younger the surface, the more precise theconversion is due to tighter standard errors. Given the intercon-vertibility of the two instruments, the SilverSchmidt is regardedas an efficient complement and potential replacement for themechanical Schmidt hammer. This enables, moreover, continu-ity in the use of existing R-value data. However, when compar-ing data sets of different age, adjustments may be necessary fordifferent instrumental calibration values. Further testing of theseconclusions in relation to different rock types, bedrock versusboulder surfaces and environmental conditions is advisable.Future research should also address the uncertainties regardingthe shape of the conversion curve towards the lower end of theoperational range of the instruments.
Acknowledgements—The authors thank Andreas Kellerer-Pirklbauer,Paul Sumner and the editors of this journal for their valuable commentson the manuscript. This paper is Jotunheimen Research Expeditions,Contribution No. 189.
ReferencesAa RA, Sjåstad J, Sønstegaard E, Blikra LH. 2007. Chronology of Holo-cene rock-avalanche deposits based on Schmidt hammer relativedating and dust stratigraphy in nearby bog deposits, Vora, innerNordfjord, Norway. The Holocene 17: 955–964.
Aune B. 1993. Temperaturnormaler normalperiode 1961–1990, DNMIRapport 02/93 Klima. DNMI: Oslo.
Aydin A. 2009. ISRM Suggested method for determination of theSchmidt hammer rebound hardness: revised version. InternationalJournal of Rock Mechanics and Mining Sciences 46: 627–634.
Aydin A, Basu A. 2005. The Schmidt hammer in rock material charac-terization. Engineering Geology 81: 1–14.
Basu A, Aydin A. 2004. A method for normalization of Schmidt hammerrebound values. International Journal of Rock Mechanics and MiningSciences 41: 1211–1214.
Colman SM, Pierce KL, Birkeland PW. 1987. Suggested terminology forQuaternary dating methods. Quaternary Research 28: 314–319.
Dahl SO, Nesje A, Lie Ø, Fjordheim K, Matthews JA. 2002. Timing,equilibrium-line altitudes and climatic implications of two early-Holocene glacier glacier readvances during the Erdalen event atJostedalsbreen, western Norway. The Holocene 12: 17–25.
Day MJ, Goudie AS. 1977. Field assessment of rock hardness using theSchmidt test hammer. British Geomorphological Research GroupTechnical Bulletin 18: 19–29.
Evans DJA, Archer S, Wilson DJH. 1999. A comparison of thelichenometric and Schmidt hammer dating techniques based on datafrom the proglacial areas of some Icelandic glaciers. QuaternaryScience Reviews 18: 13–41.
Førland EJ. 1993. Nedbørnormaler nomalperiode 1961–1990, Rapport39/93 Klima. DNMI: Oslo.
Frauenfelder R, Laustela R, Kääb A. 2005. Relative age-dating of Alpinerock glaciers. Zeitschrift für Geomorphologie N.F. 49: 145–166.
Copyright © 2014 John Wiley & Sons, Ltd.
Goudie AS. 2006. The Schmidt Hammer in geomorphologicalresearch. Progress in Physical Geography 30: 703–718.
Kellerer-Pirklbauer A, Wangensteen B, Farbrot H, Etzelmüller B. 2008.Relative surface age-dating of rock glacier systems near Hólar inHjaltadalur, northern Iceland. Journal of Quaternary Science 23:137–151.
Lehmann G. 2002. Statistik. Spektrum: Heidelberg.Lutro O, Tveten E. 1996. Årdal – berggrunnsgeologiske kart M1:250.000. Norges Geologiske Undersøkelse: Trondheim.
Matthews JA, Dresser PQ. 2008. Holocene glacier variation chronologyof the Smørstabbtindan massif, Jotunheimen, southern Norway, andthe recognition of century- to millennial-scale European Neoglacialevents. The Holocene 18: 181–201.
Matthews JA, McEwen LJ. 2013. High-precision Schmidt-hammerexposure-age dating of flood berms, Vetlestølsdalen, Alpine southernNorway: first application and some methodological issues.Geografiska Annaler A 95: 185–195.
Matthews JA, Owen G. 2010. Schmidt-hammer exposure-age dating:developing linear age-calibration curves using Holocene bedrocksurfaces from the Jotunheimen-Jostedalsbreen region of southernNorway. Boreas 39: 105–115.
Matthews JA, Shakesby RA. 1984. The status of the ‘LIttle Ice Age’ insouthern Norway: relative-age dating of Neoglacial moraines withSchmidt hammer and lichenometry. Boreas 13: 333–346.
Matthews JA, Winkler S. 2011. Schmidt-hammer exposure-age dating(SHD): application to early Holocene moraines and a reappraisal ofthe reliability of terrestrial cosmogenic-nuclide dating (TCND) atAustanbotnbreen, Jotunheimen, Norway. Boreas 40: 256–270.
Matthews JA, Shakesby RA, Owen G, Vater AE. 2011. Pronival rampartformation in relation to snow-avalanche activity and Schmidt-hammer exposure-age dating (SHD): three case studies from southernNorway. Geomorphology 130: 280–288.
Matthews JA, Nesje A, Linge H. 2013. Relict talus-foot rock glaciers atØyberget, Upper Ottadalen, southern Norway: Schmidt-hammerexposure-ages and palaeoenvironmental implications. Permafrostand Periglacial Processes 24: 336–346. DOI. 10.1002/ppp.1794
McCarroll D. 1994. The Schmidt Hammer as a measure of degree ofrock surface weathering and terrain age. In Dating in Exposed andSurface Contexts, Beck C (ed.). University of New Mexico Press:Albuquerque; 29–45.
Nesje A, Blikra LH, Anda E. 1994. Dating rockfall-avalanche depositsfrom the degree of rock-surface weathering by Schmidt hammer testsa study from Norangsdalen, Sunnmøre, Norway. Norsk GeologiskTidsskrift 74: 108–113.
Owen G, Matthews JA, Albert PG. 2007. Rates of Holocene chemicalweathering, ‘Little Ice Age’ glacial erosion and implications forSchmidt-hammer dating at a glacier-foreland boundary, Fåbergstølsbreen,southern Norway. The Holocene 17: 829–834.
Poole RW, Farmer IW. 1980. Consistency and repeatability of Schmidthammer rebound data during field testing. International Journal ofRock Mechanics, Mining Sciences and Geomechanical Abstracts17: 167–171.
Proceq. 2004. Operating Instructions Betonprüfhammer N/NR- L/LR.Proceq SA: Schwerzenbach.
Proceq. 2007. Operation Instructions Concrete Test Hammer SilverSchmidt. Proceq SA: Schwerzenbach.
Proceq. 2012. Operating Instructions SilverSchmidt & Hammerlink.Proceq SA: Schwerzenbach.
Rode M, Kellerer-Pirklbauer A. 2011. Schmidt-hammer exposure-age dating (SHD) of rock glaciers in the Schöderkogel-Eisenhutarea, Schladminger Tauern Range, Austria. The Holocene 22:761–771.
Sachs L. 1999. Angewandte Statistik, 9th edition. Springer: Berlin.Shakesby RA, Matthews JA, Owen G. 2006. The Schmidt hammer as arelative-age dating tool and its potential for calibrated-age dating inHolocene glaciated environments. Quaternary Science Reviews 25:2846–2867.
Shakesby RA, Matthews JA, Karlén W, Los S. 2011. The Schmidt ham-mer as a Holocene calibrated-age dating technique: testing the formof the R-value-age relationship and defining the predicted-age errors.The Holocene 21: 615–628.
Smith RJ. 2009. Use and misuse of the reduced major axis for line-fitting. American Journal of Physical Anthropology 149: 476–486.
Earth Surf. Process. Landforms, (2014)
COMPARISON OF ELECTRONIC AND MECHANICAL SCHMIDT HAMMERS
Stahl T, Winkler S, Quigley M, Bebbington M, Duffy B, Duke D. 2013.Schmidt-hammer exposure-age dating (SHD) of late Quaternaryfluvial terraces in New Zealand. Earth Surface Processes and Land-forms 38: 1838–1850.
Sumner P, Nel W. 2002. The effect of rock moisture on Schmidthammer rebound: tests on rock samples from Marion islandand South Africa. Earth Surface processes and Landforms 27:1137–1142.
Viles H, Goudie A, Grab S, Lalley J. 2011. The use of the SchmidtHammer and Equotip for rock hardness assessment in geomorphology
Copyright © 2014 John Wiley & Sons, Ltd.
and heritage science: a comparative analysis. Earth Surface Processesand Landforms 36: 320–333.
Winkler S. 2005. The ‘Schmidt hammer’ as a relative-age dating tech-nique potential and limitations of its application on Holocenemoraines in Mt Cook National Park, Southern Alps, New Zealand.New Zealand Journal of Geology and Geophysics 48: 105–116.
Winkler S. 2014. Investigation of late-Holocene moraines in the west-ern Southern Alps, New Zealand, applying Schmidt-hammerexposure-age dating. The Holocene 24: 48–66. DOI. 10.1177/0959683613512169.
Earth Surf. Process. Landforms, (2014)