comparison of edna and conventional waters -...
TRANSCRIPT

Comparison of eDNA and conventional techniques for monitoring species diversity of boulder reefs in Danish waters Research note from DCE - Danish Centre for Environment and Energy Date 17 November 2016 Peter A. Stæhr1, Susana Santos2, Lars H. Hansen2, Steffen Lundsteen1, Lumi Haraguchi1, Karsten Dahl1, Marcelo P. Ávila1,3 & Anne Winding2 1 Aarhus University, Department of Bioscience 2 Aarhus University, Department of Environmental Sciences 3Departamento de Biologia Geral, Instituto de Ciências Biológicas, Universidade Federal de Minas Gerais, Belo Horizonte, Brazil No of pages: 22 Referee: Niels Bohse Hendriksen, Department of Environmental Sciences Quality assurance, DCE: Susanne Boutrup
Tel.: +45 8715 0000 E-mail: [email protected] http://dce.au.dk
DCE – DANISH CENTRE FOR ENVIRONMENT AND ENERGY
AARHUS UNIVERSITY AU

2
Contents
Summary 3 Introduction 3 Methodology and materials 4 Results 7 Discussion 9 Litterature 11 Supplementary material 14

3
Summary This research note provides a first attempt to monitor species diversity around marine boulder reefs in Danish waters using a combination of environmental DNA (eDNA) and conventional sampling techniques. Composition and abun-dance of benthic flora and fauna was monitored along a transect boulder reef in Smålandsfarvandet using divers. Water samples were furthermore col-lected for microscopic identification of planktonic organisms and for the ex-traction of DNA. Sampling was done towards the current at 6 stations. The investigating was designed to test if biological material containing DNA from the reef, significantly contributed to the integrated pool of DNA extracted from the water column above. Profiles of temperature, salinity and oxygen showed that sampling over the reef was done in oxygen rich, well mixed wa-ter column at all stations, with a clear horizontal gradient confirming changes in water masses related to increasing dominance of water from the Eastern Baltic Sea. We compared community data derived from the benthic reef sur-vey, with that of the microscopic planktonic survey and the list of operational taxonomic units (OTU) derived from eDNA. eDNA sampling identified a much higher taxonomic richness (~300) compared to benthic reef survey (~45) and microscopic (~75) methods, a higher diversity, but less evenly distributed taxonomic composition. Dissimilarity analysis showed a gradient in sampling stations going up current for the diver based reef sampling, whereas the eDNA and microscopic techniques suggested communities of a more random distribution along the transect. Changes in taxa richness, diversity and even-ness along the transect were nevertheless comparable between the benthic reef survey and eDNA technique, despite a large influence of planktonic DNA. Our study suggests that eDNA techniques can provide valuable addi-tional information to conventional diversity monitoring of boulder reefs in Danish waters given careful consideration of sampling and data processing.
Introduction Boulder reefs in Danish waters are worldwide unique and characterized by ecologically distinct underwater structures, acknowledged to be hot spots of biodiversity with the potential to improve habitat conditions and provide ref-uge for benthic organisms and fish communities. Danish boulder reefs are ac-cordingly classified as rare and biologically important habitat protected by the EC Habitats Directive.
Monitoring of the flora and fauna associated with these reefs has been per-formed during more than 25 years to understand responses in species compo-sition, coverage and diversity in relation to changes in environmental condi-tions (Dahl et al. 2001; Dahl and Carstensen 2008). Reef monitoring is conven-tionally made by divers equipped with underwater video and radio commu-nication following technical guidelines (Krause-Jensen et al. 2004; Lundsteen and Dahl 2004).
Metabarcoding of environmental DNA (eDNA) obtained directly from sea-water samples has the potential to be an efficient, non-invasive and easy-to-standardize sampling approach with great potential as a monitoring tool for aquatic wildlife, although further studies are needed to validate the eDNA approach in varying environmental conditions (Thomsen et al. 2012a, 2012b). The fast development within the area of DNA sequencing techniques com-bined with the reduction in prices of sequencing analysis have strengthened the interest in wide-spread use of techniques based on eDNA for monitoring

4
and research applications. The Danish monitoring program of water and na-ture (NOVANA) is currently under revision and the development of up-to-date techniques that are less expensive and/or provide more detailed infor-mation on plants, animals and microorganisms in the environment are needed.
This note is a contribution to a recently started eDNA center at AU-DCE, which investigates the potentials and feasibility of eDNA techniques for envi-ronmental monitoring, tracking and identification of specific organisms in the environment. As such, the objective of the eDNA center is to perform prepar-atory investigations facilitating the incorporation of eDNA techniques in en-vironmental monitoring.
This study is a first attempt to investigate the potential use of eDNA metabar-coding for supplementing conventional NOVANA monitoring of biodiversity of marine boulder reefs. We applied a sampling design which made it possible to compare and evaluate the influence of both benthic and pelagic habitats to the integrated pool of DNA investigated with molecular sequencing tech-niques.
Methodology and materials Field sampling A marine boulder reef in Smålandsfarvandet named Kirkegrund reef, was sampled during a regular reef survey in August 2015. A transect of six sites were defined along the reef. Stations were placed against the flow direction (Fig. 1). At each station, the ship anchored up and a diver was sent down to collect two liters of water with a sterilized 2 L Bluecap bottle. At stations out-side the reef, water was collected at 8 meters depth. At the reef, samples were collected 1 meter above the reef surface. The sampling assumed a uniform distribution of DNA released from either benthic or pelagic organisms (Fig. 2). The diver observations of composition and abundance of benthic flora and fauna was communicated directly to a taxonomic expert on the ship following and discussing observations via live video transmission. Samples of benthic organisms were taken by the diver to the ship and preserved for later taxo-nomic investigations in the laboratory. Field sampling was conducted over 4 hours during midday.
At each station a vertical profile of water temperature, salinity and oxygen saturation was measured with a YSI 6600 V2 multisonde measuring each var-iable from the surface to the bottom with 1 m increments. Water clarity (Secchi depth) was measured at station 1 and 2.
For planktonic identification aliquots of 200 mL were preserved with acidified Lugol’s solution (2% final concentration) in amber glass bottles. Bottles were then stored in the dark at 4˚C until analysis with an inverted microscope (Utermöhl 1958). For eDNA analysis, between 650 and 720 mL of seawater were passed onto a 0.22 µm Sterivex filter cartridge (Millipore), and stored at -20°C. Information on water sampling is provided in Table 1.

5
Figure 1. Position of samples
sites at the marine reef,
Kirkegrund in Smålands-
farvandet, Denmark. Benthic sur-
vey and sampling were made at
stations 2 to 5. Water samples
and physical profiles were taken
at all 6 stations (see Fig. 2).
Figure 2. Conceptual figure of conditions at the sampling stations at Kirkegrund reef. DNA material collected by the diver is as-
sumed to integrate material from benthic and pelagic organisms. Reef survey with divers, were only made over the reef (stations
2 to 5).
6
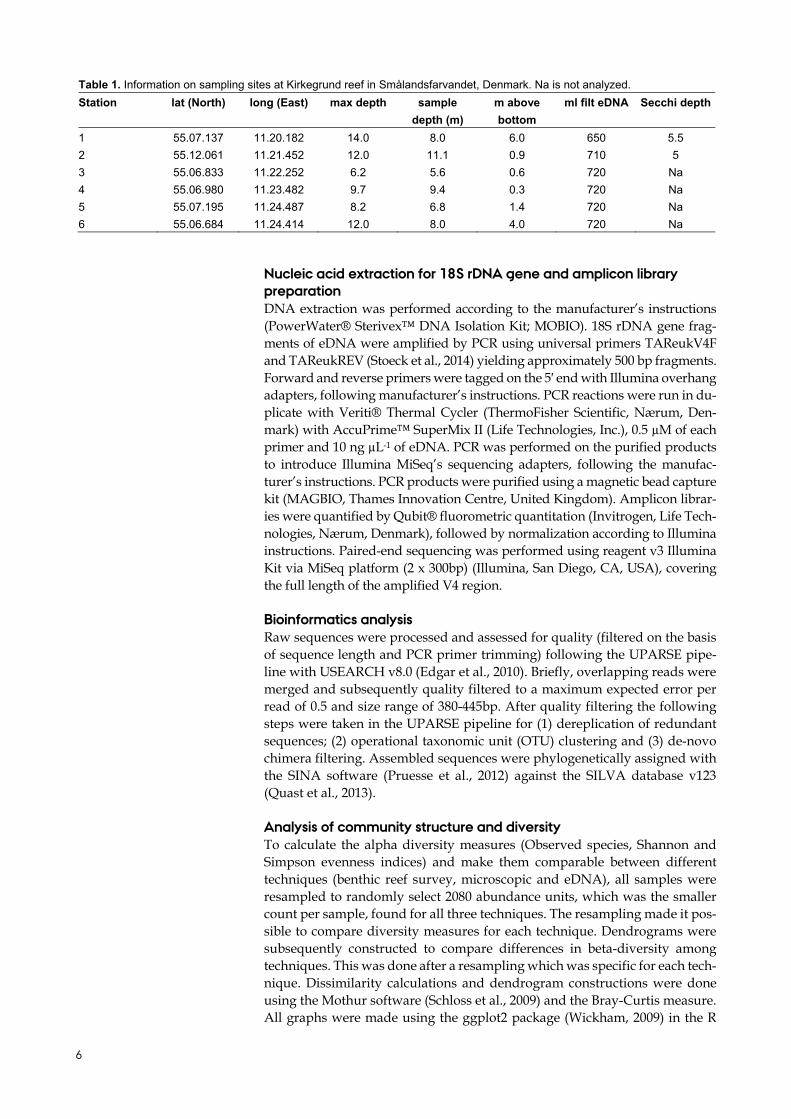
Nucleic acid extraction for 18S rDNA gene and amplicon library preparation DNA extraction was performed according to the manufacturer’s instructions (PowerWater® Sterivex™ DNA Isolation Kit; MOBIO). 18S rDNA gene frag-ments of eDNA were amplified by PCR using universal primers TAReukV4F and TAReukREV (Stoeck et al., 2014) yielding approximately 500 bp fragments. Forward and reverse primers were tagged on the 5′ end with Illumina overhang adapters, following manufacturer’s instructions. PCR reactions were run in du-plicate with Veriti® Thermal Cycler (ThermoFisher Scientific, Nærum, Den-mark) with AccuPrime™ SuperMix II (Life Technologies, Inc.), 0.5 µM of each primer and 10 ng µL-1 of eDNA. PCR was performed on the purified products to introduce Illumina MiSeq’s sequencing adapters, following the manufac-turer’s instructions. PCR products were purified using a magnetic bead capture kit (MAGBIO, Thames Innovation Centre, United Kingdom). Amplicon librar-ies were quantified by Qubit® fluorometric quantitation (Invitrogen, Life Tech-nologies, Nærum, Denmark), followed by normalization according to Illumina instructions. Paired-end sequencing was performed using reagent v3 Illumina Kit via MiSeq platform (2 x 300bp) (Illumina, San Diego, CA, USA), covering the full length of the amplified V4 region.
Bioinformatics analysis Raw sequences were processed and assessed for quality (filtered on the basis of sequence length and PCR primer trimming) following the UPARSE pipe-line with USEARCH v8.0 (Edgar et al., 2010). Briefly, overlapping reads were merged and subsequently quality filtered to a maximum expected error per read of 0.5 and size range of 380-445bp. After quality filtering the following steps were taken in the UPARSE pipeline for (1) dereplication of redundant sequences; (2) operational taxonomic unit (OTU) clustering and (3) de-novo chimera filtering. Assembled sequences were phylogenetically assigned with the SINA software (Pruesse et al., 2012) against the SILVA database v123 (Quast et al., 2013).
Analysis of community structure and diversity To calculate the alpha diversity measures (Observed species, Shannon and Simpson evenness indices) and make them comparable between different techniques (benthic reef survey, microscopic and eDNA), all samples were resampled to randomly select 2080 abundance units, which was the smaller count per sample, found for all three techniques. The resampling made it pos-sible to compare diversity measures for each technique. Dendrograms were subsequently constructed to compare differences in beta-diversity among techniques. This was done after a resampling which was specific for each tech-nique. Dissimilarity calculations and dendrogram constructions were done using the Mothur software (Schloss et al., 2009) and the Bray-Curtis measure. All graphs were made using the ggplot2 package (Wickham, 2009) in the R
Table 1. Information on sampling sites at Kirkegrund reef in Smålandsfarvandet, Denmark. Na is not analyzed.
Station lat (North) long (East) max depth sample
depth (m)
m above
bottom
ml filt eDNA Secchi depth
1 55.07.137 11.20.182 14.0 8.0 6.0 650 5.5
2 55.12.061 11.21.452 12.0 11.1 0.9 710 5
3 55.06.833 11.22.252 6.2 5.6 0.6 720 Na
4 55.06.980 11.23.482 9.7 9.4 0.3 720 Na
5 55.07.195 11.24.487 8.2 6.8 1.4 720 Na
6 55.06.684 11.24.414 12.0 8.0 4.0 720 Na

7
environment (R Development Core Team, 2011) and customized with the Adobe Illustrator software. The taxonomic affiliation was illustrated with bar plots showing the relative frequency of taxa in each sample. In order to reduce the graphic's visual noise, only taxonomic levels accounting for at least 1% of mean relative frequency were displayed.
Results Physical conditions Measurements of temperature, salinity and oxygen for every meter, showed that during the sampling period of 4 hours, water temperatures were slightly higher in the water masses lying over the reef. These waters were also charac-terized by lower salinity, indicating the influence of Baltic freshwater sources further up current. Gradients in water density were however not very strong as oxygen measurements clearly showed that the water column was well mixed (Fig. 3).
Species number, diversity and evenness The alpha diversity indices based on the three techniques of benthic reef sur-vey, microscopic and eDNA were calculated (Fig. 4). The eDNA technique identified a much larger species (OTU) richness (270 to 350) compared to mi-croscopic (68 to 76) and reef (38 to 49) methods. The larger species richness was also associated with a higher Shannon diversity, with less evenly distrib-uted species composition suggesting that the eDNA technique was sensitive to very rare species occurring in low abundance. A somewhat similar pattern
Figure 3. Contour plots of water
temperature, salinity and oxygen
saturation along the investigated
transect. Blue shaded area out-
lines the approximate extent of
the boulder reef. Water samples
(white squares) and vertical pro-
files were taken during 4 hours
going up current from station 1 to
6.

8
of increasing “species” richness, evenness and Shannon diversity with in-creasing distance up current (from st. 1 to st. 6) was observed for both the eDNA and the reef survey technique, whereas no clear patterns emerged for planktonic organisms identified using the microscopic method (Fig. 4). It should be noted that the reef survey was only conducted at the reef (stations 2 to 5, see Fig. 2).
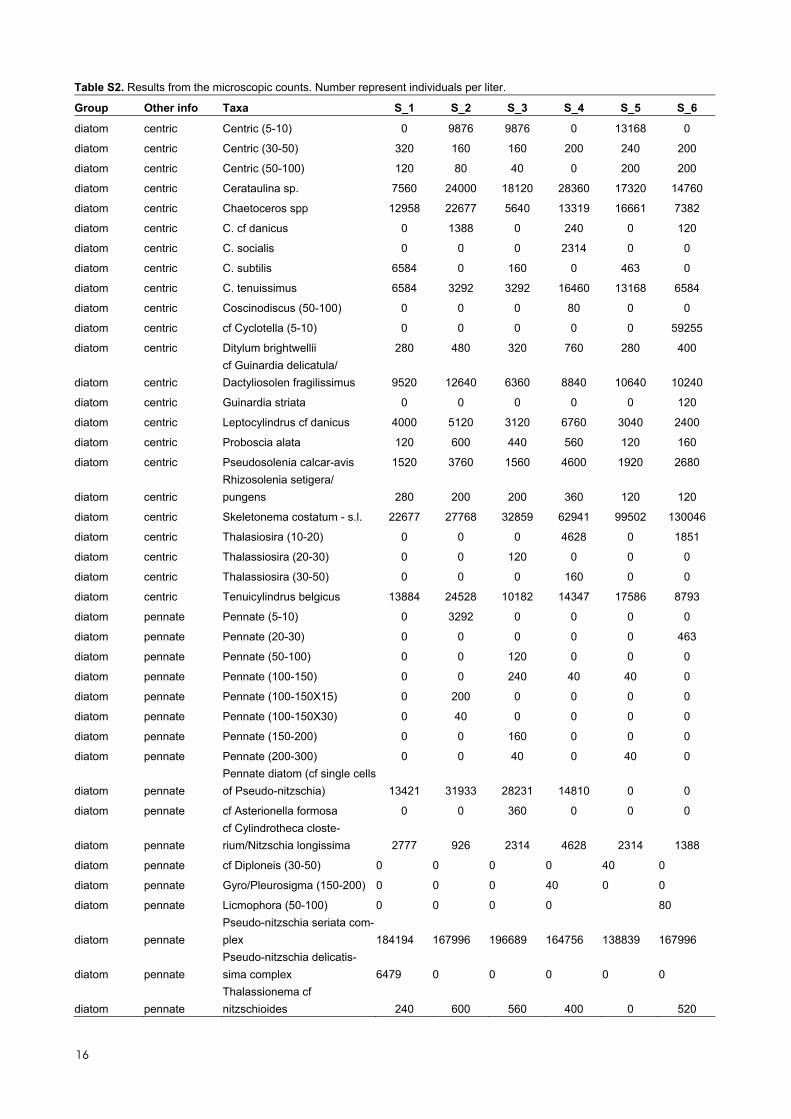
Community structure Dissimilarity or similarity of “species”/OTU community structure between sampling stations are shown as dendrograms and the associated relative con-tribution of major taxonomic groups (Fig. 5). According to the benthic reef survey dendrogram we observed a somewhat gradual change in beta diver-sity along the transect with stations becoming more dissimilar with increasing distance up current (from station 2 to station 5). In comparison, the composi-tion of the planktonic communities appeared to be more random across the transect. For the eDNA survey, station 1 had a high relative contribution of ctenophore OTUs causing this to be notably dissimilar from the remaining stations. For these (station 2 to 6) the main differences were related to a shift in the balance between a group of unclassified aveolata and crustacea. Simi-larly for the benthic reef survey, the red macroalgae (rhodophyta) was respon-sible for most of the changes in beta diversity. Although there appeared to be a clear gradient in dissimilarity along the transect, changes in reef taxonomic groups varied substantially between individual stations, especially bivalves, ascidians and fish (pisces). For the planktonic communities identified with the microscopic technique, differences in beta diversity were mostly related to composition and abundance of flagellates and diatoms (Fig. 5). Further de-tailed information on “species”/OTU composition and abundance identified with the three survey techniques are provided in the supplementary tables S1, S2 and S3.
Figure 4. Comparison of alpha diversity (Shannon diversity and Simpsons evenness) indices and identified number of “species”
or operational taxonomic units (OUT) with the eDNA, microscopic and benthic reef survey technique.
(OTU)

9
Discussion We applied a sampling design which was intended to enable an evaluation of the contribution of both benthic (mostly reef survey) and pelagic (mostly plank-tonic) habitats to the list of OTUs tentatively representing species obtained with the eDNA technique. Profiles of temperature, salinity and oxygen showed that sampling over the reef was at all 6 stations done in an oxygen rich water col-umn. Despite horizontal differences in water temperature and salinity, related to the gradually increasing influence of water from the Eastern Baltic Sea, the sampling depth at all 6 stations represented a well-mixed water column. The only exception from this was station 6, where sampling below the halocline likely caused this sample to represent DNA deriving from benthic habitats ra-ther than a well-mixed water column with DNA material from both benthic and pelagic habitats. When analyzing the taxonomic composition with the eDNA technique, station 6 differed with a higher abundance of crustaceans which could be related to benthic infauna. However, the taxonomic information pro-vided by the eDNA technique was not sufficiently detailed to distinguish the origin of the contributing species. Proper sampling of water for eDNA analysis
Figure 5. Comparison of beta diversity measured as the degree of dissimilarity, shown as dendrograms for each survey tech-
nique. The relative abundance of major taxonomic groups or OTUs contributing to the dendrograms is also shown. The arrow in
the center indicates that the sampled eDNA is expected to integrate biological material from both benthic (reef) and pelagic (mi-
croscopic) habitats.

10
is highlighted in a draft national guideline for eDNA aiming to get representa-tive data on distribution of non-indigenous species in Danish waters (Andersen et al. 2016). While this may seem trivial, the complex hydrodynamics of the Danish marine waters stresses the importance of careful investigation and re-porting of water column conditions occurring during sampling. Otherwise, it can be very challenging to relate the eDNA findings to the habitat where the obtained DNA originated from. Based on this simple investigation, it seems preferable to collect water samples from multiple depths and then consider to pool the data. In this case we were mostly interested in the influence of the reef, and therefore choose to sample close to the reef.
After adjusting for differences in the sampling effort, the eDNA sampling sug-gested a much higher species richness (~300) compared to benthic reef survey (~45) and microscopic (~75) methods, a higher diversity, but a less evenly dis-tributed species composition. This underlines the high sensitivity of the eDNA technique, capable of detecting abundant as well as rare species. For eDNA species richness was inferred from number of OTU’s which makes it difficult to compare directly with the conventional methods, as the taxonomic resolution related to OTU’s are not always at the species level. Future com-parisons of species richness will be performed on species lists derived from OTU’s according to Olds et al. (2016) which accounts for unobserved species the sampling effort. Similarity analysis visualized with a dendrogram showed a gradient in the beta diversity of sampling stations going up current for the benthic reef survey, whereas the eDNA and planktonic communities were more randomly distributed. According to eDNA the biggest difference was found for station 1 which was sampled outside the reef, in what appeared to be a quite different water body dominated by planktonic species within the group of ctenophora. Considering changes in species richness, diversity and evenness along the transect these were somewhat comparable between the benthic reef survey and the eDNA technique. For both techniques we found increasing trends towards station 6, suggesting either a direct influence from benthic organisms, or indirect changes in eDNA detected species, related to changes in the water column conditions associated with the reef structure and the direction of the current.
Differences in community composition could be roughly related to changes in major taxonomic groups when comparing results within each technique. Direct comparison among techniques of the taxonomic groups driving the changes in community composition, and alpha and beta diversity were how-ever not possible given the taxonomic groups distinguished in this analysis. A first step towards this would be to filter out the planktonic organisms iden-tified with the eDNA technique, and compare these directly with those iden-tified with the microscopic method. The remaining group can then be as-sumed to represent the sessile flora and fauna as well as the mobile epifauna (including fish) associates with the reef. Such filtering of the eDNA data should make it possible to better evaluate the contribution of the benthic reef habitat to the species composition and diversity identified with the eDNA technique. Sampling at multiple depths in different water masses would also help distinguish the origin of the eDNA.
The discovery that macroorganisms can be detected from their environmental DNA (eDNA) in aquatic systems has been suggested to have immense potential for the monitoring of biological diversity (Goldberg et al. 2015). While this view has gained popularity, others argue that eDNA has been presented over opti-mistically as a convenient techno-fix to zoological surveys and monitoring

11
(Iversen et al. 2015). In particular aquatic organisms have received much atten-tion due to higher homogeneity of aquatic environments compared to terrestrial environments. Evidence suggests that eDNA measurements, besides presence, correlate with total biomass (Takahara et al., 2012) rather than density (number of individuals). In a recent experimental study by Klymus et al. (2015a) the im-portance of temperature on feeding, and biomass of two species of carp and relations to excretion of eDNA was investigated in aquaria. While this experi-ment initially concluded a robust quantitative estimate of fish density using eDNA, critique of these results came to the opposite conclusion, cautioning against the application of eDNA as a means of quantitative data in conservation and nature management (Iversen et al. 2015). Further investigations of the en-vironmental conditions regulating the concentration of eDNA in natural waters and relating these to species composition and density, is obviously needed and a better understanding of the capabilities and limitations of eDNA technology will be necessary to productively apply this technique in the field for monitor-ing (Klymus et al. 2015b).
It is important to highlight that with the Utermöhl method, commonly used for monitor phytoplankton, not all the species (and even genera) can be properly identified, requiring other methods to supplement the identification (Zingone et al. 2015). Additionally, a comparison between phytoplankton counts per-formed with Utermöhl method and Scanning Flow Cytometry in Danish coastal waters showed that the first is limited to proper account for cells smaller than 5 µm (Haraguchi et al. submitted). Thus, eDNA is also a promising tool to biodi-versity studies of phytoplankton.
In summary, our study provided insights into the applicability of the eDNA technique for monitoring of species composition and diversity of boulder reefs in Danish waters. High DNA concentrations in the water column de-rived from planktonic organisms seems to significantly influence the eDNA derived species list even when sampling directly above a high diversity and high biomass benthic habitat. Careful consideration of water flow and mixing conditions were found necessary when analyzing results. Furthermore, direct comparison of species composition and changes in diversity requires careful filtration of data using comparable databases and normalization of data is re-quired to make the techniques comparable. We will pay attention to these in-sights when analyzing a newly collected data set from the same boulder reef in August 2016.
Litterature Andersen, J.H., Møller, P.R., Kallenbach, E. Hesselsøe, M., Knudsen, S.W., Bekkevold, D., Hansen, B.K. and Thaulow, J.T. (2016). Steps toward nation-wide monitoring of non-indigenous species in Danish marine waters under the Marine Strategy Framework Directive. vol. 7022-2016 DK3, NIVA
Edgar, R.C. (2010). Search and clustering orders of magnitude faster than BLAST. Bioinformatics 26, 2460–2461. doi:10.1093/bioinformatics/btq461
Dahl, K.., Hansen, J., Helmig, S., Nielsen, R., and Larsen, H. S. (2001) Natur-kvalitet på stenrev, hvilke indikatorer kan vi bruge? 352, 5-130. Danmarks Miljøundersøgelser. Faglig rapport fra DMU nr. 352

12
Dahl, K. and Carstensen, J. (2008). Tools to assess conservation status on open water reefs in Nature-2000 areas. National Environmental Research Institute, University of Aarhus. 25 pp. – NERI Technical Report No. 663. http://www.dmu.dk/Pub/FR663.pdf
Goldberg, C.S., Strickler, K.M. and Pilliod, D.S. (2015). Moving environmental DNA methods from concept to practice for monitoring aquatic macroorgan-isms. Biological Conservation 183: 1-3
Haraguchi L., Jakobsen H.H., Lundholm N. and Carstensen J. (submitted) Monitoring natural phytoplankton communities: a comparison between tra-ditional methods and scanning flow cytometry
Iversen, L.L., Kielgast J. and Sand-Jensen, K. (2015). "Monitoring of animal abundance by environmental DNA — An increasingly obscure perspective: A reply to Klymus et al., 2015". Biological conservation (0006-3207), 192, p. 479. DOI: 10.1016/j.biocon.2015.09.024
Klymus, K.E., Richter, C.A., Chapman, D.C. and Paukert, C. (2015a). Quanti-fication of eDNA shedding rates from invasive bighead carp Hypophthal-michthys nobilis and silver carp Hypophthalmichthys molitrix. Biological Conservation 183: 77–84
Klymus, K.E., Richter, C.A., Chapman, D.C. and Paukert, C.(2015b). A reply to Iversen et al.'s comment “Monitoring of animal abundance by environmen-tal DNA — An increasingly obscure perspective”. Biological Conservation 192: 481-482
Krause-Jensen, D., Laursen, J.S., Middelboe, A.L. and Stjernholm, M. (2004). Teknisk anvisning for marin overvågning – 3.1 Bundvegetation m.v. Det ma-rine Fagdatacenter - Tekniske anvisninger for marin overvågning 2004-2010. http://www2.dmu.dk/1_om_dmu/2_tvaer-funk/3_fdc_mar/program-grundlag/TekAnv2004_2009/Del3/TA04_3_1_Bundvegetation.pdf
Lundsteen, S. and Dahl, K. (2004). Teknisk anvisning for marin overvågning – 4.2 hårdbundsfauna. Det marine Fagdatacenter - Tekniske anvisninger for marin overvågning 2004-2010. http://www2.dmu.dk/1_om_dmu/2_tvaer-funk/3_fdc_mar/programgrundlag/Te-kAnv2004_2009/Del4/TA04_4_2_Haardbundsfauna.pdf
Olds, B.P., Jerde, C.L., Renshaw, M.A., Li, Y., Evans, N.T., Turner, C.R., Dei-ner, K., Mahon, A.R., Brueseke, M.A., Shirey, P.D., Pfrender, M.E., Lodge, D. M. and Lamberti, G.A. (2016). Estimating species richness using environmen-tal DNA. Ecol Evol 6: 4214-4226.
Pruesse, E., Peplies, J. and Glöckner, F.O. (2012). SINA: accurate high through-put multiple sequence alignment of ribosomal RNA genes. Bioinformatics, 28, 1823–1829
Quast, C. Pruesse E., Yilmax, P., Gerken, J., Schweer, T., Yarza, P., Peplies, J., and Glöckner, F.O. (2013). The SILVA ribosomal RNA gene database project: im-proved data processing and web-based tools. Nucleic Acids Res., 41, D590–D596

13
R Development Core Team (2011). R: A Language and Environment for Sta-tistical Computing. R Foundation for Statistical Computing, Vienna, Austria. ISBN 3-900051-07-0
Schloss, P.D., Westcott, S.L., Ryabin, T., hall, J.R., hartmann, M., Hollister, E.B., Lesniewski, r.A., Oakley, B.B., Parks, D.H., Robinson, C.J., Sahl, J.W., Stres, B., Thallinger, G.G., Van Horn, D.J. and Weber, C.F. (2009). Introducing mothur: Open-source, platform-independent, community-supported software for de-scribing and comparing microbial communities. Applied and Environmental Microbiology, 75(23), 7537–7541
Stoeck, T., Breiner, H.W., Filker, S., Ostermaier, V., Kammerlander, B. and Sonntag, B. (2014). A morphogenetic survey on ciliate plankton from a mountain lake pinpoints the necessity of lineage-specific barcode markers in microbial ecology. Environ. Microbiol. 16, 430–444
Takahara, T., Minamoto, T., Yamanaka, H., Doi, H. and Kawabata, Z.I., (2012). Estimation of fish biomass using environmental DNA. PLoS One 7, e35868
Thomsen, P.F., Kielgast, J., Iversen, L.L., Møller, P.R. and Rasmussen, M (2012a). Detection of a Diverse Marine Fish Fauna Using Environmental DNA from Seawater Samples. PLoS ONE 7(8): e41732. doi: 10.1371/jour-nal.pone.0041732
Thomsen, P.F., Kielgast, J., Iversen, L.L., Wiuf, C., Rasmussen, M., Gilbert, M. T. P., Orlando, L. and Willerslev, E. (2012b). Monitoring endangered freshwa-ter biodiversity using environmental DNA. Molecular Ecology, 21: 2565–2573. doi:10.1111/j.1365-294X.2011.05418.x.
Utermöhl, H. (1958). Zur vervolkommung der qualitativen Phytoplankton metodik. Mit Int Ver Lim 9: 38
Wickham, H. (2009) ggplot2: elegant graphics for data analysis. Springer New York
Zingone, A., Harrison, P.J., Kraberg, A., Lehtinen, S., McQuatters-Gollop, A., O’Brien, T., Sun, J. and Jakobsen, H.H. (2015) Increasing the quality, compa-rability and accessibility of phytoplankton species composition time-series data. Estuar Coast Shelf Sci 162:151–160

14
Supplementary material
Table S1. Results from the benthic survey. Numbers represent numerical percent cover.
Group Taxa S_2 S_3 S_4 S_5
ASCIDIACEA Dendrodoa grossularia 0.1 0.1
BIVALVIA Mya arenaria 0.1 0.1
Mytilus edulis 0.1 1 0.1 0.1
BRYOZOA Alcyonidium aff. gelatinosum 0.1 0.1 0.1 0.1
Alcyonidium hirsutum 0.1 0.1 0.1
Amphiblestrum auritum 0.1 0.1 0.1
Bowerbankia imbricata 0.1
Crisia sp. 0.1
Electra pilosa 15 1 60 30
Eucratea loricata 1
Membranipora membranacea 1 0.1
Walkeria uva 0.1 0.1 0.1
CHLOROPHYTA Bryopsis hypnoides 0.1 0.1 0.1
Chaetomorpha melagonium 0.1
Cladophora pygmaea 0.1
Cladophora sp. 0.1 0.1
CRUSTACEA Amphibalanus improvisus 0.1 0.1
Carcinus maenas 0.1 0.1 0.1 0.1
ECHINODERMATA Asterias rubens 1 1 0.1 0.1
HYDROZOA Campanulina / Opecularella 0.1 0.1 0.1
Clytia hemisphaerica 0.1
Dynamena pumila 0.1
Gonothyraea hyalina 0.1 0.1
Obelia geniculata 0.1
PHAEOPHYTA Brown crust 80 0.1 0.1
Chorda filum 15 0.1
Ectocarpus siliculosus 40 5 1
Laminaria digitata 5 1
Saccharina latissima 0.1 0.1
Sphacelaria arctica 0.1
Sphacelaria caespitula 0.1
Sphacelaria cirrosa 0.1 0.1 0.1 0.1
PISCES Ctenolabrus rupestris 0.1 0.1 0.1
Gobiusculus flavescens 0.1 0.1
Pomatoschistus minutus 0.1 1 0.1
Symphodus melops 0.1
Thorogobius ephippiatus 0.1 0.1
POLYCHAETA Arenicola marina 0.1
Spirorbinae indet. 0.1 0.1 2 0.1
POLYPLACOPHORA 0.1
Polyplacophora indet. 0.1
PORIFERA Halichondria panicea 0.1 5 2

15
RHODOPHYTA Acrochaetium luxurians 0.1 0.1
Acrochaetium sp. 0.1
Aglaothamnion tenuissimum 0.1 0.1
Ahnfeltia plicata 1 1
Ahnfeltia plicata crust 0.1 0.1
Bonnemaisonia asparagoides 0.1
Brongniartella byssoides 0.1 20 40 50
Callithamnion corymbosum 0.1 2 5
Ceramium cimbricum 0.1
Ceramium tenuicorne 0.1 0.1 0.1 0.1
Ceramium virgatum 0.1 0.1 0.1 2
Chondrus crispus 5 3 1
Coccotylus brodiei 0.1 15 10 20
Colaconema savianum 0.1
Colaconema sp. 0.1 0.1 0.1
Cystoclonium purpureum 1 20 0.1
Delesseria sanguinea 60 20 20
Erythrotrichia carnea 0.1
Furcellaria lumbricalis 15
Hildenbrandia rubra 0.1
Hildenbrandia sp. 0.1
Membranoptera alata 2 2 1
Phycodrys rubens 40 15 10
Phyllophora pseudoceranoides 20 0.1 20 30
Polyides rotundus 1
Polysiphonia denudata 0.1
Polysiphonia elongata 0.1 0.1 1
Polysiphonia fucoides 0.1 0.1 0.1 20
Polysiphonia stricta 0.1 15 2 0.1
Red calcified crust 0.1 10 5 30
Red crust 80 30 10
Rhodomela confervoides 2 0.1 2
Rubrointrusa membranacea 0.1
Spermothamnion repens 0.1 0.1
SCYPHOZOA Scyphistoma stage 0.1 0.1
16
Table S2. Results from the microscopic counts. Number represent individuals per liter.
Group Other info Taxa S_1 S_2 S_3 S_4 S_5 S_6
diatom centric Centric (5-10) 0 9876 9876 0 13168 0
diatom centric Centric (30-50) 320 160 160 200 240 200
diatom centric Centric (50-100) 120 80 40 0 200 200
diatom centric Cerataulina sp. 7560 24000 18120 28360 17320 14760
diatom centric Chaetoceros spp 12958 22677 5640 13319 16661 7382
diatom centric C. cf danicus 0 1388 0 240 0 120
diatom centric C. socialis 0 0 0 2314 0 0
diatom centric C. subtilis 6584 0 160 0 463 0
diatom centric C. tenuissimus 6584 3292 3292 16460 13168 6584
diatom centric Coscinodiscus (50-100) 0 0 0 80 0 0
diatom centric cf Cyclotella (5-10) 0 0 0 0 0 59255
diatom centric Ditylum brightwellii 280 480 320 760 280 400
diatom centric
cf Guinardia delicatula/
Dactyliosolen fragilissimus 9520 12640 6360 8840 10640 10240
diatom centric Guinardia striata 0 0 0 0 0 120
diatom centric Leptocylindrus cf danicus 4000 5120 3120 6760 3040 2400
diatom centric Proboscia alata 120 600 440 560 120 160
diatom centric Pseudosolenia calcar-avis 1520 3760 1560 4600 1920 2680
diatom centric
Rhizosolenia setigera/
pungens 280 200 200 360 120 120
diatom centric Skeletonema costatum - s.l. 22677 27768 32859 62941 99502 130046
diatom centric Thalasiosira (10-20) 0 0 0 4628 0 1851
diatom centric Thalassiosira (20-30) 0 0 120 0 0 0
diatom centric Thalassiosira (30-50) 0 0 0 160 0 0
diatom centric Tenuicylindrus belgicus 13884 24528 10182 14347 17586 8793
diatom pennate Pennate (5-10) 0 3292 0 0 0 0
diatom pennate Pennate (20-30) 0 0 0 0 0 463
diatom pennate Pennate (50-100) 0 0 120 0 0 0
diatom pennate Pennate (100-150) 0 0 240 40 40 0
diatom pennate Pennate (100-150X15) 0 200 0 0 0 0
diatom pennate Pennate (100-150X30) 0 40 0 0 0 0
diatom pennate Pennate (150-200) 0 0 160 0 0 0
diatom pennate Pennate (200-300) 0 0 40 0 40 0
diatom pennate
Pennate diatom (cf single cells
of Pseudo-nitzschia) 13421 31933 28231 14810 0 0
diatom pennate cf Asterionella formosa 0 0 360 0 0 0
diatom pennate
cf Cylindrotheca closte-
rium/Nitzschia longissima 2777 926 2314 4628 2314 1388
diatom pennate cf Diploneis (30-50) 0 0 0 0 40 0
diatom pennate Gyro/Pleurosigma (150-200) 0 0 0 40 0 0
diatom pennate Licmophora (50-100) 0 0 0 0 80
diatom pennate
Pseudo-nitzschia seriata com-
plex 184194 167996 196689 164756 138839 167996
diatom pennate
Pseudo-nitzschia delicatis-
sima complex 6479 0 0 0 0 0
diatom pennate
Thalassionema cf
nitzschioides 240 600 560 400 0 520

17
diatom pennate Thalassionema cf frauenfeldii 160 0 0 320 120 0
dinoflagellate auto/mixotroph
Dinoflagellate (naked or thin
theca) (10-15) 0 0 0 3292 0 0
dinoflagellate auto/mixotroph
Dinoflagellate (naked or thin
theca) (40-60) 0 480 0 0 0 0
dinoflagellate auto/mixotroph Gymnodiniales (5-10) 6584 3292 0 3292 0 0
dinoflagellate auto/mixotroph Gymnodiniales (10-15) 65839 3292 6584 6584 6584 6584
dinoflagellate auto/mixotroph Gymnodiniales (15-20) 16460 0 0 0 0 0
dinoflagellate auto/mixotroph Gymnodiniales (20-30) 6942 926 0 0 463 1851
dinoflagellate auto/mixotroph Gymnodiniales (30-50) 0 0 480 400 0 0
dinoflagellate auto/mixotroph Thecate (5-10) 3292 0 6584 0 0 0
dinoflagellate auto/mixotroph Thecate (10-15) 3292 0 23044 9876 0 19752
dinoflagellate auto/mixotroph Thecate (20-30) 5091 1388 1851 1851 3240 2314
dinoflagellate auto/mixotroph Thecate (30-50) 440 680 440 1280 1080 760
dinoflagellate auto/mixotroph Thecate (50-80) 0 0 0 320 0 0
dinoflagellate auto/mixotroph cf Amylax sp 0 0 0 0 400 160
dinoflagellate auto/mixotroph cf Amphidinium (15-20) 0 0 0 0 3292 0
dinoflagellate auto/mixotroph cf Amphidinium (30) 0 0 0 0 0 80
dinoflagellate auto/mixotroph Dinophysis norvegica 0 0 0 40 0 0
dinoflagellate auto/mixotroph cf Heterocapsa sp. 0 0 0 0 1851 0
dinoflagellate auto/mixotroph cf Heterocapsa rotundata 0 0 3292 6584 0 3292
dinoflagellate auto/mixotroph Micracanthodinium spp. 760 880 520 1480 1160 600
dinoflagellate auto/mixotroph Prorocentrum micans 600 320 240 520 1000 840
dinoflagellate auto/mixotroph Prorocentrum cordatum 8793 926 4628 2314 4628 5554
dinoflagellate auto/mixotroph Scrippsiella spp. 1388 0 0 0 0 926
dinoflagellate auto/mixotroph Tripos fusus 80 160 0 720 80 440
dinoflagellate auto/mixotroph Tripos muelleri 400 80 80 200 200 160
dinoflagellate Hetetotroph Cochlodinium (30-50) 0 0 240 280 0 520
dinoflagellate Hetetotroph Cochlodinium spp. (50-80) 40 200 0 200 80 0
dinoflagellate Hetetotroph cf Gyrodinium (20-30) 0 463 463 1388 1388 2314
dinoflagellate Hetetotroph Gyrodinium (30-50) 0 360 800 760 760 560
dinoflagellate Hetetotroph Gyrodinium (50-80) 520 600 0 600 440 520
dinoflagellate Hetetotroph Protoperidinium (30-50) 0 160 0 0 0 160
dinoflagellate Hetetotroph Protoperidinium (50-80) 0 0 80 400 120 200
dinoflagellate Hetetotroph Protoperidinium bipes 120 400 200 440 280 360
Not classified Flagellates (<5 µm) 1000750 418076 704475 948079 1023794 730811
Not classified Flagellates (5-10) 292983 187641 95466 98758 174473 141553
Not classified Flagellates (10-15) 16460 19752 29627 0 13168 16460
Not classified Flagellates (15-20) 9876 6584 0 0 0 0
Not classified Flagellates (20-30) 926 0 0 463 0 0
Cryptophyta Cryptophyta (2-5) 0 19752 0 0 0 0
Cryptophyta Cryptophyta (5-10) 62547 55963 95466 88882 102050 88882
Cryptophyta Cryptophyta (10-15) 42795 59255 62547 79007 52671 59255
Cryptophyta Cryptophyta (15-20) 23044 23044 6584 0 3292 0
Cryptophyta Cryptophyta (20-25) 0 2314 0 0 0 0
Euglenophyta Eutreptia/Eutreptiella (20-30) 1851 0 463 0 1388 926
Euglenophyta Eutreptia/Eutreptiella (30-50) 160 0 120 200 120 200
Euglenophyta Eutreptia/Eutreptiella (50-80) 120 0 40 0 120 0

18
Chlorophyta Prasinophyta (2-5) 36211 32919 72423 72423 79007 49379
Chlorophyta Pyramimonas (5-10) 39503 29627 85590 59255 52671 105342
Chlorophyta Pyramimonas (10-15) 3292 0 0 6584 0 13168
Chlorophyta
Pterosperma sp. (20)
(phycoma stage) 463 0 0 0 0 0
Haptophyta
cf Haptolina sp 1 (10-15)
(similar to Chrysocromulina
mantoniae) 26336 0 0 0 0 0
Haptophyta
cf Haptolina sp 2 (5-10) similar
to Chrysocromulina hirta) 52671 39503 52671 65839 52671 46087
Crysophyta Dinobryon 0 0 0 0 29627 0
Crysophyta Dinobryon faculiferum 16460 9876 42795 39503 0 13168
Crysophyta Apedinella sp. 0 3292 3292 6584 6584 6584
Crysophyta cf Calycomonas (5) 0 36211 0 0 0 0
Crysophyta cf Crisophyta (5-10) 0 0 0 0 13168 13168
Zoomastigophora Choanoflagellida 0 3292 0 6584 13168 13168
Zoomastigophora Ebria tripartita 520 2200 1040 1560 1520 1240
Cyanophyta
Nostocales (trichome 300-
500) 0 0 40 0 0 0
Cyanophyta
Trichome Nostocales spiral
(>2000) 0 0 40 0 0 0
Cyanophyta
Aphanizomenon (trichomes
50-100) 240 320 1200 360 0 160
Cyanophyta
Aphanizomenon (trichomes
100-200) 560 360 920 80 0 40
Cyanophyta
Aphanizomenon (trichomes
200-300) 320 1160 240 80 0
Cyanophyta
Aphanizomenon (trichomes
300-500) 80 200 1200 480 0 0
Cyanophyta
Aphanizomenon (trichomes
500-700) 0 0 600 0 0 0
Cyanophyta
cf Dolychospermum (trichome
>1000µm) 0 40 0 0 0 0
Cyanophyta Nodularia (trichomes 50-100) 0 40 0 0 0 80
Cyanophyta Nodularia (trichomes 100-200) 40 0 0 0 0 120
Cyanophyta Nodularia (trichomes 200-300) 0 40 0 0 0 0
Cyanophyta Nodularia (trichomes 300-500) 40 0 80 0 120 40
Cyanophyta Nodularia (trichomes 500-700) 0 0 0 40 0 0
Cyanophyta
Nodularia (trichomes 1000-
2000) 0 0 0 0 40 40
Cyanophyta Merismopedia (colony) 0 0 0 0 463 0
Cyanophyta cf Microcystis (colony 30-50) 120 0 80 40 40
Cyanophyta cf Microcystis (colony 50-100) 40 0 160 0 0
Cilliates Mesodinium rubrum 4165 463 80 600 2520 2314
Cilliates Non classified ciliate (10-20) 29627 13168 0 26336 6584 3292
Cilliates Non classified ciliate (20-30) 10644 11107 6479 12033 13421 9719
Cilliates Non classified ciliate (30-50) 360 5720 3960 4600 9640 8600
Cilliates Non classified ciliate (50-100) 720 320 440 840 760 1000
Cilliates Oligotrichid (30-50) 2080 0 0 0 0 0
Cilliates Balanion 0 0 6584 3292 3292 19752
Cilliates cf Laboea strobila 0 0 0 40 0 0
19
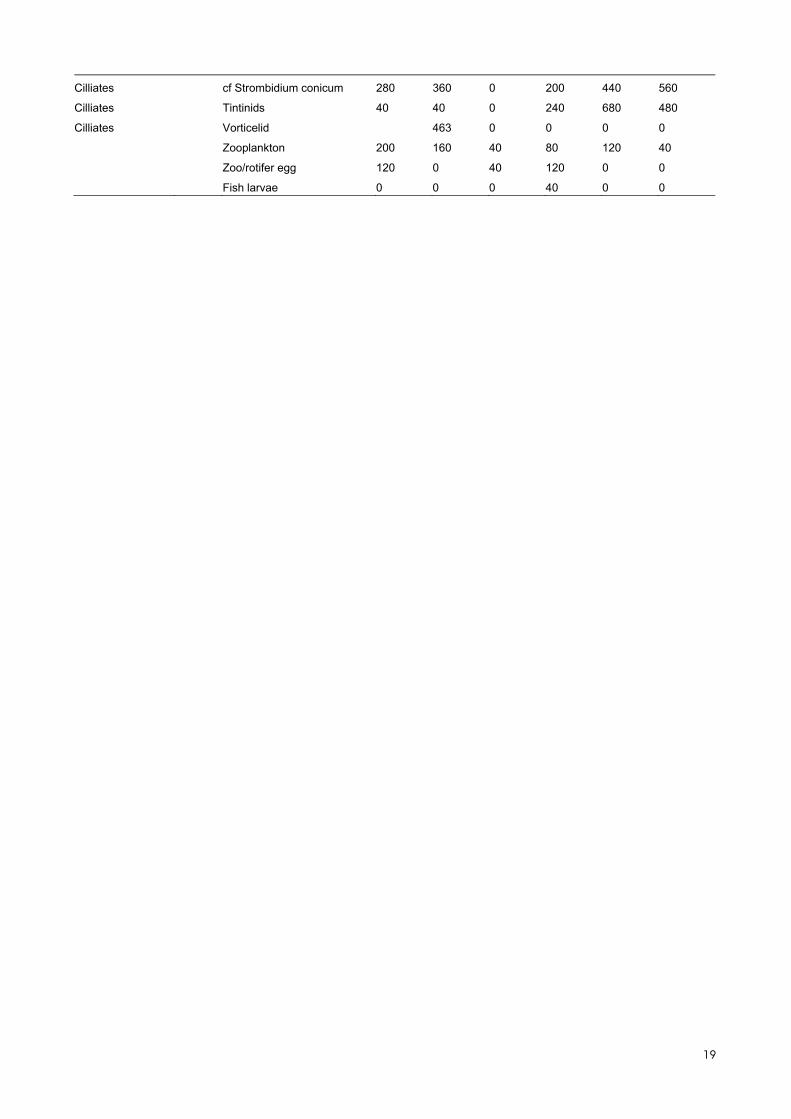
Cilliates cf Strombidium conicum 280 360 0 200 440 560
Cilliates Tintinids 40 40 0 240 680 480
Cilliates Vorticelid 463 0 0 0 0
Zooplankton 200 160 40 80 120 40
Zoo/rotifer egg 120 0 40 120 0 0
Fish larvae 0 0 0 40 0 0

20
Table S3. Results from the eDNA quantification. Data represent number of reads. The list shows the 100 most dominant opera-
tional taxonomic units.
tax1 tax2 tax3 S_1 S_2 S_3 S_4 S_5 S_6
SAR Alveolata 2136 4191 6652 11378 5667 4777
Opisthokonta Holozoa Metazoa (Animalia) 727 1230 1373 362 1877 5596
Opisthokonta Holozoa Metazoa (Animalia) 8649 73 251 79 1046 227
SAR Alveolata Dinoflagellata 831 761 1717 1512 1406 1839
SAR Alveolata Protalveolata 357 740 1380 1759 1260 1741
SAR Alveolata Dinoflagellata 155 674 591 1730 470 1381
SAR Alveolata Dinoflagellata 1478 456 224 773 724 1104
SAR Alveolata Dinoflagellata 235 239 187 1241 872 1790
Archaeplastida Chloroplastida Chlorophyta 257 469 801 1025 708 1068
Archaeplastida Chloroplastida Chlorophyta 216 441 633 497 522 635
SAR Alveolata Ciliophora 96 83 210 204 453 1243
144 244 187 381 290 488
SAR Alveolata 140 153 350 360 282 377
SAR Alveolata 122 119 281 349 182 199
SAR Alveolata Protalveolata 27 191 201 472 140 159
SAR Alveolata Dinoflagellata 68 82 302 288 182 218
Archaeplastida Chloroplastida Chlorophyta 46 104 205 257 194 316
70 152 235 147 202 286
SAR Alveolata 97 132 261 168 172 241
SAR Alveolata Dinoflagellata 120 73 150 335 164 215
Cryptophyceae Cryptomonadales 84 122 258 152 204 234
SAR Alveolata Dinoflagellata 87 109 163 229 183 195
SAR Alveolata 124 58 219 113 181 241
Opisthokonta Nucletmycea Fungi 95 155 205 217 135 125
Archaeplastida Chloroplastida Chlorophyta 56 137 187 140 188 220
SAR Alveolata 69 77 245 163 141 218
SAR Stramenopiles Ochrophyta 151 86 74 184 157 129
Archaeplastida Chloroplastida Chlorophyta 90 130 85 169 100 147
Cryptophyceae Cryptomonadales 51 77 196 135 106 140
SAR Alveolata Dinoflagellata 38 126 164 132 86 125
SAR Alveolata Ciliophora 41 40 83 87 89 298
Archaeplastida Chloroplastida Chlorophyta 43 89 106 80 129 168
SAR Alveolata Ciliophora 83 34 87 84 98 192
Picozoa 44 52 120 104 88 140
SAR Alveolata 48 77 81 106 106 95
Cryptophyceae Cryptomonadales 27 67 162 67 80 87
Archaeplastida Chloroplastida 45 50 21 162 75 129
SAR Alveolata Protalveolata 36 71 47 133 67 105
SAR Alveolata Ciliophora 16 36 65 59 104 179
SAR Rhizaria Cercozoa 32 35 51 89 89 126
Picozoa Picomonadida 29 54 119 57 72 89
30 19 87 28 67 171
Opisthokonta Holozoa Metazoa (Animalia) 25 11 1 0 141 207
SAR Alveolata Dinoflagellata 13 32 56 113 57 110
SAR Alveolata Dinoflagellata 48 33 90 40 76 80

21
SAR Alveolata Ciliophora 35 24 38 49 88 101
SAR Alveolata Ciliophora 22 23 52 17 97 124
SAR Alveolata Ciliophora 28 34 57 45 74 94
SAR Alveolata Dinoflagellata 70 33 67 40 48 67
SAR Alveolata Dinoflagellata 21 52 39 104 57 49
Archaeplastida Chloroplastida Chlorophyta 30 63 40 66 44 67
SAR Alveolata 33 20 17 77 60 84
SAR Alveolata Ciliophora 23 17 25 85 45 84
SAR Alveolata Ciliophora 3 40 34 25 48 124
Archaeplastida Chloroplastida Chlorophyta 36 18 80 23 61 51
SAR Alveolata Ciliophora 31 33 34 39 56 71
SAR Alveolata Ciliophora 38 13 43 49 50 67
SAR Rhizaria Cercozoa 20 35 18 72 31 47
30 35 37 53 24 42
SAR Alveolata Dinoflagellata 35 15 55 34 26 54
SAR Alveolata Ciliophora 13 8 10 24 23 136
SAR Stramenopiles Ochrophyta 10 19 21 72 34 49
SAR Stramenopiles Ochrophyta 8 13 22 32 55 70
SAR Alveolata Ciliophora 20 13 66 21 39 40
Opisthokonta Nucletmycea Fungi 22 25 35 46 30 39
Incertae Sedis Telonema 21 17 37 39 29 53
SAR Stramenopiles Ochrophyta 38 12 25 17 45 40
6 22 23 20 29 54
SAR Stramenopiles MAST-1 3 12 21 24 27 53
Cryptophyceae Cryptomonadales 8 20 30 27 16 39
7 19 24 18 31 39
SAR Alveolata Ciliophora 6 18 15 23 19 56
Archaeplastida Chloroplastida Chlorophyta 11 15 19 27 27 36
Cryptophyceae Cryptomonadales 8 17 35 16 20 34
14 19 25 28 21 23
Archaeplastida Chloroplastida Chlorophyta 14 8 32 7 39 19
SAR Stramenopiles Incertae Sedis 6 16 24 17 26 27
SAR Alveolata 9 5 8 8 42 42
SAR Stramenopiles Ochrophyta 5 14 25 18 24 23
Archaeplastida Chloroplastida Chlorophyta 11 10 21 17 20 29
7 13 22 26 10 30
Opisthokonta Holozoa Metazoa (Animalia) 1 98 8 0 0 0
SAR Alveolata Ciliophora 3 4 28 6 28 34
3 10 21 31 18 15
10 6 19 13 23 25
SAR Stramenopiles Ochrophyta 8 9 15 18 13 27
3 6 21 14 15 29
SAR Alveolata 1 13 21 25 18 10
SAR Stramenopiles Ochrophyta 11 8 17 8 23 19
SAR Rhizaria Cercozoa 17 6 14 16 9 22
Archaeplastida Chloroplastida Chlorophyta 6 15 19 12 9 20
SAR Rhizaria Cercozoa 12 8 9 10 15 26
SAR Alveolata Dinoflagellata 5 6 17 21 13 16

22
SAR Alveolata Ciliophora 4 6 14 7 24 23
13 7 10 20 11 17
SAR Rhizaria Cercozoa 7 5 14 6 15 31
15 2 13 4 21 21
SAR Alveolata Protalveolata 12 9 11 19 6 16
SAR Alveolata 4 2 10 24 13 20